-
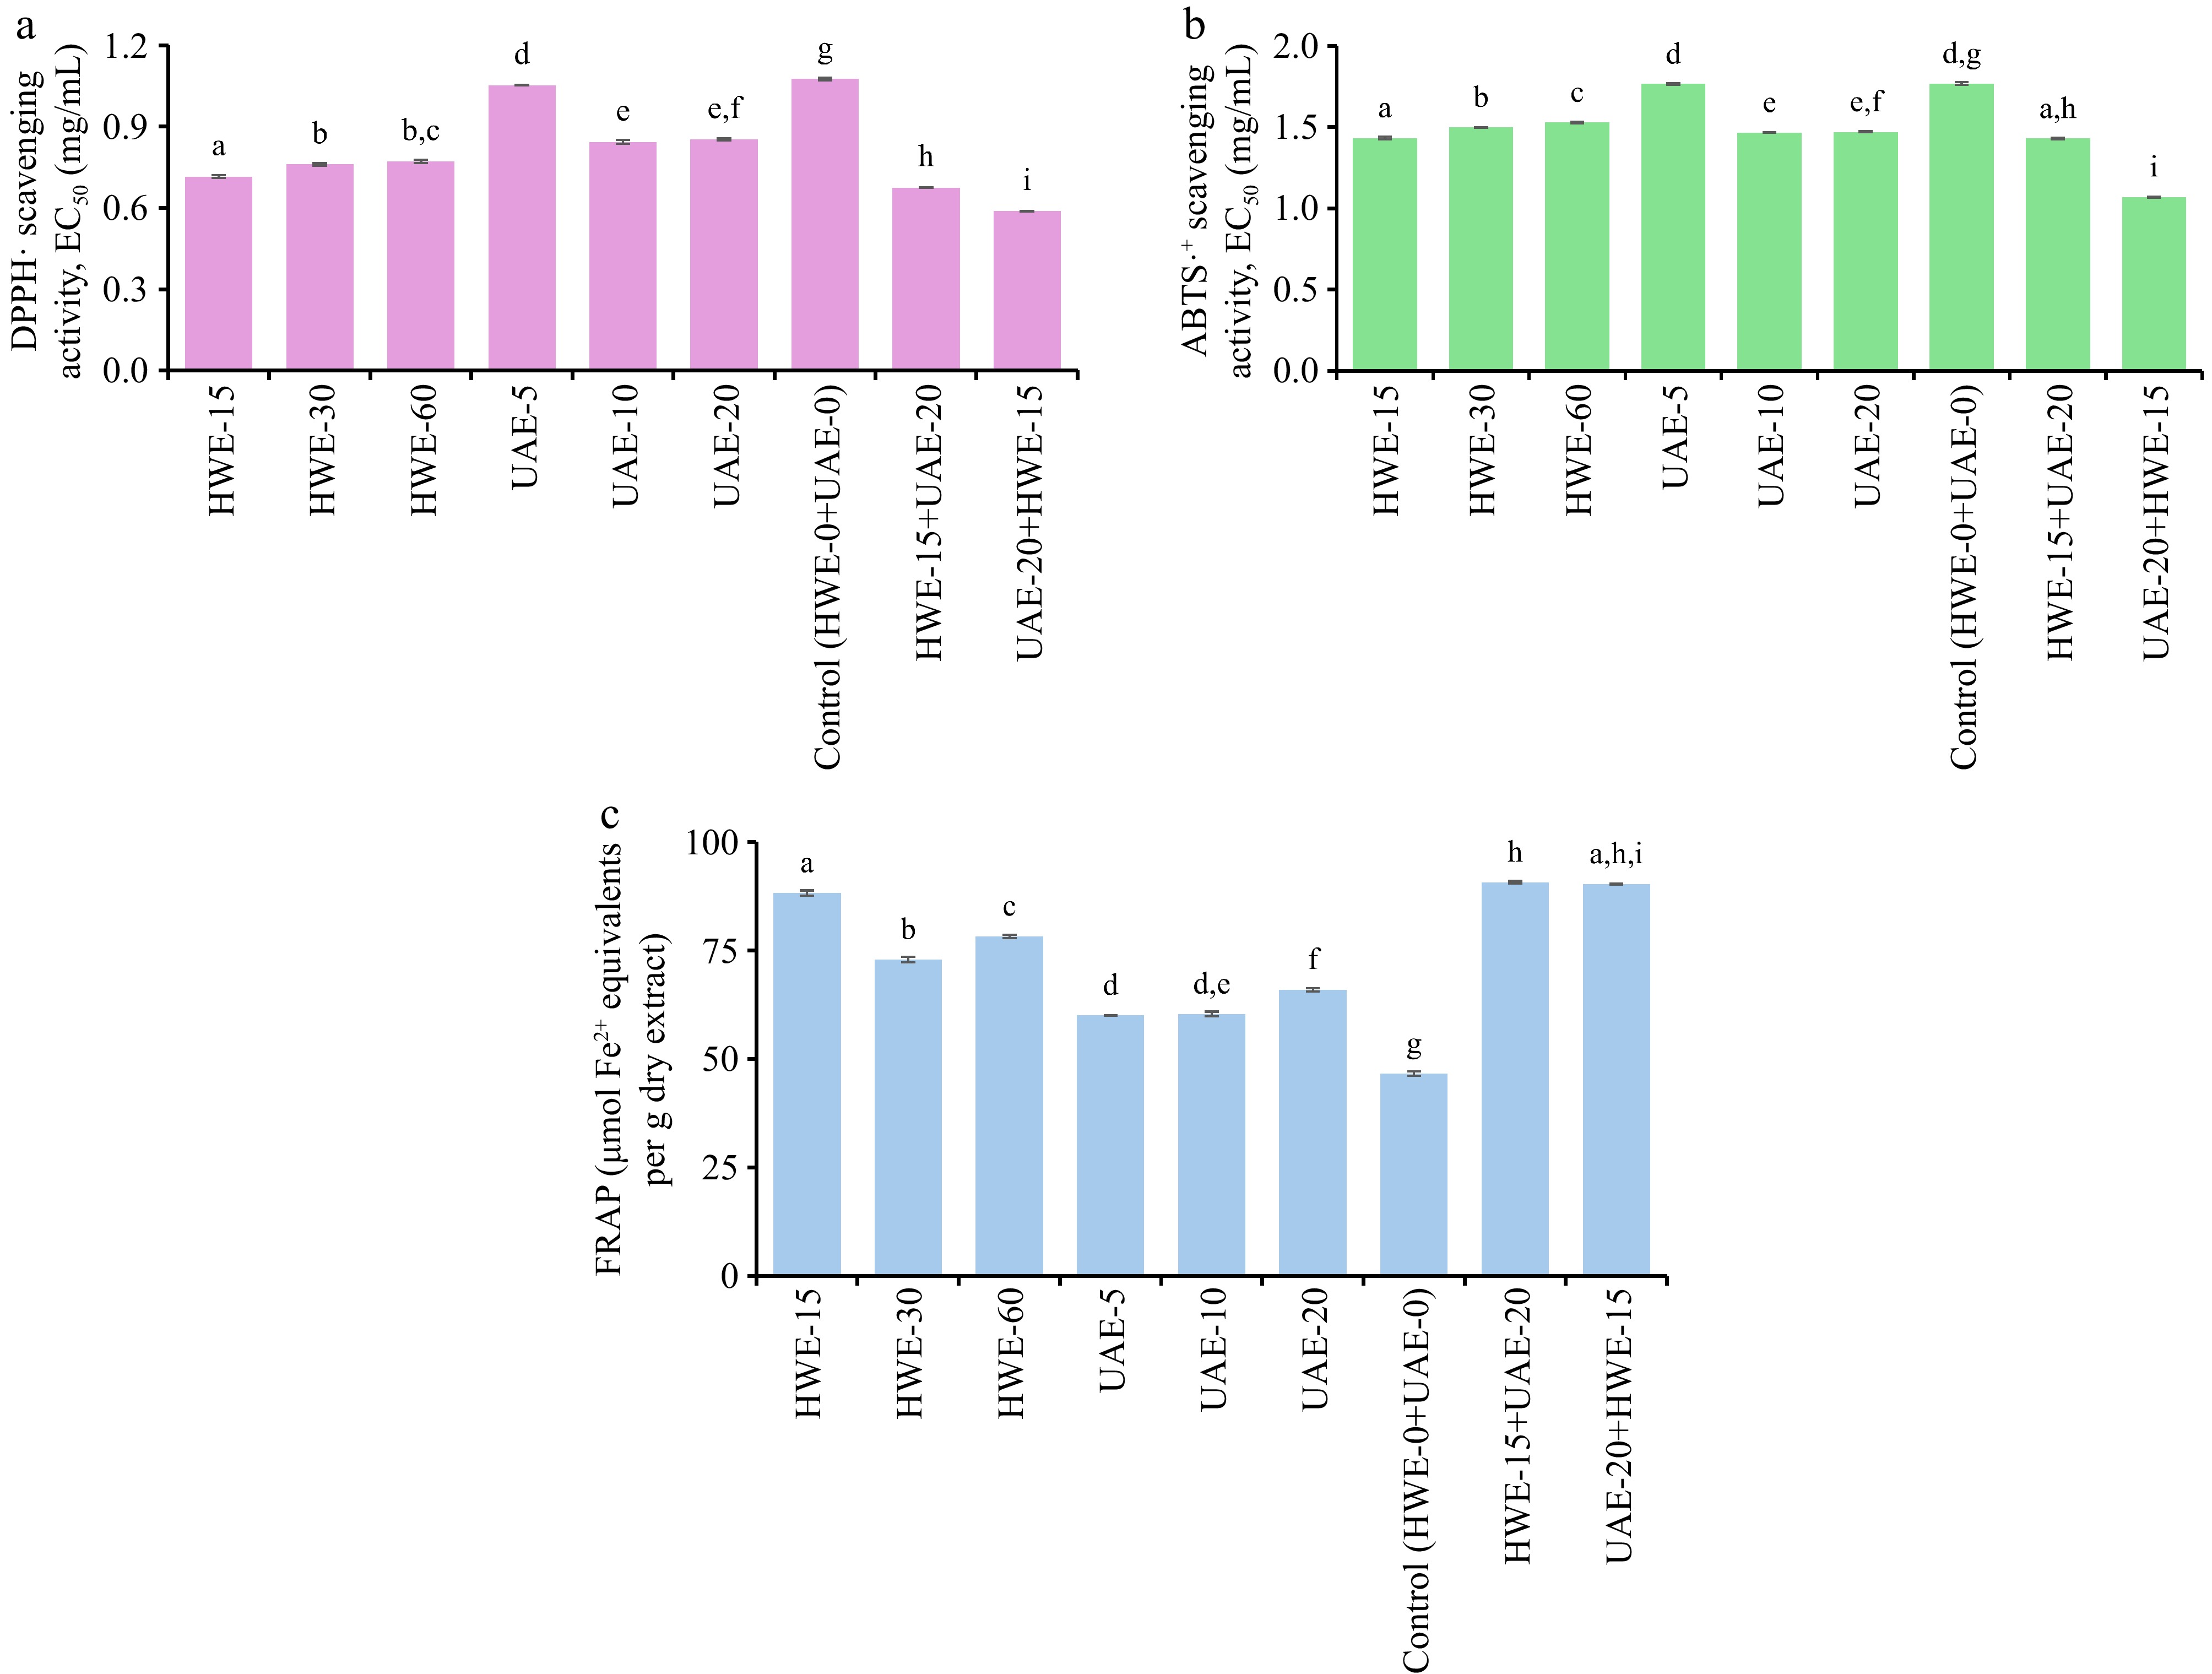
Figure 1.
Antioxidant activities of extracts obtained by different extraction treatments. (a) DPPH• scavenging activity (EC50 values). (b) ABTS•+ scavenging activity (EC50 values). (c) Ferric reducing antioxidant power (FRAP) values. Each bar represents mean ± standard error (n = 3). Values with different lowercase letters differ significantly (p < 0.05), as determined by Tukey's HSD multiple comparison test. Extract abbreviations are as defined in Table 1.
-
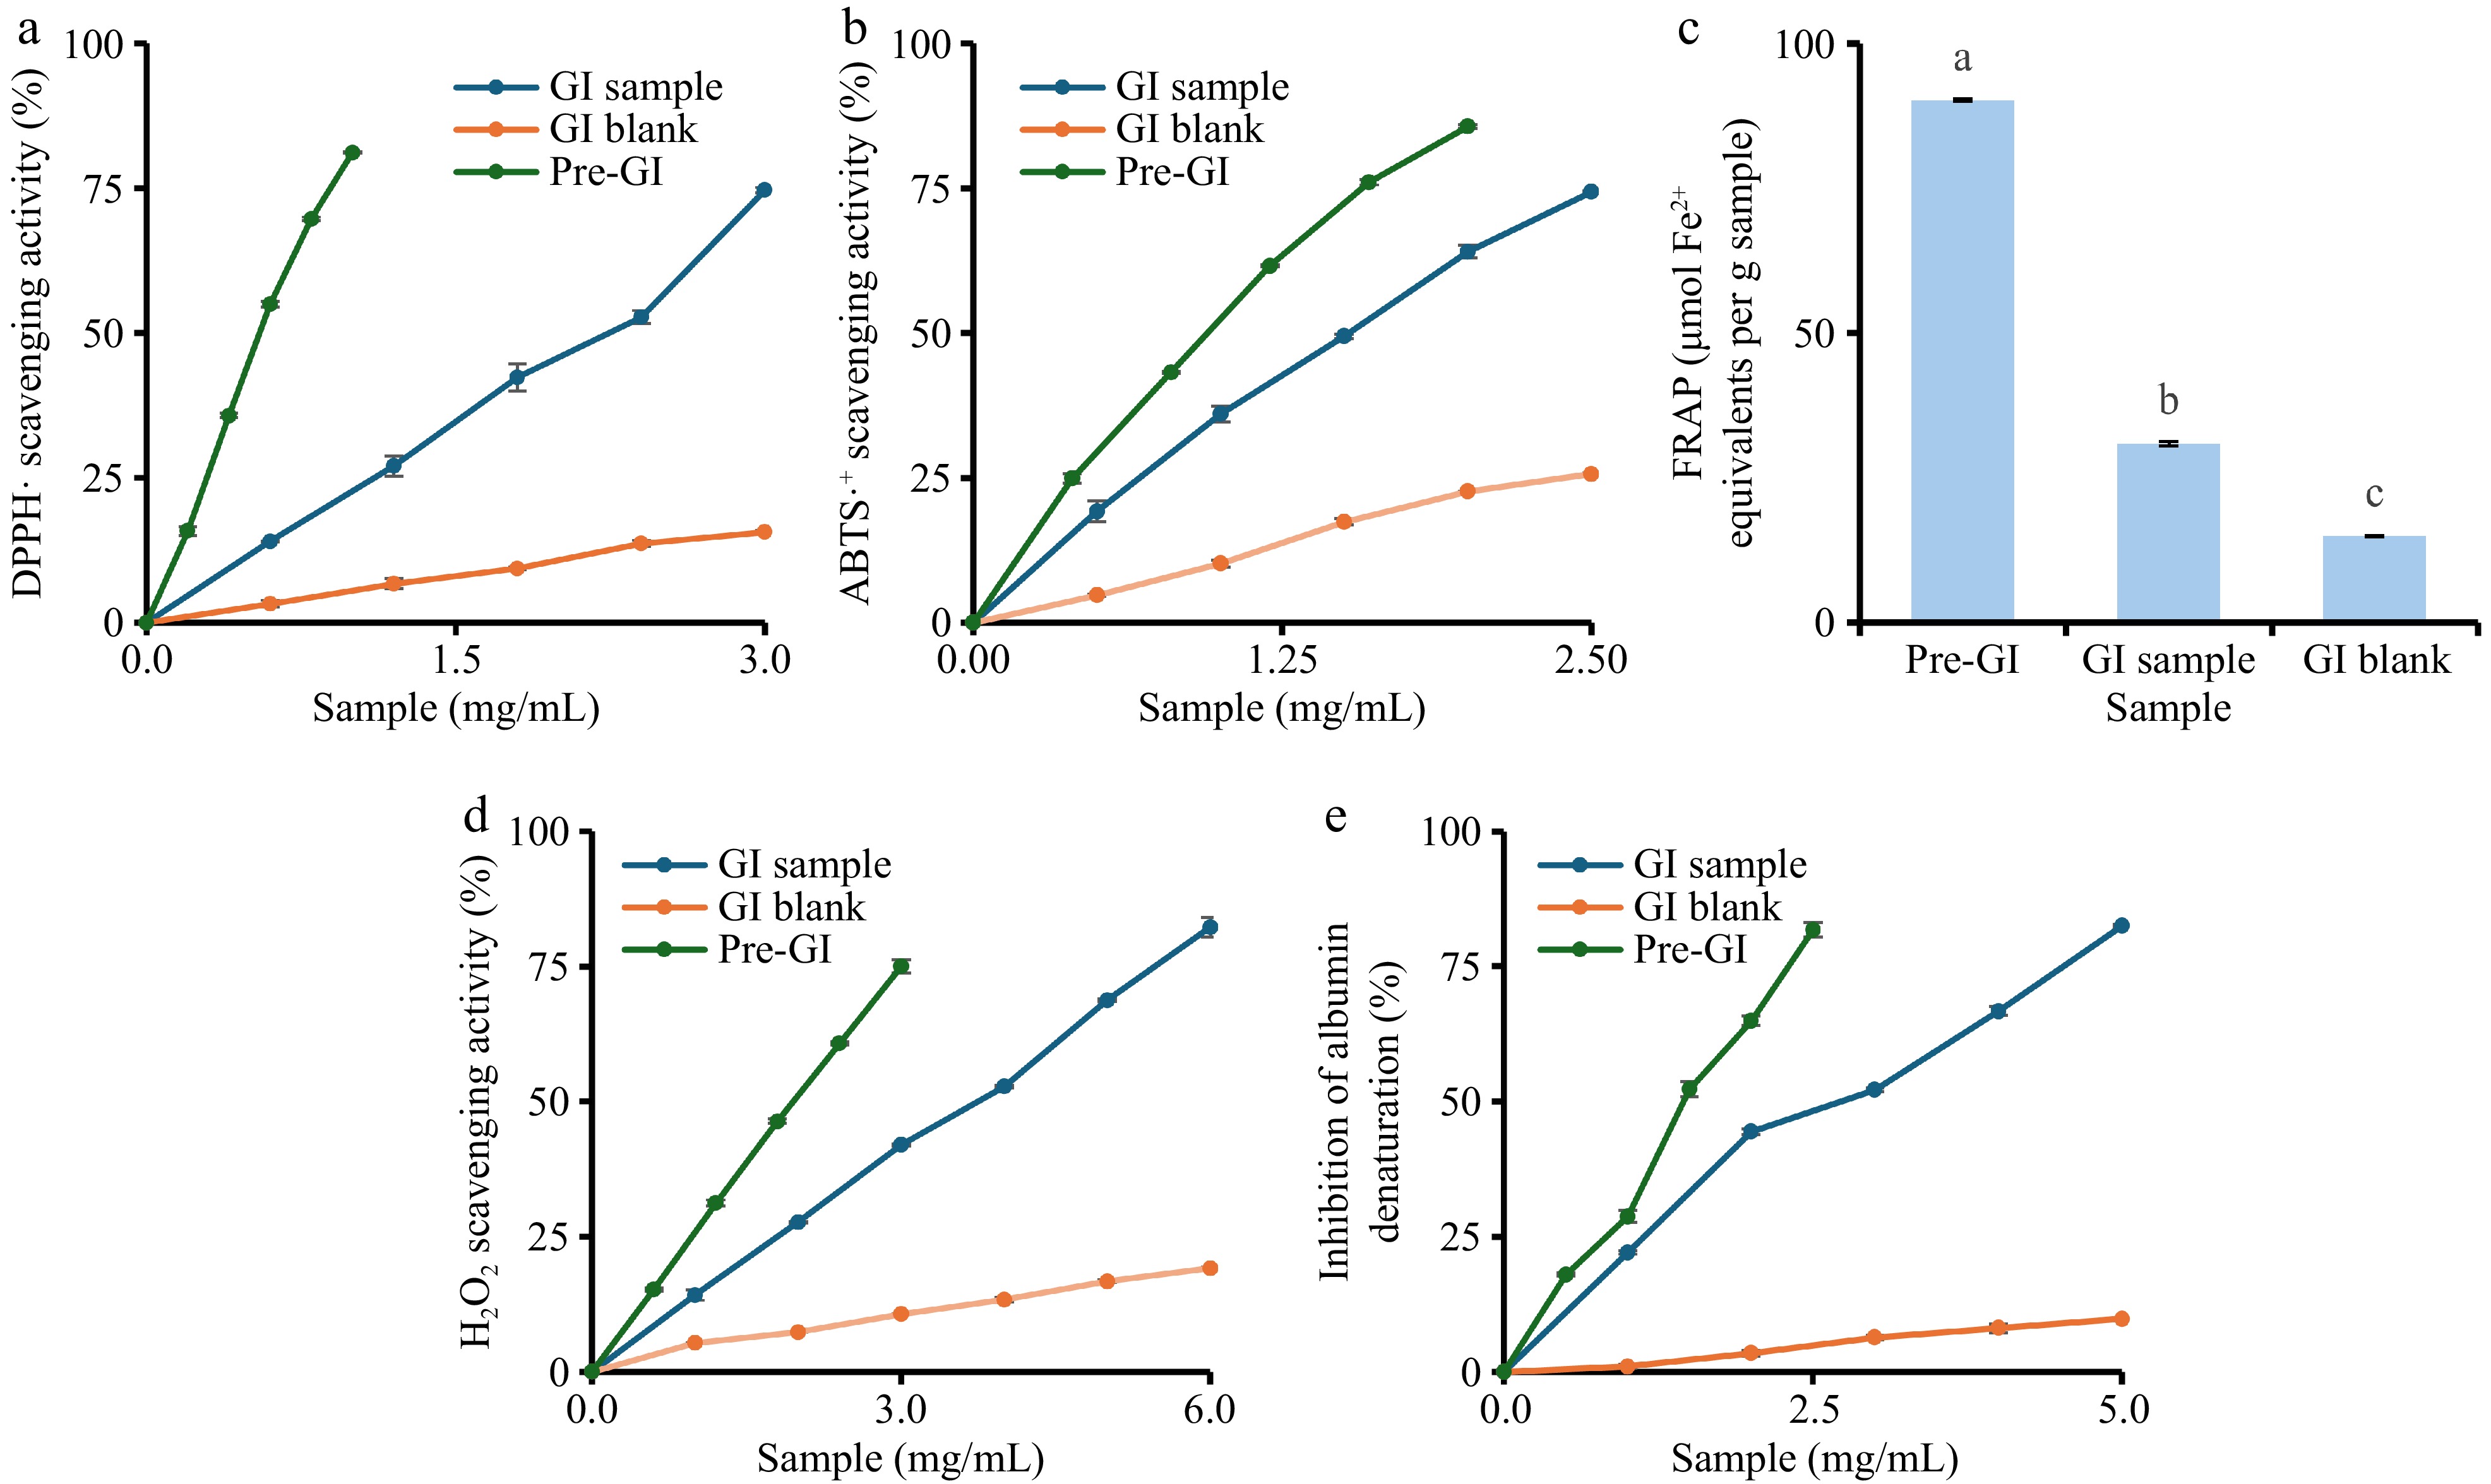
Figure 2.
Effects of simulated GI digestion on antioxidant activities and inhibition of albumin denaturation of UAE-20 + HWE-15 extract. (a) DPPH• scavenging activity. (b) ABTS•+ scavenging activity. (c) Ferric reducing antioxidant power (FRAP) values. (d) H2O2 scavenging activity. (e) Inhibition of albumin denaturation. Data are presented as mean ± standard error (n = 3). For (c), values with different lowercase letters differ significantly (p < 0.05), as determined by Tukey's HSD multiple comparison test. Sample abbreviations are as defined in Table 3.
-
Extract TPC (mg GAE/g
dry extract)TFC (mg QE/g
dry extract)TAC (μg CGE/g
dry extract)HWE-15 7.08 ± 0.01a 63.78 ± 0.97a 13.92 ± 2.78a HWE-30 6.78 ± 0.01b 50.00 ± 0.19b n.d. HWE-60 6.25 ± 0.01c 46.22 ± 0.99c n.d. UAE-5 6.31 ± 0.00d 33.33 ± 0.51d 55.66 ± 2.78b UAE-10 6.33 ± 0.01d,e 35.22 ± 0.48d,e 36.18 ± 5.57c UAE-20 6.48 ± 0.01f 43.44 ± 0.29c,f 36.18 ± 2.78c,d Control (HWE-0 + UAE-0) 6.11 ± 0.01g 23.89 ± 0.59g n.d. HWE-15 + UAE-20 7.20 ± 0.01h 59.00 ± 0.39h 33.40 ± 0.00c,d,e UAE-20 + HWE-15 8.11 ± 0.01i 62.56 ± 0.29a,i 16.70 ± 0.00a,f HWE, hot water extraction; UAE, ultrasound-assisted extraction; HWE-x and UAE-x denote extraction treatments where x indicates duration (min); Control (HWE-0 + UAE-0), untreated sample (no heating or sonication); TPC, total phenolic content; TFC, total flavonoid content; TAC, total anthocyanin content; GAE, gallic acid equivalent; QE, quercetin equivalent; CGE, cyanidin-3-glucoside equivalent; n.d., undetectable. Data are presented as mean ± standard error (n = 3). Values with different superscript letters within a column differ significantly (p < 0.05, Tukey's HSD test). Table 1.
Phytochemical contents of extracts obtained by HWE and UAE.
-
Variable DPPH• (1/EC50) (r, p) ABTS•+ (1/EC50) (r, p) FRAP (r, p) TPC 0.8712 (p < 0.05) 0.9035 (p < 0.05) 0.7962 (p < 0.05) TFC 0.9125 (p < 0.05) 0.7231 (p < 0.05) 0.9753 (p < 0.05) TAC −0.2009 (p > 0.05) −0.0977 (p > 0.05) −0.1083 (p > 0.05) r values represent the strength of linear correlation, and p values indicate statistical significance. Table 2.
Pearson correlation coefficients between phytochemical contents and antioxidant activities of T. zebrina extracts.
-
Treatment TPC (mg GAE/g
sample)TFC (mg QE/g
sample)TAC (μg CGE/g
sample)Pre-GI 8.11 ± 0.01a 62.56 ± 0.29a 16.70 ± 0.00a GI sample 3.28 ± 0.01b 6.44 ± 0.22b 11.13 ± 2.78a,b GI blank 1.71 ± 0.01c 3.44 ± 0.59c 0.00 ± 0.00c GI, gastrointestinal; Pre-GI, extract prior to GI digestion; GI sample, extract subjected to GI digestion, followed by SPE; GI blank, digestion control prepared without extract, followed by SPE. Other abbreviations are defined in Table 1. Data are presented as mean ± standard error (n = 3). Values with different superscript letters within a column differ significantly (p < 0.05, Tukey's HSD test). Table 3.
Effects of simulated GI digestion on the phytochemical contents of UAE-20 + HWE-15 extract.
-
Bioactivities EC50 (mg/mL) EC50 (μg/mL) Pre-GI GI sample Positive control DPPH• scavenging activity 0.587 ± 0.000 2.118 ± 0.042 * Quercetin: 4.928 ± 0.034 ABTS•+ scavenging activity 1.069 ± 0.003 1.585 ± 0.001 * Quercetin: 5.550 ± 0.036 H2O2 scavenging activity 1.976 ± 0.005 3.658 ± 0.023 * Gallic acid: 276.119 ± 1.330 NO scavenging activity 6.655 ± 0.001 Not determined Ascorbic acid: 584.154 ± 1.277 Inhibition of albumin denaturation 1.527 ± 0.005 2.918 ± 0.023 * Quercetin: 355.319 ± 0.748 Abbreviations are as defined in Table 3. Data are mean ± standard error (n = 3). Statistical comparisons between pre-GI and GI samples were performed using Welch's t-test on log-transformed EC50 values. Significance is indicated as p < 0.05 (*). Positive controls were included as references for assay validation and were not subjected to statistical comparisons. Table 4.
Effects of simulated GI digestion on the bioactivities of the UAE-20 + HWE-15 extract.
Figures
(2)
Tables
(4)