-
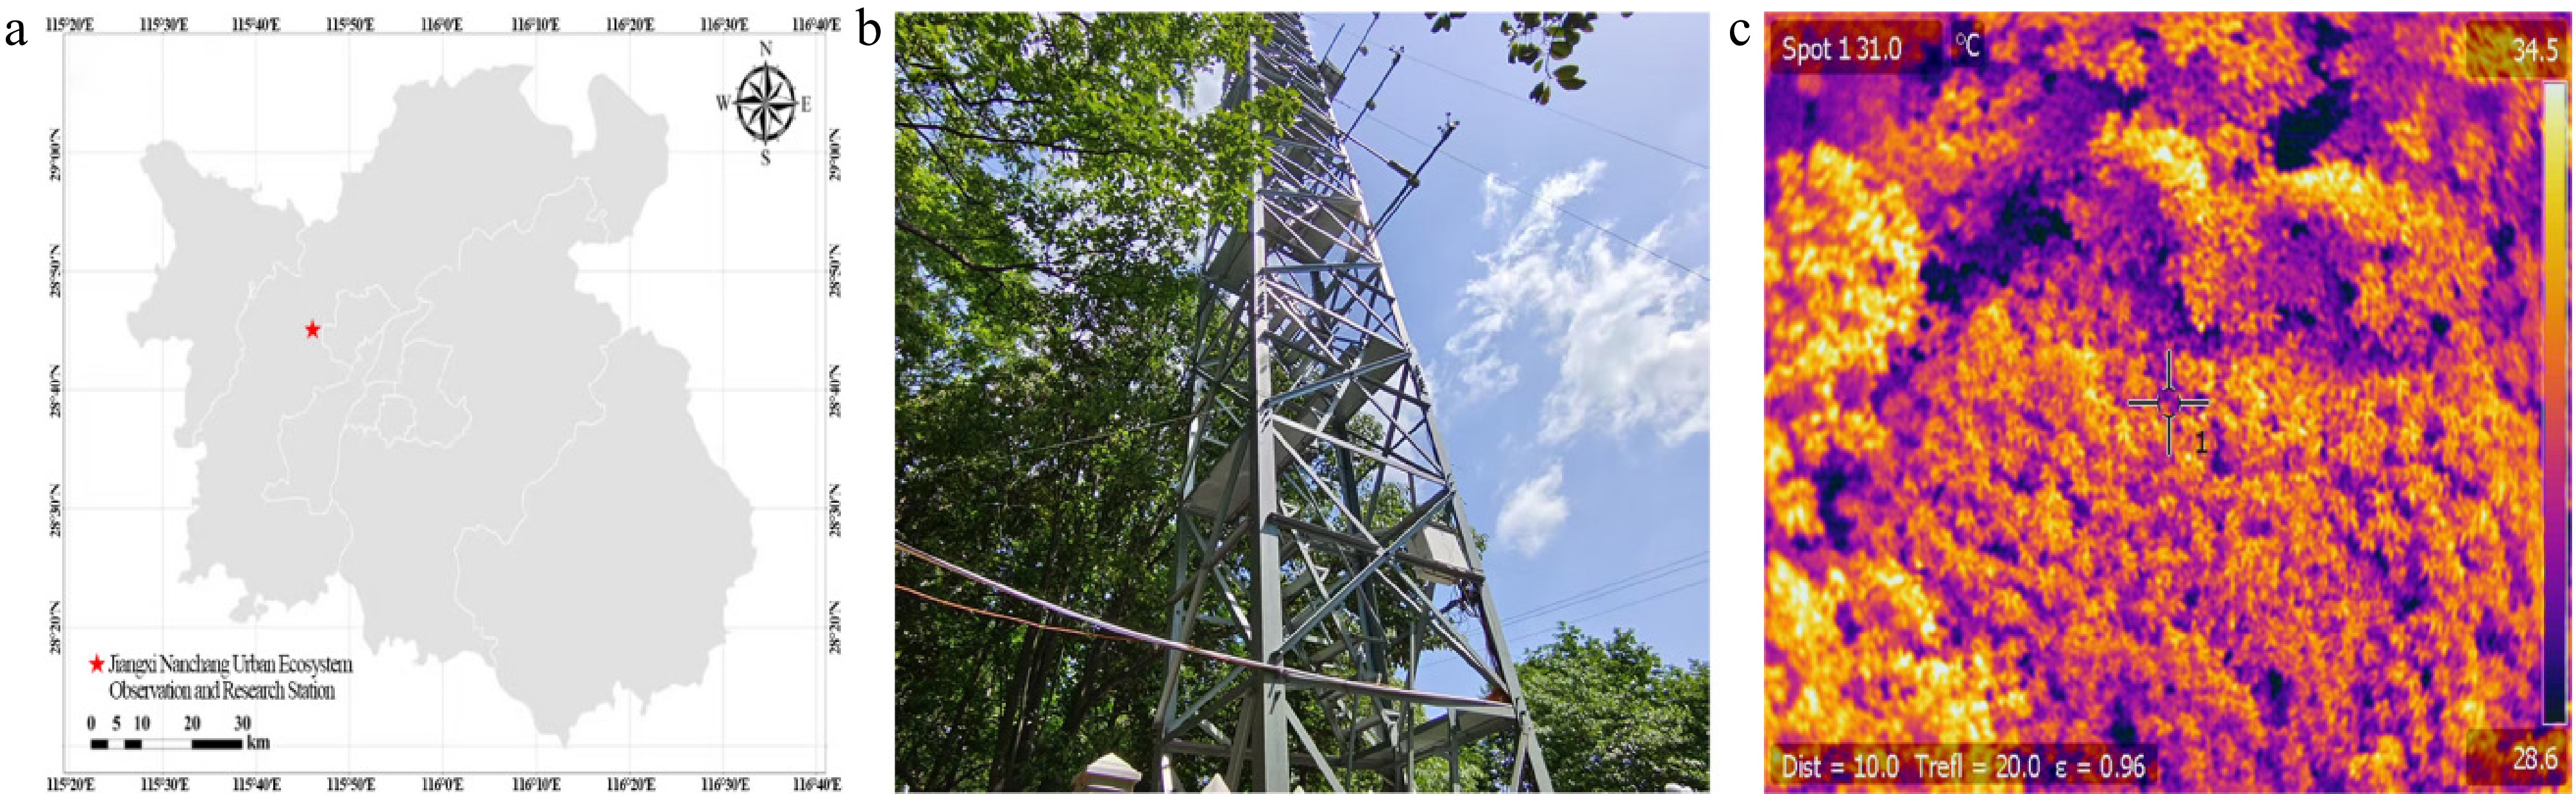
Figure 1.
The location of (a) the research site, (b) the illustration of flux tower, and (c) the thermal infrared imagery collected from the urban forest ecosystem.
-
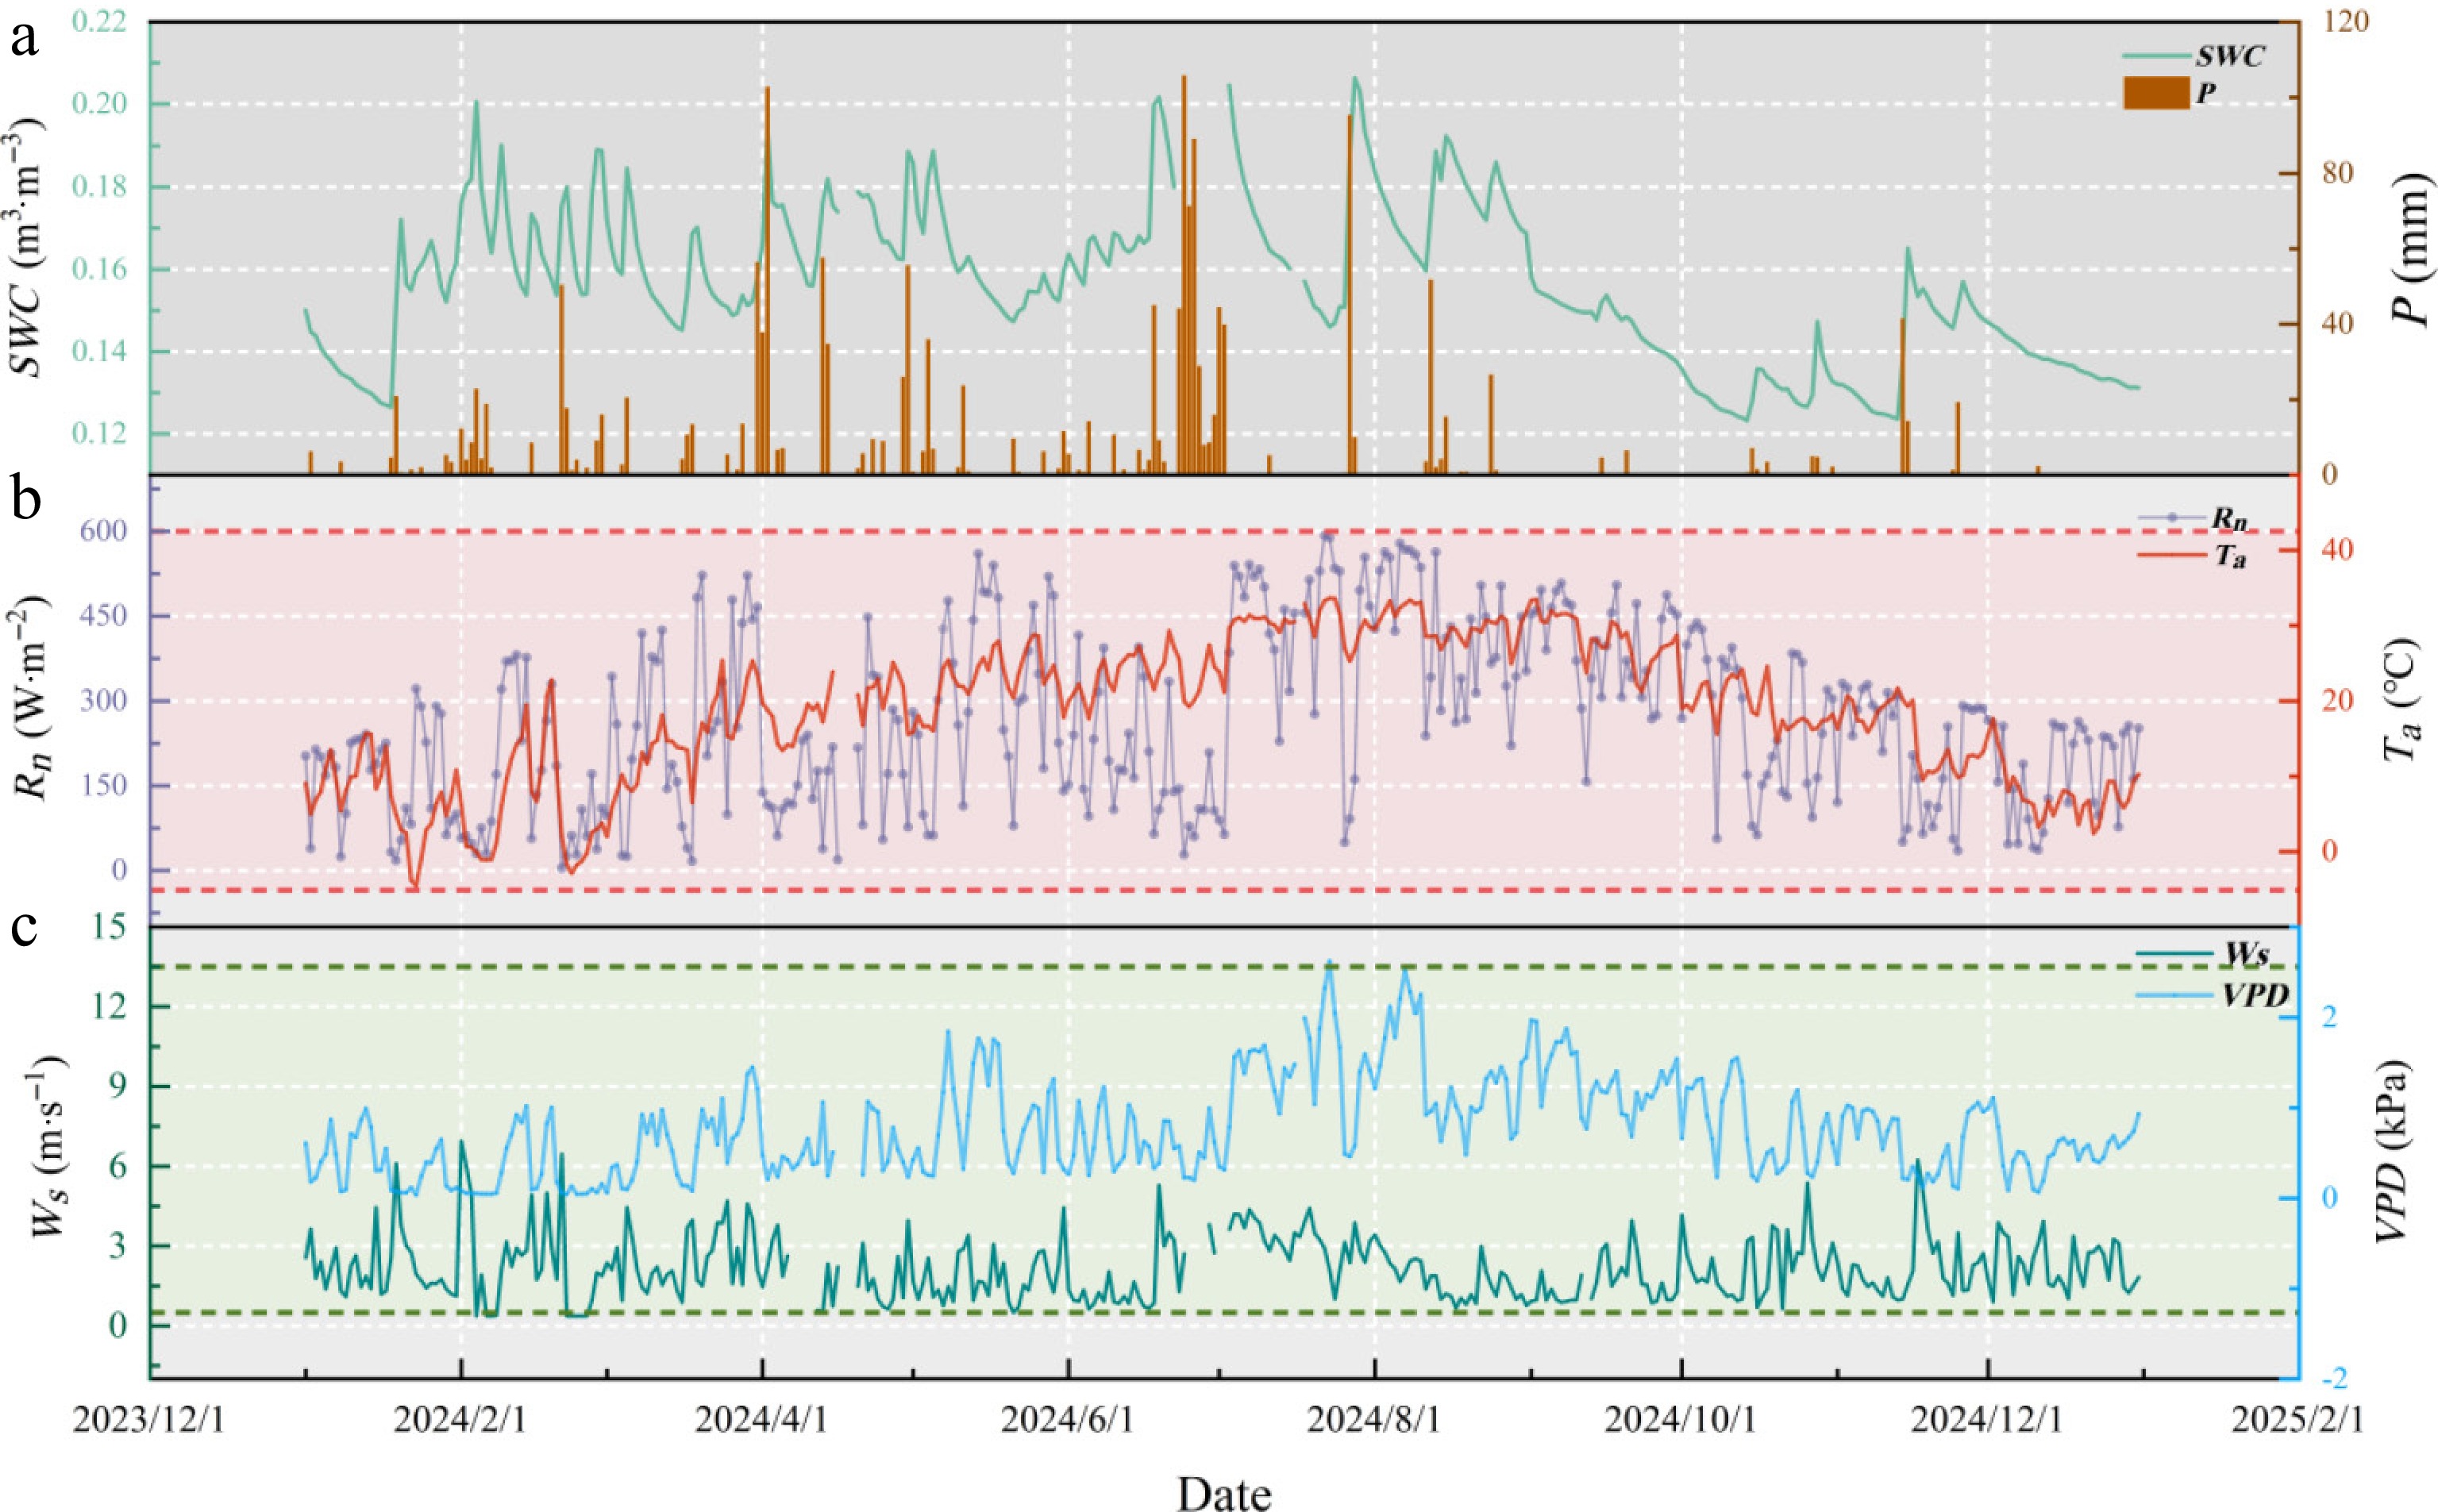
Figure 2.
Seasonal dynamics in (a) soil water content (SWC) and precipitation (P), (b) air temperature (Ta) and net radiation (Rn), (c) wind speed (Ws) and vapor pressure deficit (VPD) in the Nanchang urban forest ecosystem.
-
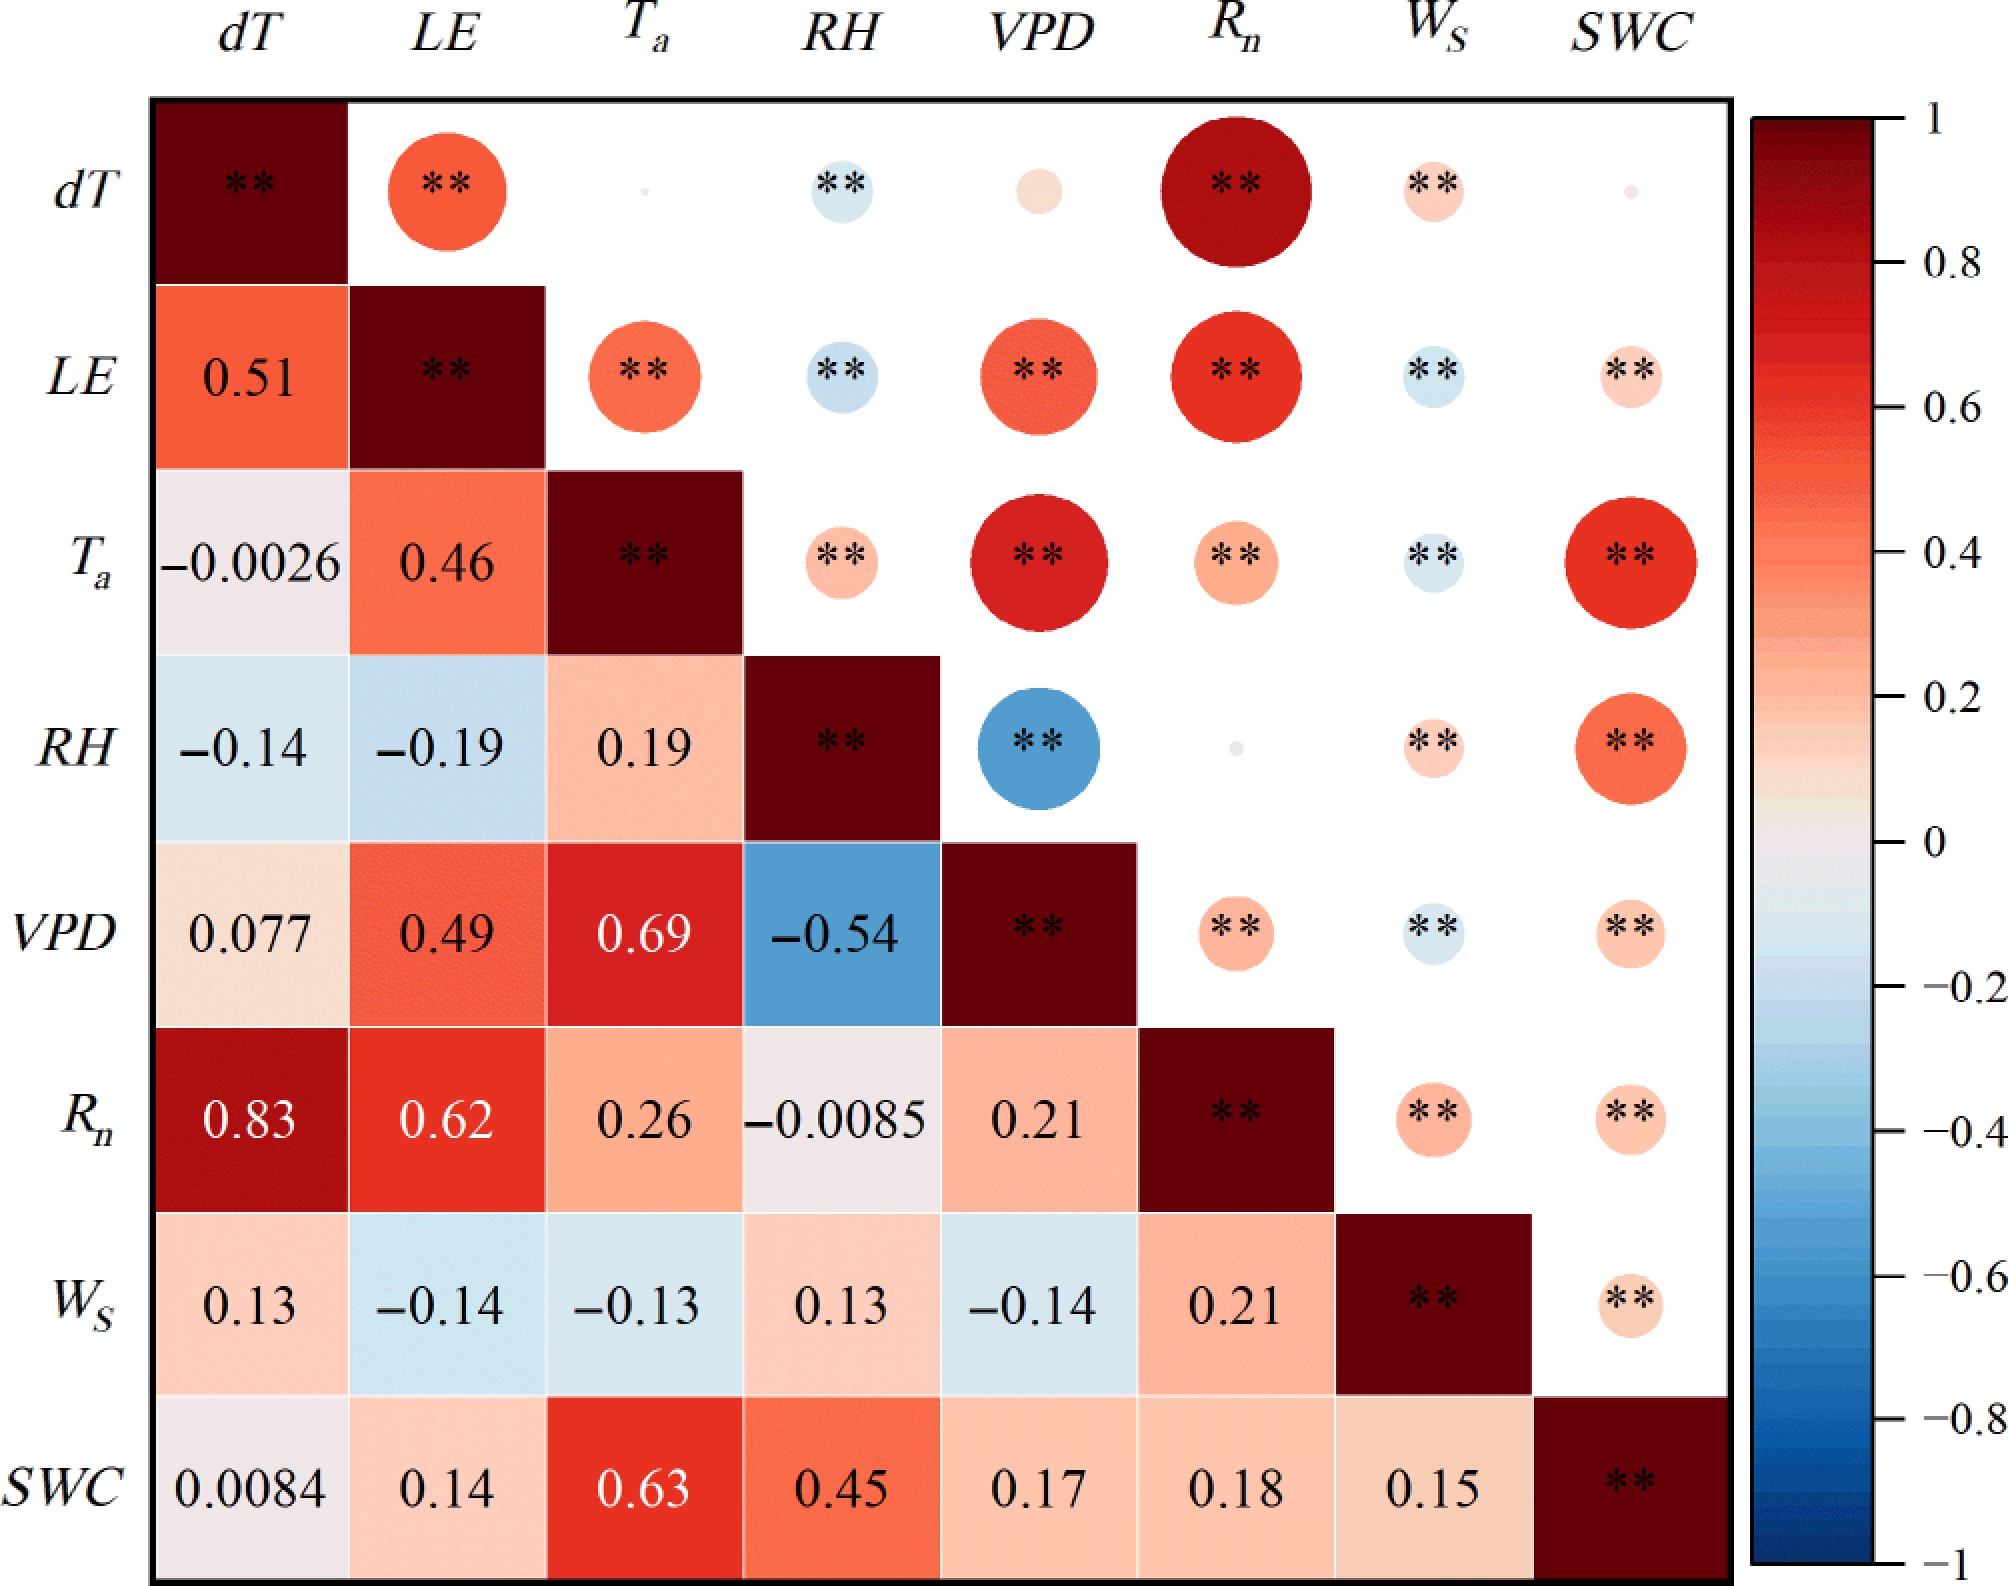
Figure 3.
Pearson's correlation coefficients among the canopy-air temperature difference (dT), latent heat flux (LE), and environmental variables under sunny days in the Nanchang urban forest ecosystem. ** represents p < 0.01; * represents p < 0.05.
-
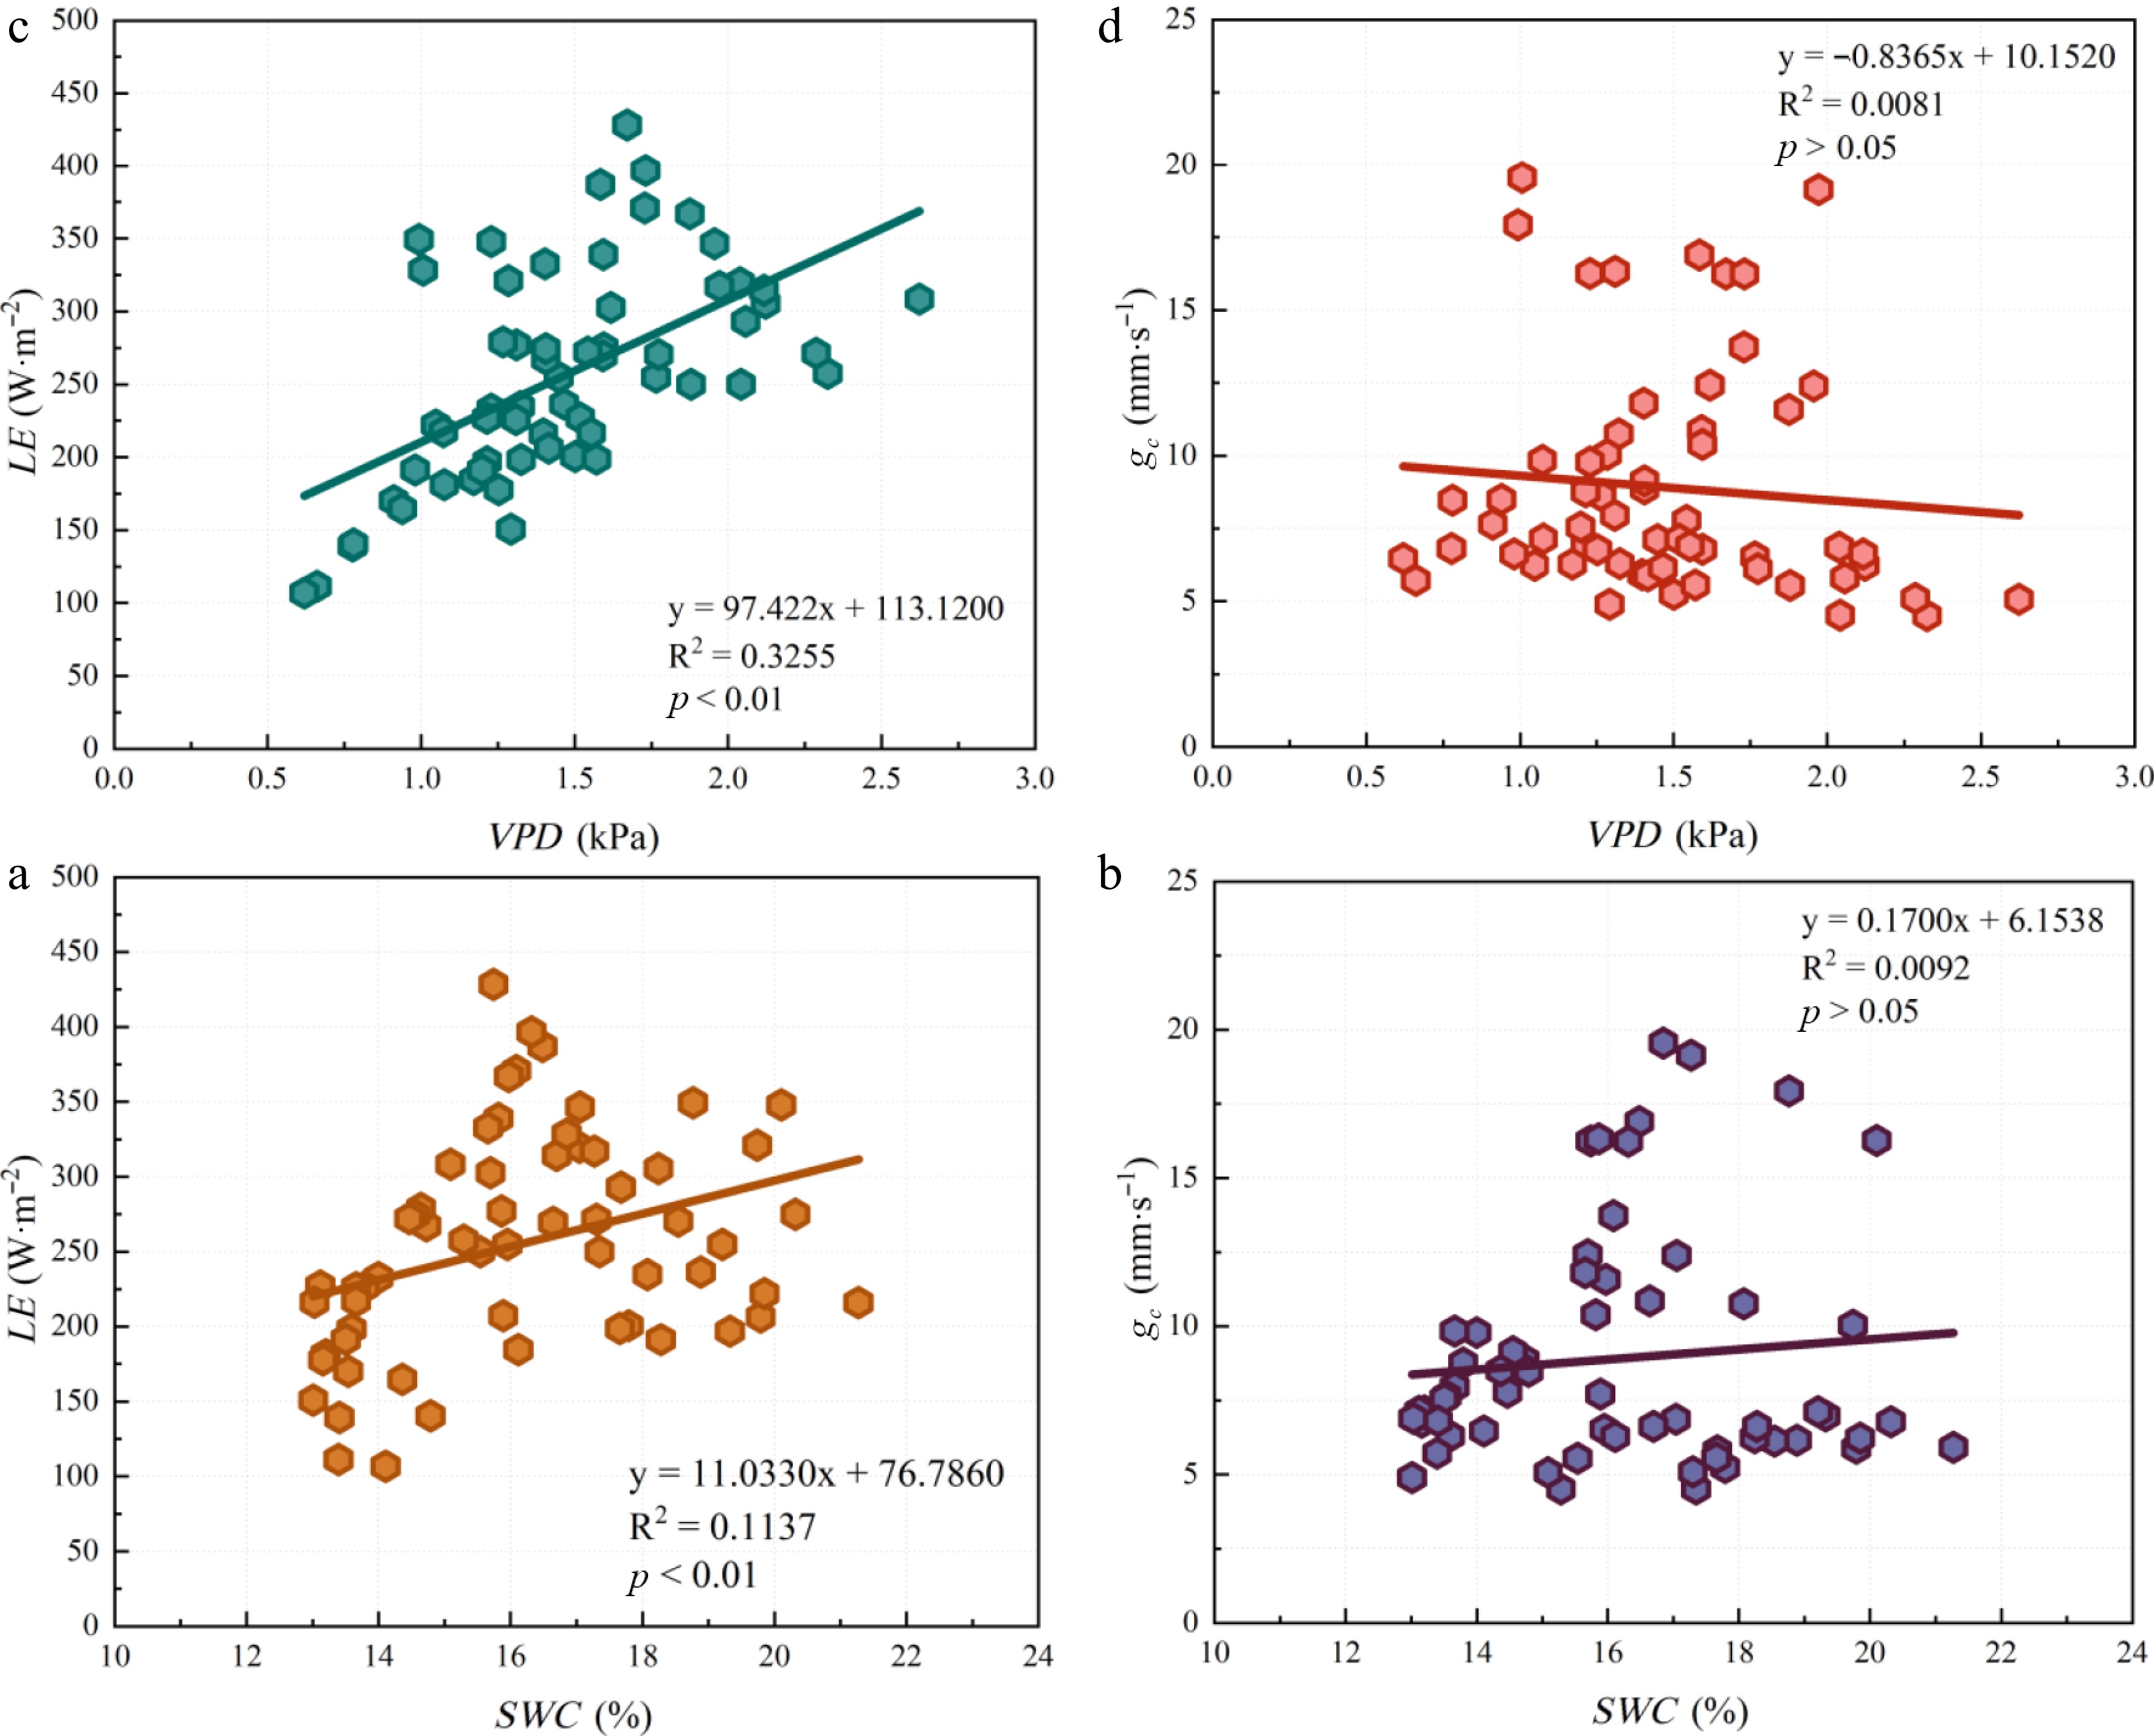
Figure 4.
Relationships among the soil water content (SWC), vapor pressure deficit (VPD), latent heat flux (LE), and canopy conductance (gc). ** represents p < 0.01; * represents p < 0.05.
-
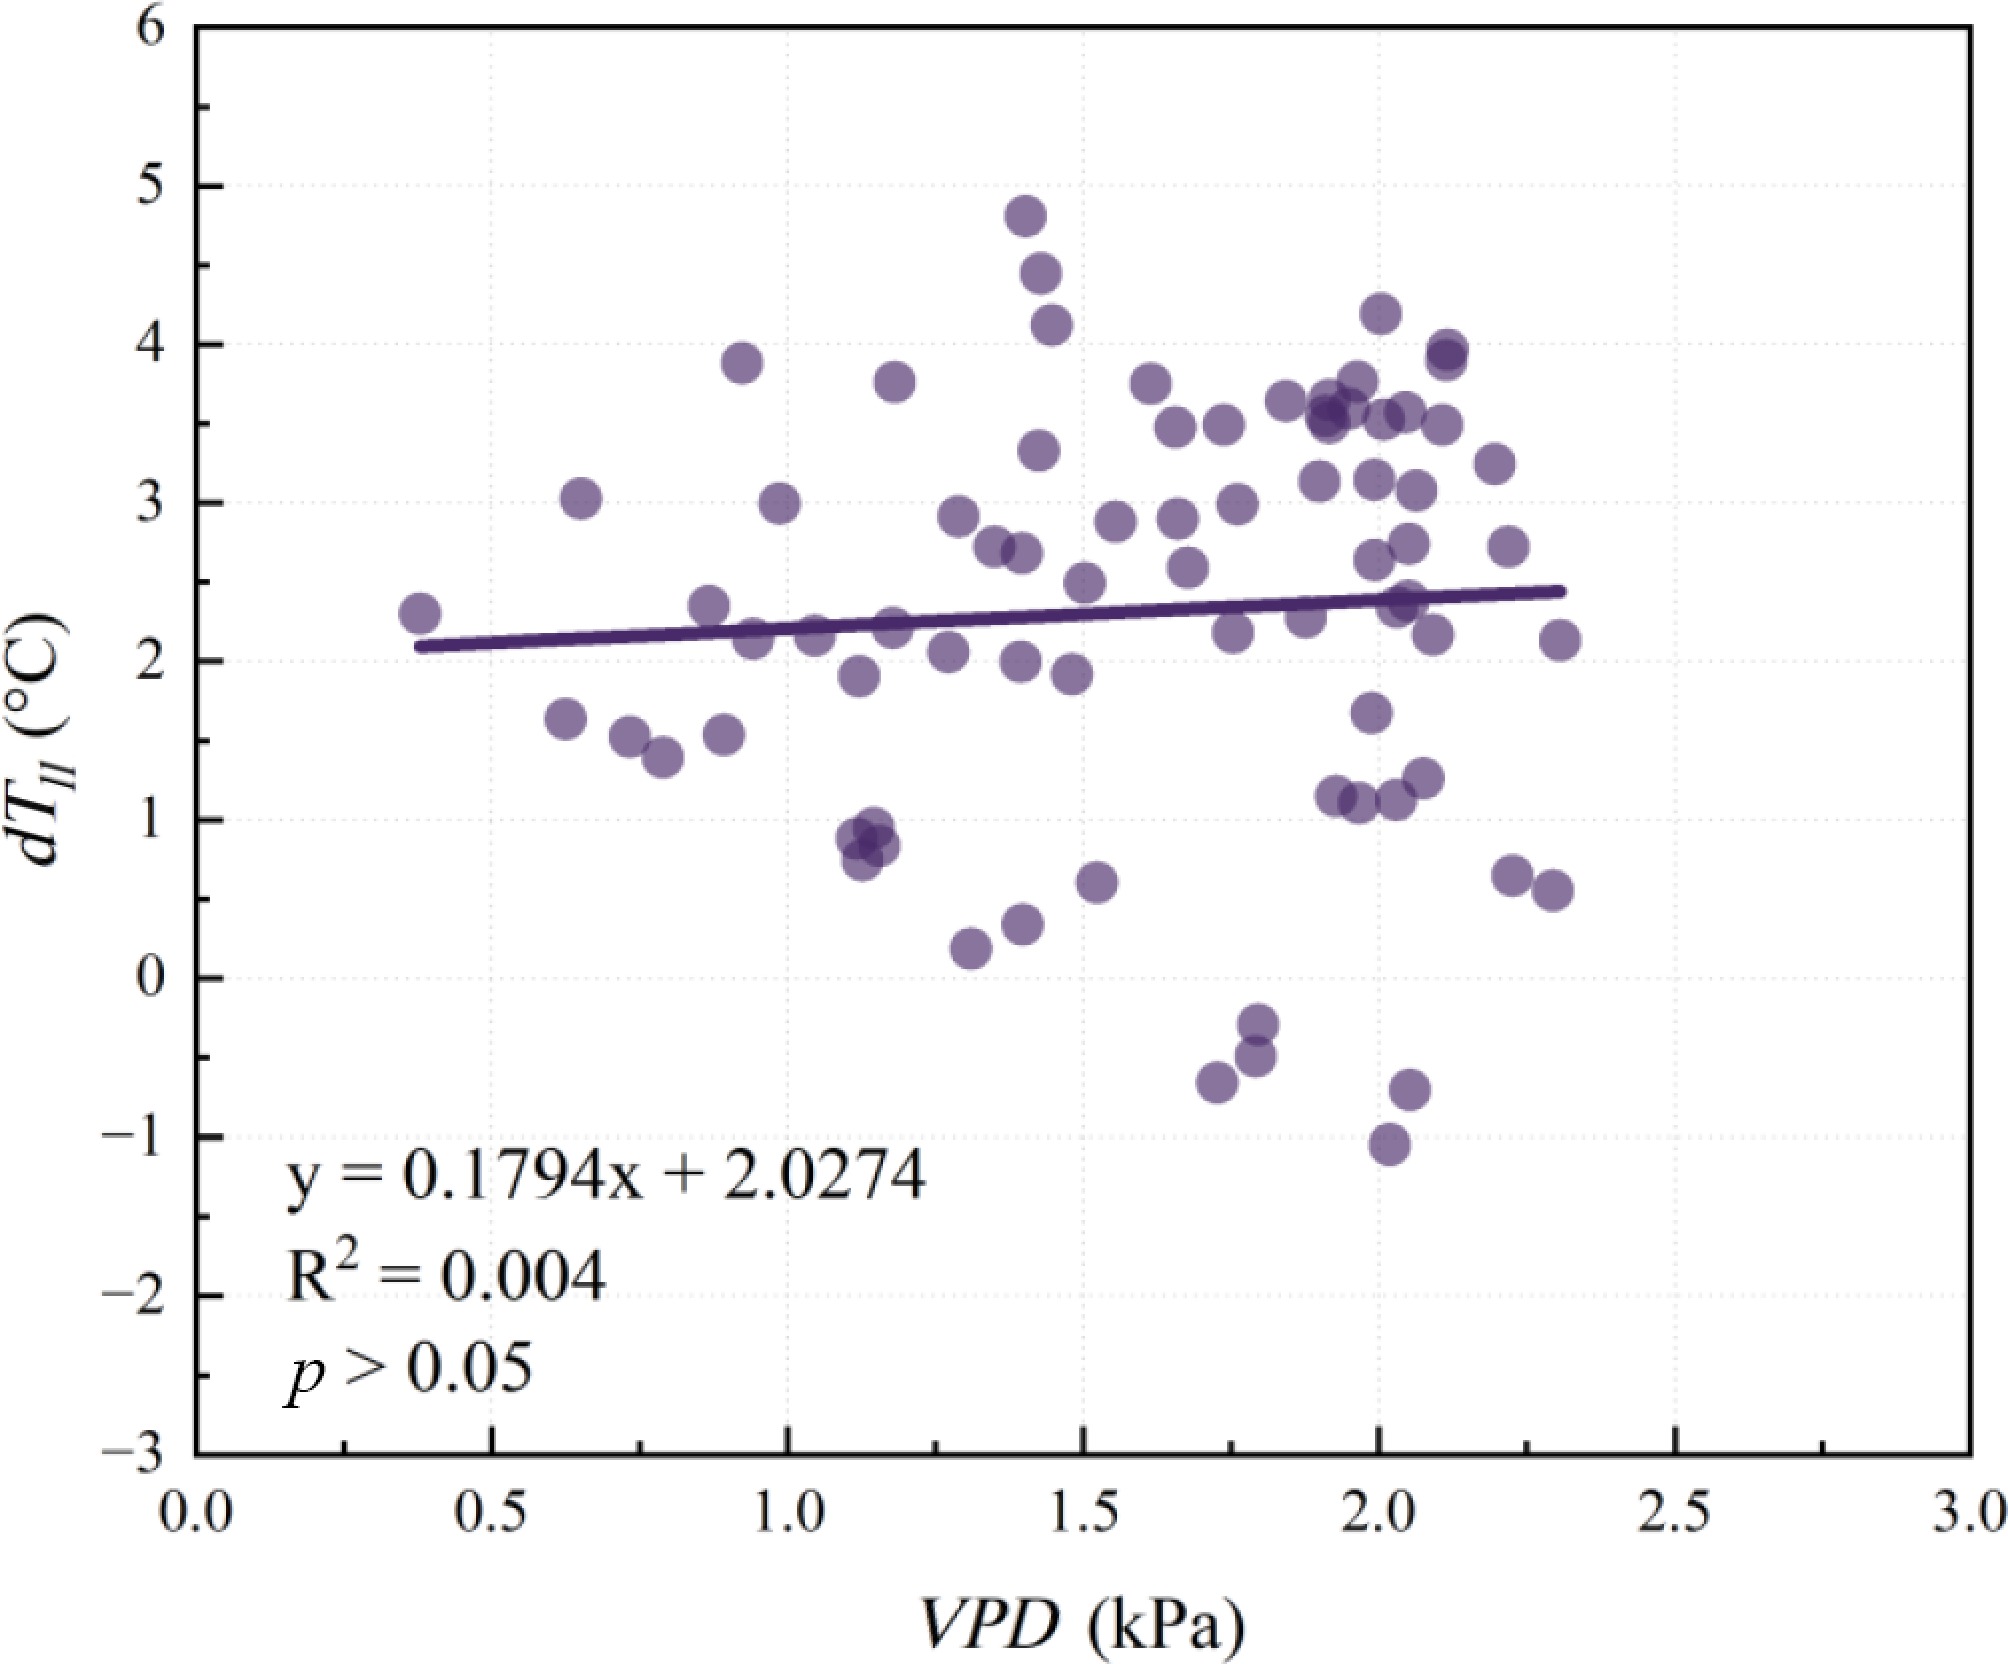
Figure 5.
Canopy-air temperature difference (dTll) vs vapour pressure deficit (VPD) under well-watered conditions (all daytime hours data on sunny days were pooled together). ** represents p < 0.01; * represents p < 0.05.
-
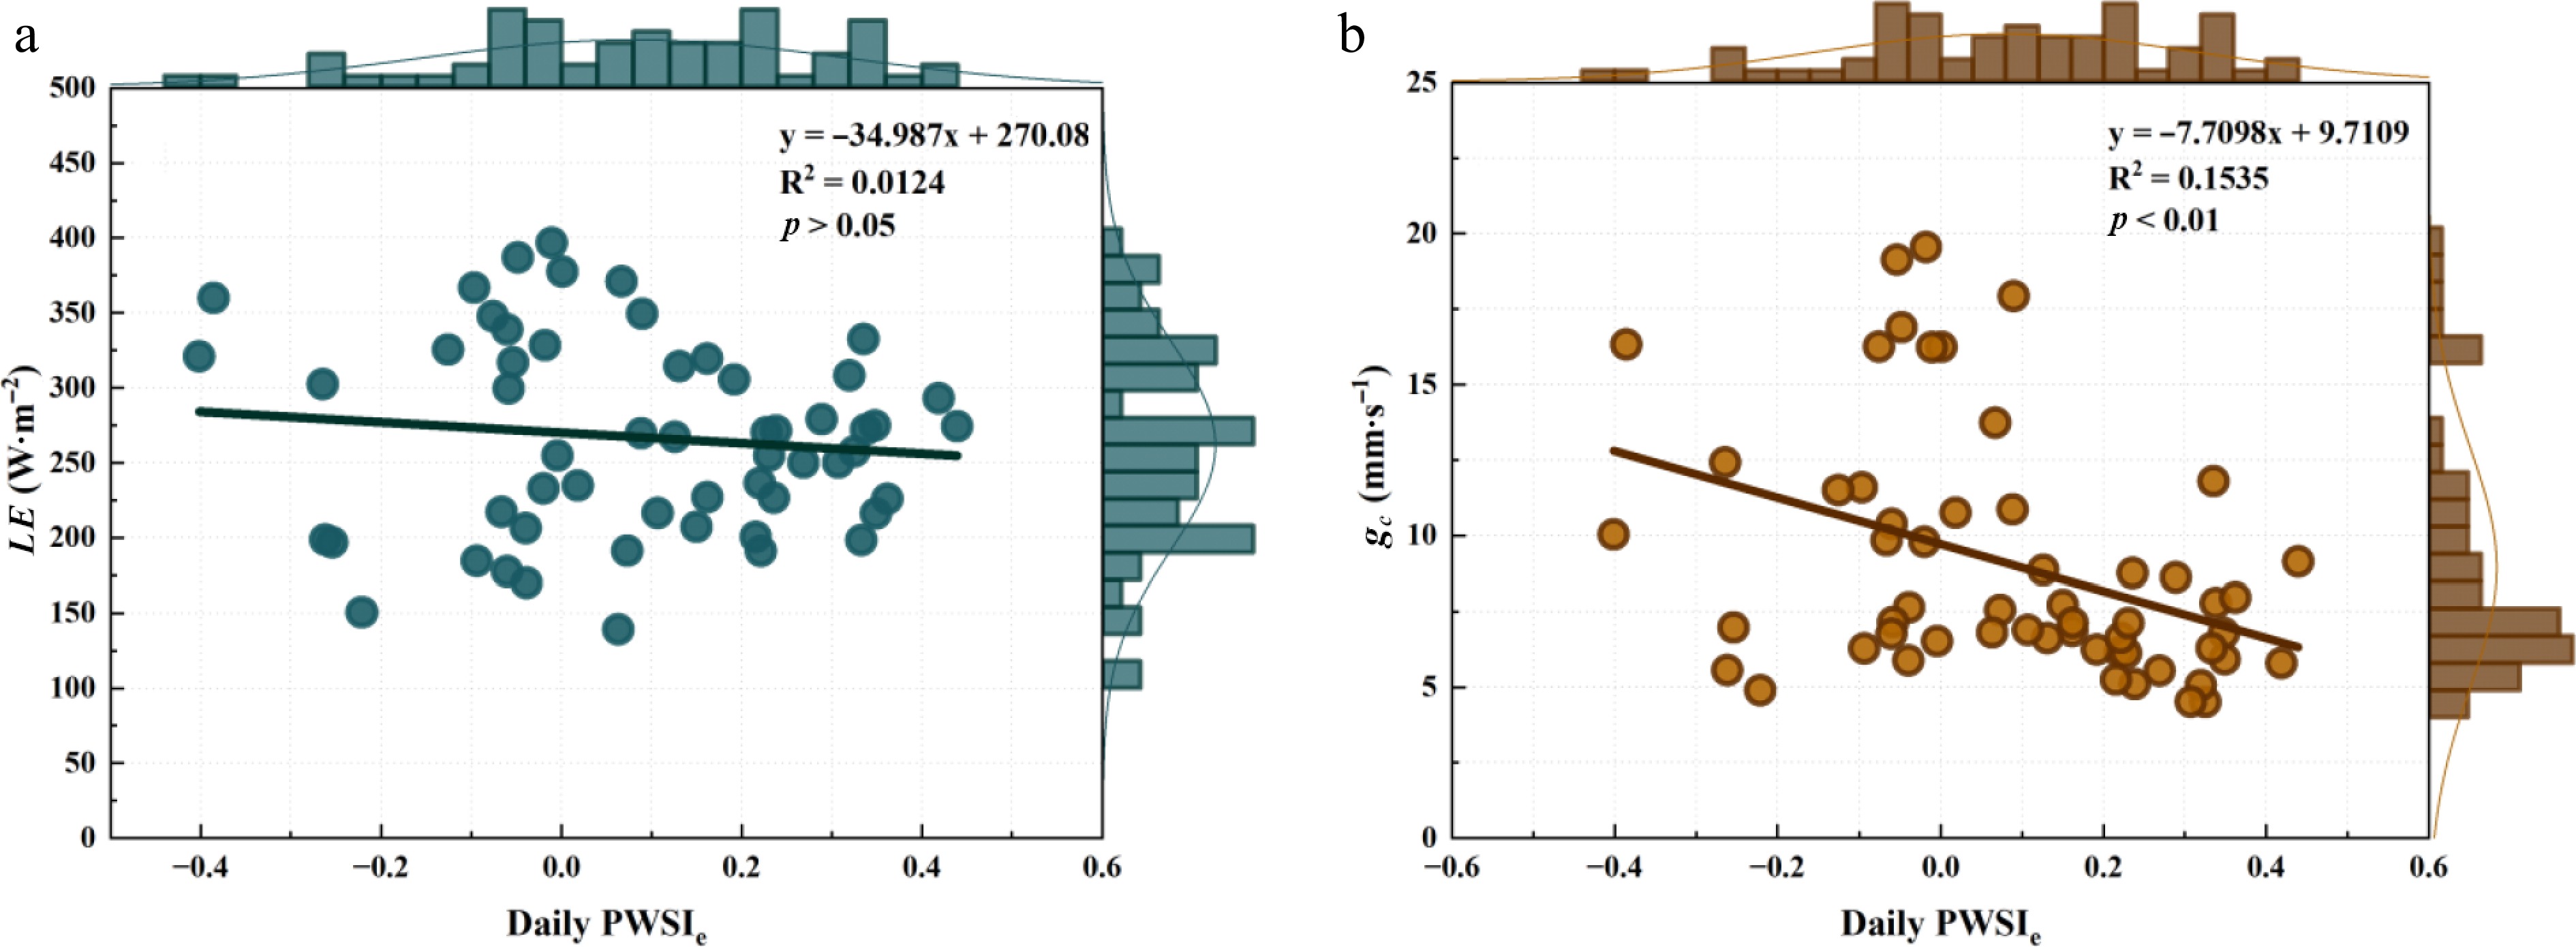
Figure 6.
Performance of the daily empirical plant water stress index (PWSIe) in indicating urban forest ecosystem water status. ** represents p < 0.01; * represents p < 0.05.
-
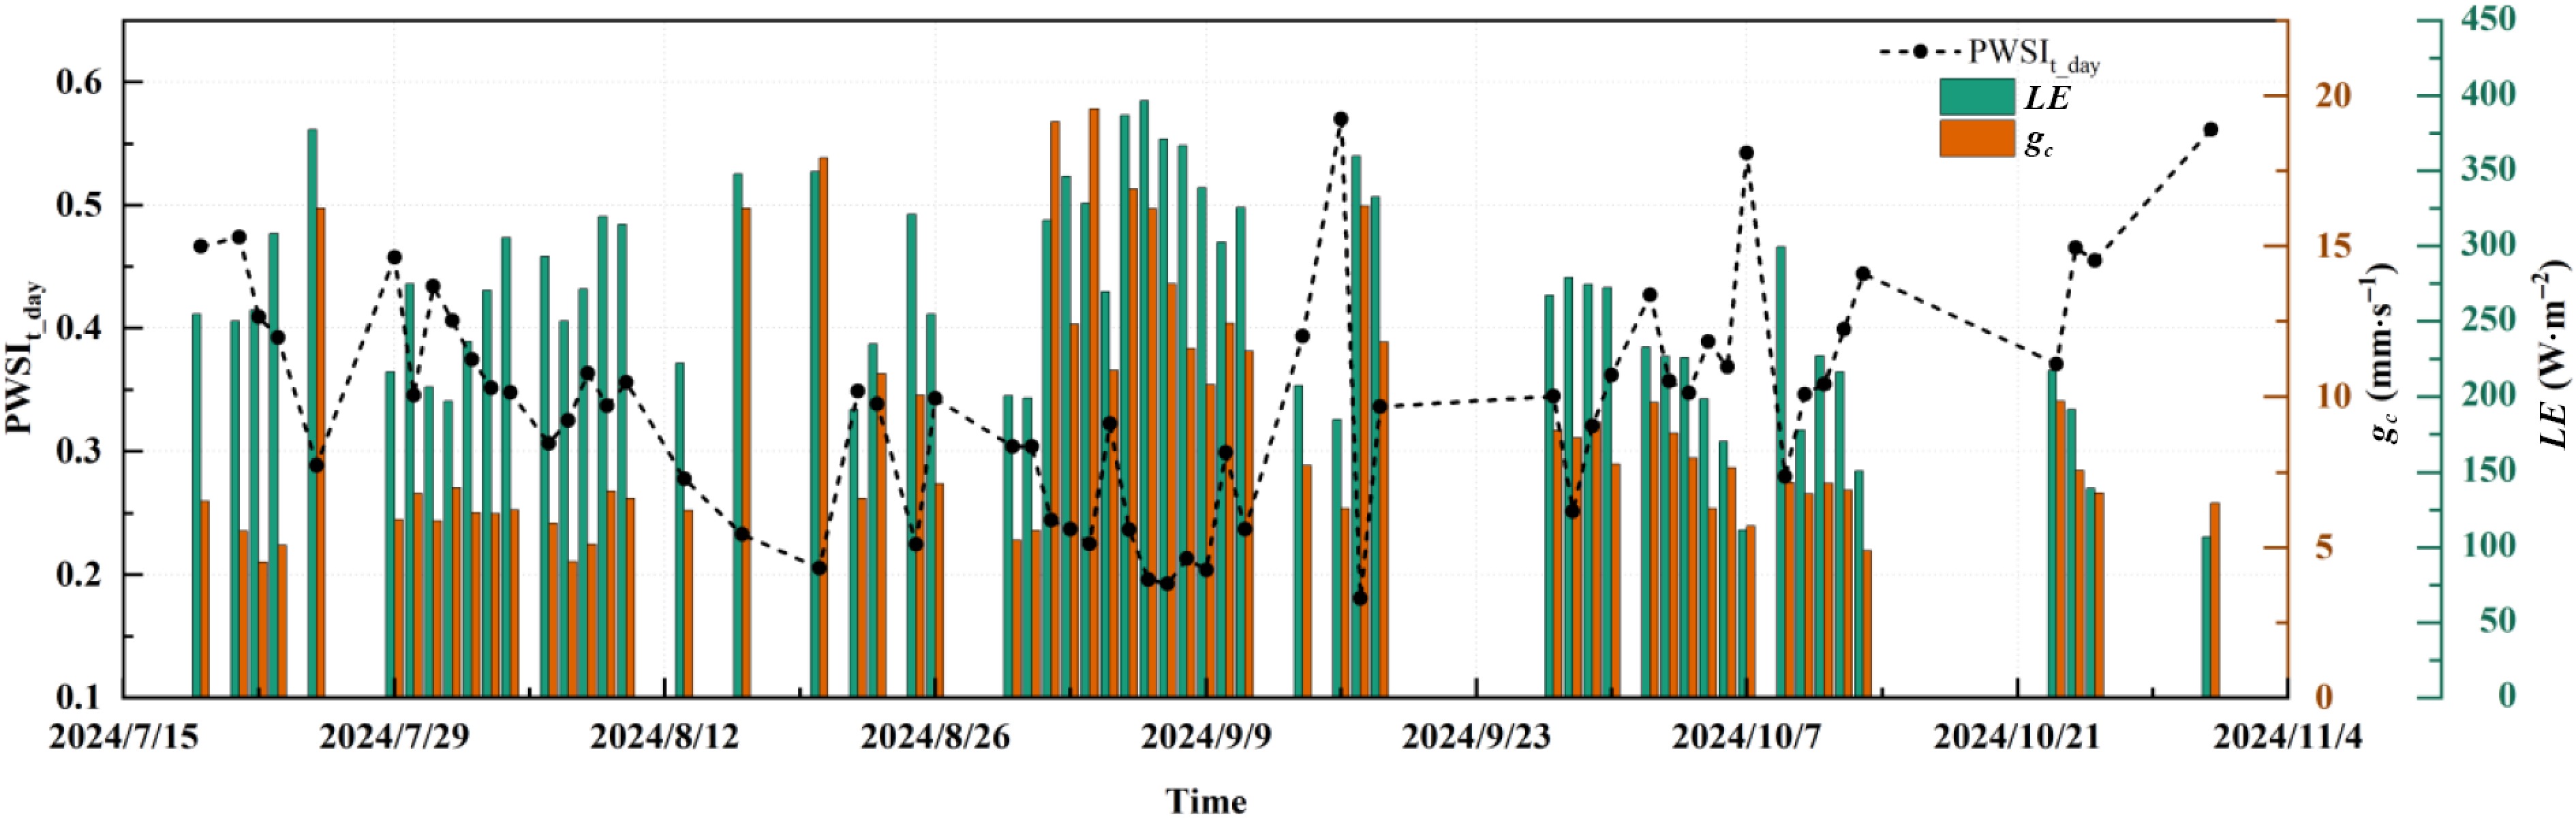
Figure 7.
Daily variations in the daytime mean theoretical plant water stress index (PWSIt_day), canopy conductance (gc), and latent heat flux (LE) on sunny days from July to October 2024. ** represents p < 0.01; * represents p < 0.05.
-
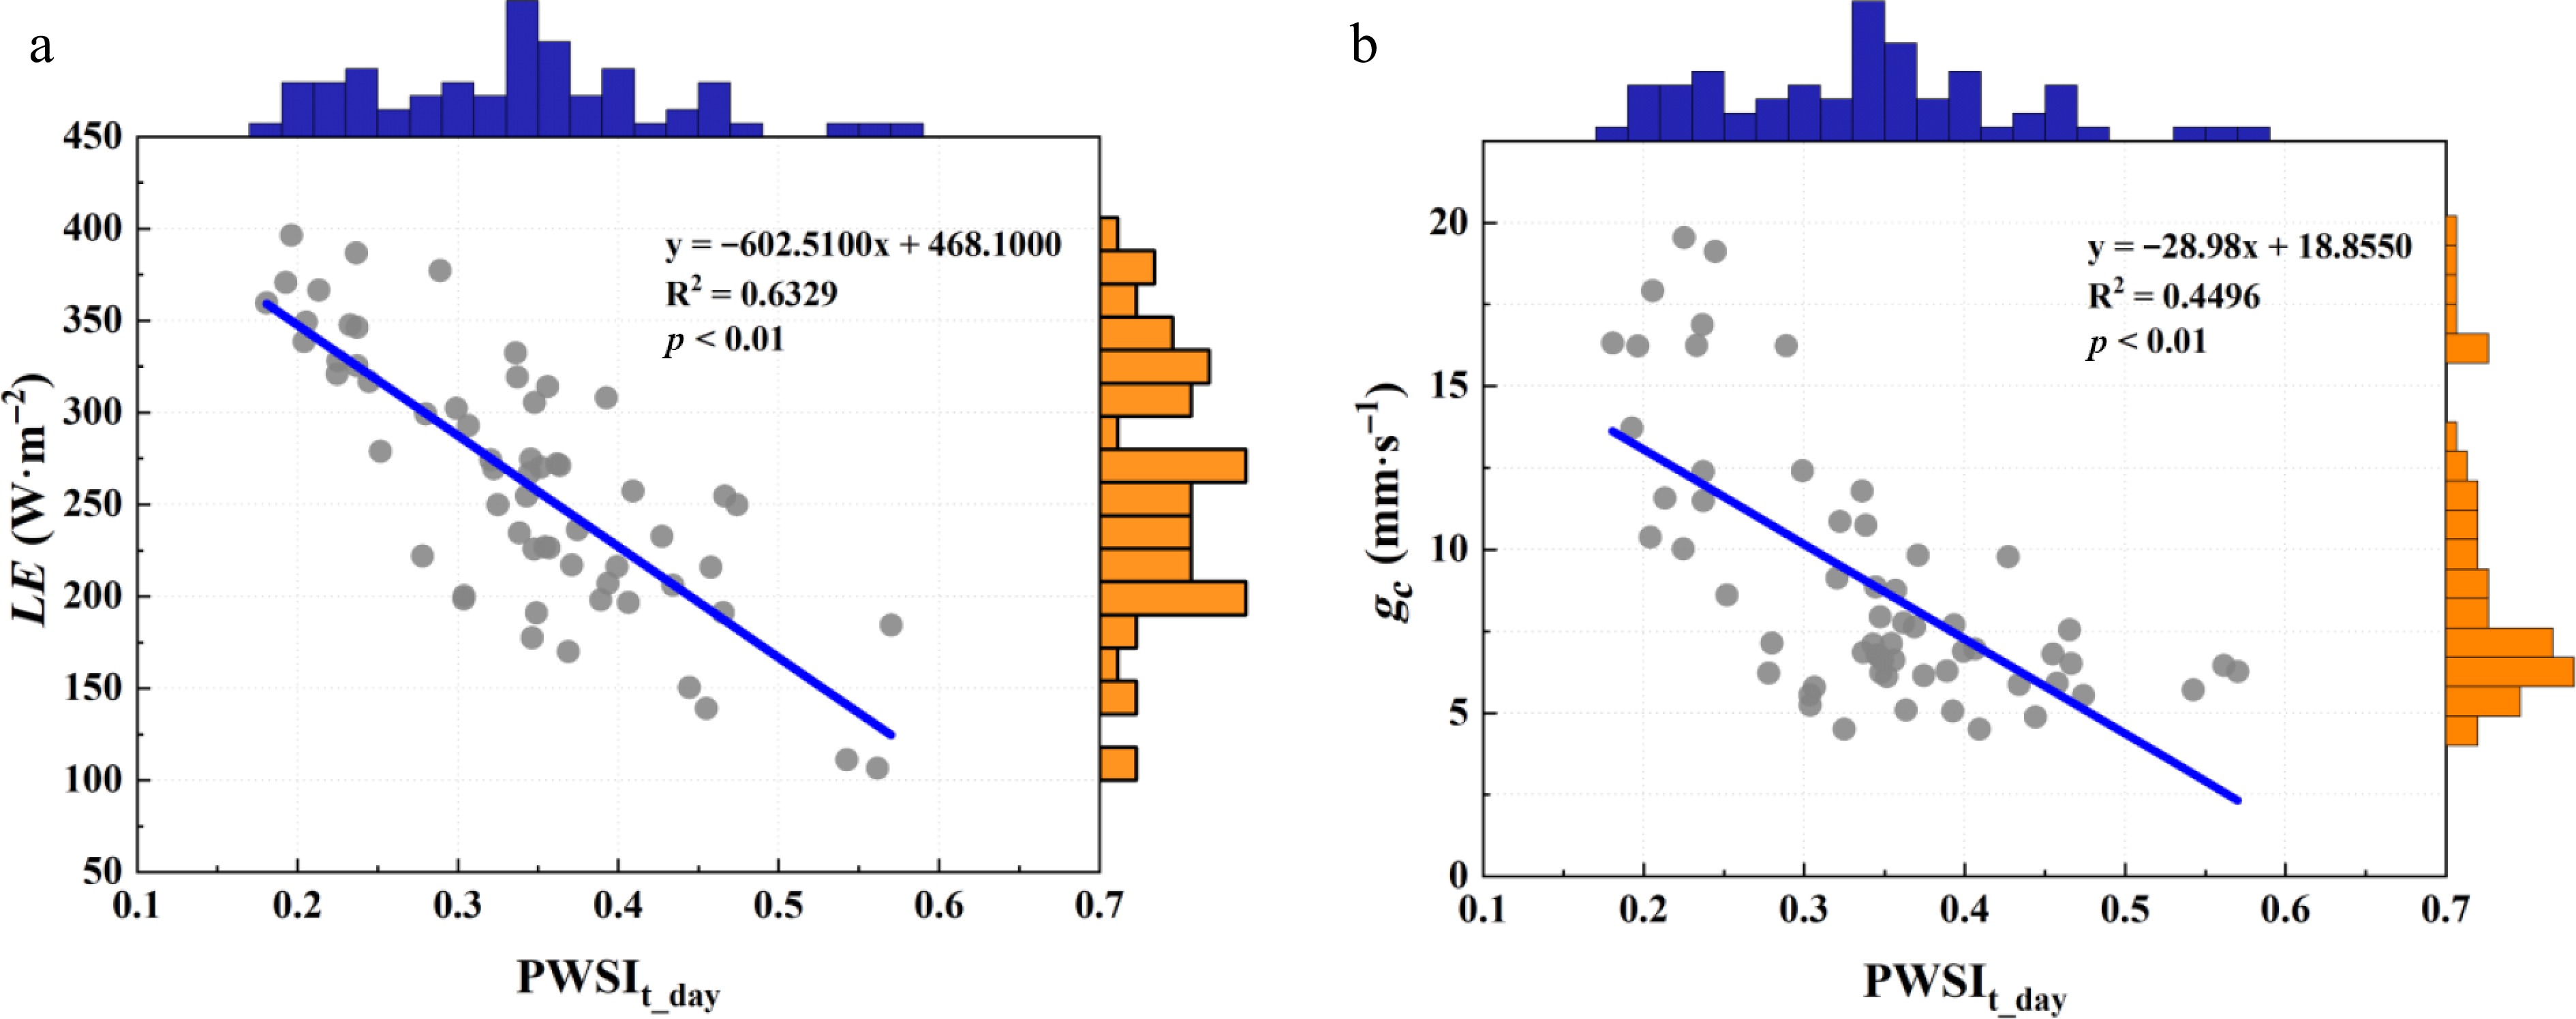
Figure 8.
Performance of the daytime mean theoretical plant water stress index (PWSIt_day) in indicating urban forest ecosystem water status. ** represents p < 0.01; * represents p < 0.05.
-
Time Slope (°C·kPa−1) Intercept (°C) R2 8:00 −0.9226 2.1068 0.8366** 9:00 −0.6772 2.7285 0.5622* 10:00 −0.6640 3.4301 0.2670 11:00 −0.5382 3.7108 0.1008 12:00 −0.2808 3.9867 0.0761 13:00 −0.8012 5.5463 0.5116* 14:00 −0.3989 4.3425 0.1421 15:00 −1.0205 4.4587 0.6430* 16:00 −0.8735 2.6552 0.2374 17:00 −1.5884 2.3692 0.8748** 8:00 − 17:00 −0.8227 3.5879 0.8633** ** represents p < 0.01; * represents p < 0.05 (same in all tables). Table 1.
Fitted parameters for non-water-stressed baselines.
-
Time Slope Intercept R2 8:00 gc −0.0050 −0.0095 0.0036 LE 0.0008 −0.2655 0.0278 9:00 gc −0.0289 0.5331 0.1609** LE −0.0019 0.7765 0.2080** 10:00 gc −0.0595 0.9084 0.2507** LE −0.0037 1.3350 0.2891** 11:00 gc −0.0729 1.2223 0.2154** LE −0.0050 1.8831 0.3102** 12:00 gc −0.0781 1.0197 0.0282 LE −0.0078 2.3512 0.0838* 13:00 gc 0.0087 −0.2427 0.0040 LE 0.0020 −0.6967 0.0656 14:00 gc 0.0253 −0.3908 0.0066 LE 0.0055 −1.6110 0.0958* 15:00 gc 0.0043 −0.1196 0.0013 LE 0.0036 −1.0096 0.2621** 16:00 gc −0.0103 0.0991 0.0063 LE 0.0031 −0.8023 0.1704** 17:00 gc −0.0086 0.0288 0.0090 LE 0.0017 −0.4991 0.1077* Table 2.
Relationships between empirical plant water stress index (PWSIe) and canopy conductance (gc) and between PWSIe and latent heat flux (LE) at various times.
-
Time Slope Intercept R2 8:00 gc −0.0100 0.2976 0.0320 LE −0.0008 0.4058 0.0556 9:00 gc −0.0126 0.2601 0.1315** LE −0.0006 0.3169 0.1051* 10:00 gc −0.0131 0.2804 0.1995** LE −0.0005 0.3061 0.1060* 11:00 gc −0.0081 0.2735 0.1093** LE −0.0002 0.2489 0.0171 12:00 gc −0.0129 0.3831 0.2121** LE −0.0003 0.3433 0.0327 13:00 gc −0.0131 0.4530 0.2288** LE −0.0005 0.4706 0.1084* 14:00 gc −0.0215 0.6037 0.4517** LE −0.0010 0.6855 0.3262** 15:00 gc −0.0250 0.7123 0.3034** LE −0.0018 0.9660 0.4931** 16:00 gc −0.0221 0.7961 0.1857** LE −0.0022 1.1638 0.5400** 17:00 gc −0.0123 0.9101 0.0309 LE −0.0025 1.4561 0.3940** Table 3.
Relationships between theoretical plant water stress index (PWSIt) and canopy conductance (gc) and between PWSIt and latent heat flux (LE) at various times.
Figures
(8)
Tables
(3)