-
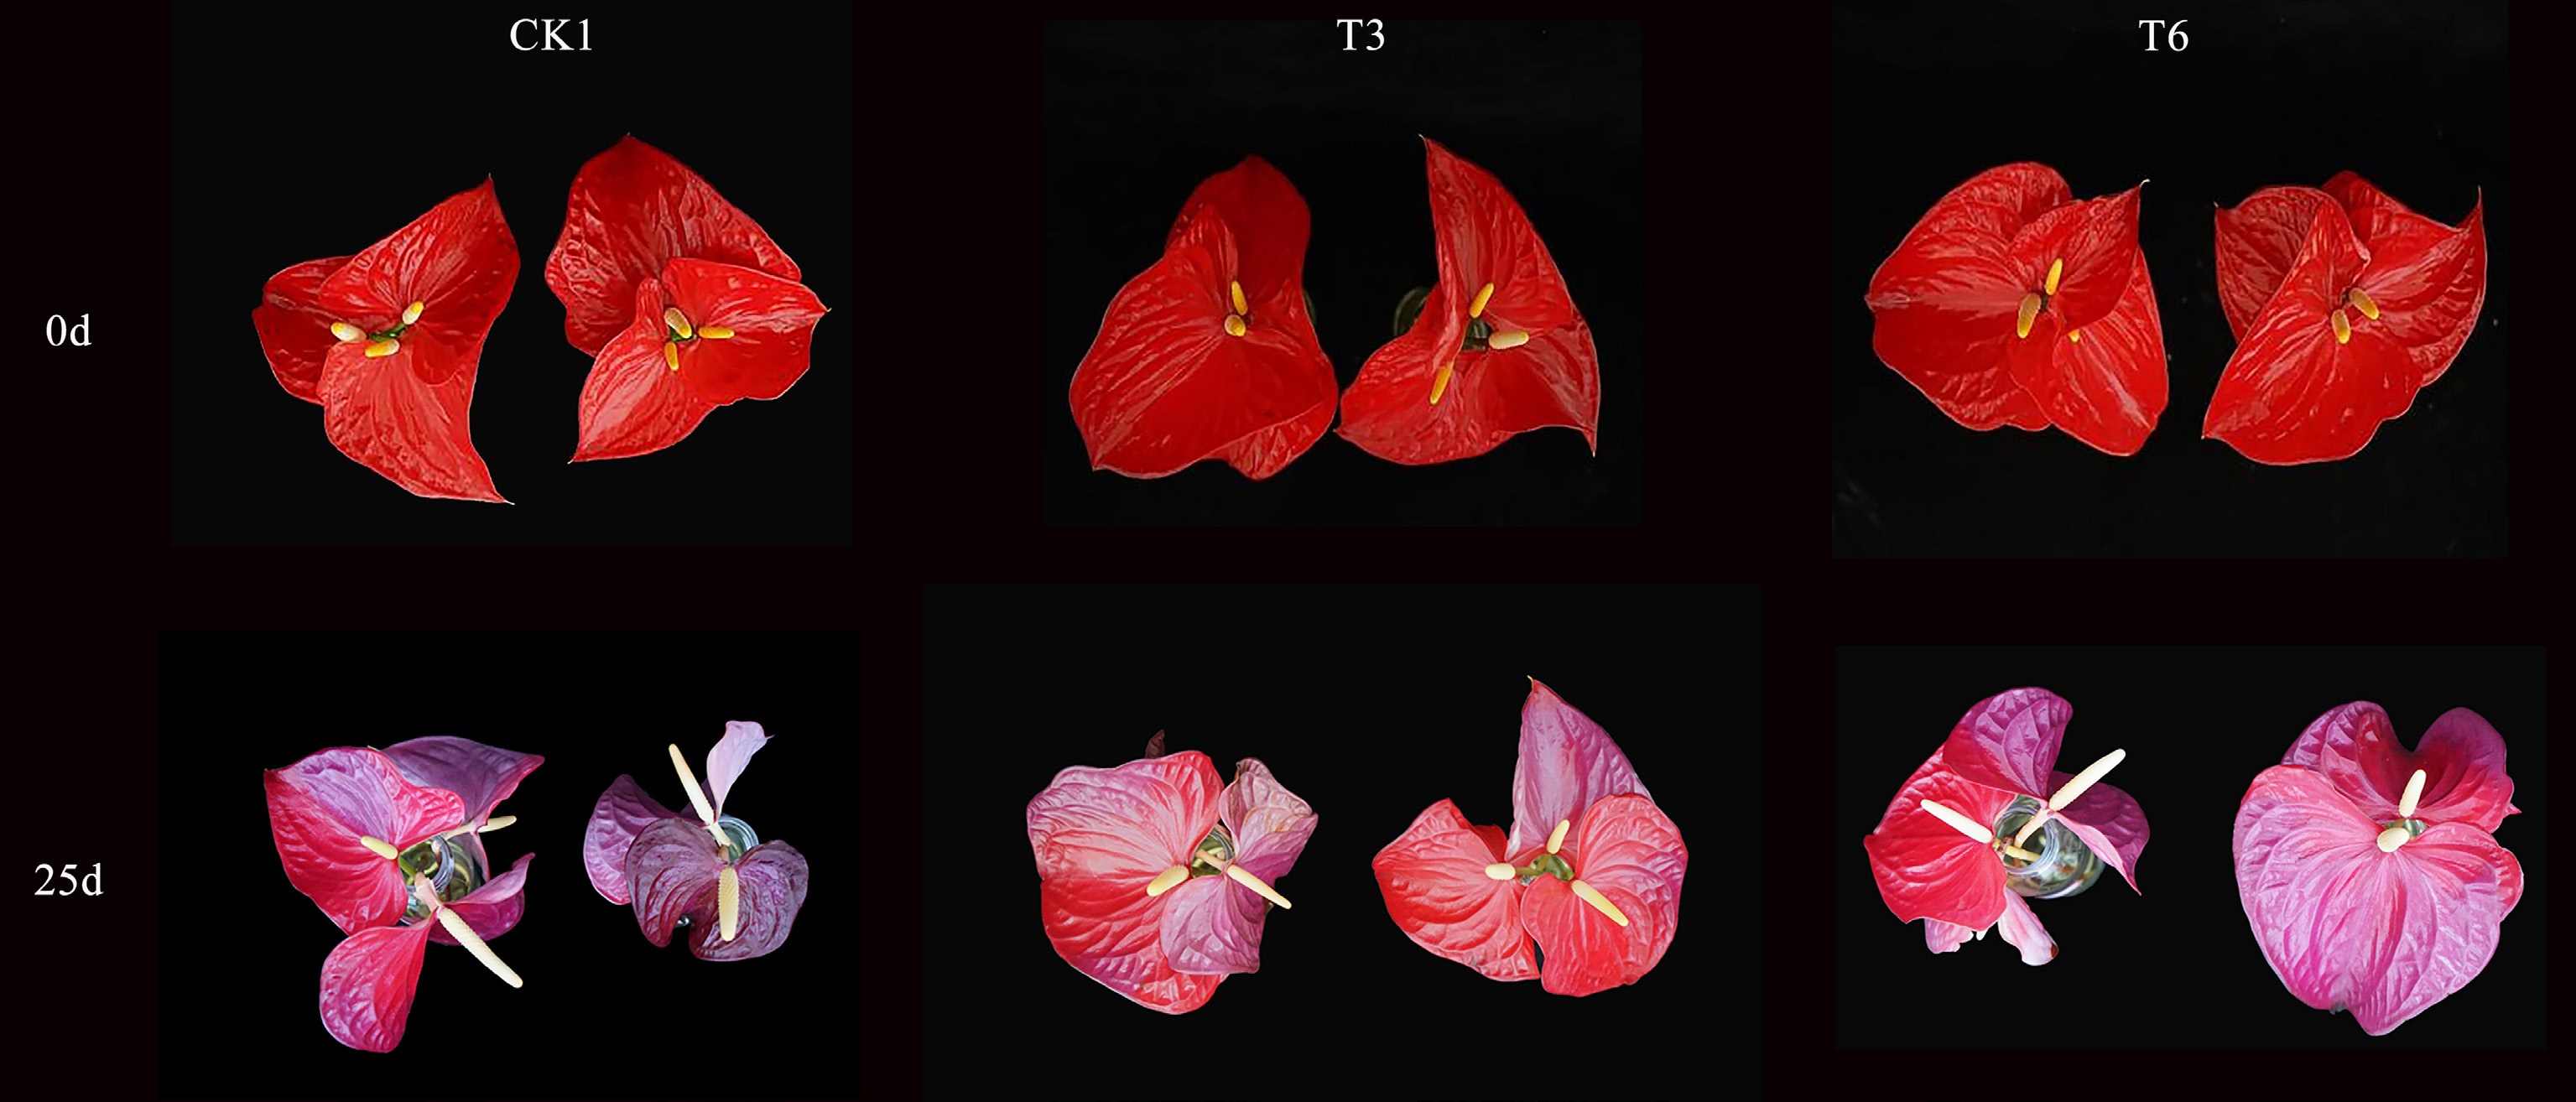
Figure 1.
Comparison of A. andraeanum cut flowers morphology on Days 0 and 25.
-
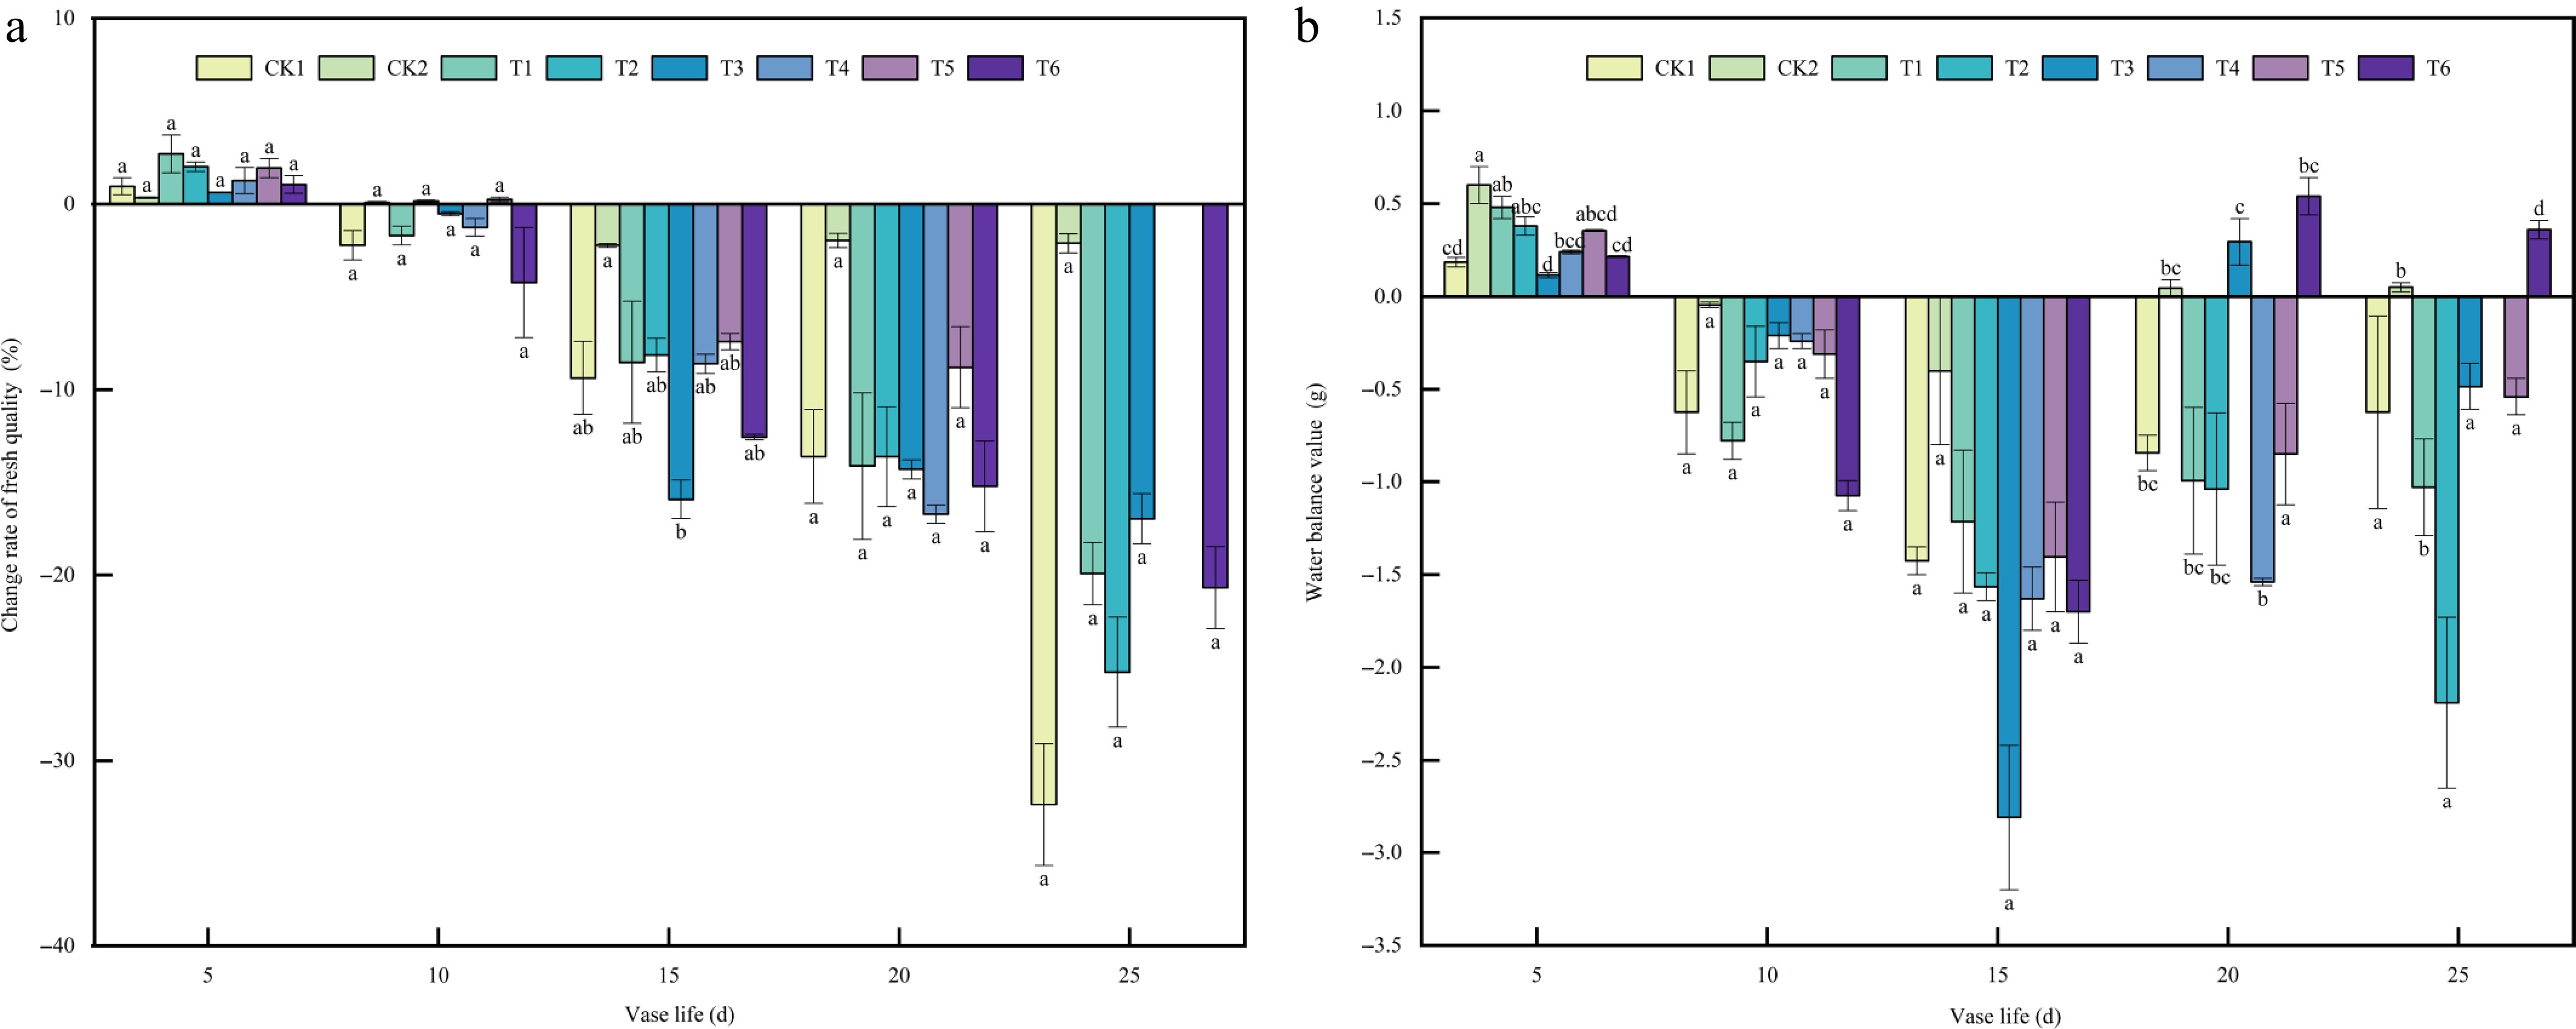
Figure 2.
Effects of plant growth regulators on (a) fresh weight variation, and (b) water balance in A. andraeanum cut flowers. Values are expressed as the mean ± SD (n = 3 biological replicates). Different lowercase letters indicate significant differences according to Tukey's multiple range test (p < 0.05). Treatments: CK1, base solution (20g·L−1 Sucrose + 200 mg·L-18-HQ); CK2, distilled water; T1, base solution + 10 mg·L−1 6-BA; T2, base solution + 20 mg·L−1 6-BA; T3, 30 mg·L−1 6-BA; T4, base solution + 50 mg·L−1 GA3; T5, base solution + 100 mg·L−1 GA3; T6, 150 mg·L−1 GA3.
-
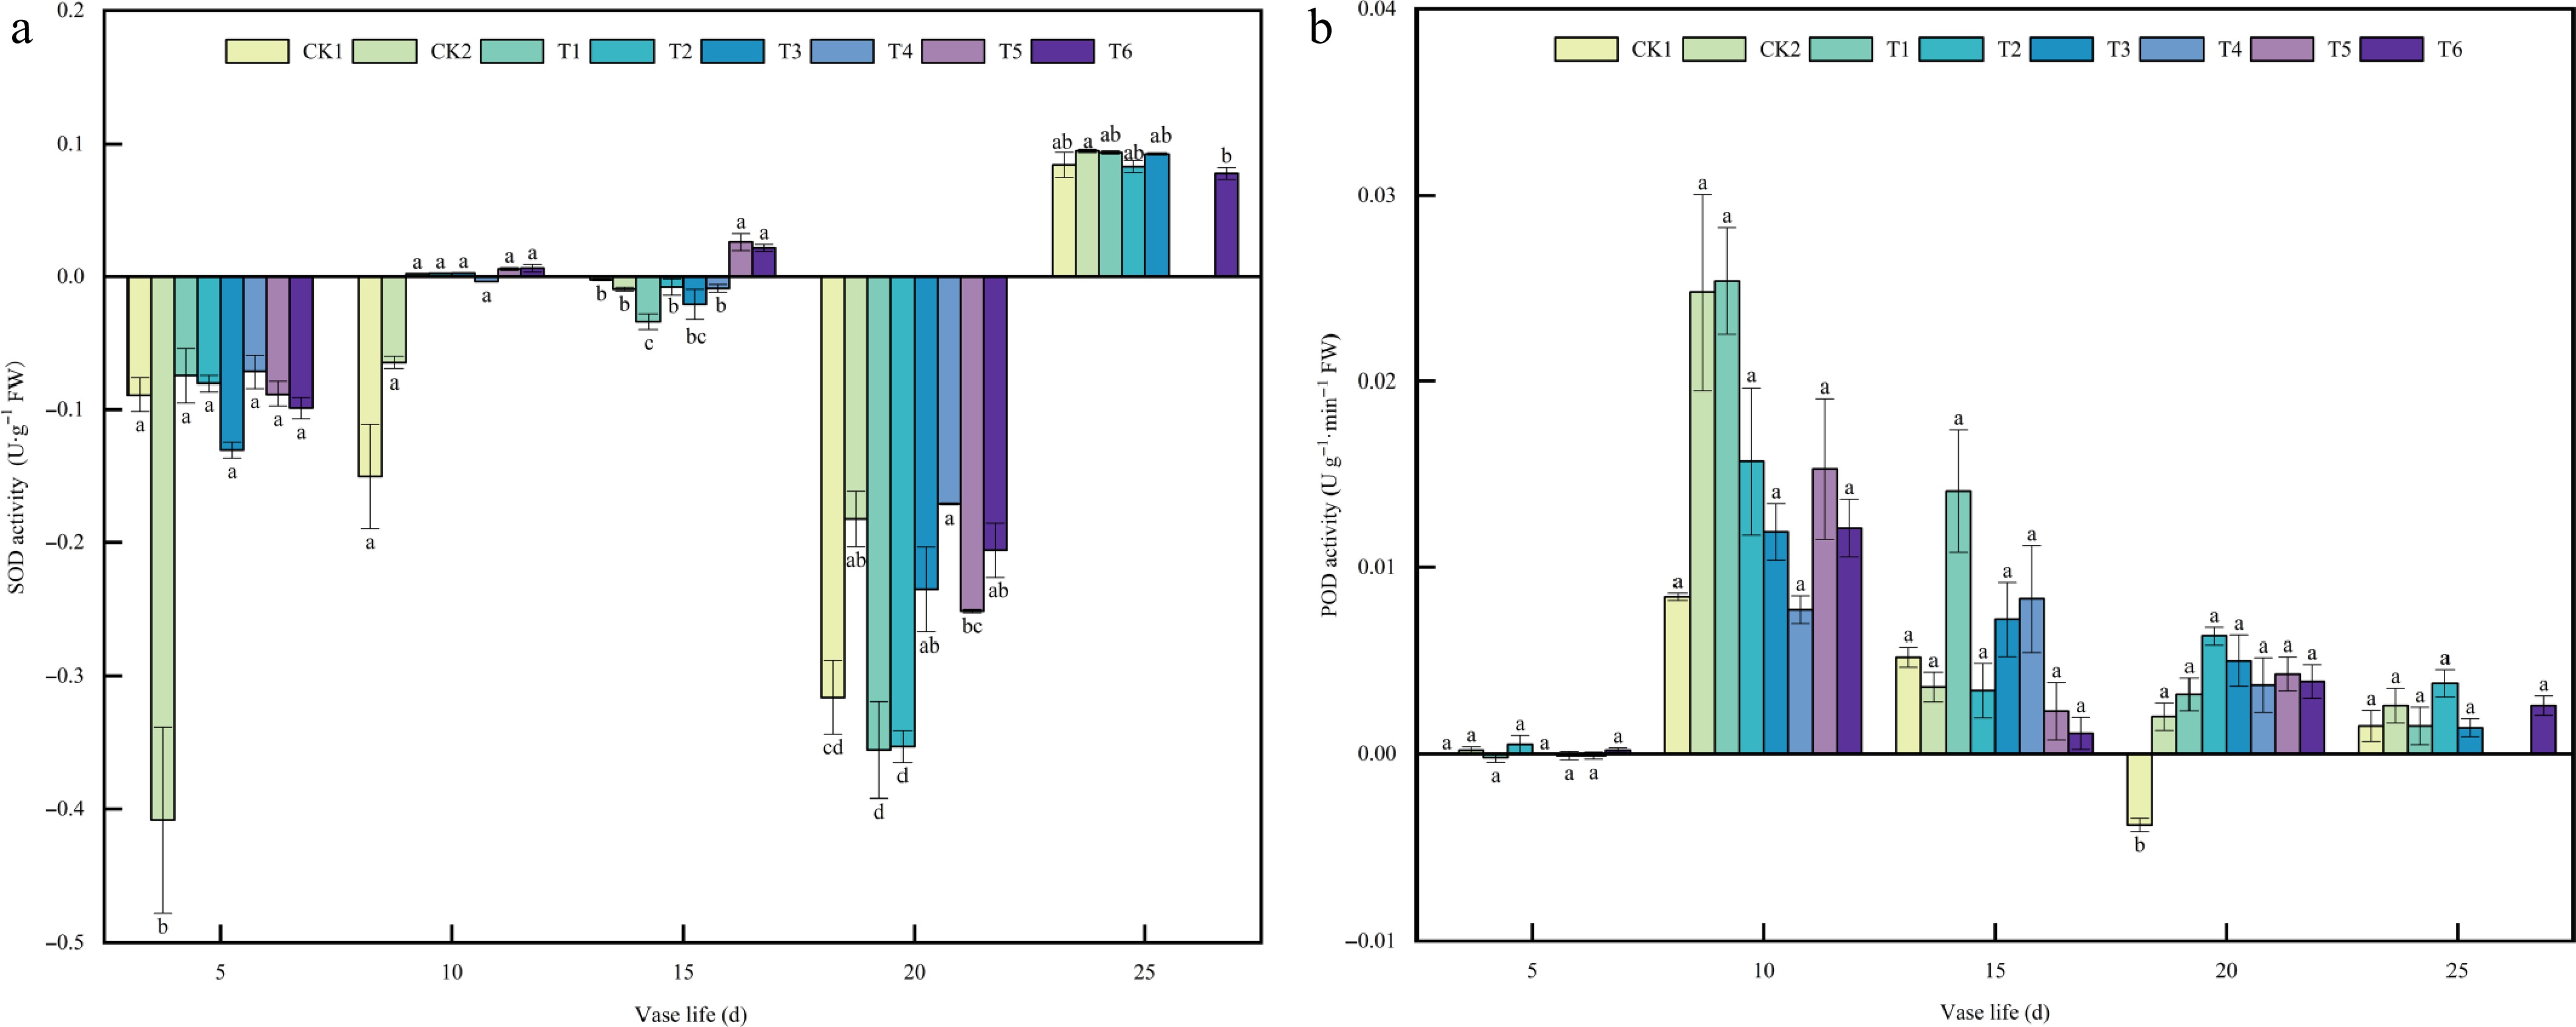
Figure 3.
Effects of plant growth regulators on (a) SOD, and (b) POD activity in A. andraeanum cut flowers. Values are expressed as the mean ± SD (n = 3 biological replicates). Different lowercase letters indicate significant differences according to Tukey's multiple range test (p < 0.05). Treatments: CK1, base solution (20g·L−1 Sucrose + 200 mg·L−18-HQ); CK2, distilled water; T1, base solution + 10 mg·L−1 6-BA; T2, base solution + 20 mg·L−1 6-BA; T3, 30 mg·L−1 6-BA; T4, base solution + 50 mg·L−1 GA3; T5, base solution + 100 mg·L−1 GA3; T6, 150 mg·L−1 GA3.
-
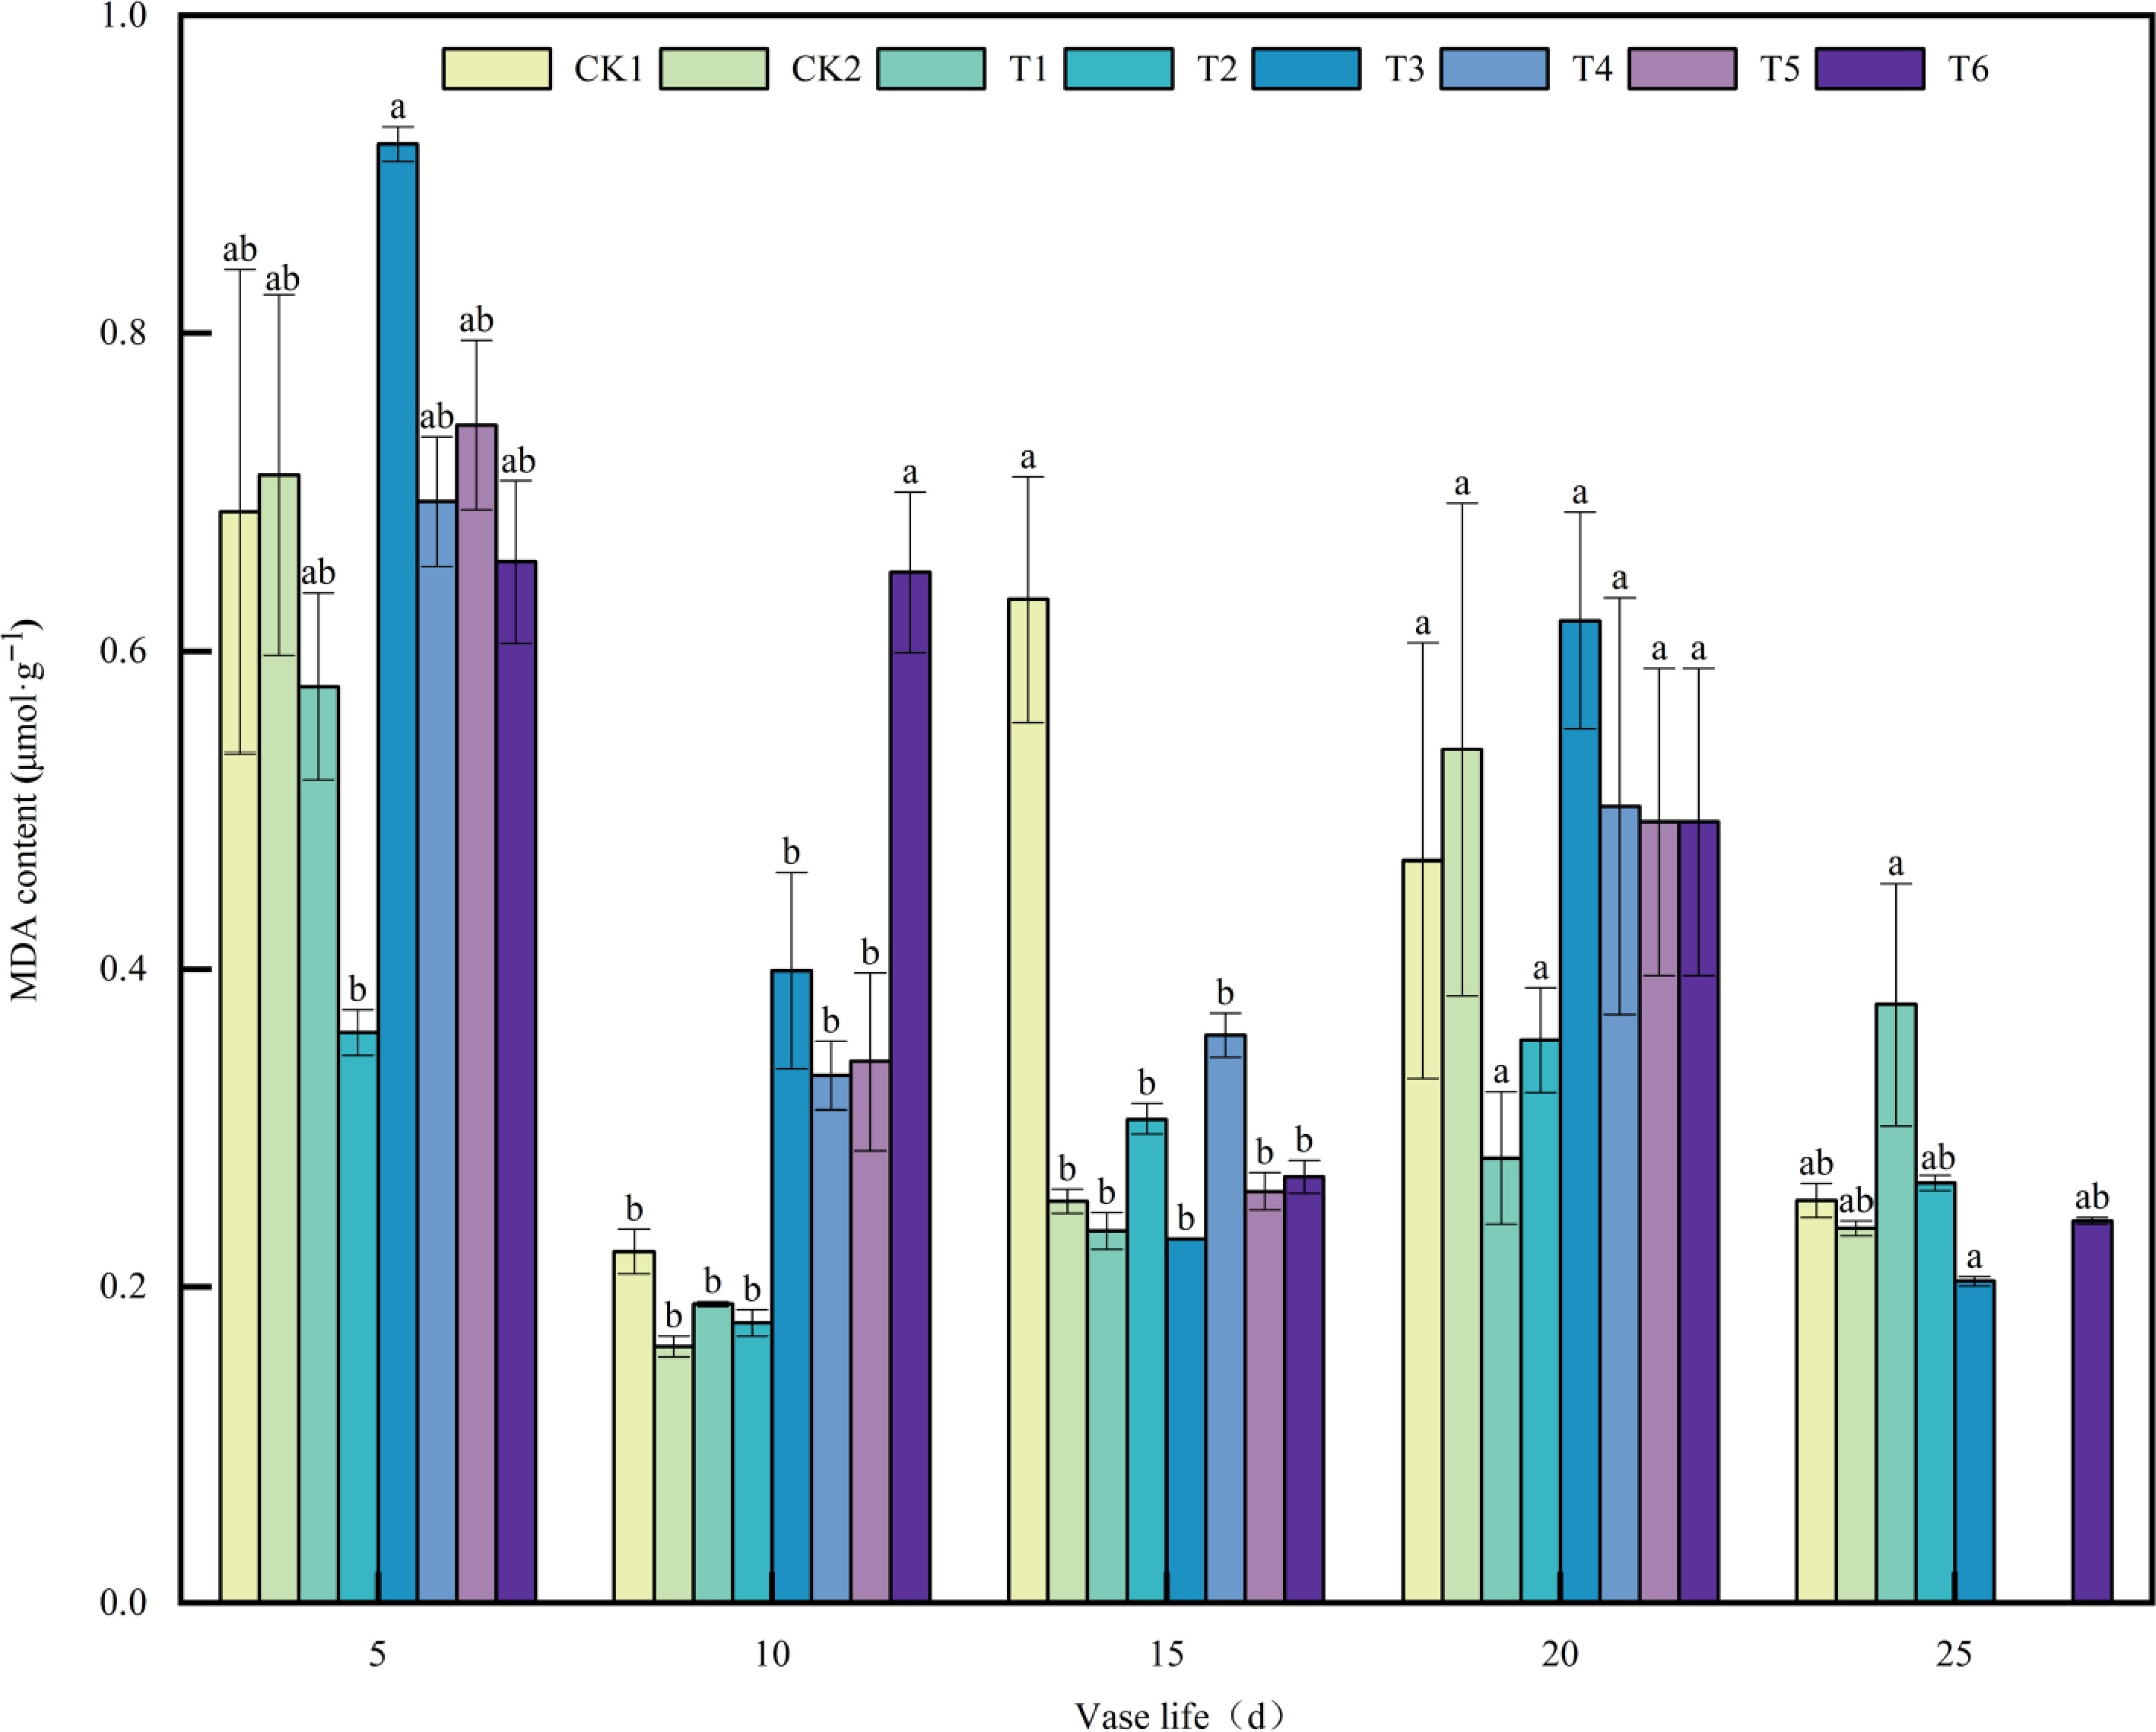
Figure 4.
Effects of plant growth regulators on MDA content in A. andraeanum cut flowers. Values are expressed as the mean ± SD (n = 3 biological replicates). Different lowercase letters indicate significant differences according to Tukey's multiple range test (p < 0.05). Treatments: CK1, base solution (20g·L−1 Sucrose + 200 mg·L−18-HQ); CK2, distilled water; T1, base solution + 10 mg·L−1 6-BA; T2, base solution + 20 mg·L−1 6-BA; T3, 30 mg·L−1 6-BA; T4, base solution + 50 mg·L−1 GA3; T5, base solution + 100 mg·L−1 GA3; T6, 150 mg·L−1 GA3.
-
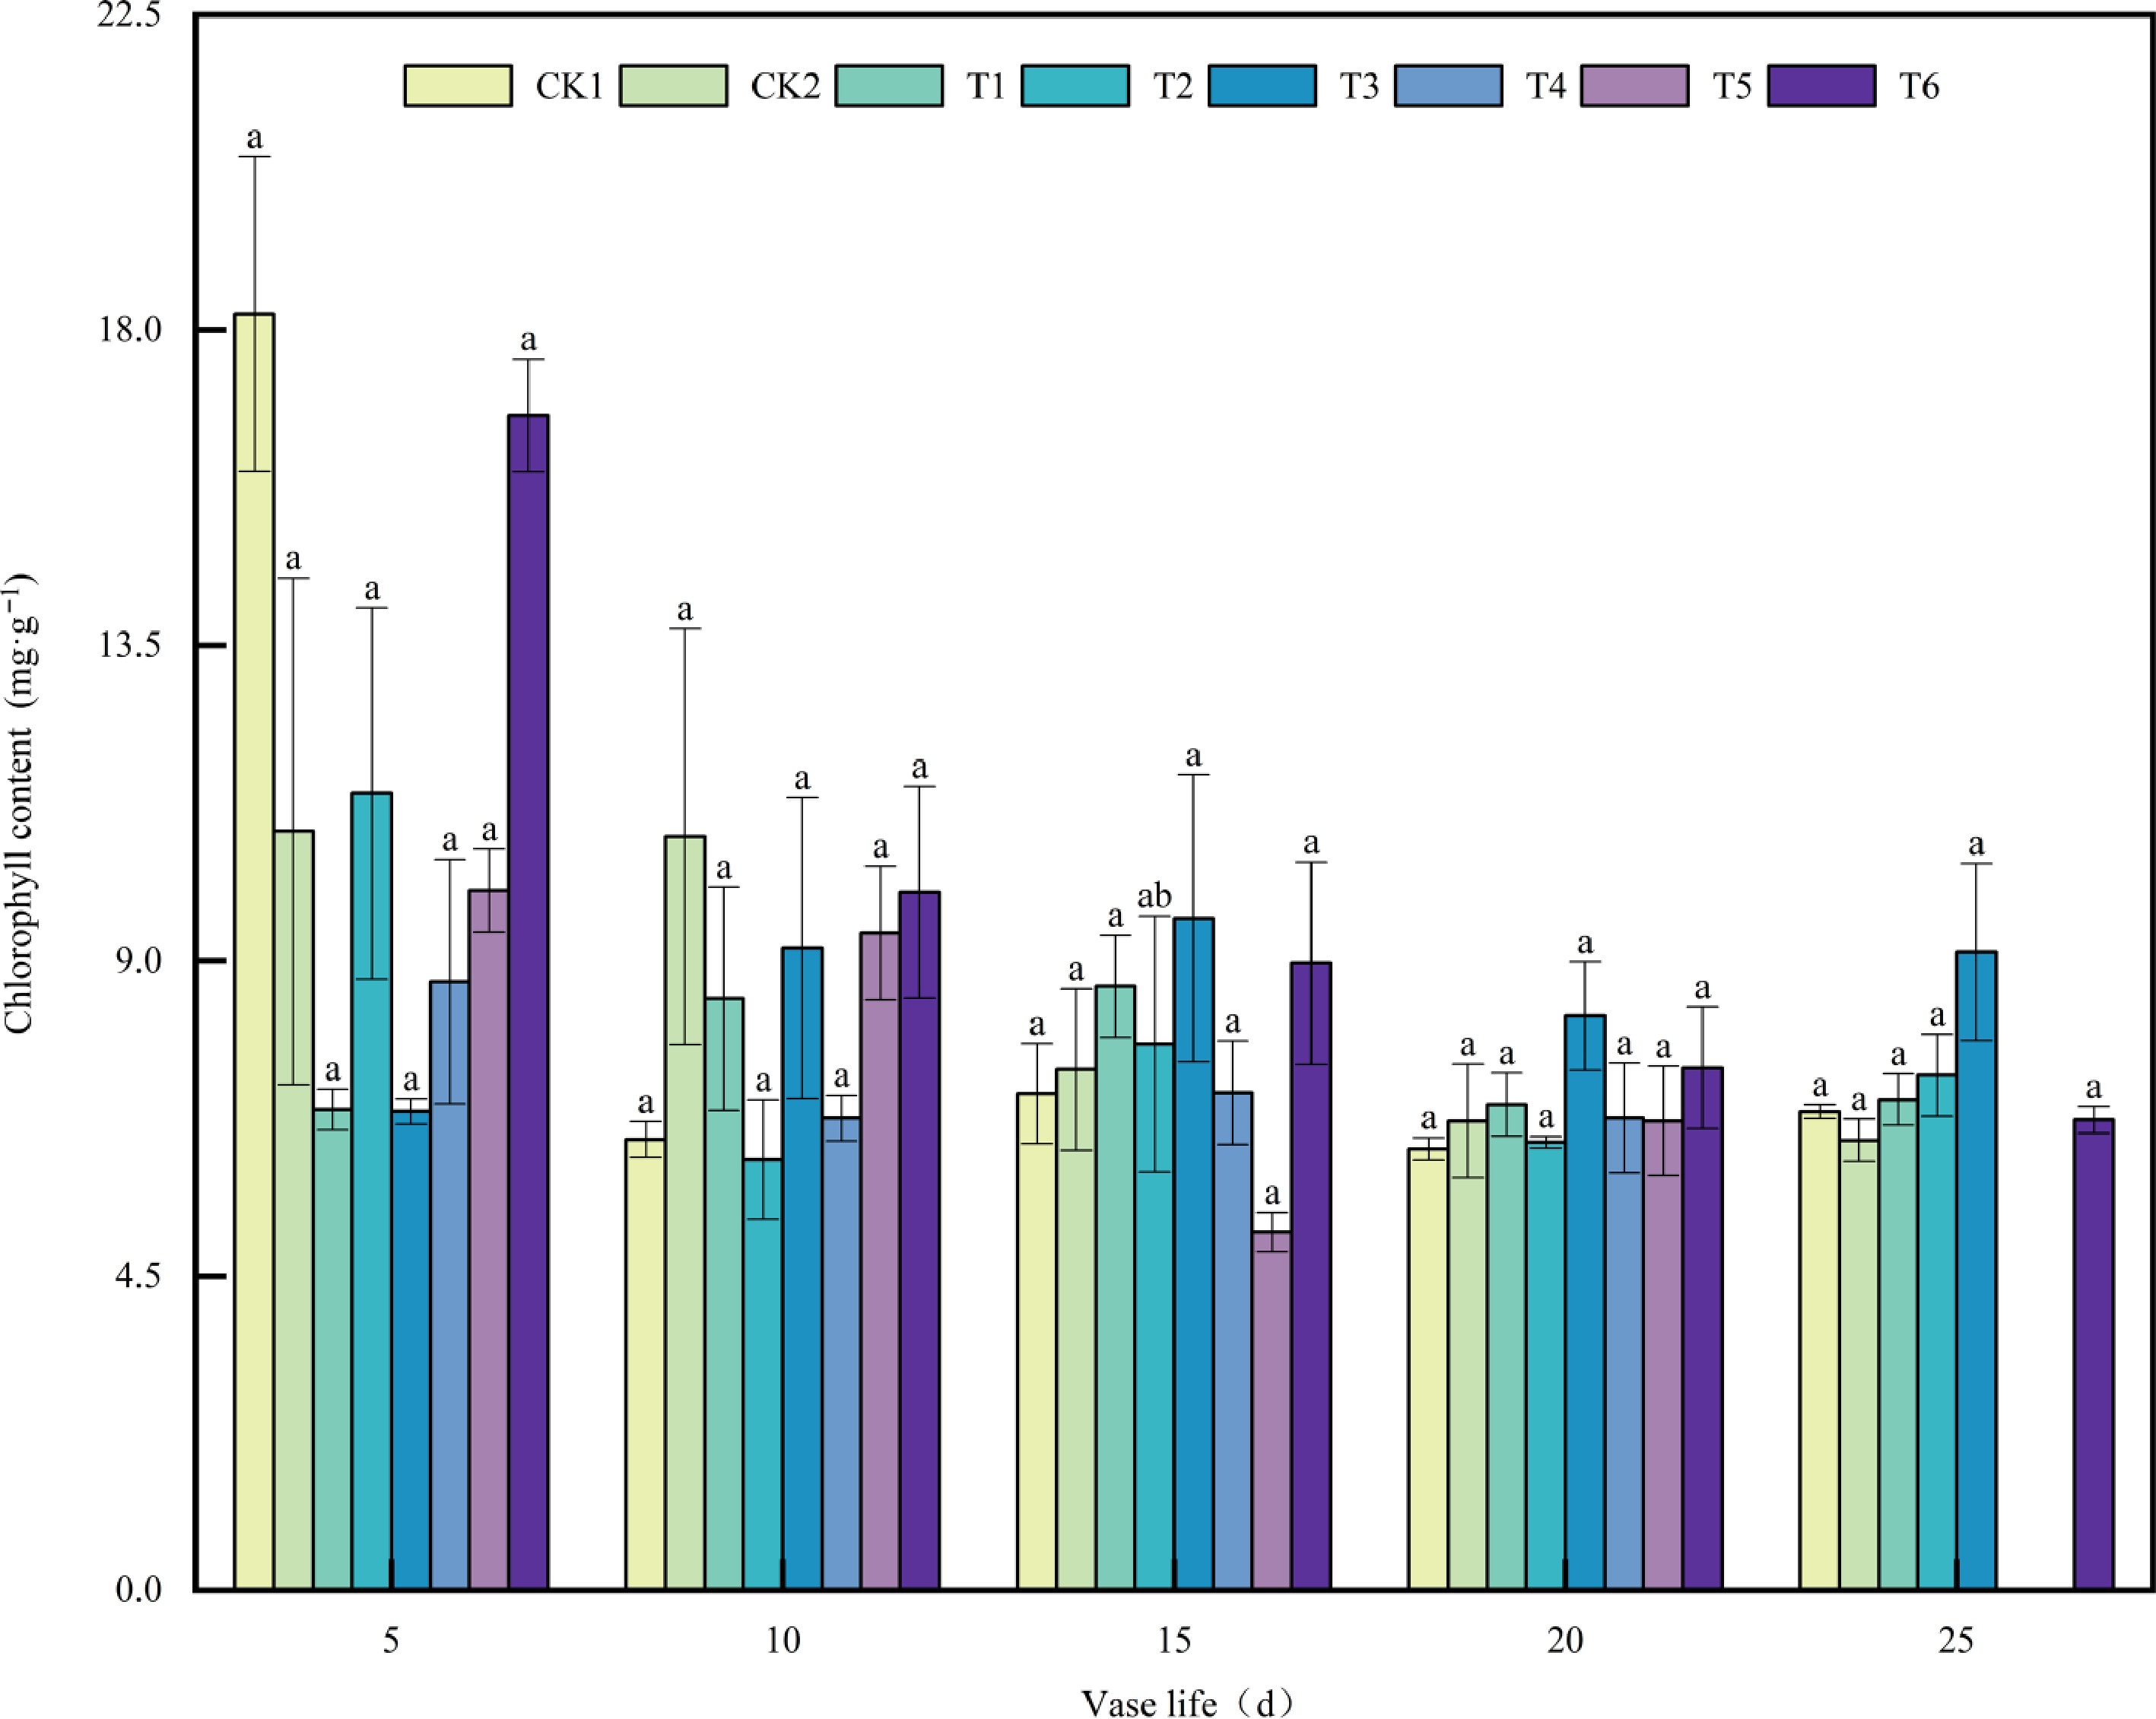
Figure 5.
Effects of plant growth regulators on chlorophyll content in A. andraeanum Cut Flowers. Values are expressed as the mean ± SD (n = 3 biological replicates). Different lowercase letters indicate significant differences according to Tukey's multiple range test (p < 0.05). Treatments: CK1, base solution (20g·L−1 Sucrose + 200 mg·L−18-HQ); CK2, distilled water; T1, base solution + 10 mg·L−1 6-BA; T2, base solution + 20 mg·L−1 6-BA; T3, 30 mg·L−1 6-BA; T4, base solution + 50 mg·L−1 GA3; T5, base solution + 100 mg·L−1 GA3; T6, 150 mg·L−1 GA3.
-
Figure 6.
Morphological changes of cut Anthurium flowers during vase life. (a) Day 5, (b) Day 10, (c) Day 15, (d) Day 20, and (e) Day 25 after vase placement.
-
Treaments Sucrose (g·L−1) 8-HQ (mg·L−1) 6-BA (mg·L−1) GA3 (mg·L−1) CK1 20 200 0 0 CK2 Distilled water T1 20 200 10 0 T2 20 200 20 0 T3 20 200 30 0 T4 20 200 0 50 T5 20 200 0 100 T6 20 200 0 150 Table 1.
Experimental treatment formulations.
-
Treaments Vase life (d) CK1 22.17 ± 0.48c CK2 23.17 ± 0.60abc T1 23.83 ± 0.60abc T2 22.67 ± 0.49bc T3 25.33 ± 0.42a T4 18.50 ± 0.43d T5 18.33 ± 0.67d T6 24.83 ± 0.48ab Data are expressed as mean ± standard deviation. Different lowercase letters indicate significant differences at p < 0.05. Table 2.
Effects of plant growth regulators on the vase life of A. andraeanum cut flowers.
Figures
(6)
Tables
(2)