-
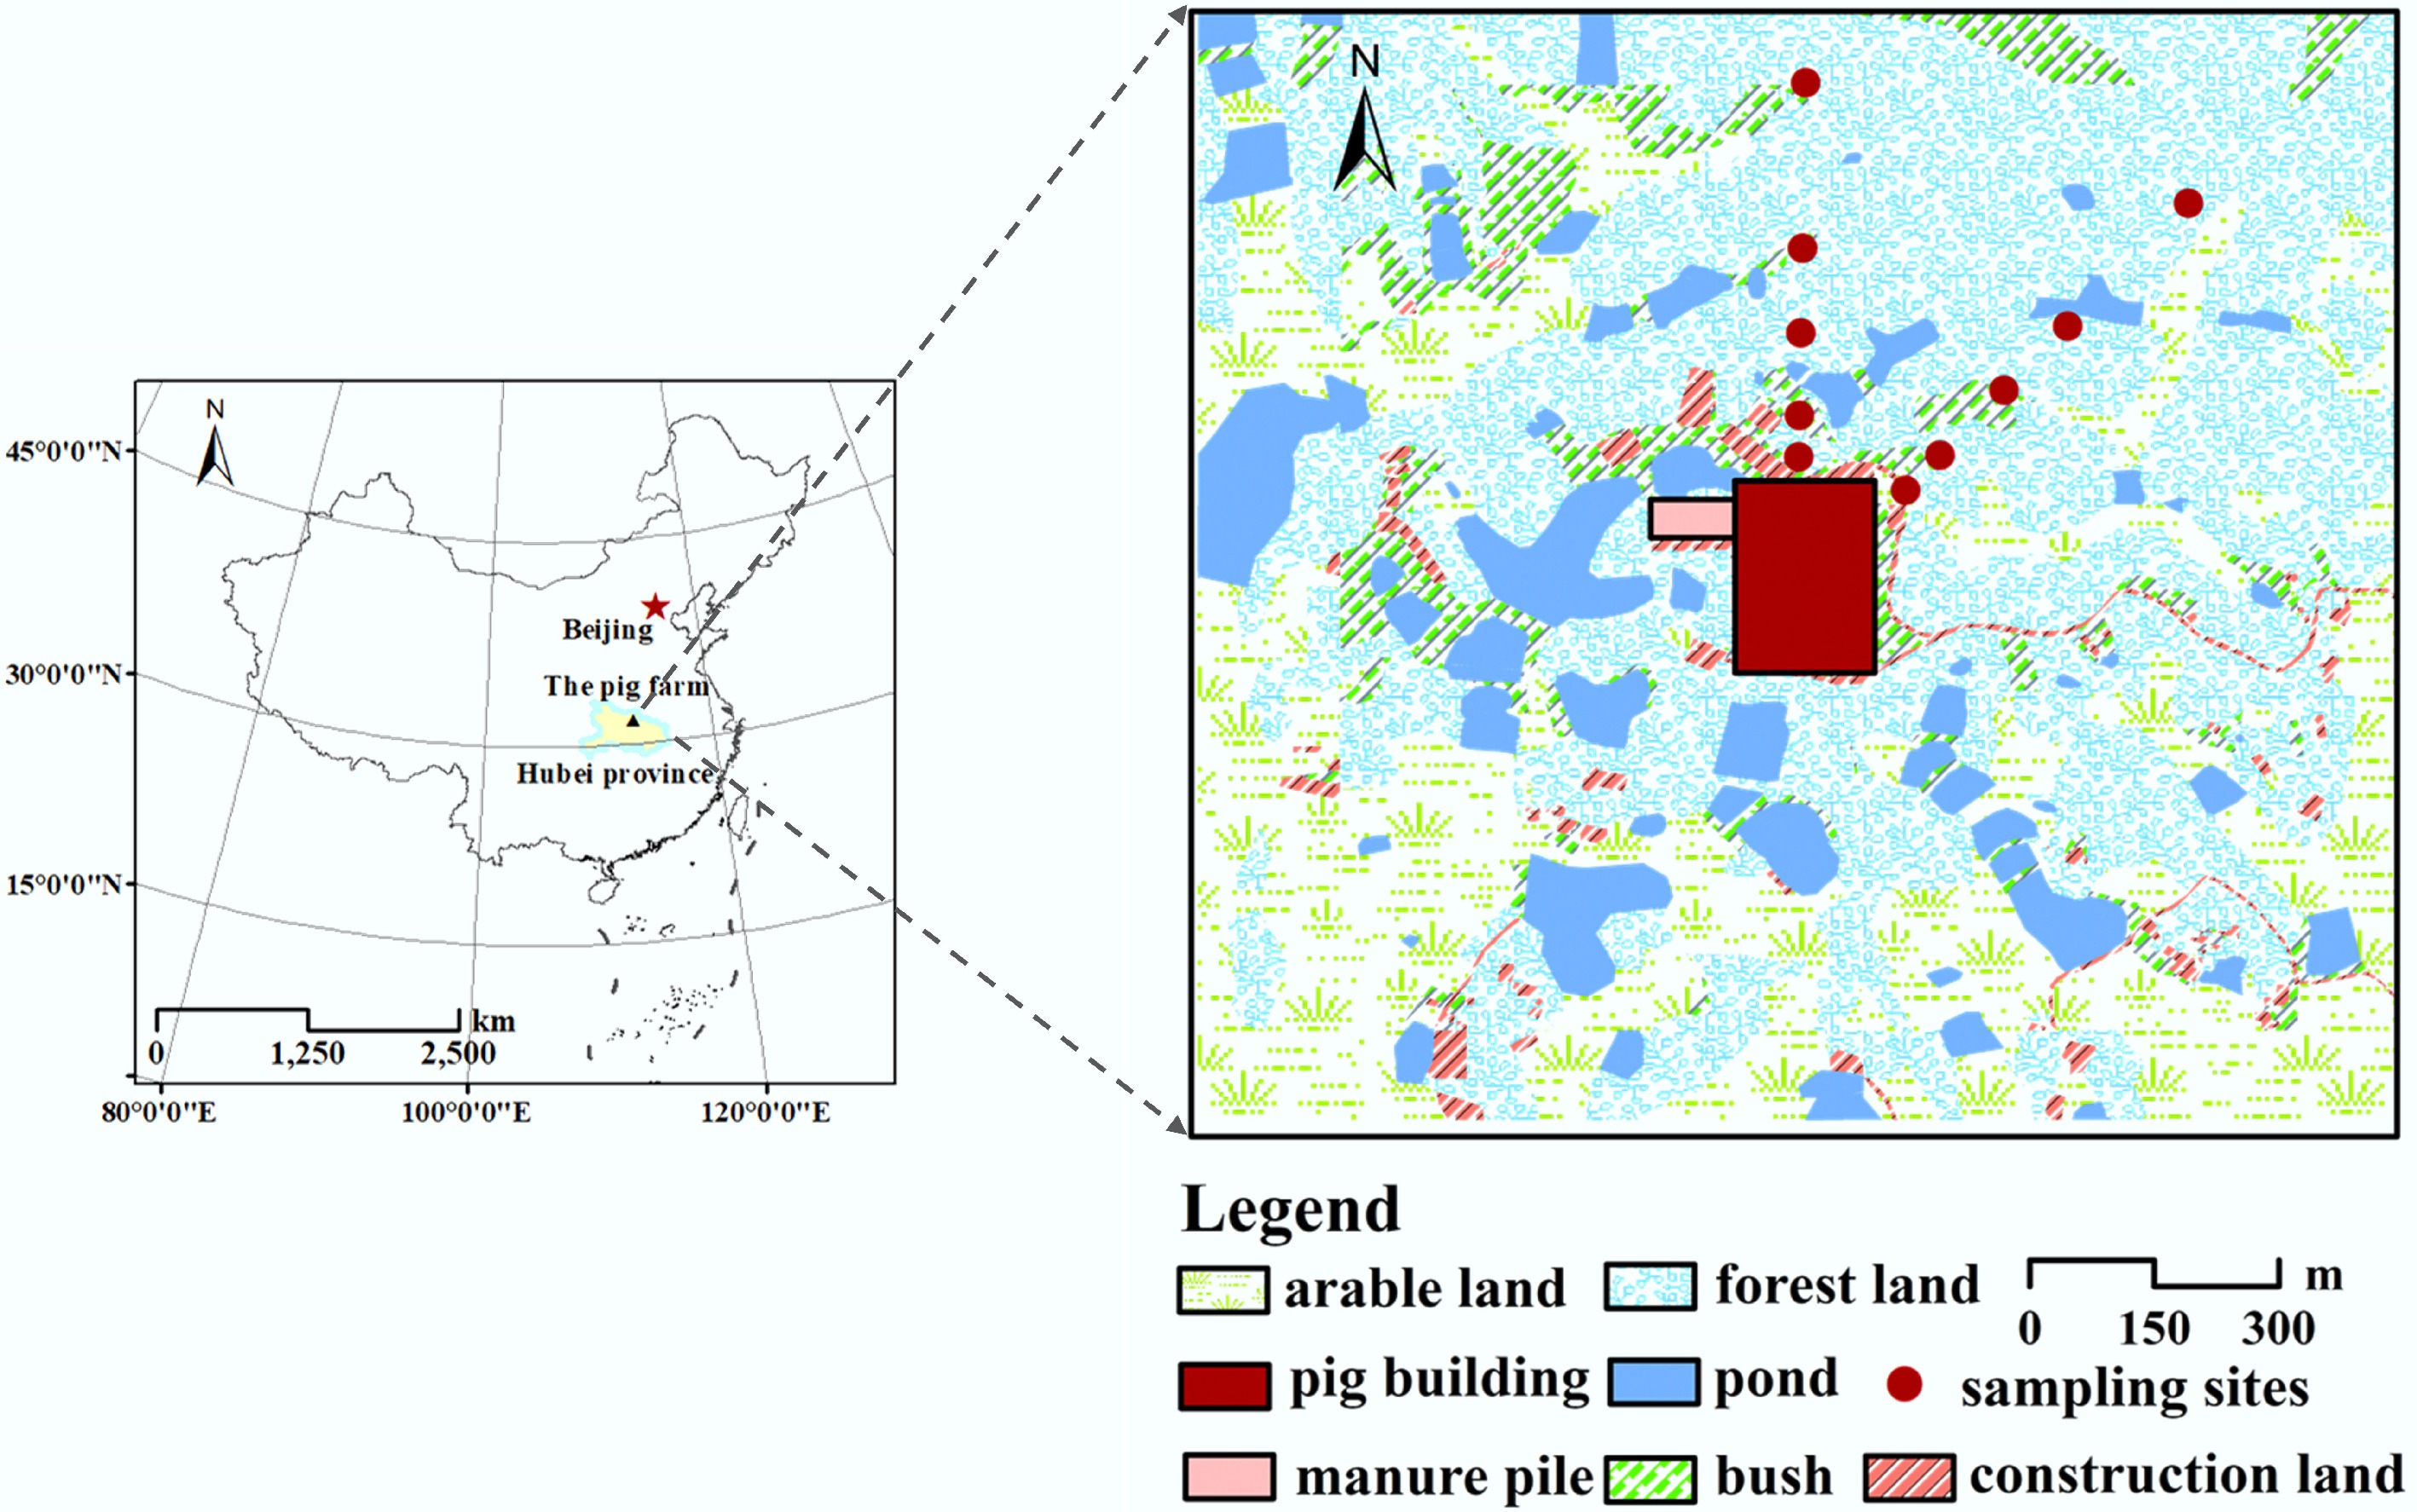
Figure 1.
The geographical location of the pig farm.
-
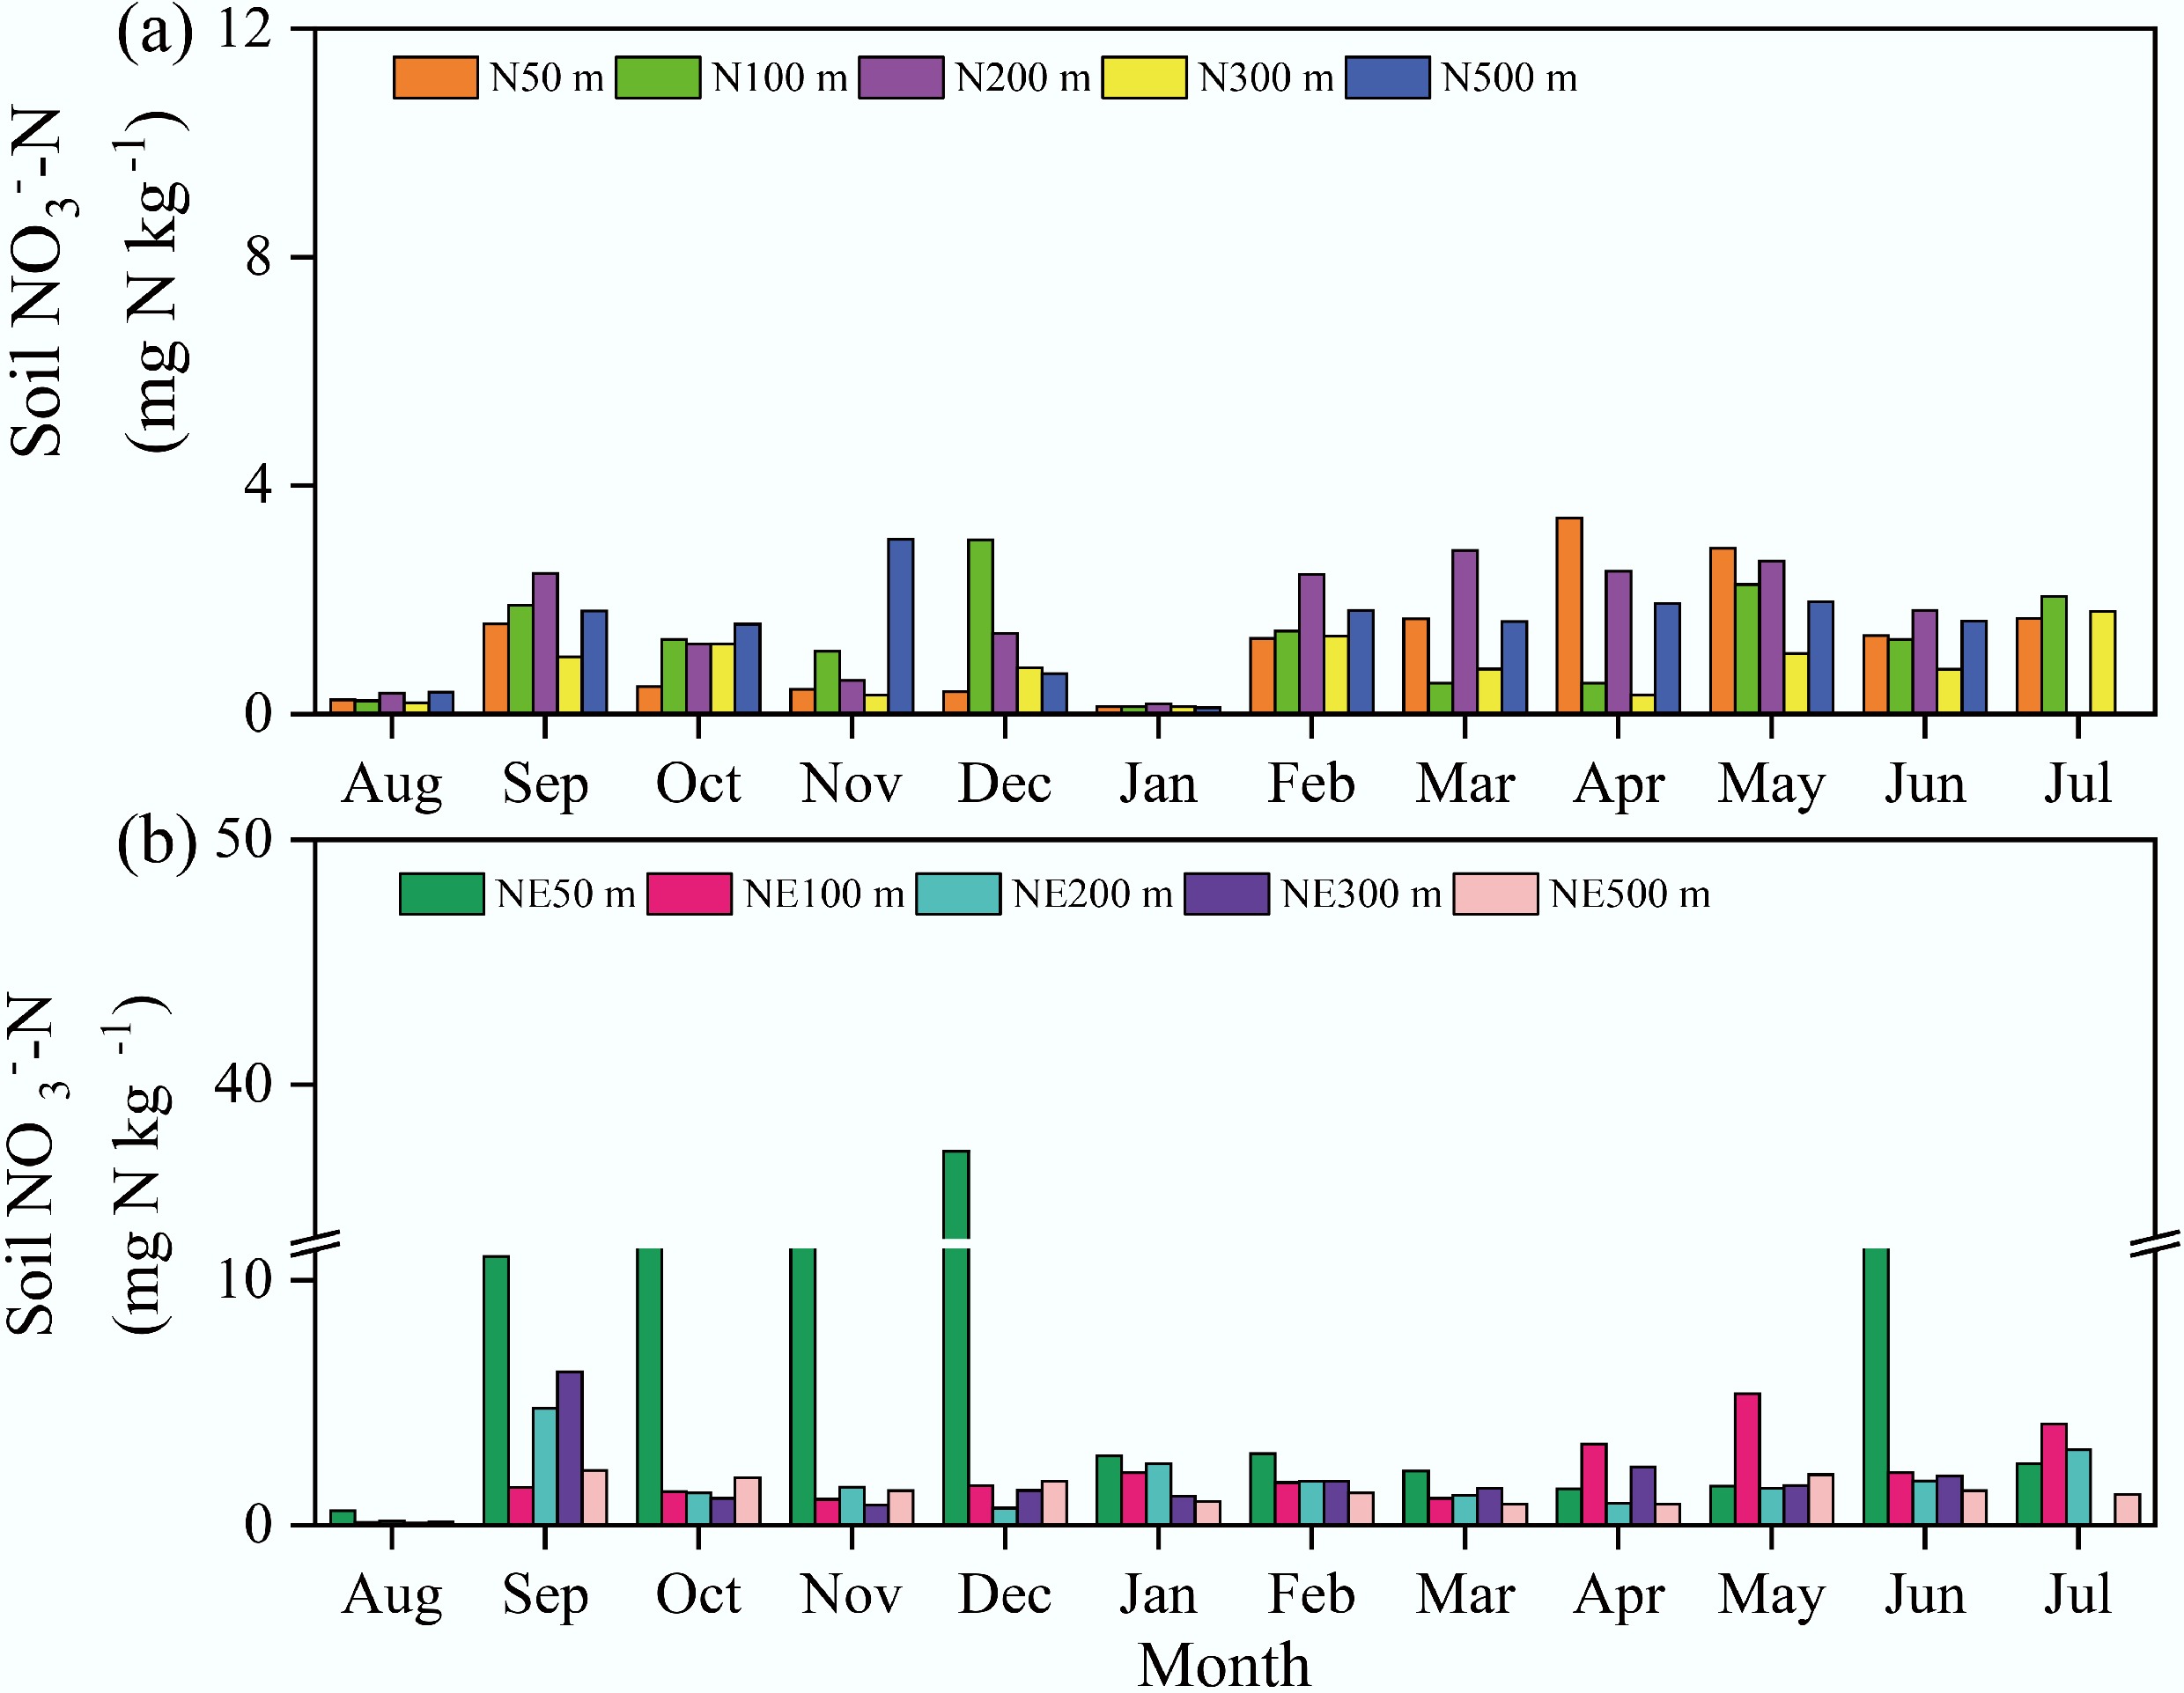
Figure 2.
Soil NO3−-N concentrations in the N and NE transects of the pig farm from August 2018 to July 2019.
-
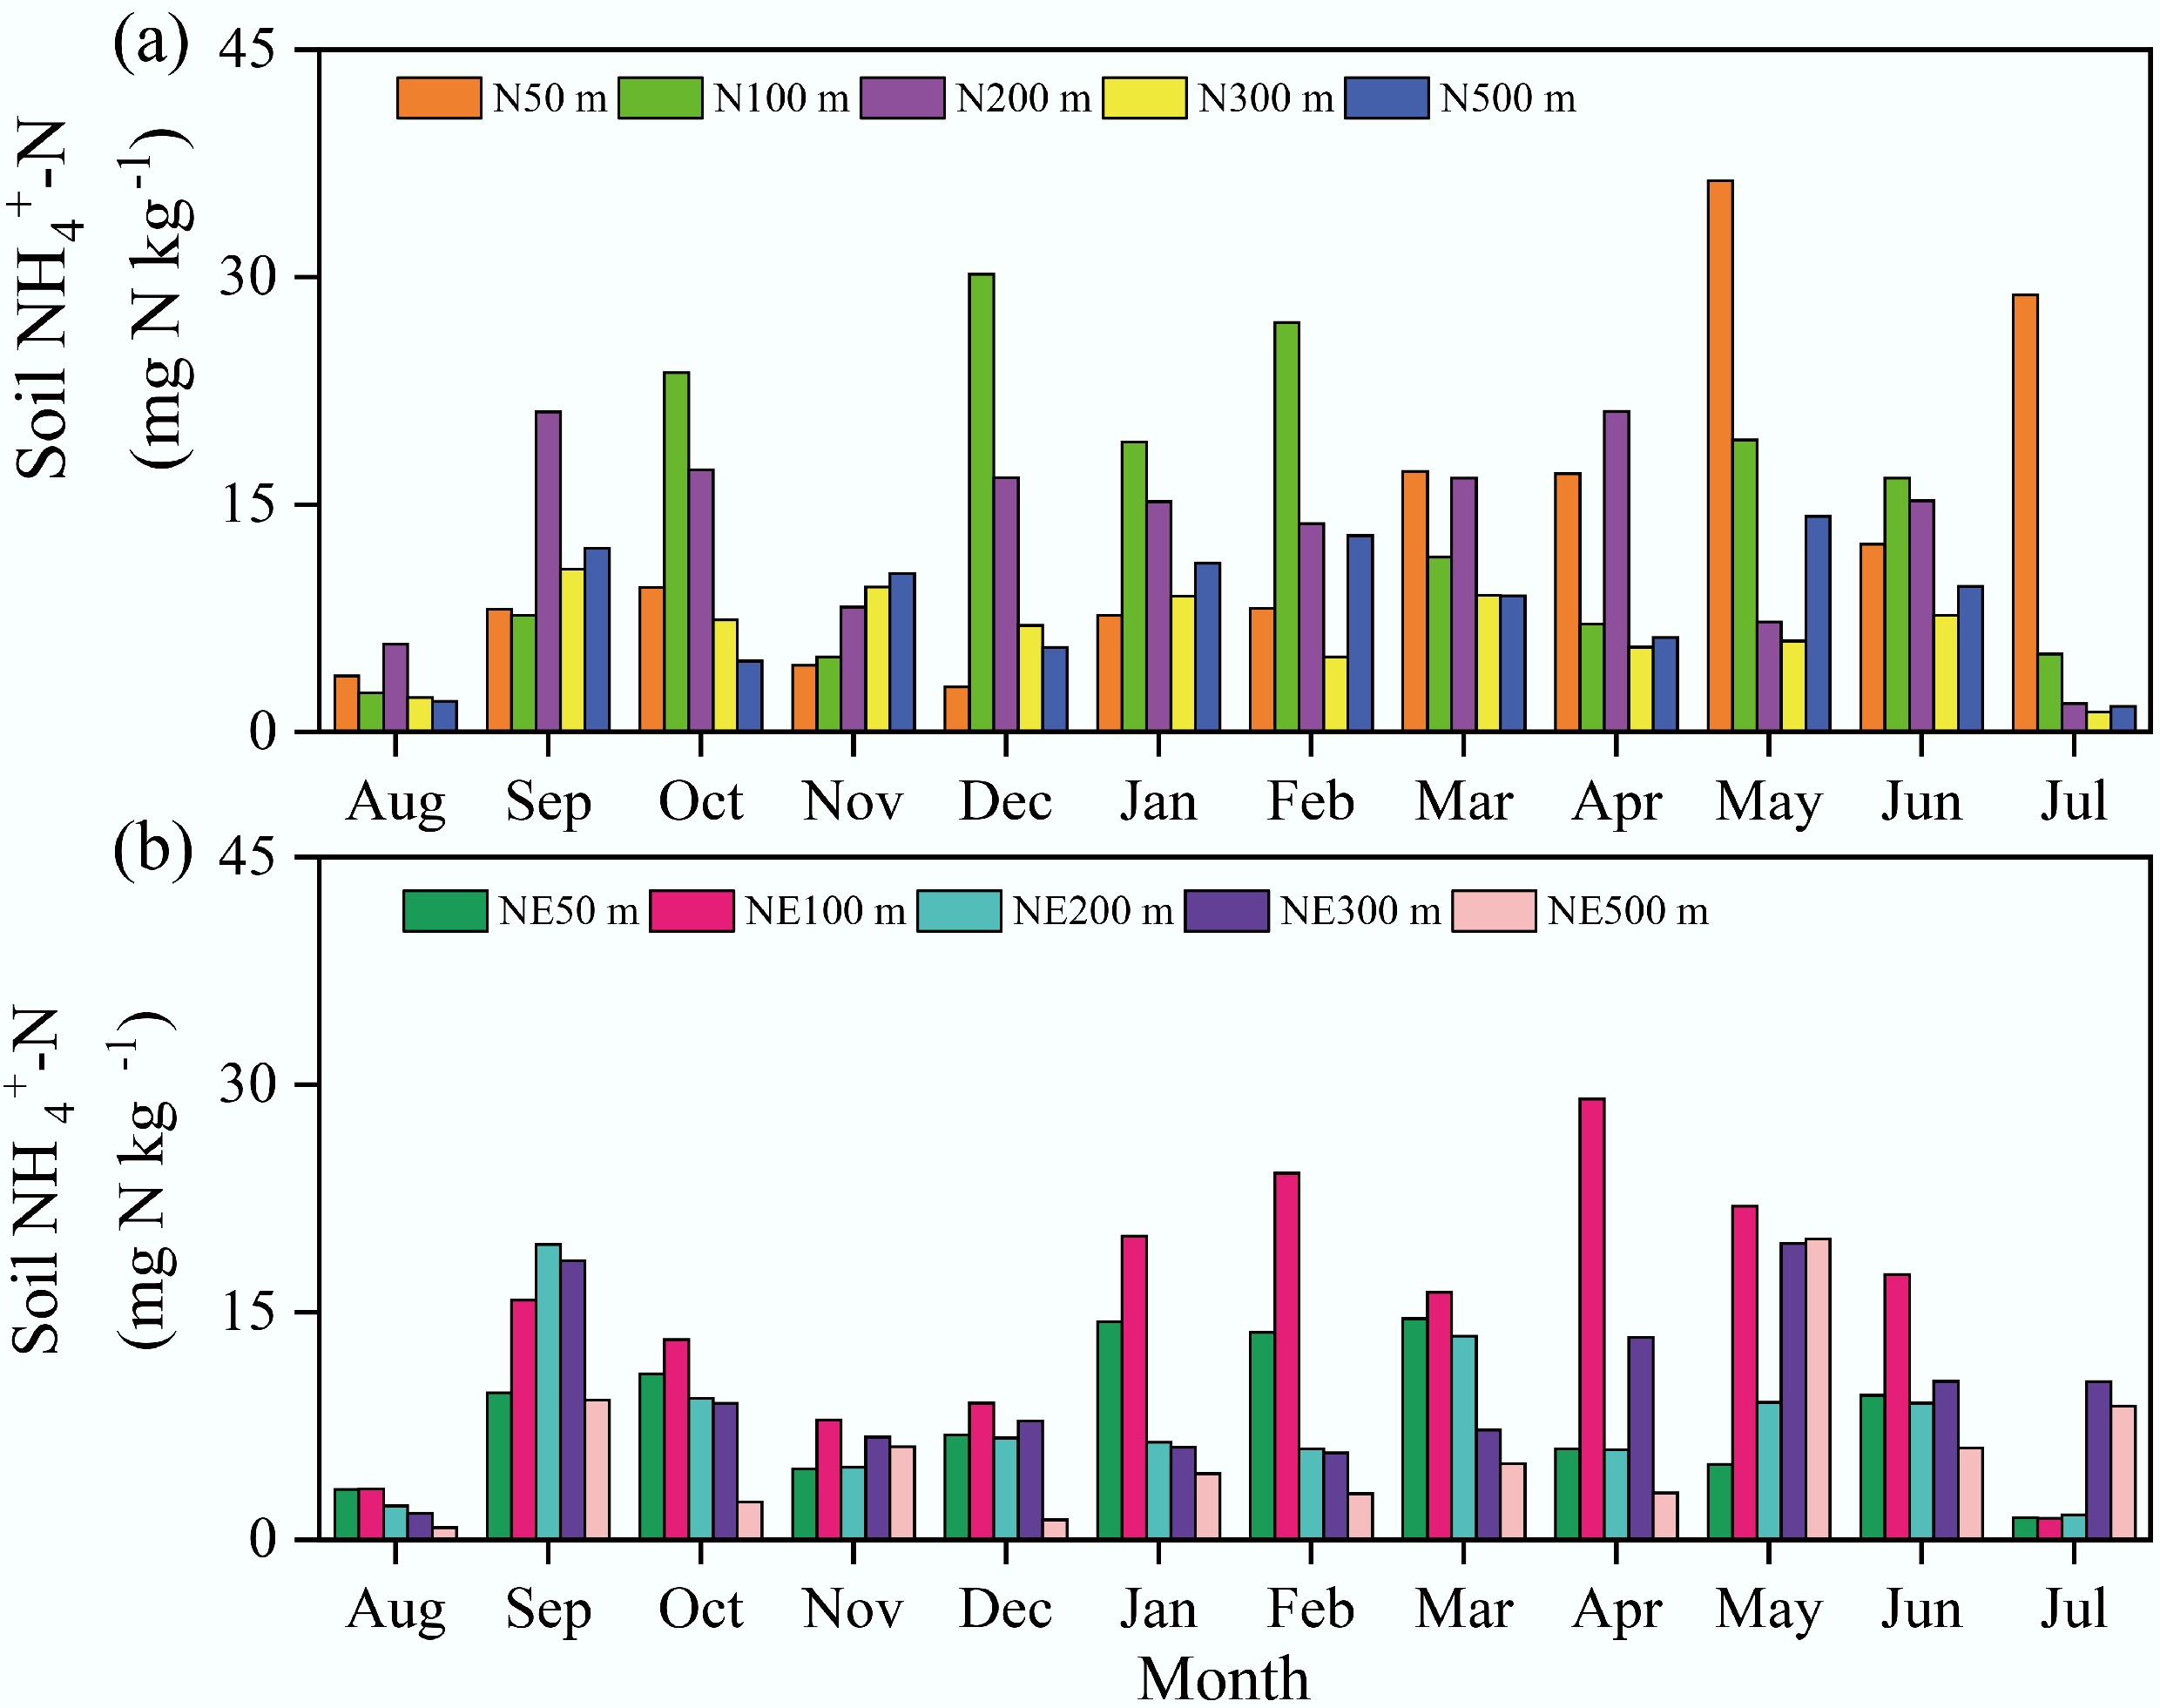
Figure 3.
Soil NH4+-N concentrations in the N and NE transects of the pig farm from August 2018 to July 2019.
-
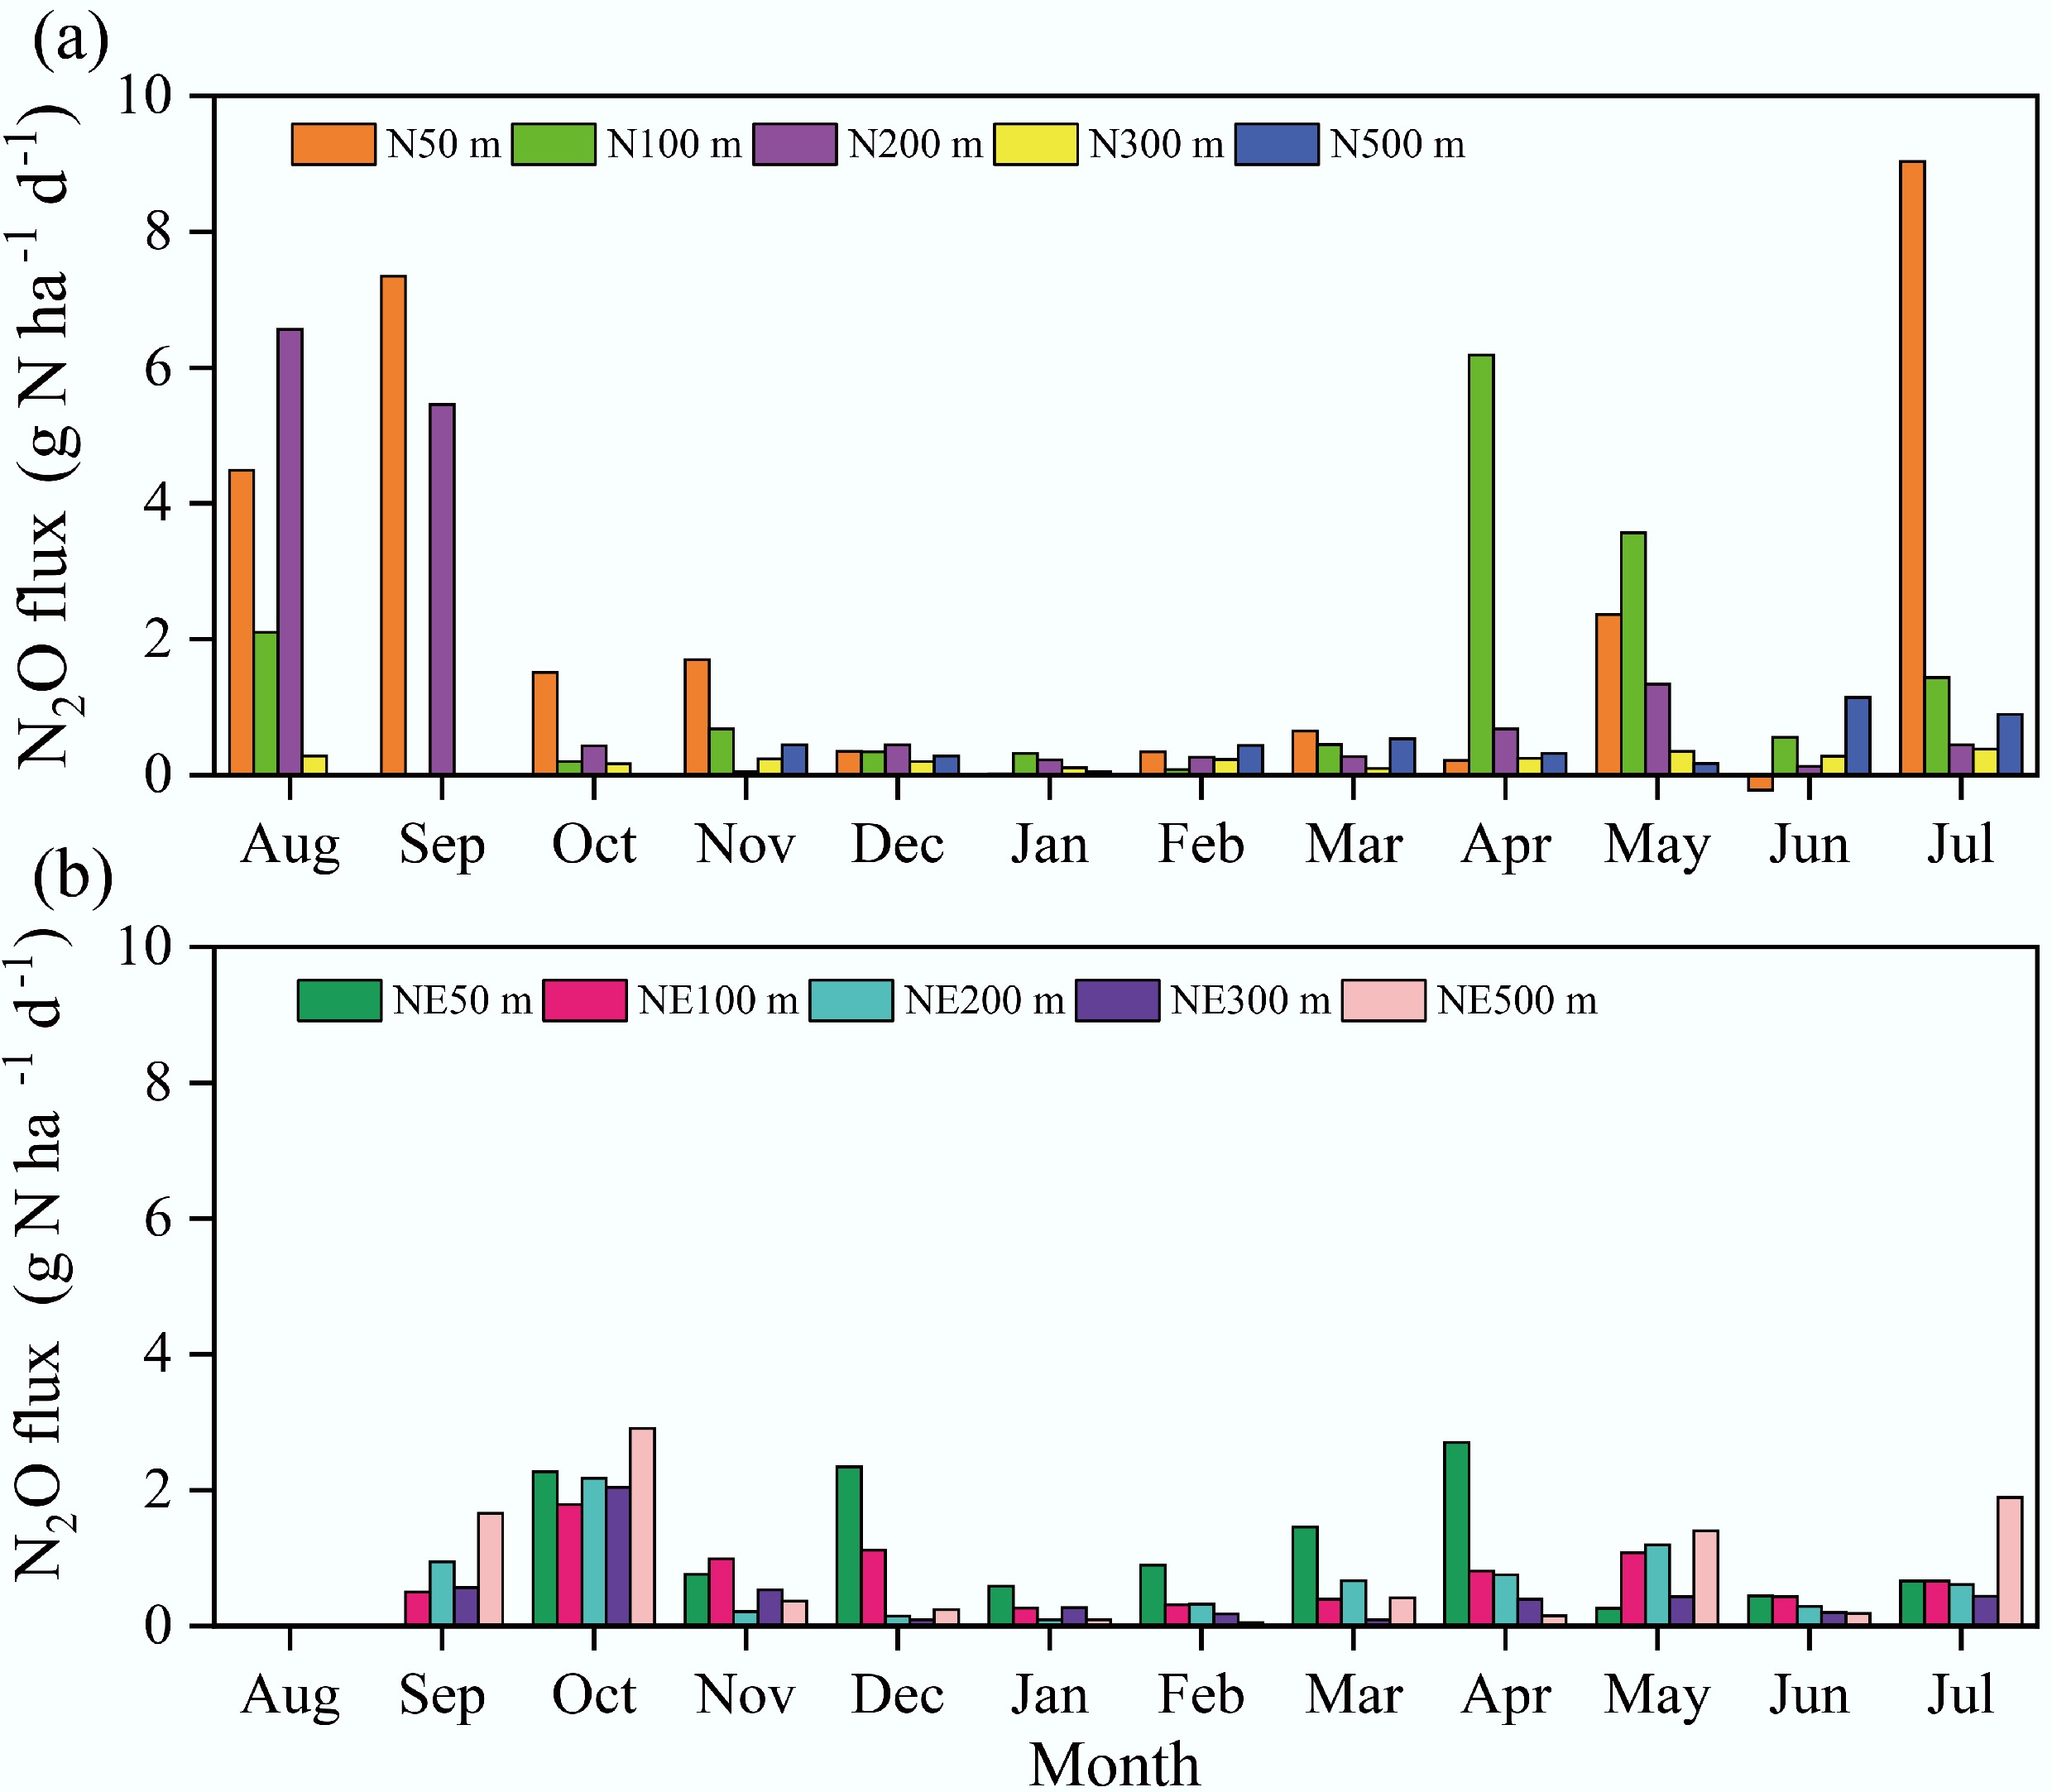
Figure 4.
Soil N2O emissions in the N and NE transects of the pig farm from August 2018 to July 2019.
-
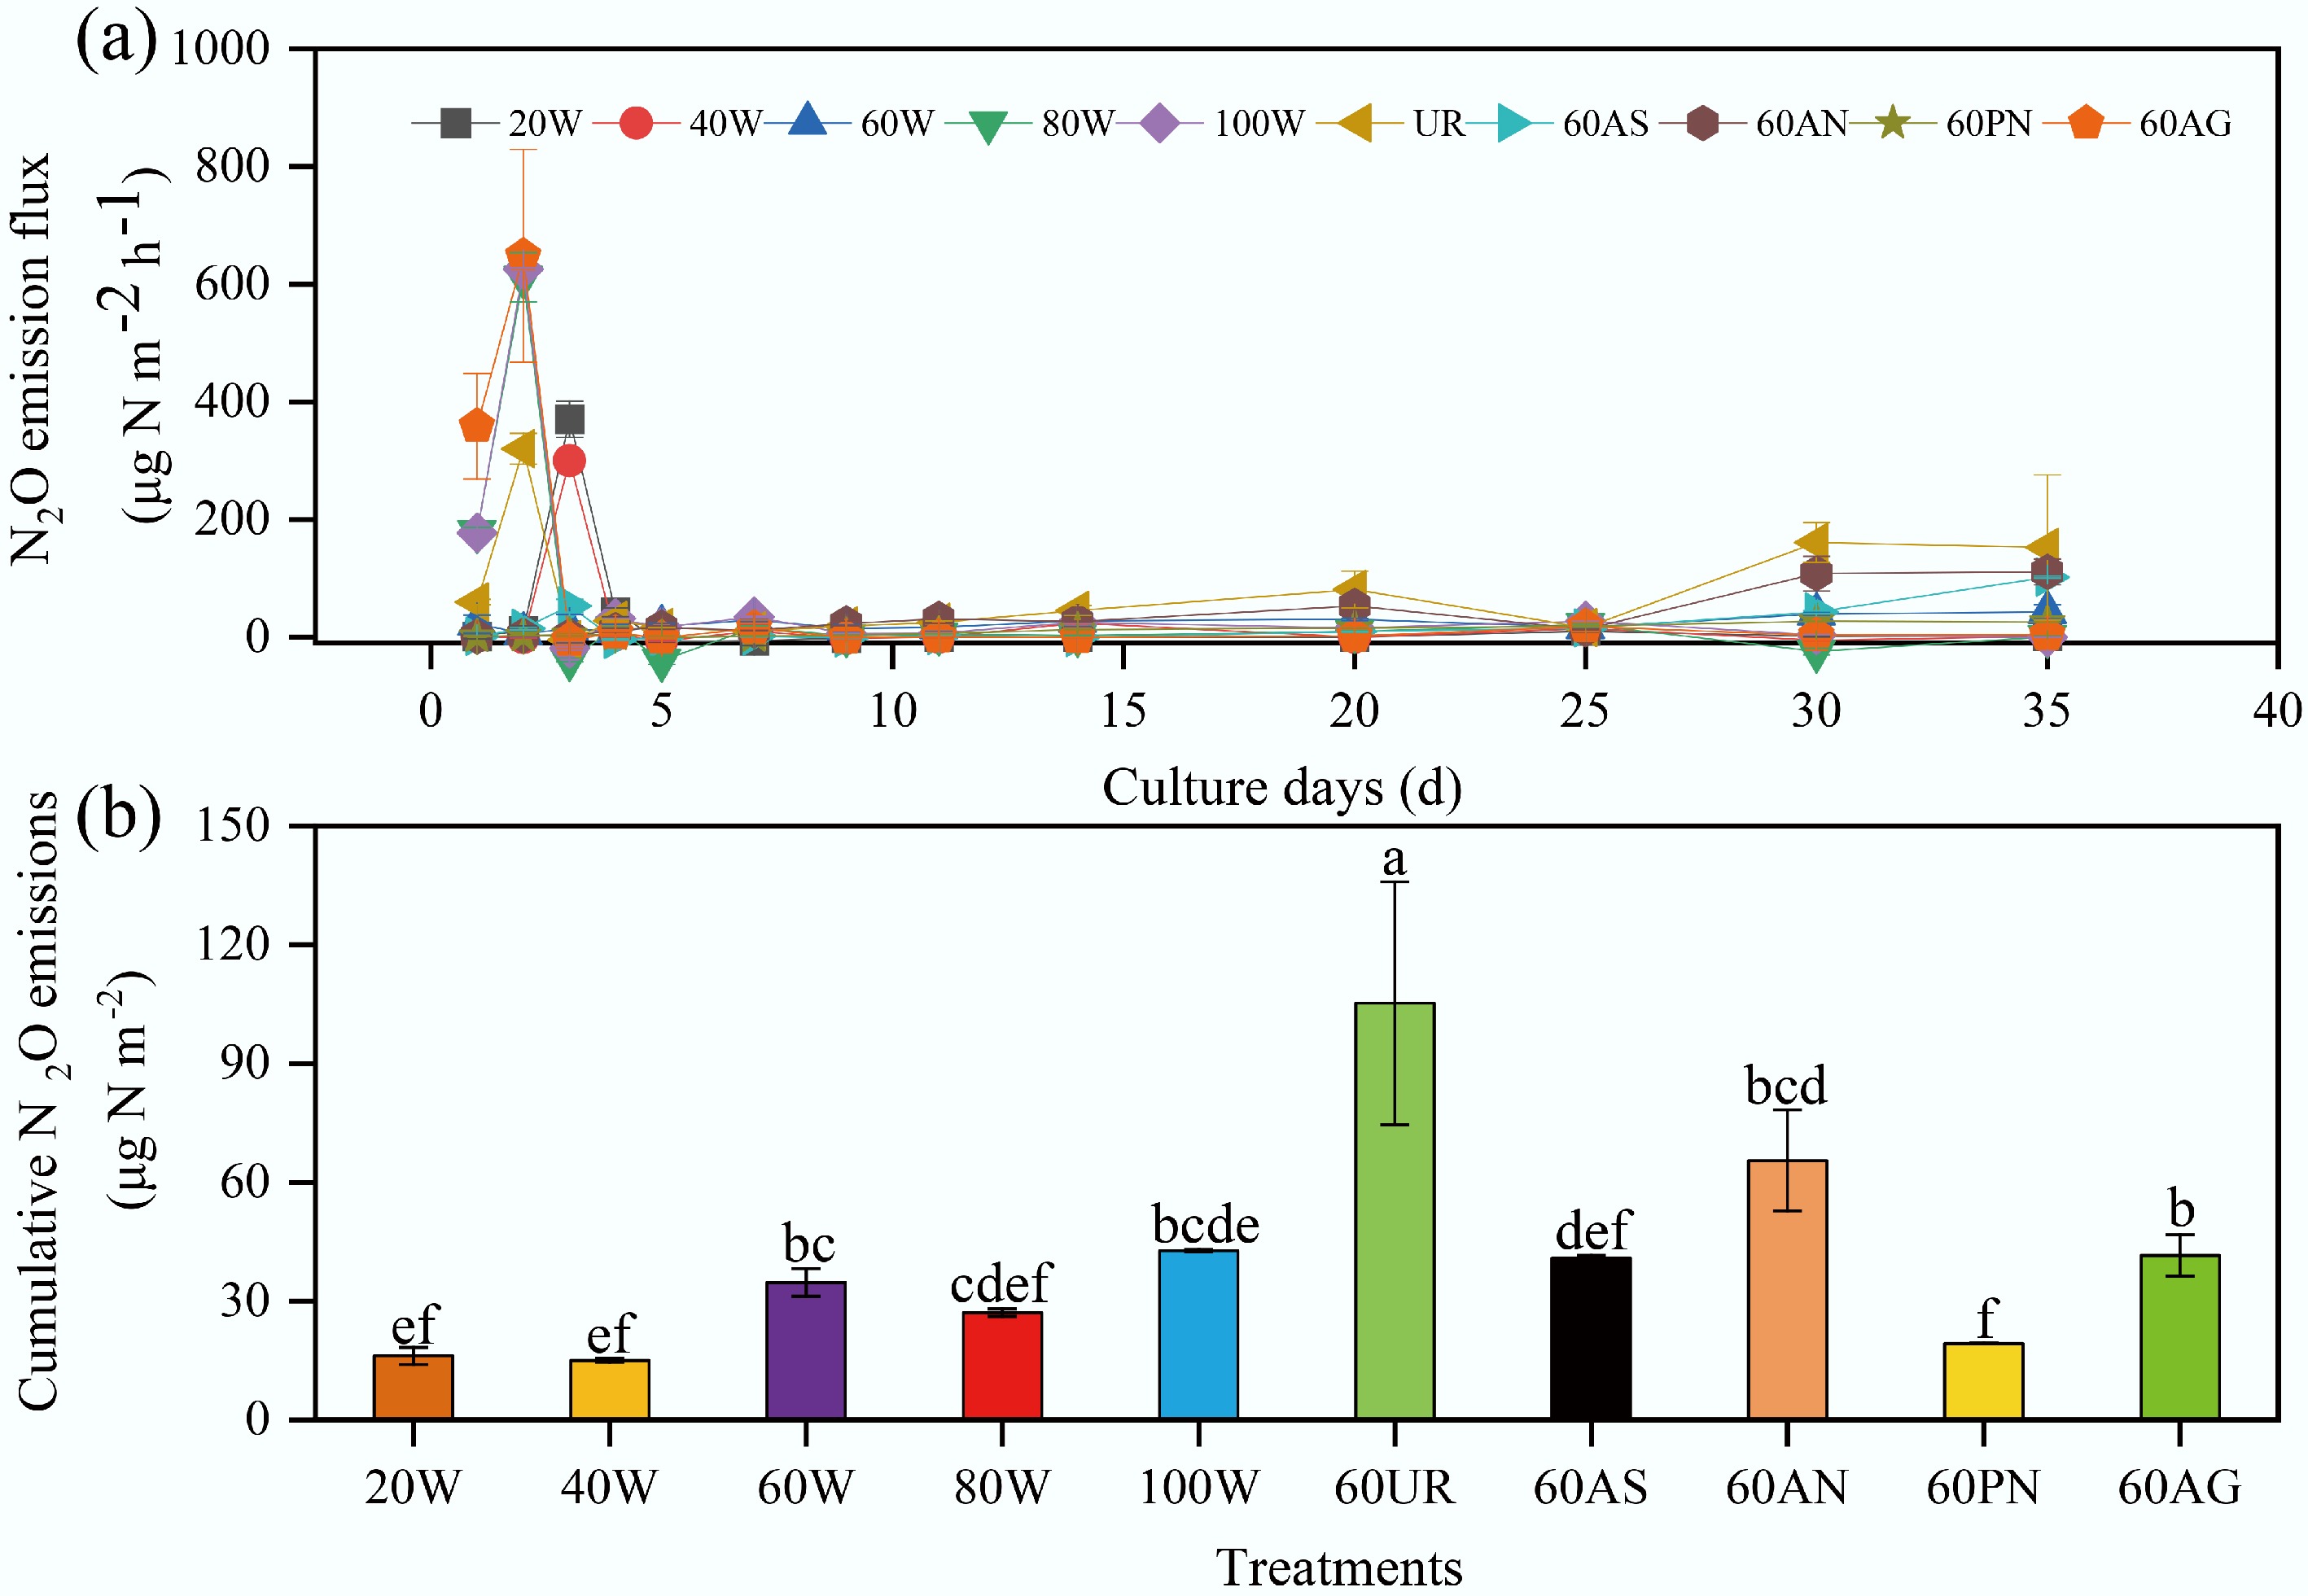
Figure 5.
(a) Soil N2O emission fluxes under different treatments. (b) Cumulative N2O emissions under different treatments. The abbreviations in the figure denote: 20 W−20% WFPS, 40 W−40% WFPS, 60 W−60% WFPS, 80 W−80% WFPS, 100 W−100% WFPS, 60UR−60% WFPS + urea, 60AS−60% WFPS + ammonium sulfate, 60AN represents−60% WFPS + ammonium nitrate, 60PN represents–60% WFPS + potassium nitrate, and 60AG represents–60% WFPS + glucose.
-
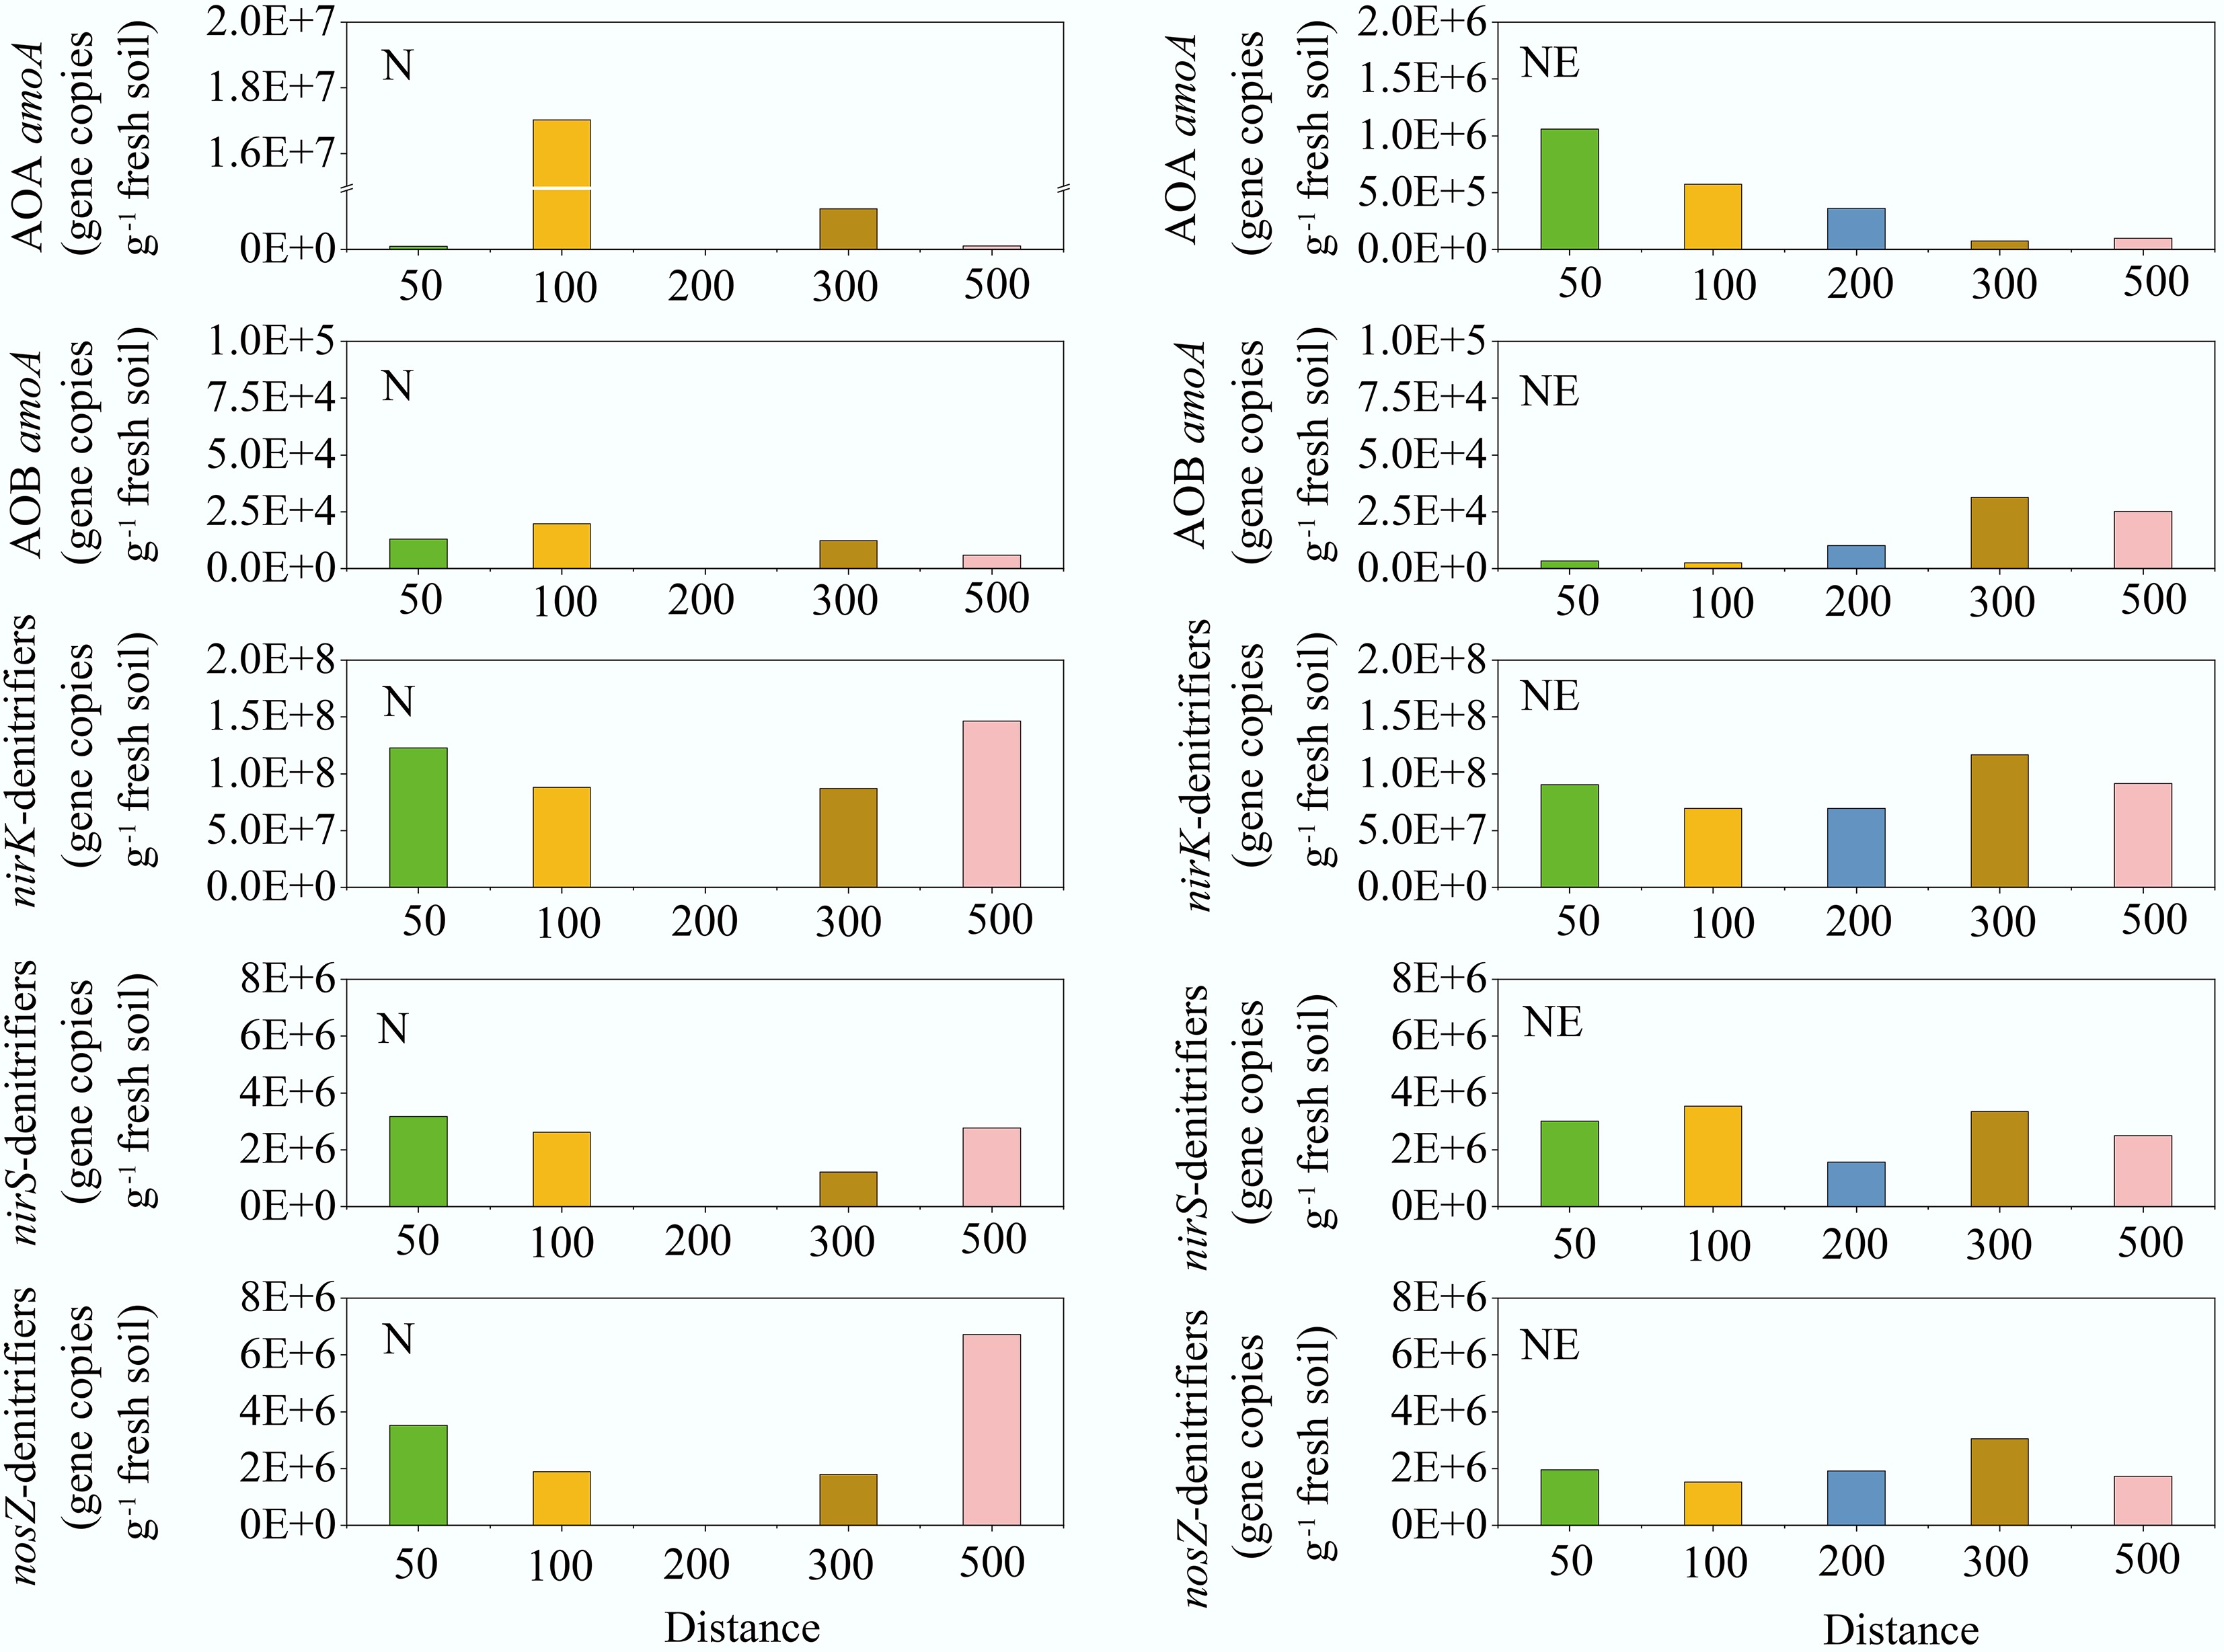
Figure 6.
The abundances of AOA amoA, AOB amoA, nirS, nirK, and nosZ genes in the N and NE transects of the pig farm.
-
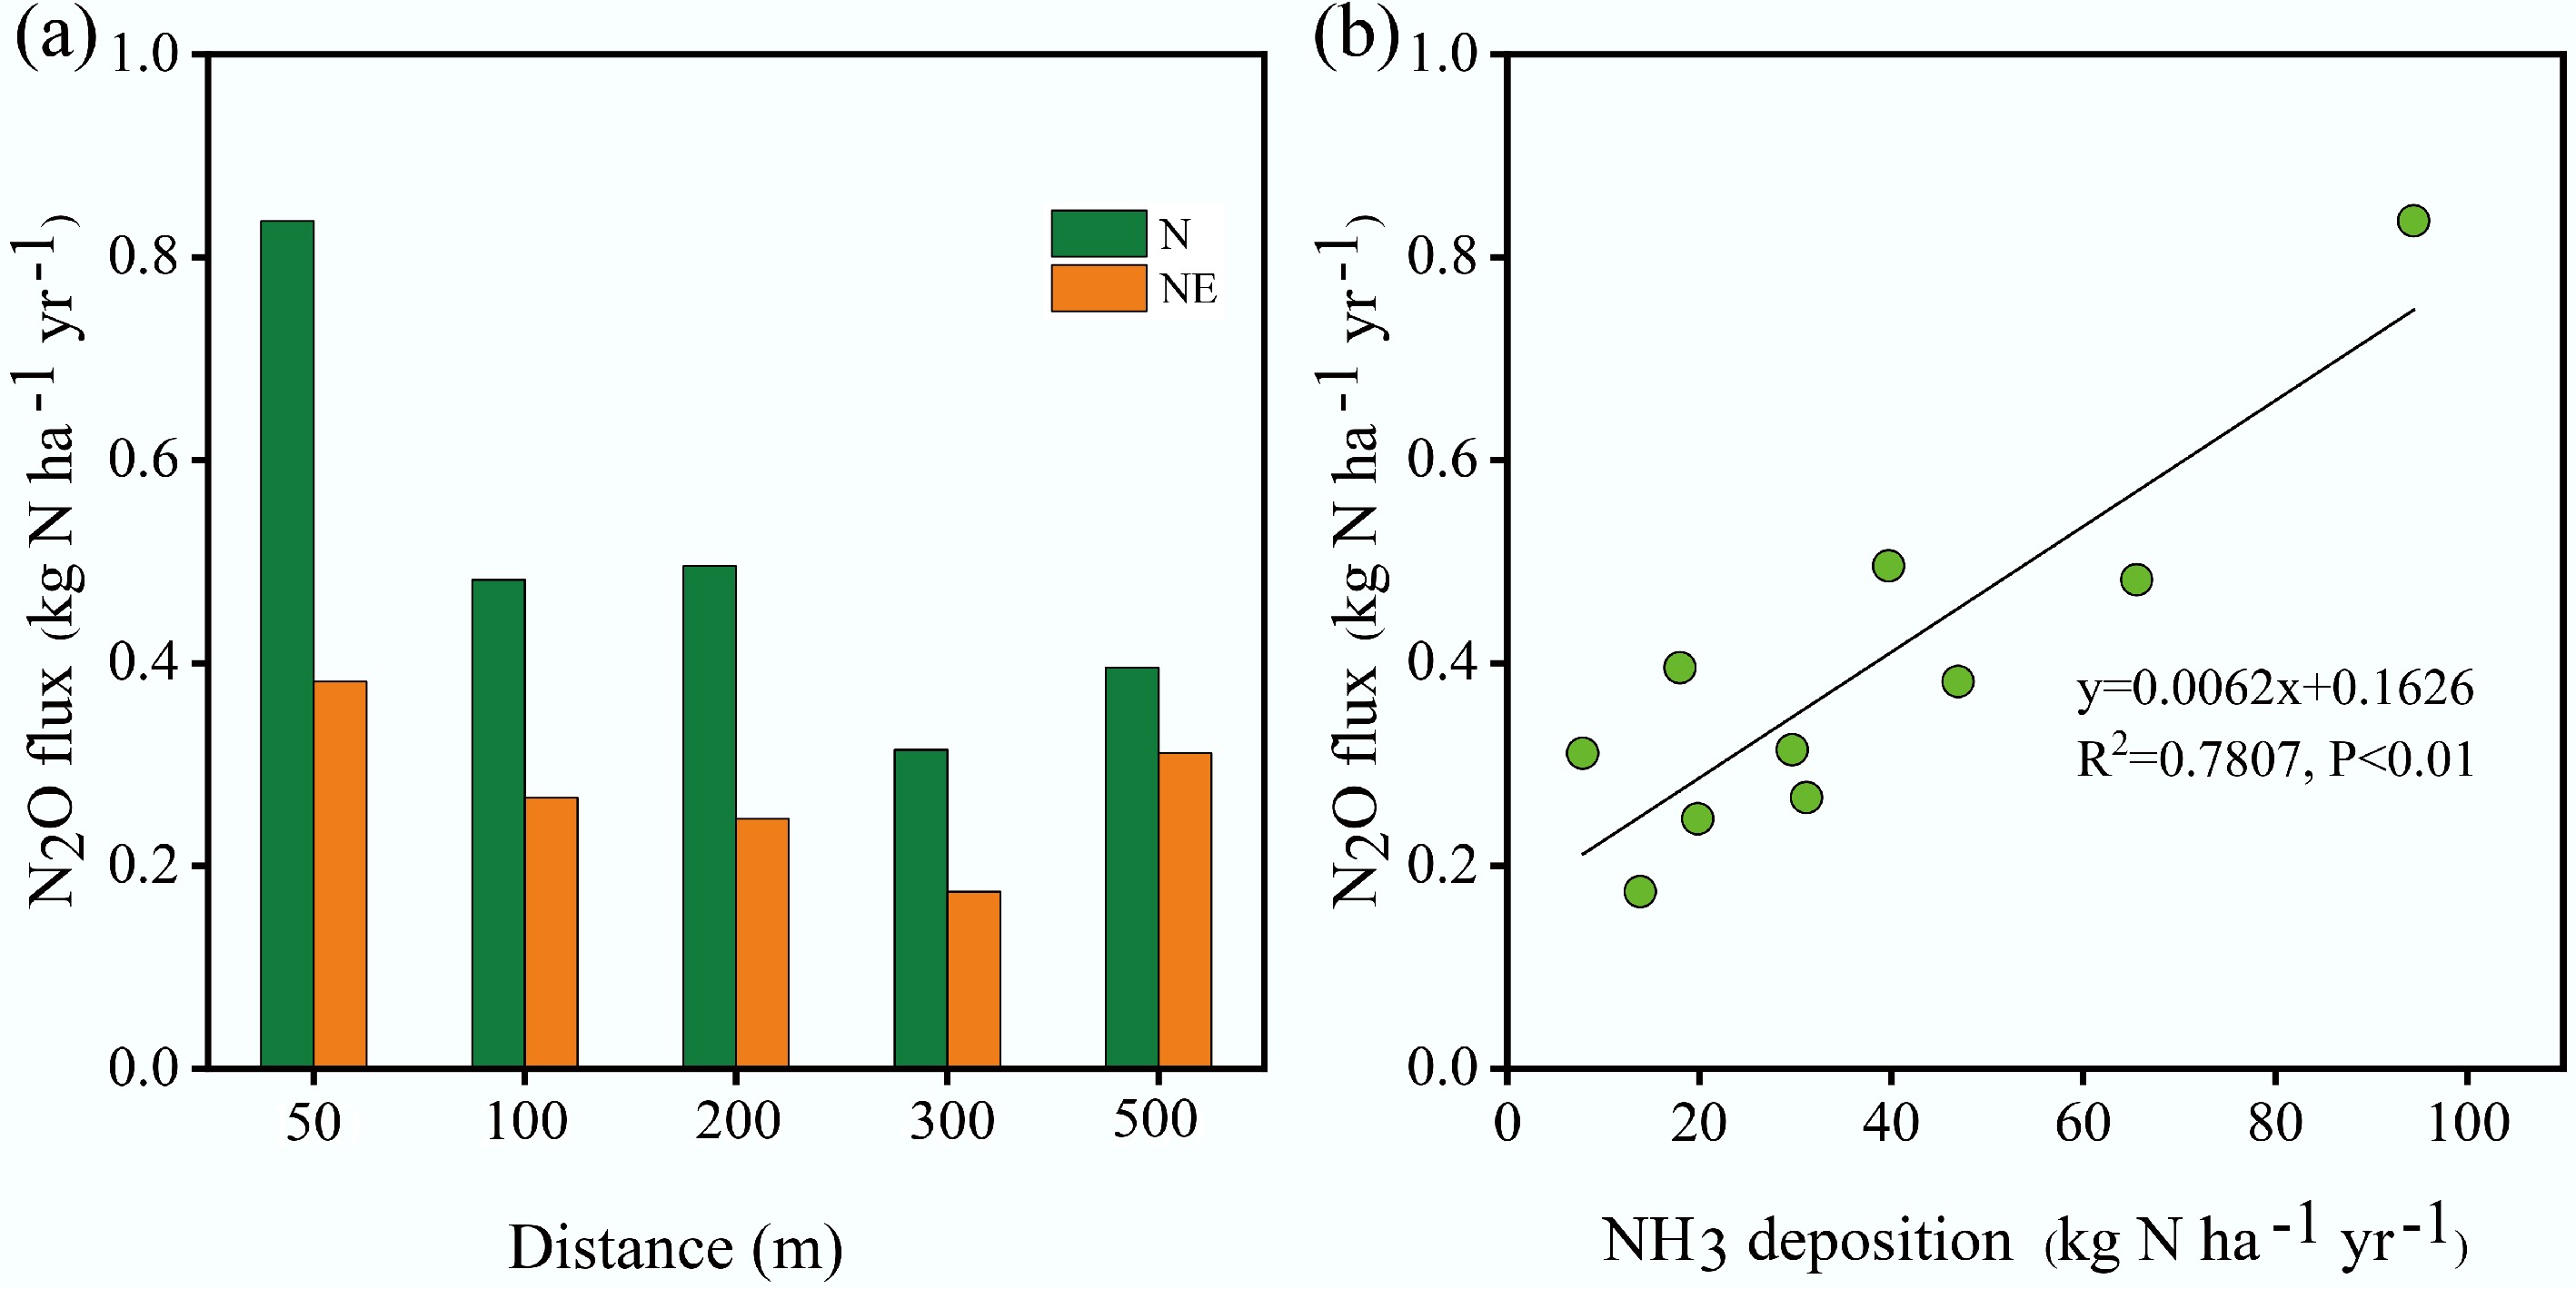
Figure 7.
(a) N2O flux at different distances from the pig farm along the N and NE transects. (b) Relationship between NH3 deposition and N2O flux.
Figures
(7)
Tables
(0)