-
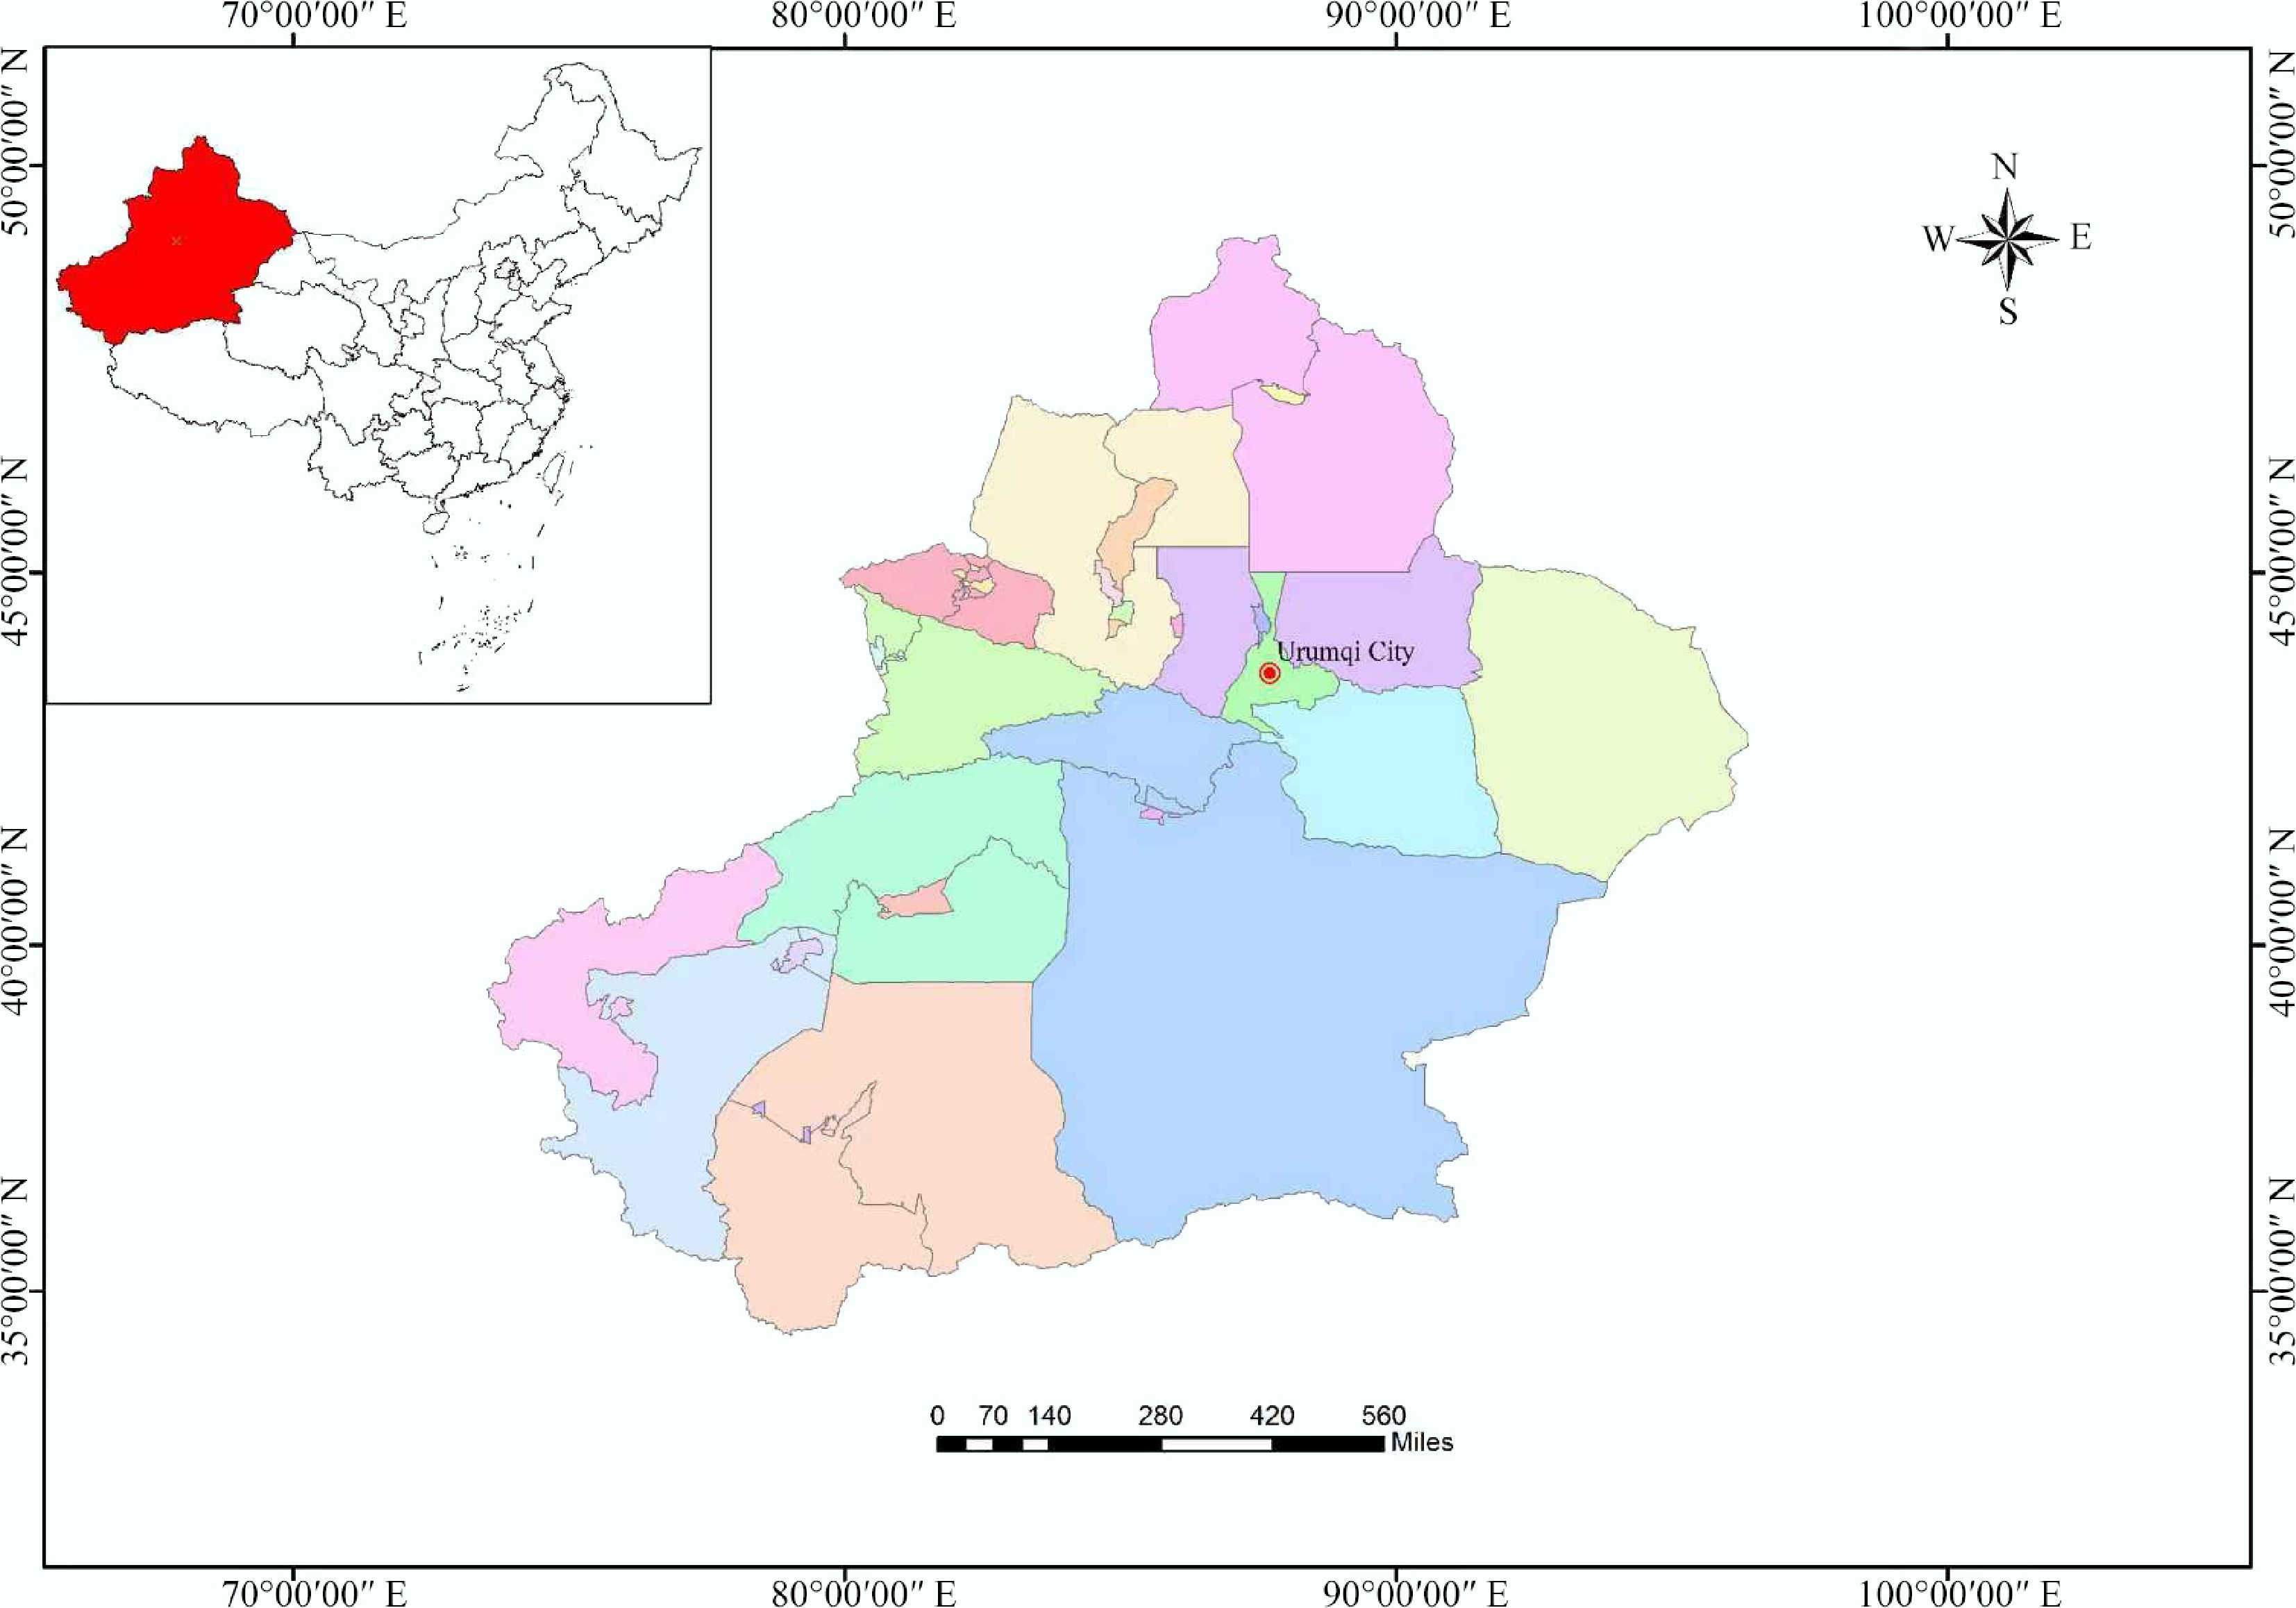
Figure 1.
Map of Xinjiang Province.
-
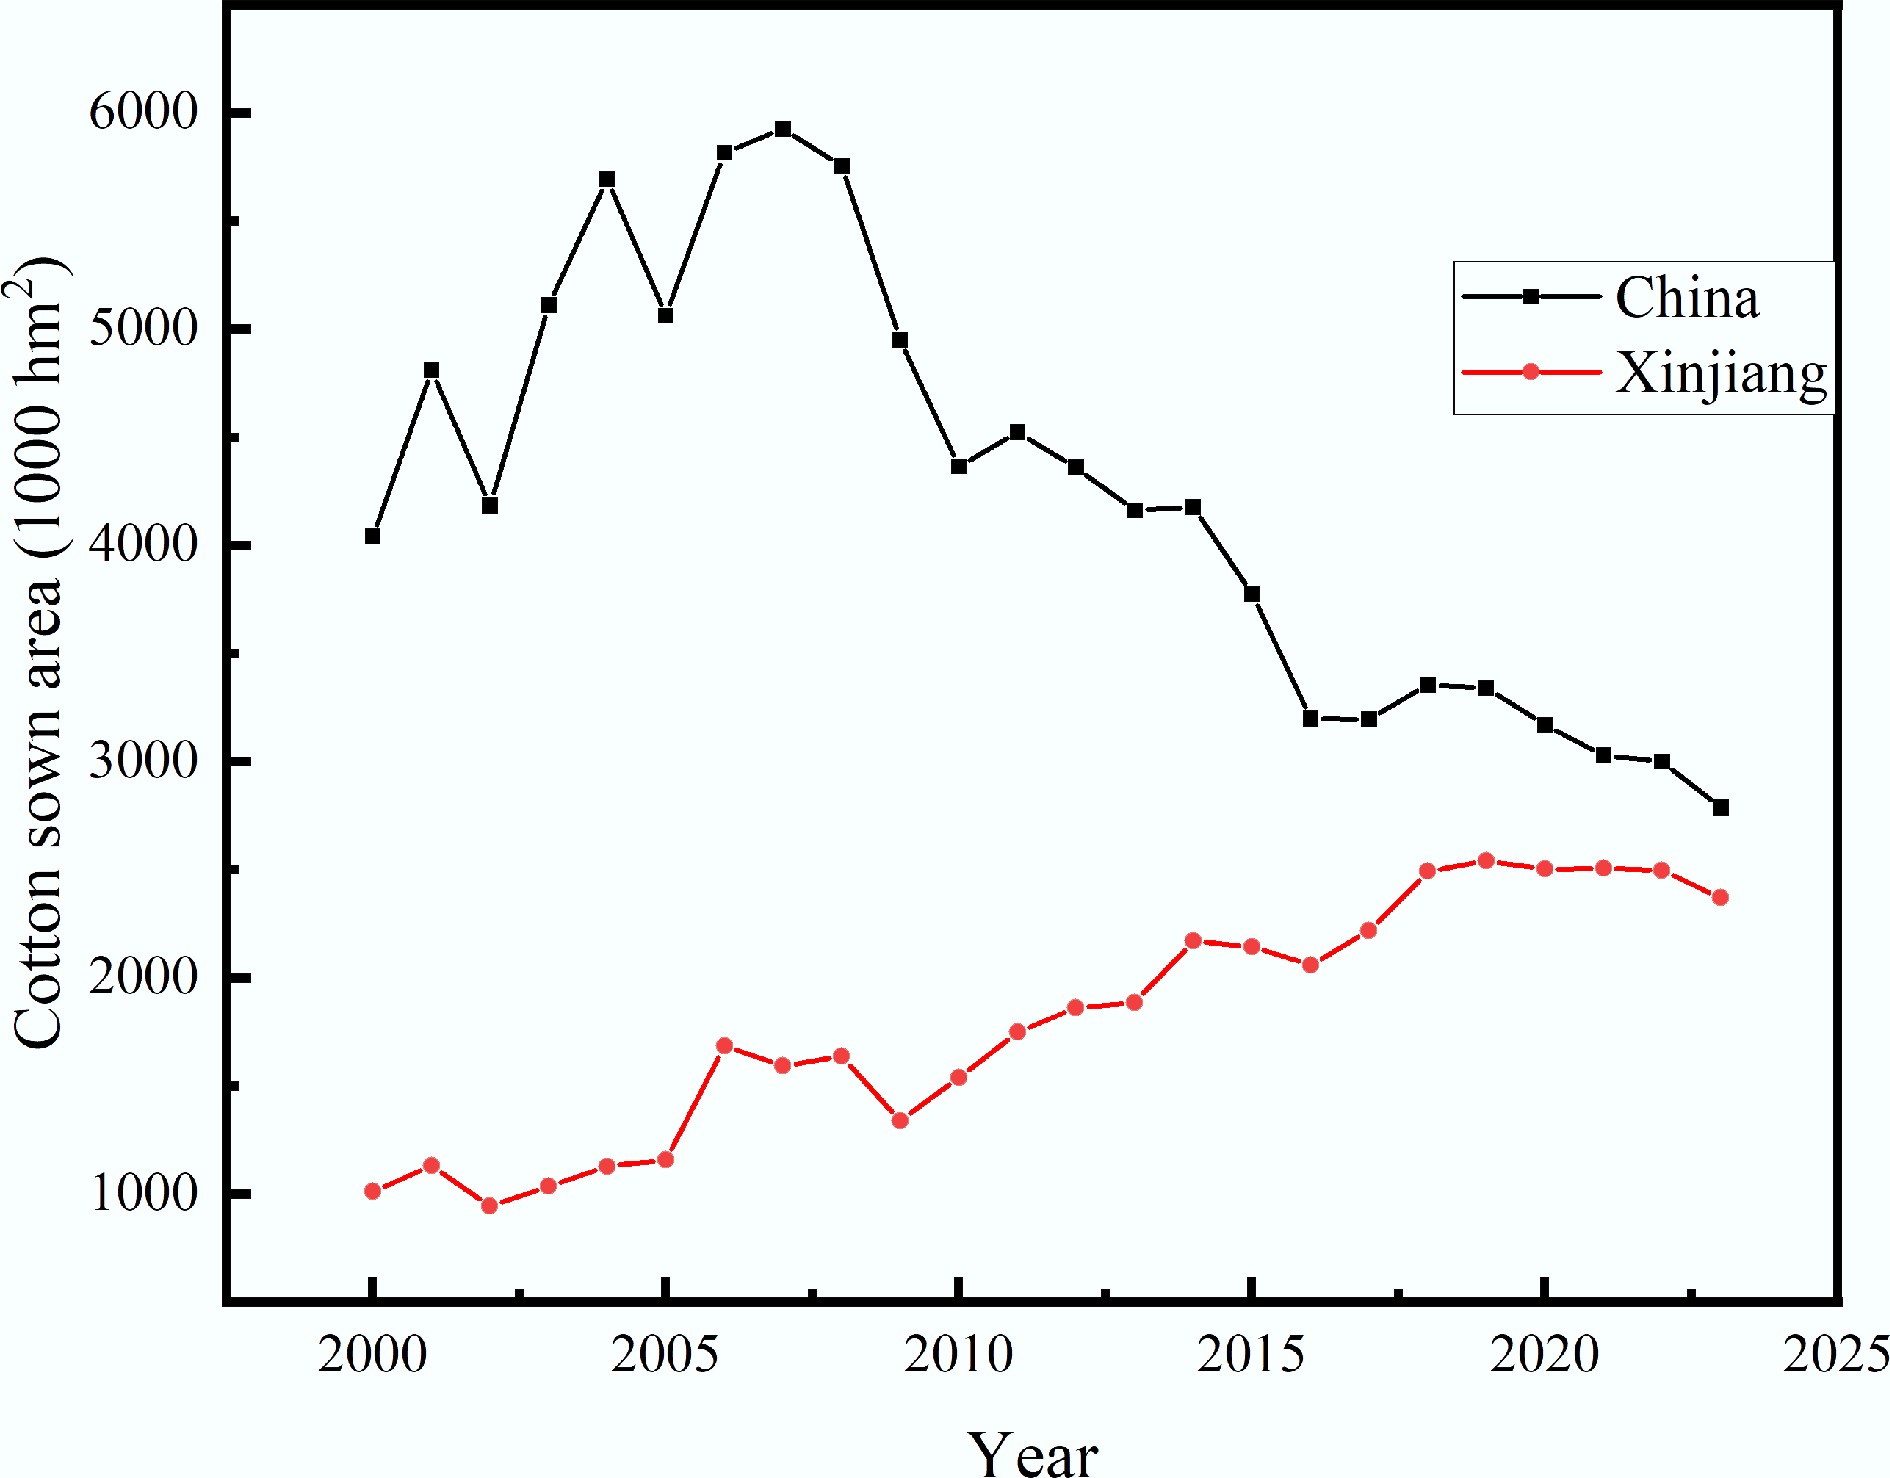
Figure 2.
Changes in cotton planting area from 2000 to 2023.
-
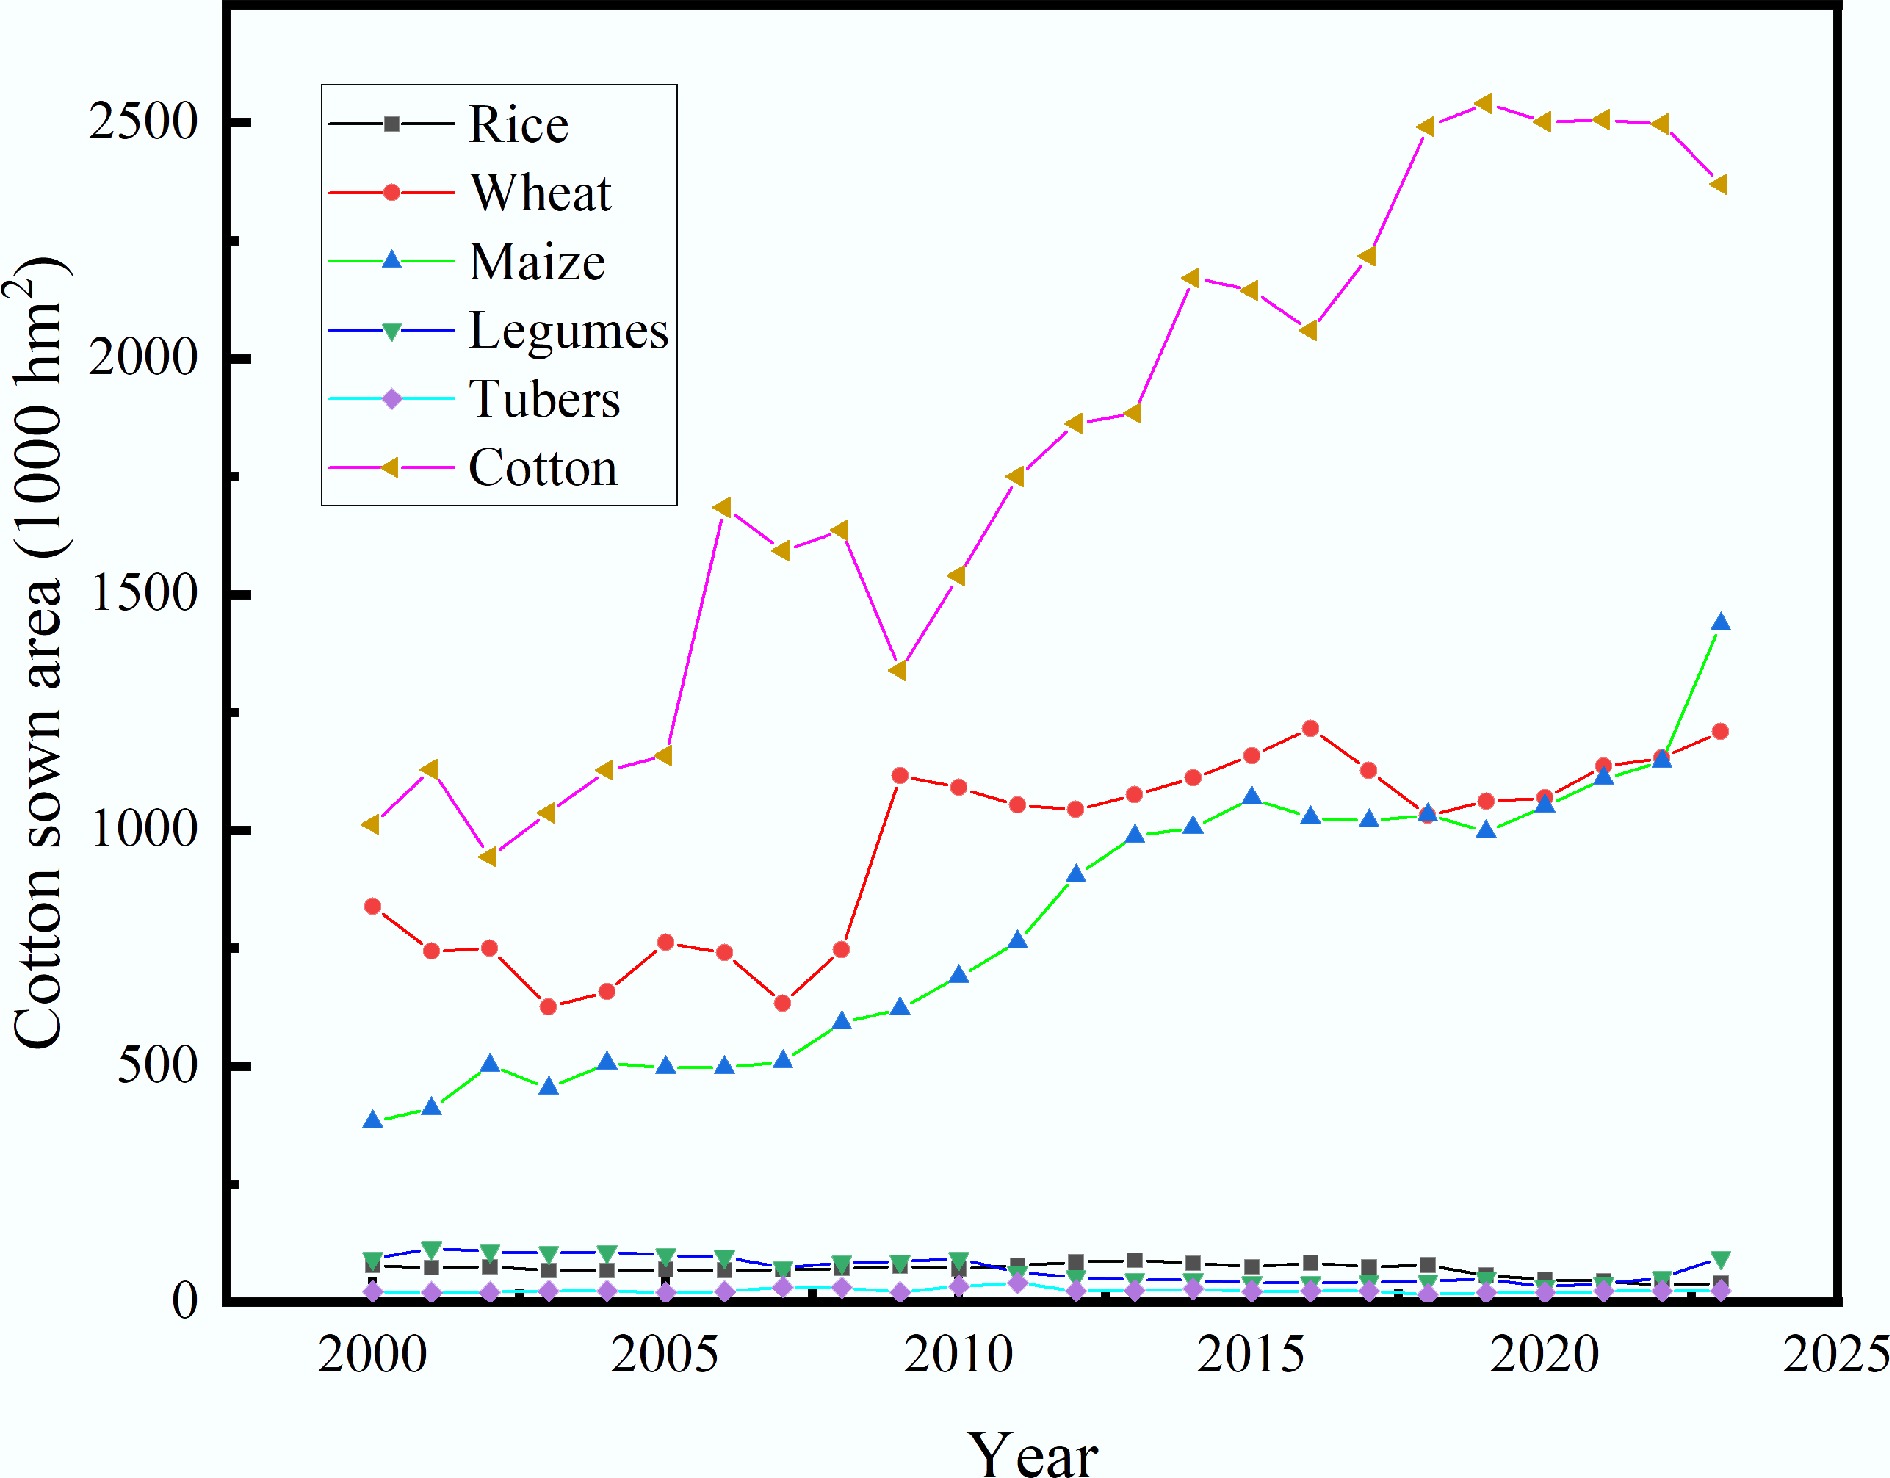
Figure 3.
Cultivated area of major crops in Xinjiang Province.
-
Parameter Value1 Parameter
code2Calculation process Ref. The heat energy generated during biochar production can replace the combustion of
fossil fuelsTotal amount of straw feedstock (t) 2.64 × 10⁷ A1 Eq. (2) This study Biogas yield (%) 35% A2 [22] Calorific value of biogas (MJ·kg−1) 6 A3 [23] Electricity conversion coefficient (%) 35% A4 [24] CO2 emissions from power generation (kg·kWh−1) 0.8426 A5 [25] Electricity output during biochar production (kWh) 5.39 × 10⁹ A6 A1 × A2 × A3 × A4/3.6 × 1,000 —3 CO2 emissions reduction from coal substitution (t) 4.54 × 10⁶ A7 A6 × A5/1,000 — Calculation of biochar yield and carbon sequestration rate Biochar yield (%) 30.34% (m), 31.71% (w), 37.5% (c) A8 [26,27] Biochar carbon content (%) 59.76% (m), 62.89% (w), 73.4% (c) A9 [26, 28] The ratio of biochar's stable component (%) 80% A10 [21] C-CO2 conversion coefficient 3.67 A11 — Total biochar produced (t) 8.76 × 10⁶ A12 Eq. (4) This study Amount of carbon sequestered via soil application of biochar (t) 4.62 × 10⁶ A13 Eq. (5) This study Amount of CO2 sequestered via soil application of biochar (t) 1.70 × 10⁷ A14 A13 × A11 — The inhibition of N2O emissions by biochar The rate of N2O emission suppression by biochar (%) 87% A15 [29] N2O emissions (kg·hm−2) 1.86 (m), 1.54 (w), 2.10 (c) A16 [12, 30] Proportion of biochar applied to soil (t·hm−2) 50 A17 [31] Area available for biochar application (hm2) 6.74 × 10⁴ (m), 3.82 × 10³ (w),
6.97 × 10⁴ (c)A18 A12 /A17 — N2O-CO2 conversion coefficient 298 A19 [21] The reduction in N2O emissions (t) 241.53 A20 ∑A15 × A16 × A18/1,000 — The reduction in CO2 emissions (t) 7.2 × 10⁴ A21 A20 × A19 — Fertilizer reduction from biochar application (calculated in CO2e) Fertilizer input rate (kg·hm−2) 167.41 (N); 98.66 (P); 35.44 (K) A22 [32] Reduction amount of agricultural fertilizer input (%) 10% (N); 5% (P); 10% (K) A23 [31] CO2e emission amount from fertilizer production (kg) 3; 0.7; 1 A24 [21] CO2e emission avoidance from reduced fertilizer application (t) 8.06 × 10³ A25 ∑A18 × A22 × A23 × A24 — Greenhouse gas emissions from the storage and transportation of biochar and feedstock Greenhouse gas emission factor from the storage and transportation of straw (kg·t−1) 27.53 A26 [33] Emissions of CO2e per ton for biochar (kg) 45.32 A27 [34] CO2e emissions from straw feedstock (t) 7.27 × 10⁵ A28 A1 × A26 — Emissions of CO2e attributable to biochar (t) 3.97 × 10⁵ A29 A12 × A27 — Total emissions (CO2e) (t) 1.12 × 10⁶ A30 A28 + A29 Net reduction in greenhouse gas emissions (CO2e) (t) 2.05 × 10⁷ A32 A7 + A14 + A21 + A25–A30 — 1 m, w, and c represent maize, wheat, and cotton, respectively. 2 Parameter codes are assigned to illustrate calculation procedures. 3 — indicates that the relevant data is derived via calculation. Table 1.
Relevant parameters and estimated potential for greenhouse gas mitigation through biochar production from major collectible crop straw resources in Xinjiang, 2023
-
Parameter Value Parameter
code1Calculation Ref. The heat energy generated during biochar production can replace the combustion of fossil fuels Total amount of cotton stalk (t) 9.29 × 10⁶ B1 Eq. (2) This study Biogas yield (%) 35.82% B2 [38] Calorific value of biogas (MJ·kg−1) 10.9 B3 [39] Electricity conversion coefficient (%) 35% B4 [24] CO2 emissions from power generation (kg·kWh−1) 0.8426 B5 [25] Electricity output during biochar production (kWh) 3.53 × 10⁹ B6 B1 × B2 × B3 × B4 / 3.6 × 1,000 —2 CO2 emissions reduction from coal substitution (t) 2.97 × 10⁶ B7 B6 × B5/1,000 — Calculation of biochar yield and carbon sequestration rate Biochar yield (%) 37.5% B8 [27] Biochar carbon content (%) 73.4% B9 [28] The ratio of biochar's stable component (%) 80% B10 [21] C-CO2 conversion coefficient 3.67 B11 — Total biochar produced (t) 3.48 × 10⁶ B12 Eq. (4) This study Amount of carbon sequestered via soil application of biochar (t) 2.04 × 10⁶ B13 Eq. (5) This study Amount of CO2 sequestered via soil application of biochar (t) 7.5 × 10⁶ B14 B13 × B11 — The inhibition of N2O emissions by biochar The rate of N2O emission suppression by biochar (%) 87% B15 [29] N2O emissions (kg·hm−2) 2.10 B16 [30] Proportion of biochar applied to soil (t·hm−2) 50 B17 [31] Area available for biochar application (hm2) 6.97 × 10⁴ B18 B12 /B17 — N2O-CO2 conversion coefficient 298 B19 [21] The reduction in N2O emissions (t) 127.34 B20 ∑B15 × B16 × B18/1,000 — The reduction in CO2 emissions (t) 3.79 × 10⁴ B21 B20 × B19 — Fertilizer reduction from biochar application (calculated in CO2e) Fertilizer input rate (kg·hm−2) 167.41 (N); 98.66 (P); 35.44 (K) B22 [32] Reduction in fertilizer input (%) 10% (N); 5% (P); 10% (K) B23 [31] CO2e emissions amount from fertilizer production (kg) 3; 0.7; 1 B24 [21] CO2e emission avoided through reduced fertilizer application (t) 3.99 × 10³ B25 B18 × B22 × B23 × B24/1,000 — Greenhouse gas emissions from the storage and transportation of biochar and feedstock Greenhouse gas emission factor from the storage and transportation of straw (kg·t−1) 27.53 B26 [33] Emissions of CO2e per ton for biochar (kg) 45.32 B27 [34] CO2e emissions from cotton stalk (t) 2.56 × 10⁵ B28 B1 × B26 — Emissions of CO2e attributable to biochar (t) 1.58 × 10⁵ B29 B12 × B27 — Total emissions (CO2e) (t) 4.14 × 10⁵ B30 B28 + B29 Net reduction in greenhouse gas emissions (CO2e) (t) 1.01 × 10⁷ B31 B7 + B14 + B21 + B25–B30 — 1 Parameter codes are assigned to illustrate the calculation procedures. 2 — indicates that the relevant data is derived via calculation. Table 2.
Relevant parameters and estimated potential for greenhouse gas mitigation through biochar production from all collectible cotton straw resources in Xinjiang in 2023
-
Parameter Value Parameter
code1Calculation Ref. The heat energy generated during biochar production can replace the combustion of fossil fuels Total amount of mulch film feedstock (t) 2.03 × 10⁵ C1 Eq. (3) This study Biogas yield (%) 42% C2 [22] Calorific value of biogas (MJ·kg−1) 38.6 C3 [23] Electricity conversion coefficient (%) 35% C4 [24] CO2 emissions from power generation (kg·kWh−1) 0.8426 C5 [25] Electricity output during biochar production (kWh) 3.2 × 10⁸ C6 C1 × C2 × C3 × C4/
3.6 × 1,000—2 CO2 emission reduction from coal substitution (t) 2.7 × 10⁵ C7 C6 × C5/1,000 — Calculation of biochar yield and carbon sequestration rate Biochar yield (%) 1.65% C8 [22] Biochar carbon content (%) 8.91% C9 [22] The ratio of biochar's stable component (%) 80% C10 [21] C-CO2 conversion coefficient 3.67 C11 — Total biochar produced (t) 3.35 × 10³ C12 Eq. (4) This study Amount of carbon sequestered via soil application of biochar (t) 2.39 × 10² C13 Eq. (5) This study Amount of CO2 sequestered via soil application of biochar (t) 8.76 × 10² C14 C13 × C11 — The inhibition of N2O emissions by biochar The rate of N2O emission suppression by biochar (%) 87% C15 [29] N2O emissions (kg·hm−2) 2.10 C16 [30] Proportion of biochar applied to soil (t·hm−2) 50 C17 [31] Area available for biochar application (hm2) 67 C18 C12 / C17 — N2O-CO2 conversion coefficient 298 C19 [21] The reduction in N2O emissions (t) 0.122 C20 C15 × C16 × C18/1,000 — The reduction in CO2 emissions (t) 36.48 C21 C20 × C19 — Fertilizer reduction from biochar application (calculated in CO2e) Fertilizer input rate (kg·hm−2) 167.41 (N); 98.66 (P); 35.44 (K); C22 [32] Reduction in fertilizer input (%) 10% (N); 5% (P); 10% (K) C23 [31] CO2e emissions from fertilizer production (kg) 3; 0.7; 1 C24 [21] CO2e emissions avoided through reduced fertilizer application (t) 3.83 C25 ∑C18 × C22 × C23 × C24/1,000 — Greenhouse gas emissions from the storage and transportation of biochar and feedstock Greenhouse gas emission factor from the storage and transportation of mulch film (kg·t−1) 21 C26 [33] Emissions of CO2e per ton for biochar (kg) 45.32 C27 [34] CO2e emissions from mulch film feedstock (t) 4.26 × 10³ C28 C1 × C26 — Emissions of CO2e attributable to biochar (t) 1.52 × 10² C29 C12 × C27 — Total emissions (CO2e) (t) 4.41 × 10³ C30 C28 + C29 Net reduction in greenhouse gas emissions (CO2e) (t) 2.67 × 10⁵ C31 C7 + C14 + C21 + C25–C30 — 1 Parameter codes are assigned to illustrate calculation procedures. 2 — indicates that the relevant data is derived via calculation. Table 3.
Relevant parameters and estimated potential for greenhouse gas mitigation through biochar production from all recyclable mulch film in Xinjiang, 2023
-
Parameter Value Parameter code1 Calculation Ref. The heat energy generated during biochar production can replace the combustion of fossil fuels Total amount of cotton straw and mulch film feedstock (t) 1.02 × 10⁶ D1 Eqs (2) and (3) This study Biogas yield (%) 32% D2 [38] Calorific value of biogas (MJ·kg−1) 21 D3 [38] Electricity conversion coefficient (%) 35% D4 [24] CO2 emissions from power generation (kg·kWh−1) 0.8426 D5 [25] Electricity output during biochar production (kWh) 6.66 × 10⁸ D6 D1 × D2 × D3 × D4/3.6 × 1,000 —2 CO2 emissions reduction from coal substitution (t) 5.62 × 10⁵ D7 D6 × D5/1,000 — Calculation of biochar yield and carbon sequestration rate Biochar yield (%) 22% D8 [38] Biochar carbon content (%) 69.91% D9 [22] The ratio of biochar's stable component (%) 80% D10 [21] C-CO2 conversion coefficient 3.67 D11 — Total biochar produced (t) 2.24 × 10⁵ D12 Eq. (4) This study Amount of carbon sequestered via soil application of biochar (t) 1.25 × 10⁵ D13 Eq. (5) This study Amount of CO2 sequestered via soil application of biochar (t) 4.6 × 10⁵ D14 D13 × D11 — The inhibition of N2O emissions by biochar The rate of N2O emission suppression by biochar (%) 87% D15 [29] N2O emissions (kg·hm−2) 2.10 D16 [30] Proportion of biochar applied to soil (t·hm−2) 50 D17 [31] Area available for biochar application (hm2) 4.48 × 10³ D18 D12 / D17 — N2O-CO2 conversion coefficient 298 D19 [21] The reduction in N2O emissions (t) 8.18 × 10³ D20 ∑D15 × D16 × D18/1,000 — The reduction in CO2 emissions (t) 2.44 × 10⁶ D21 D20 × D19 — Fertilizer reduction from biochar application
(calculated in CO2e)Fertilizer input rate (kg·hm−2) 167.41 (N); 98.66 (P); 35.44 (K) D22 [32] Reduction in fertilizer input (%) 10% (N); 5% (P): 10% (K) D23 [31] CO2e emissions from fertilizer production (kg) 3; 0.7; 1 D24 [21] CO2e emissions avoided through reduced fertilizer application (t) 256.35 D25 ∑D18 × D22 × D23 × D24 — Greenhouse gas emissions from the storage and transportation of biochar and feedstock Greenhouse gas emission factors from the storage and transportation of straw and mulch film (kg·t−1) 27.53, 21 D26 [33] Emissions of CO2e per ton for biochar (kg) 45.32 D27 [34] CO2e emissions from cotton straw and mulch film feedstock (t) 2.66 × 10⁴ D28 D1 × D26 — Emissions of CO2e attributable to biochar (t) 1.02 × 10⁴ D29 D12 × D27 — Total emissions (CO2e) (t) 3.68 × 10⁴ D30 D28 + D29 Net reduction in greenhouse gas emissions (CO2e) (t) 3.43 × 10⁶ D31 D7 + D14 + D21 + D25–D30 — 1 Parameter codes are assigned to illustrate calculation procedures. 2 — indicates that the relevant data is derived via calculation. Table 4.
Relevant parameters and estimated potential for greenhouse gas mitigation through biochar production from all recyclable mulch film and cotton straw at a ratio of 1:4 in Xinjiang, 2023
Figures
(3)
Tables
(4)