-
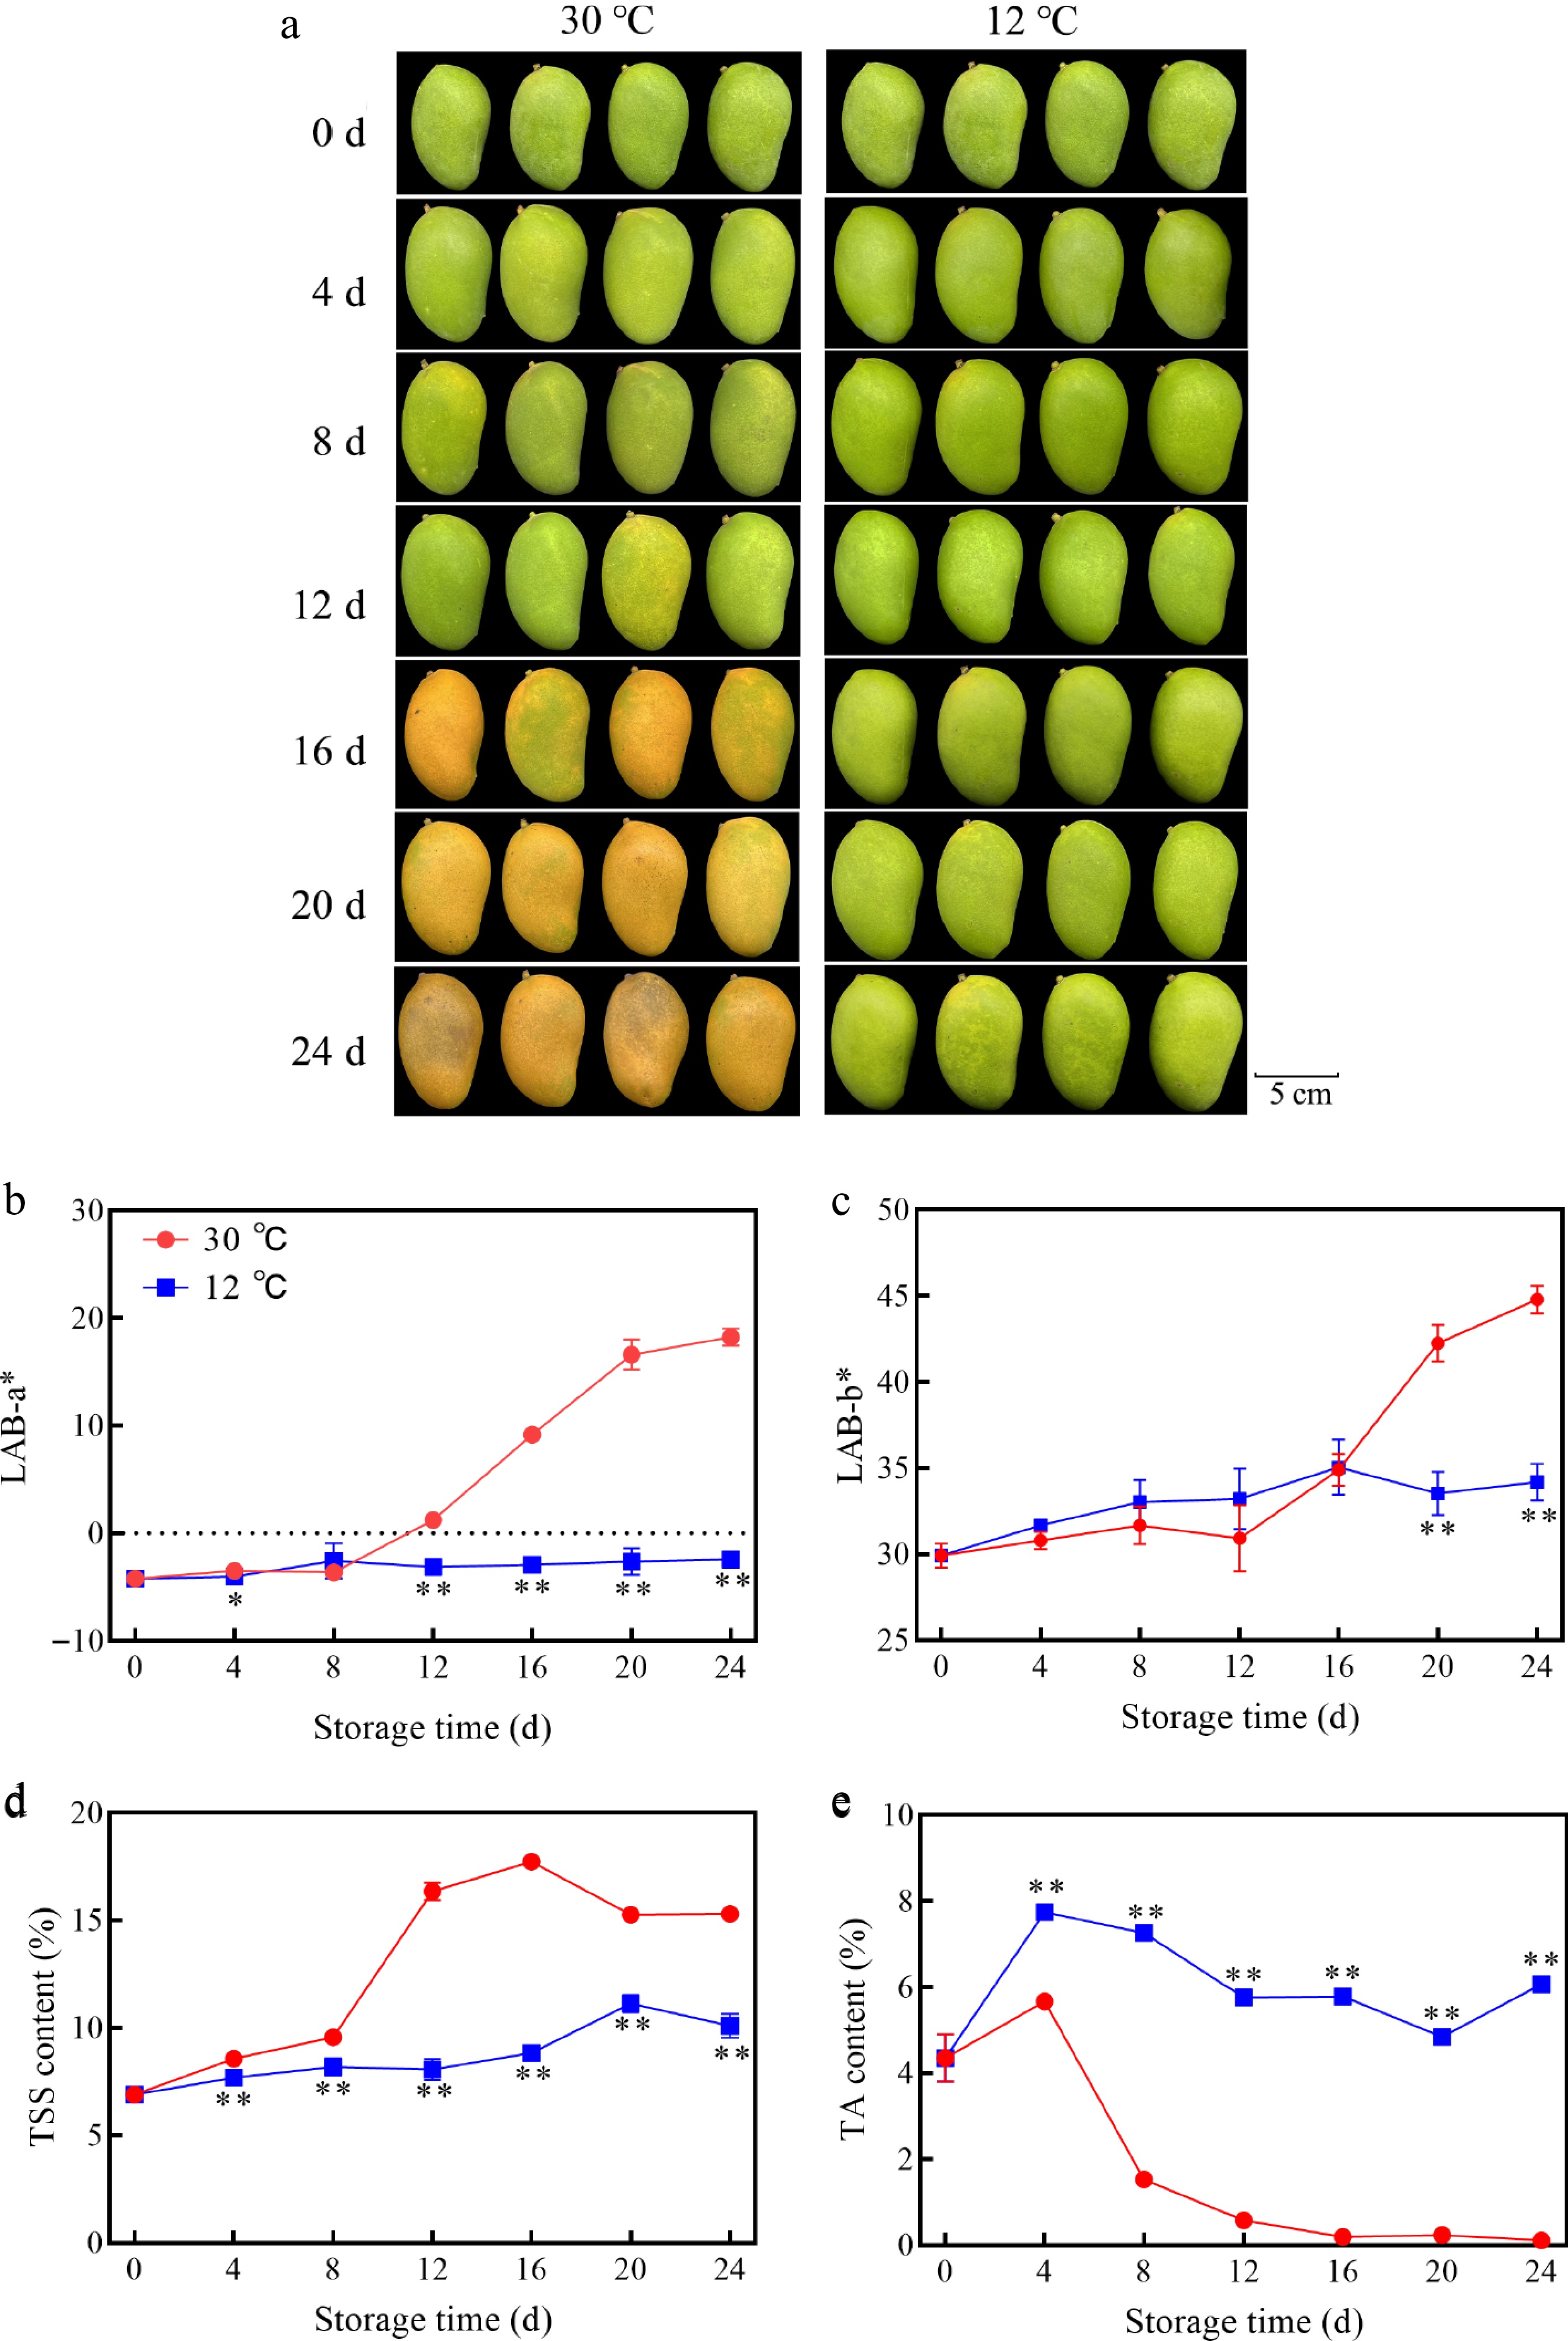
Figure 1.
Changes in (a) fruit appearance, (b) a* value, (c) b* value, (d) TSS content, and (e) TA content of mango fruits stored at 30 and 12 °C. Vertical bars represent the standard error of the mean, the asterisks indicate significant difference between two groups at corresponding sampling point (* p < 0.05, ** p < 0.01).
-
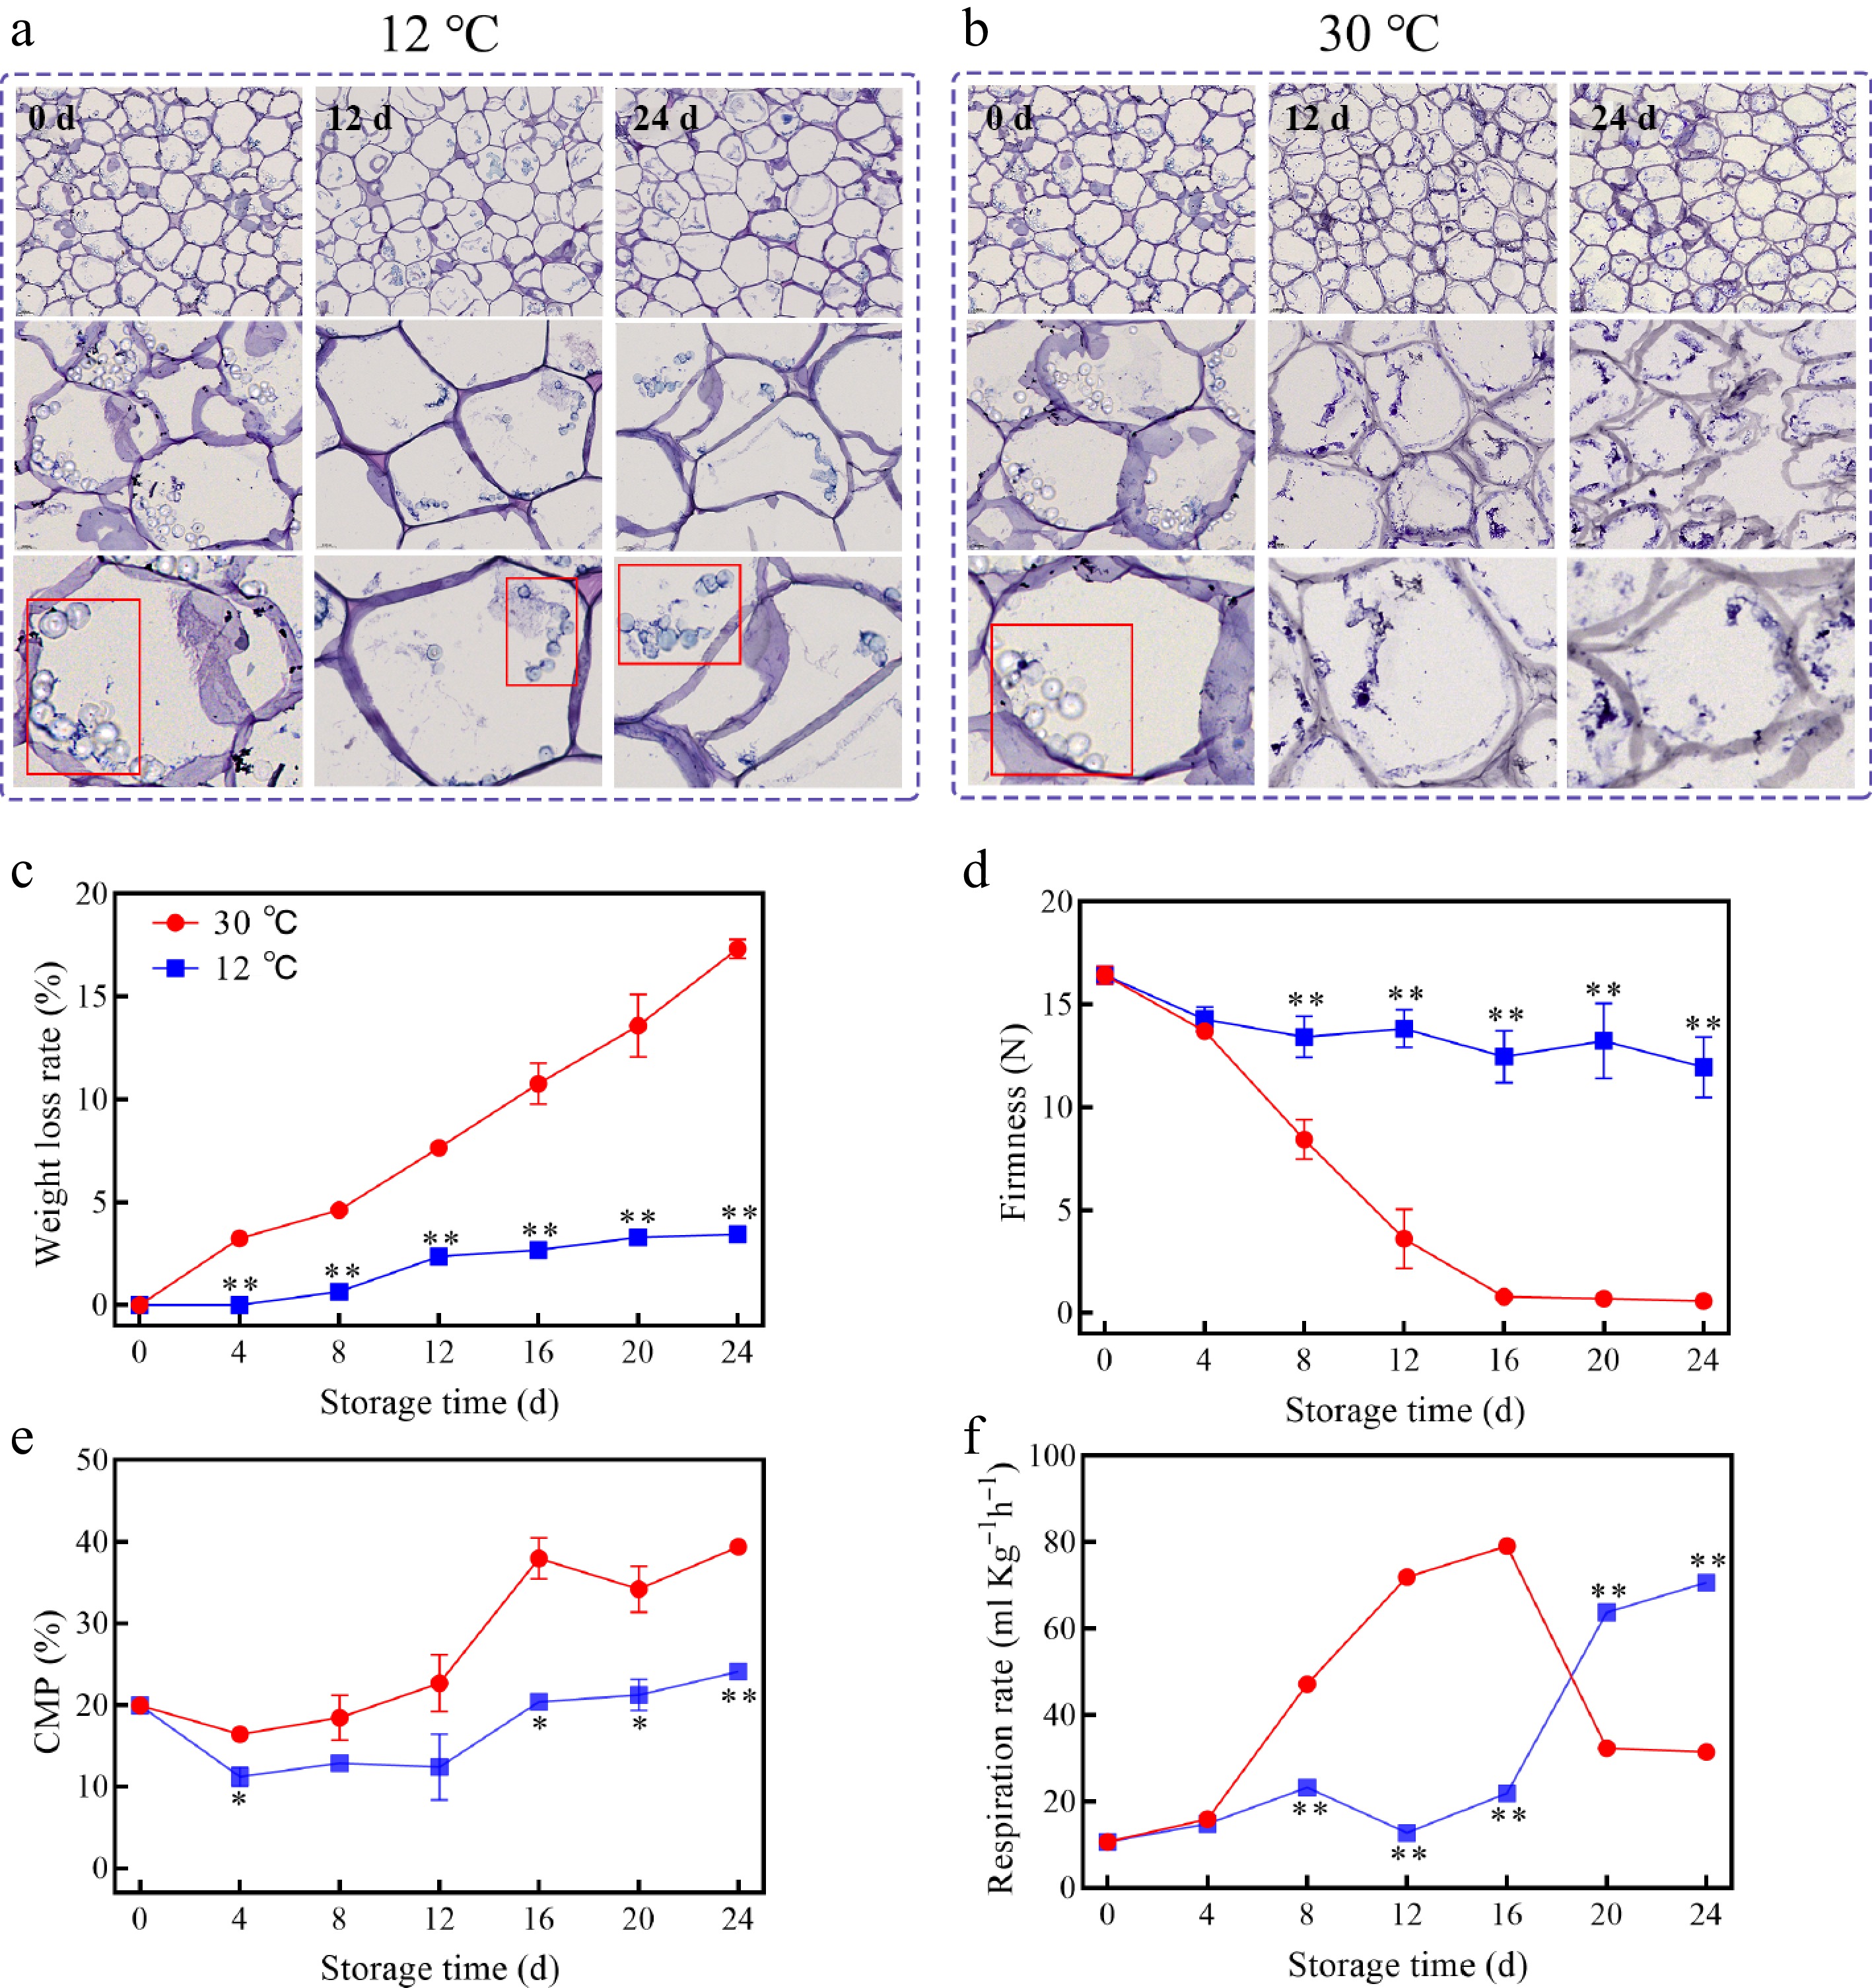
Figure 2.
Changes of pulp cell in SEM at (a) 12 °C, (b) 30 °C, (c) weight loss, (d) firmness, (e) CMP, (f) respiration rate of mango fruits stored at 30 and 12 °C. Vertical bars represent the standard error of the mean, the asterisks indicate significant difference between two groups at corresponding sampling point (* p < 0.05, ** p < 0.01).
-
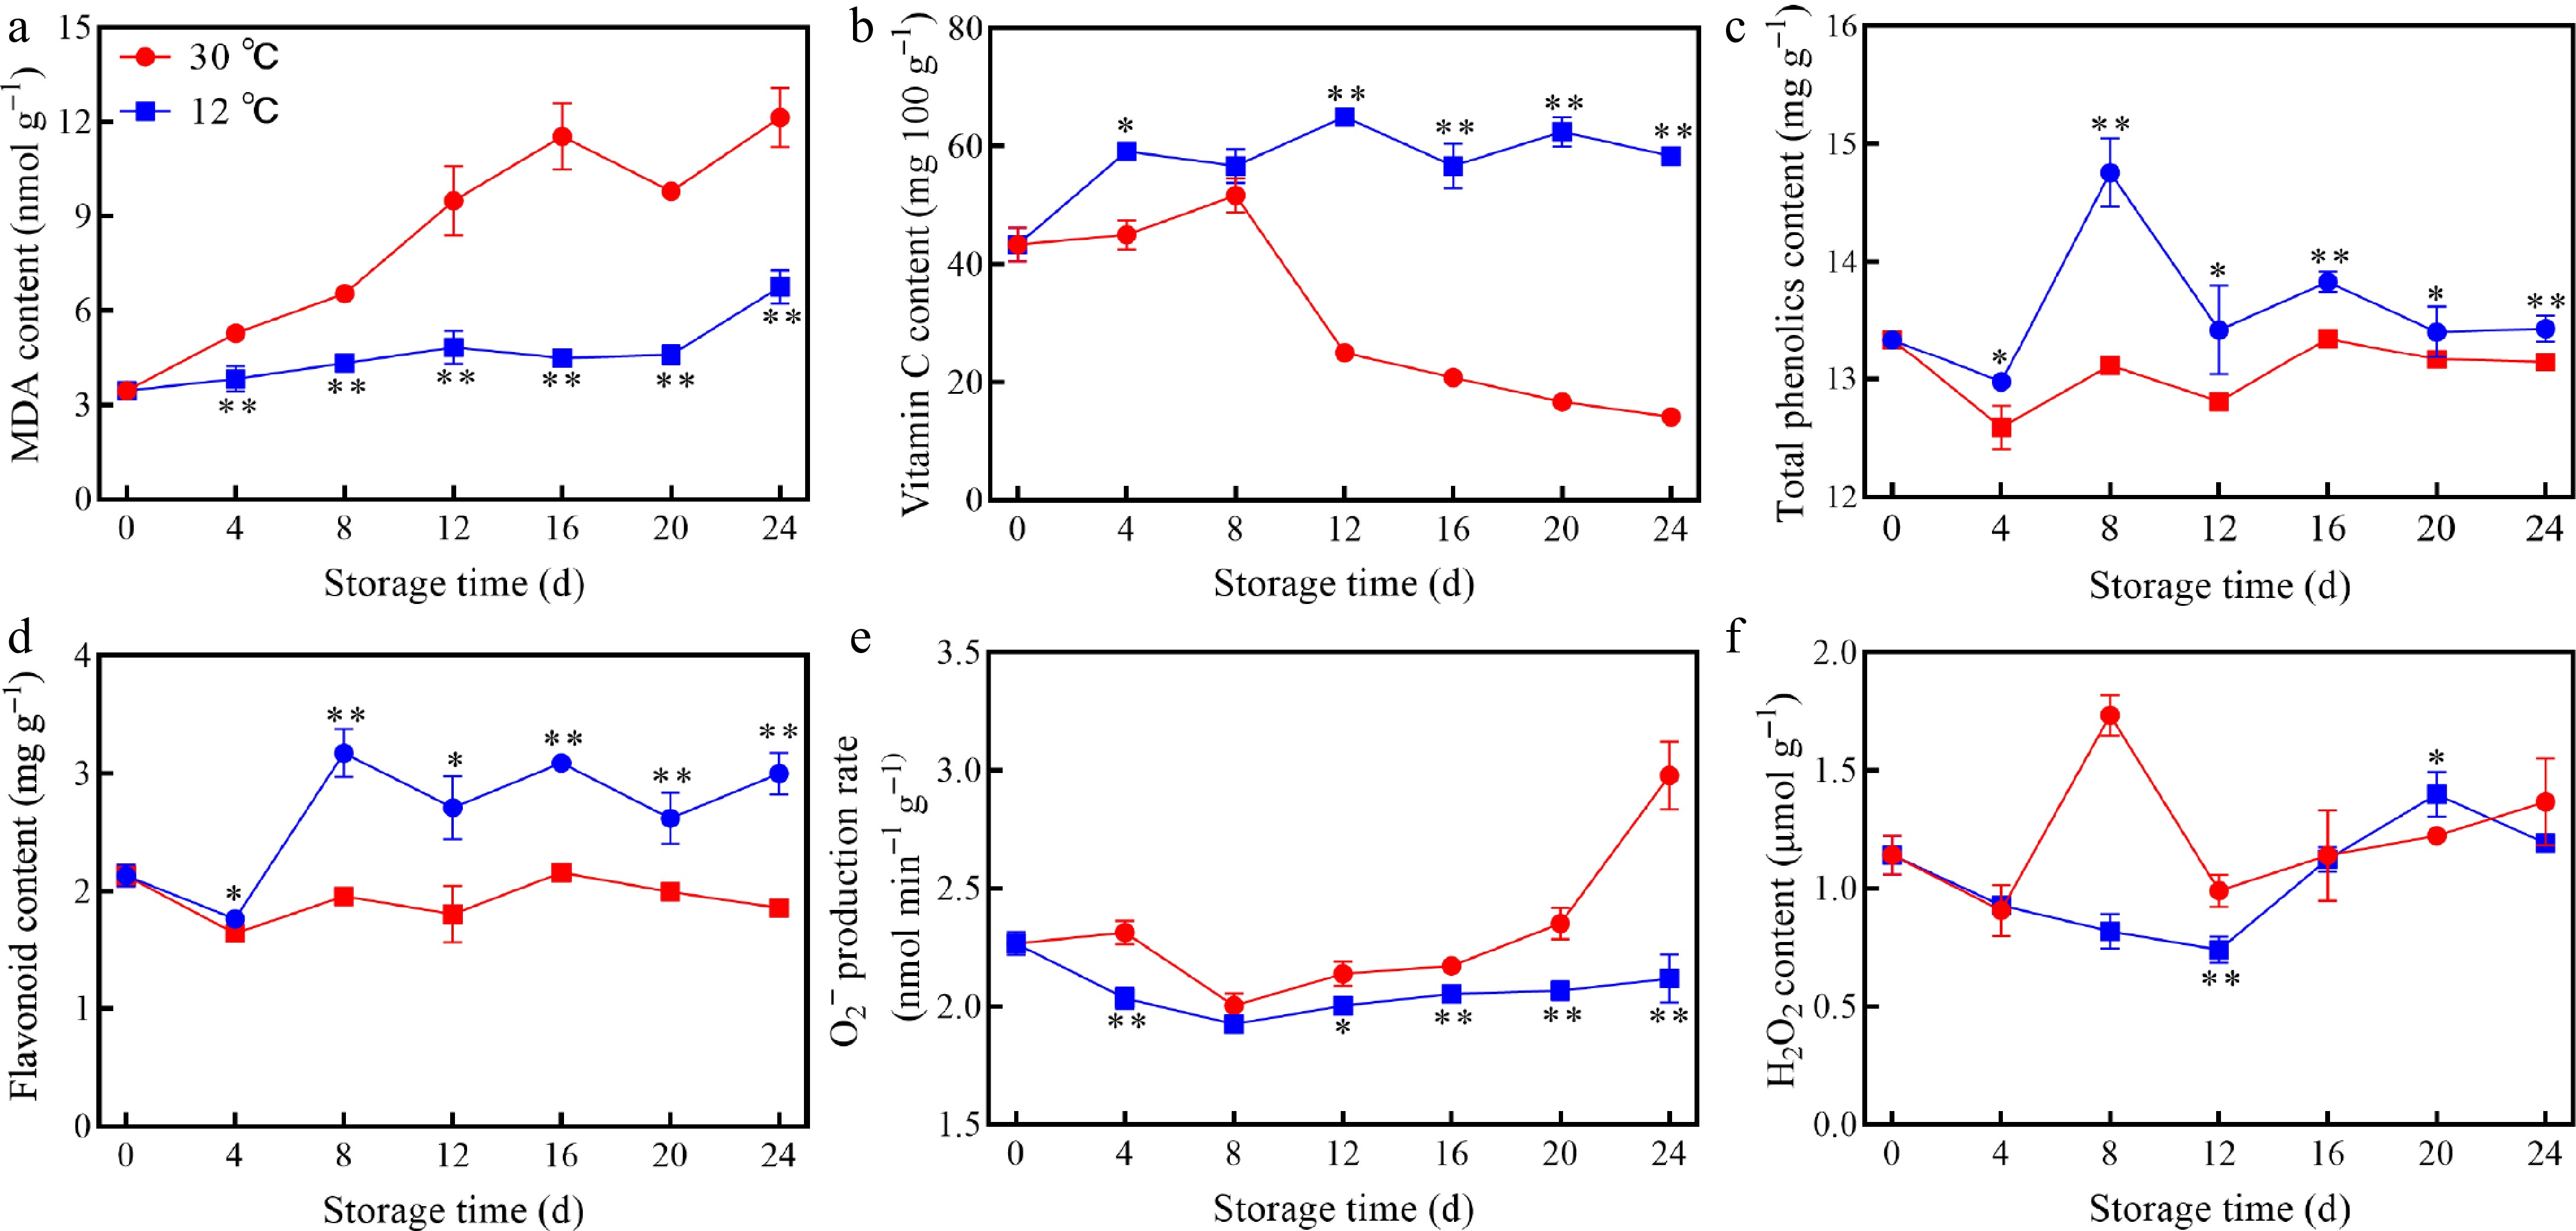
Figure 3.
Changes in (a) MDA content, (b) vitamin C content, (c) TP content, (d) flavonoid content, (e) O2− production rate, and (f) H2O2 content of mango fruits stored at 30 and 12 °C. Vertical bars represent the standard error of the mean, the asterisks indicate significant difference between two groups at corresponding sampling point (* p < 0.05, ** p < 0.01).
-
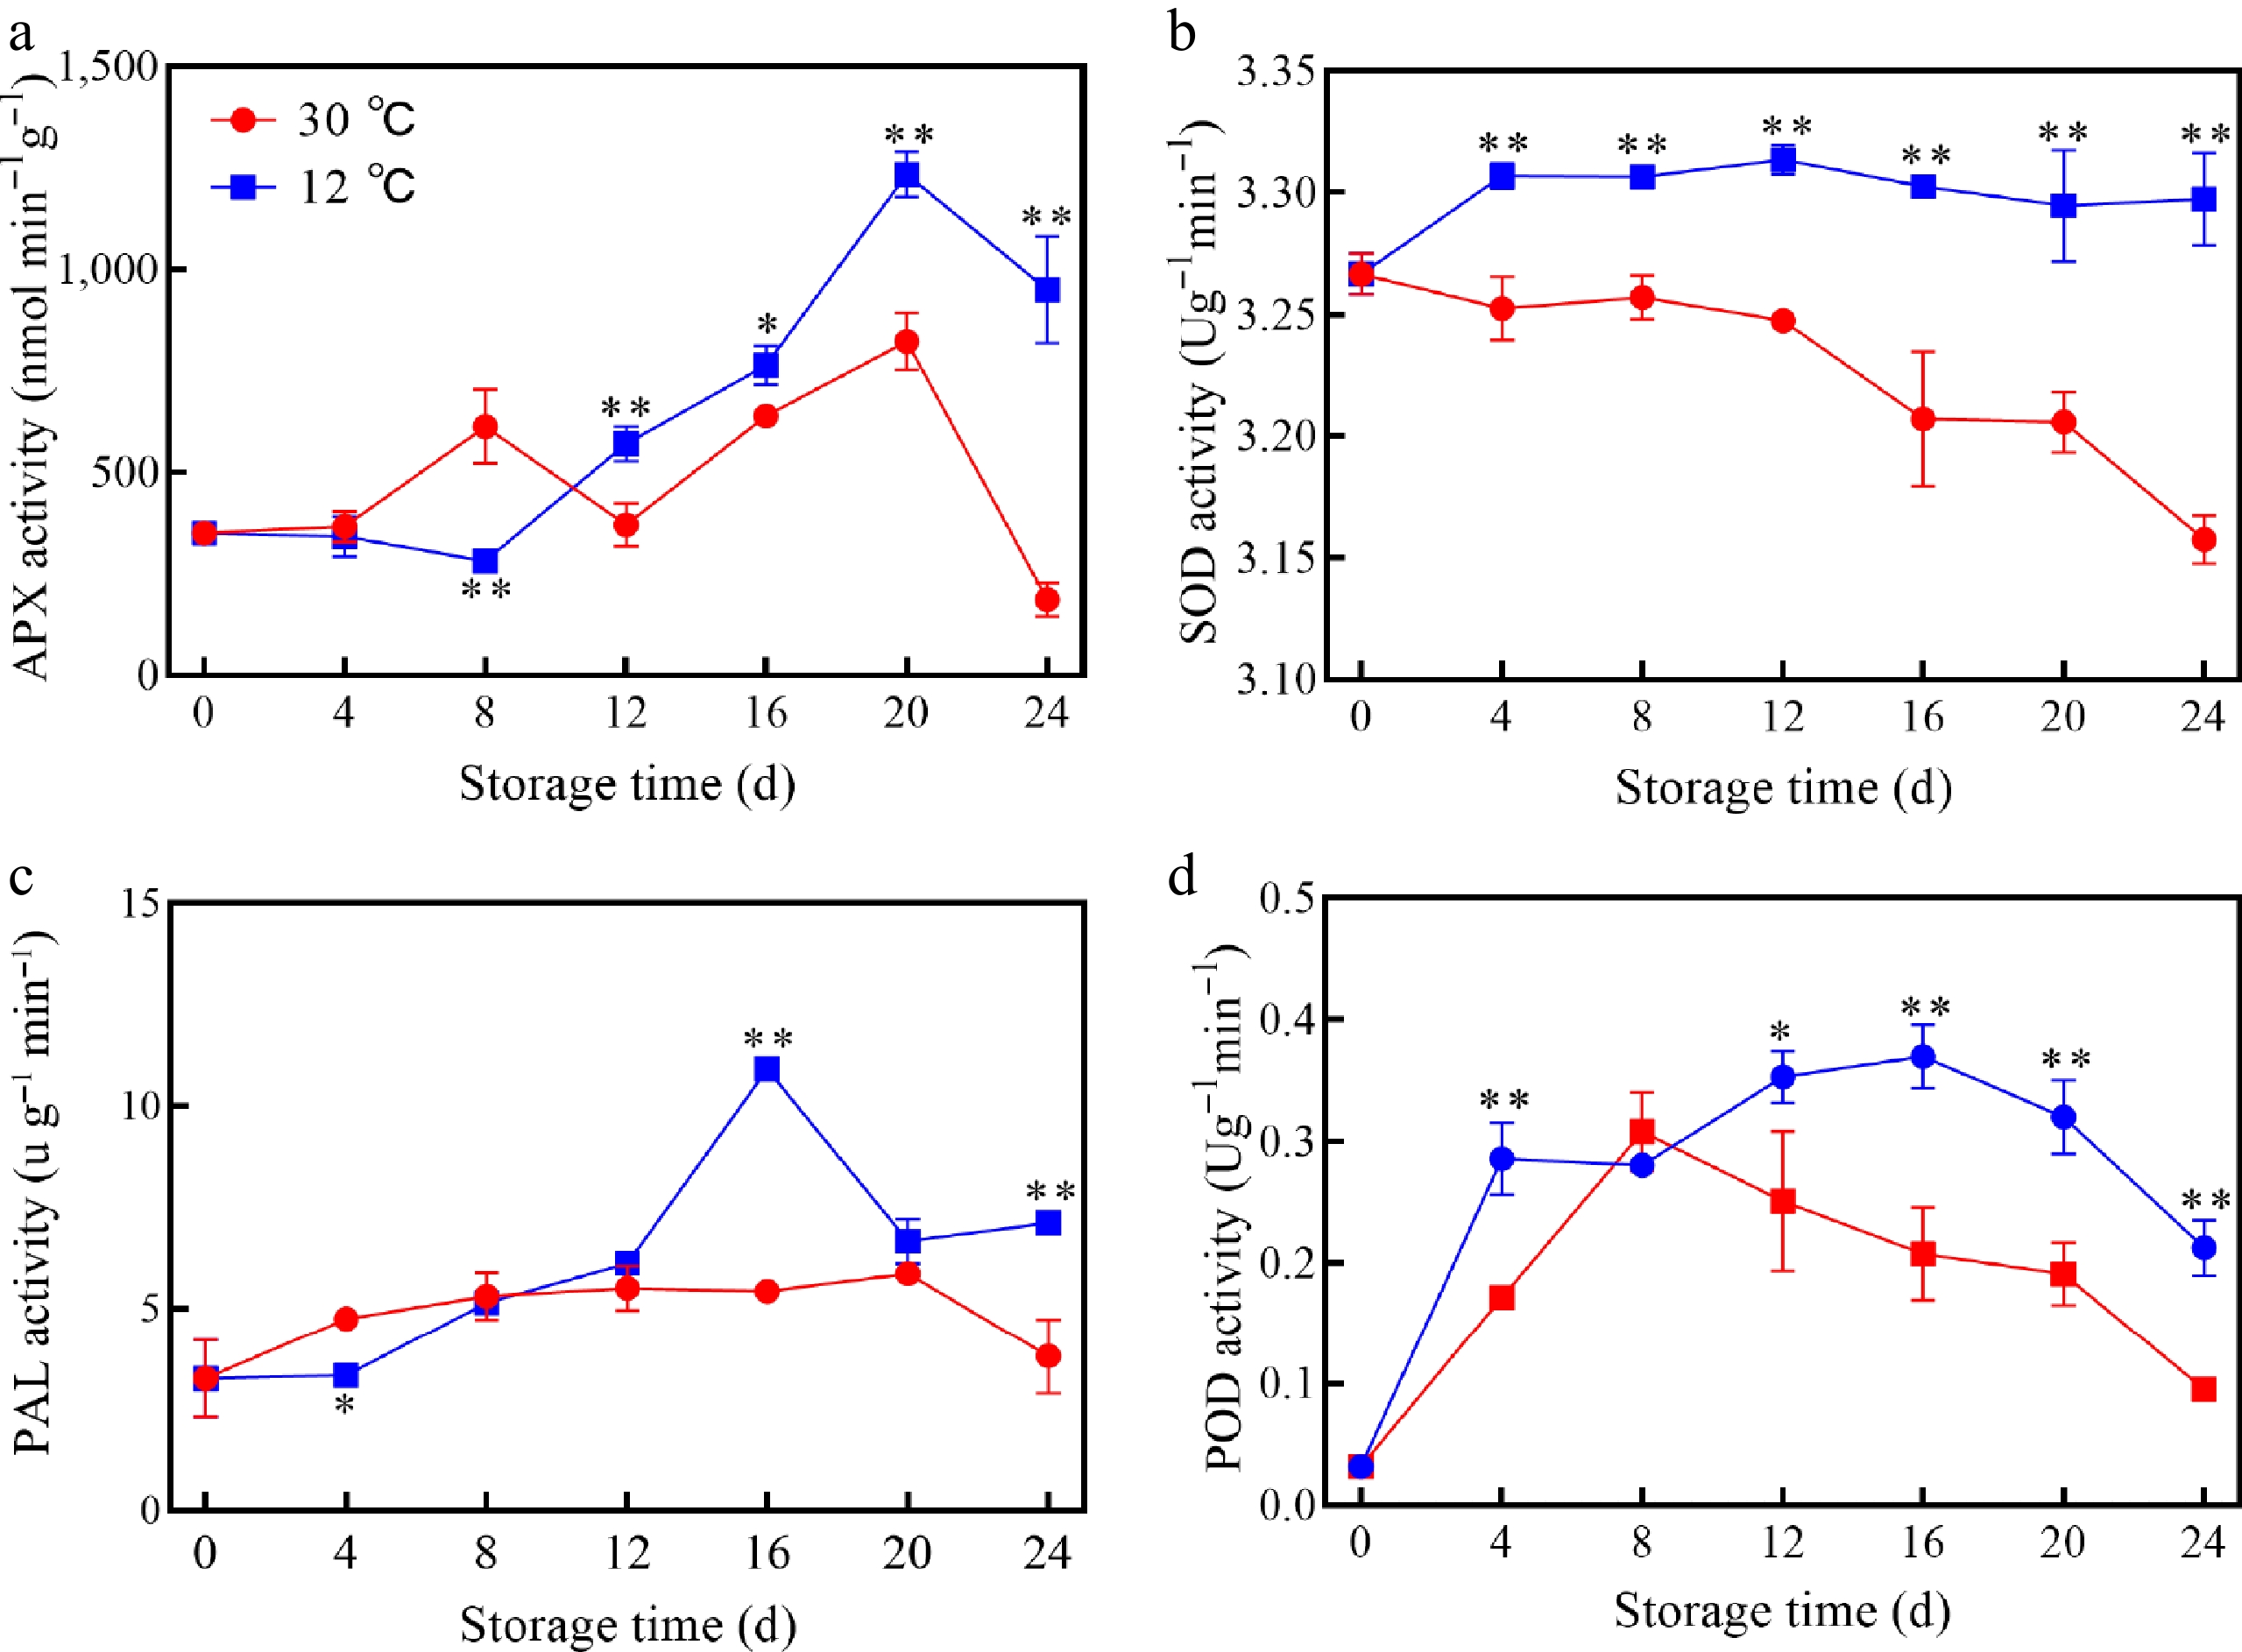
Figure 4.
Changes in (a) APX, (b) SOD, (c) PAL, and (d) POD of mangoes stored at 30 and 12 °C. Vertical bars represent the standard error of the mean, the asterisks indicate significant difference between two groups at corresponding sampling point (* p < 0.05, ** p < 0.01).
-
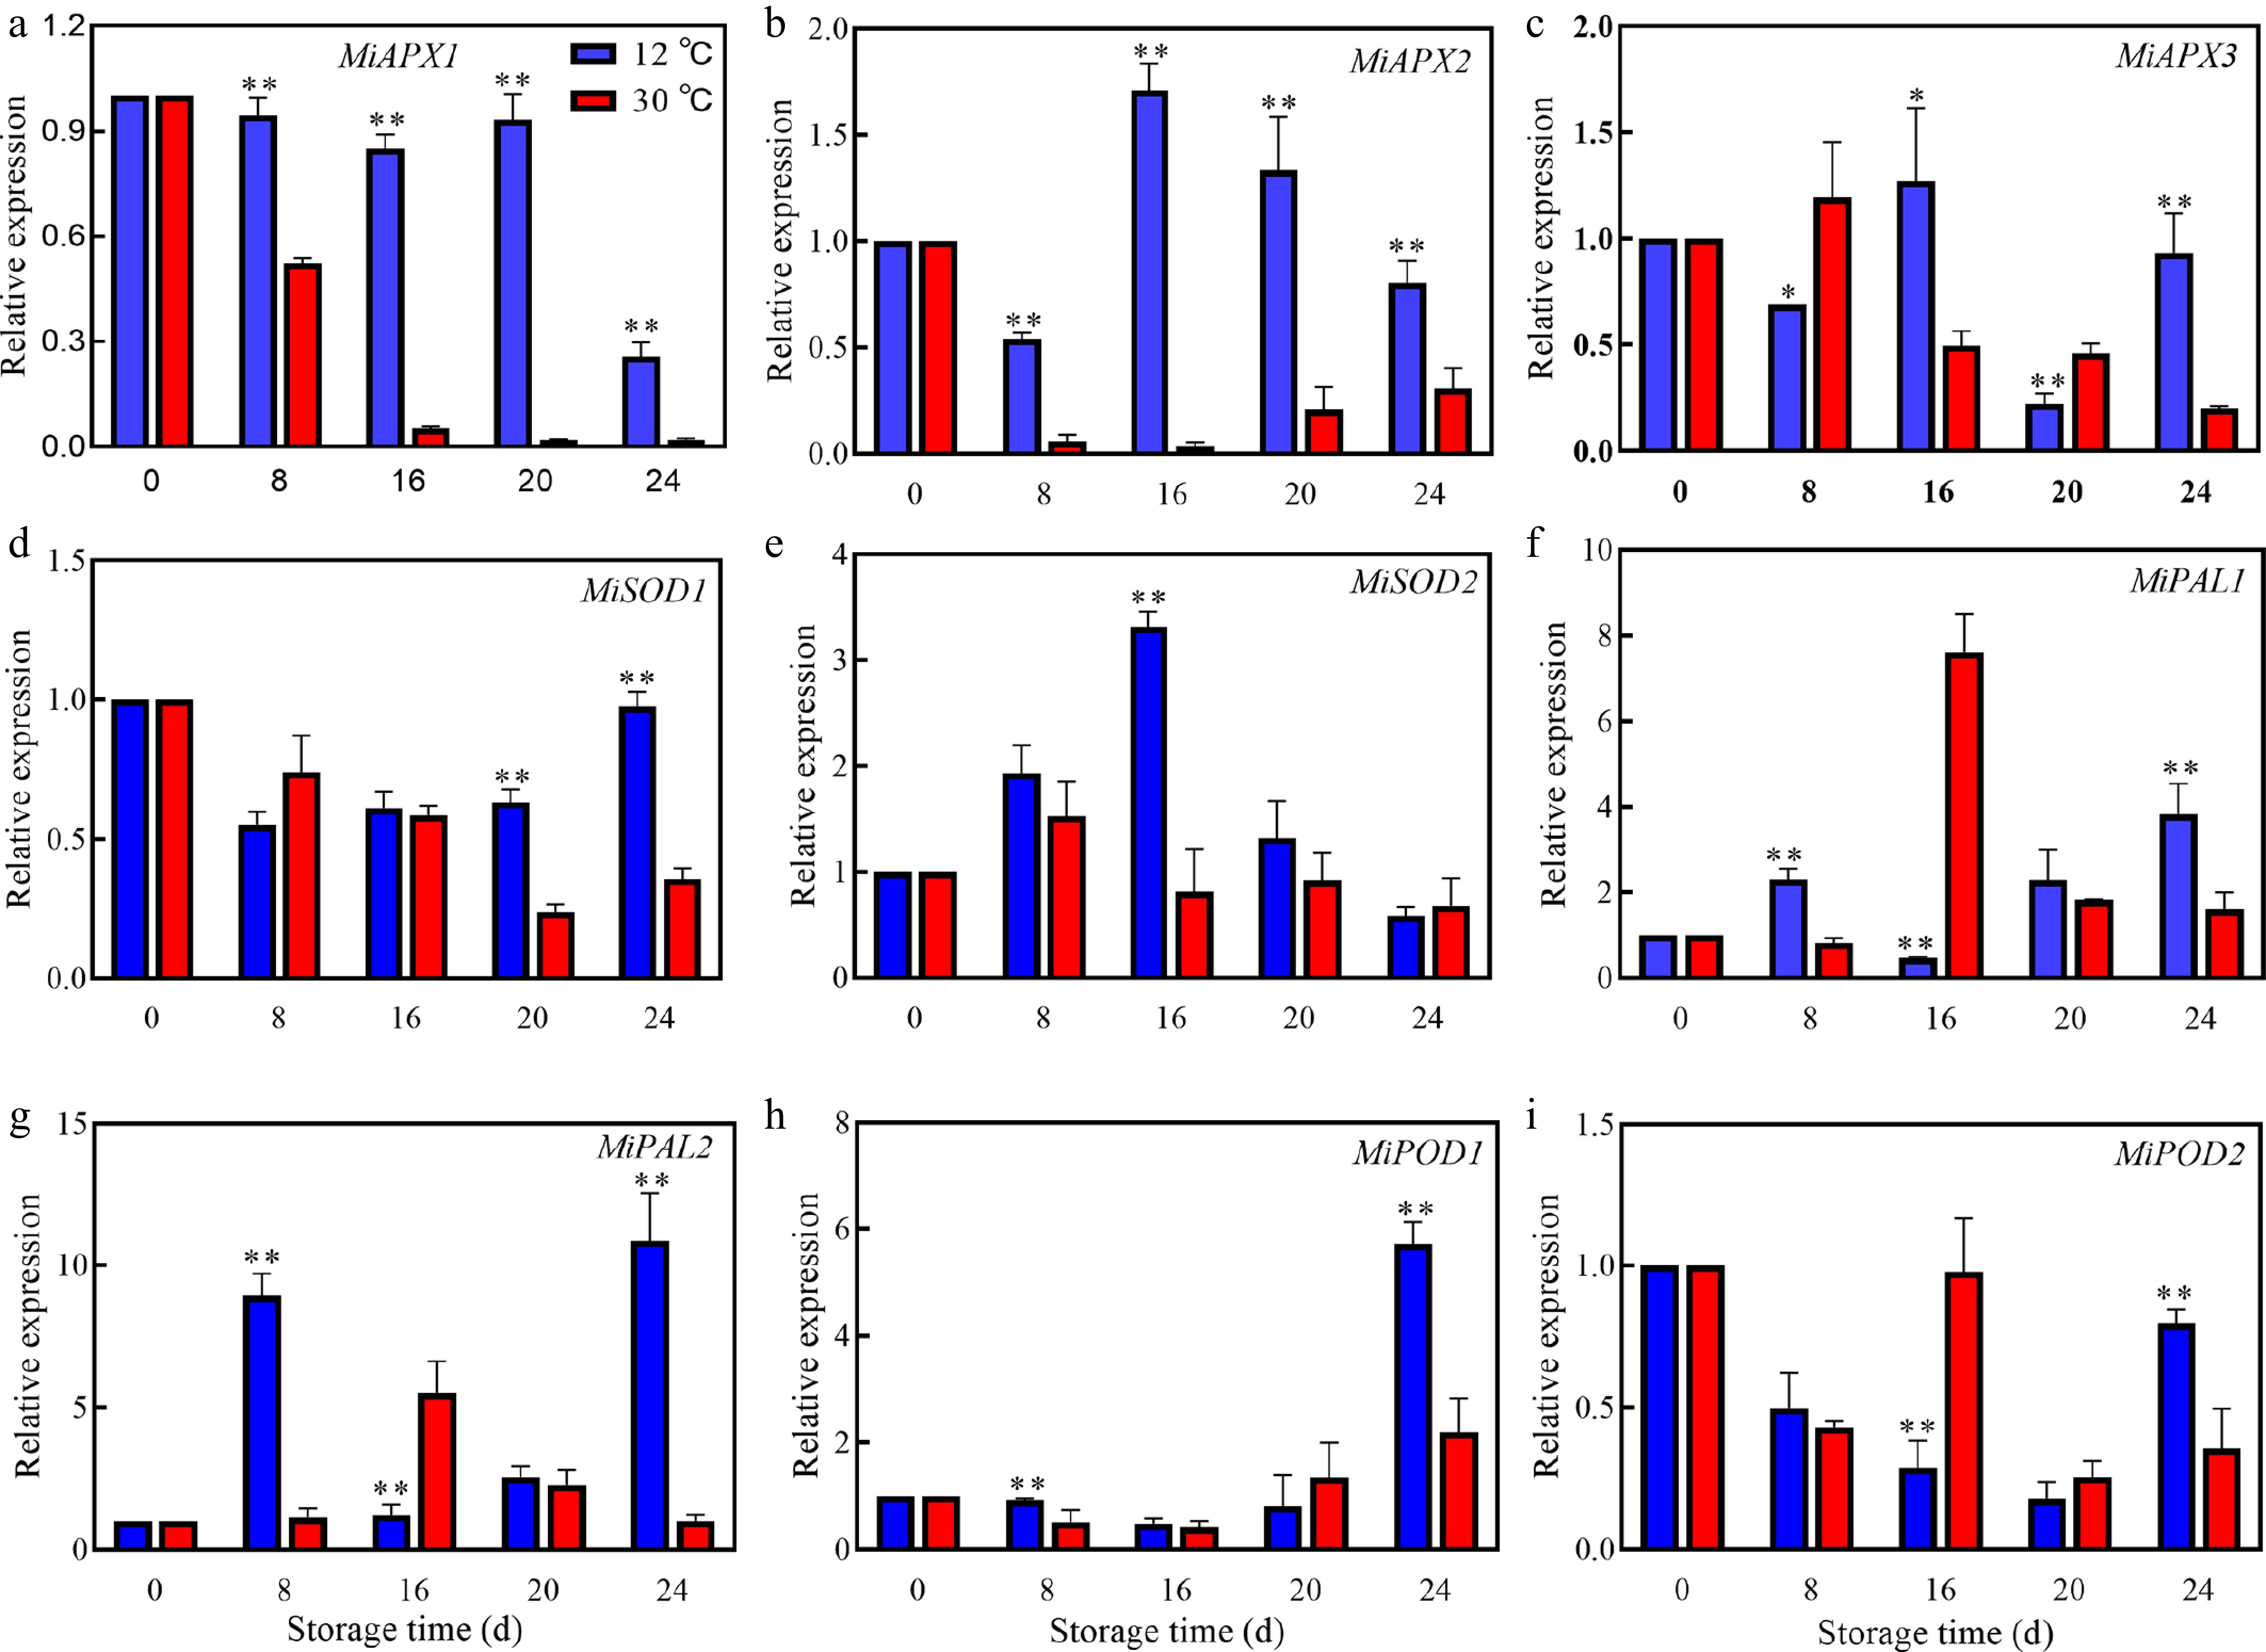
Figure 5.
Changes in relative expressions of (a) MiAPX1, (b) MiAPX2, (c) MiAPX3, (d) MiSOD1, (e) MiSOD2, (f) MiPAL1, (g) MiPAL2, (h) MiPOD1, and (i) MiPOD2 of mangoes stored at 30 and 12 °C. Vertical bars represent the standard error of the mean, the asterisks indicate significant difference between two groups at corresponding sampling point (* p < 0.05, ** p < 0.01).
-
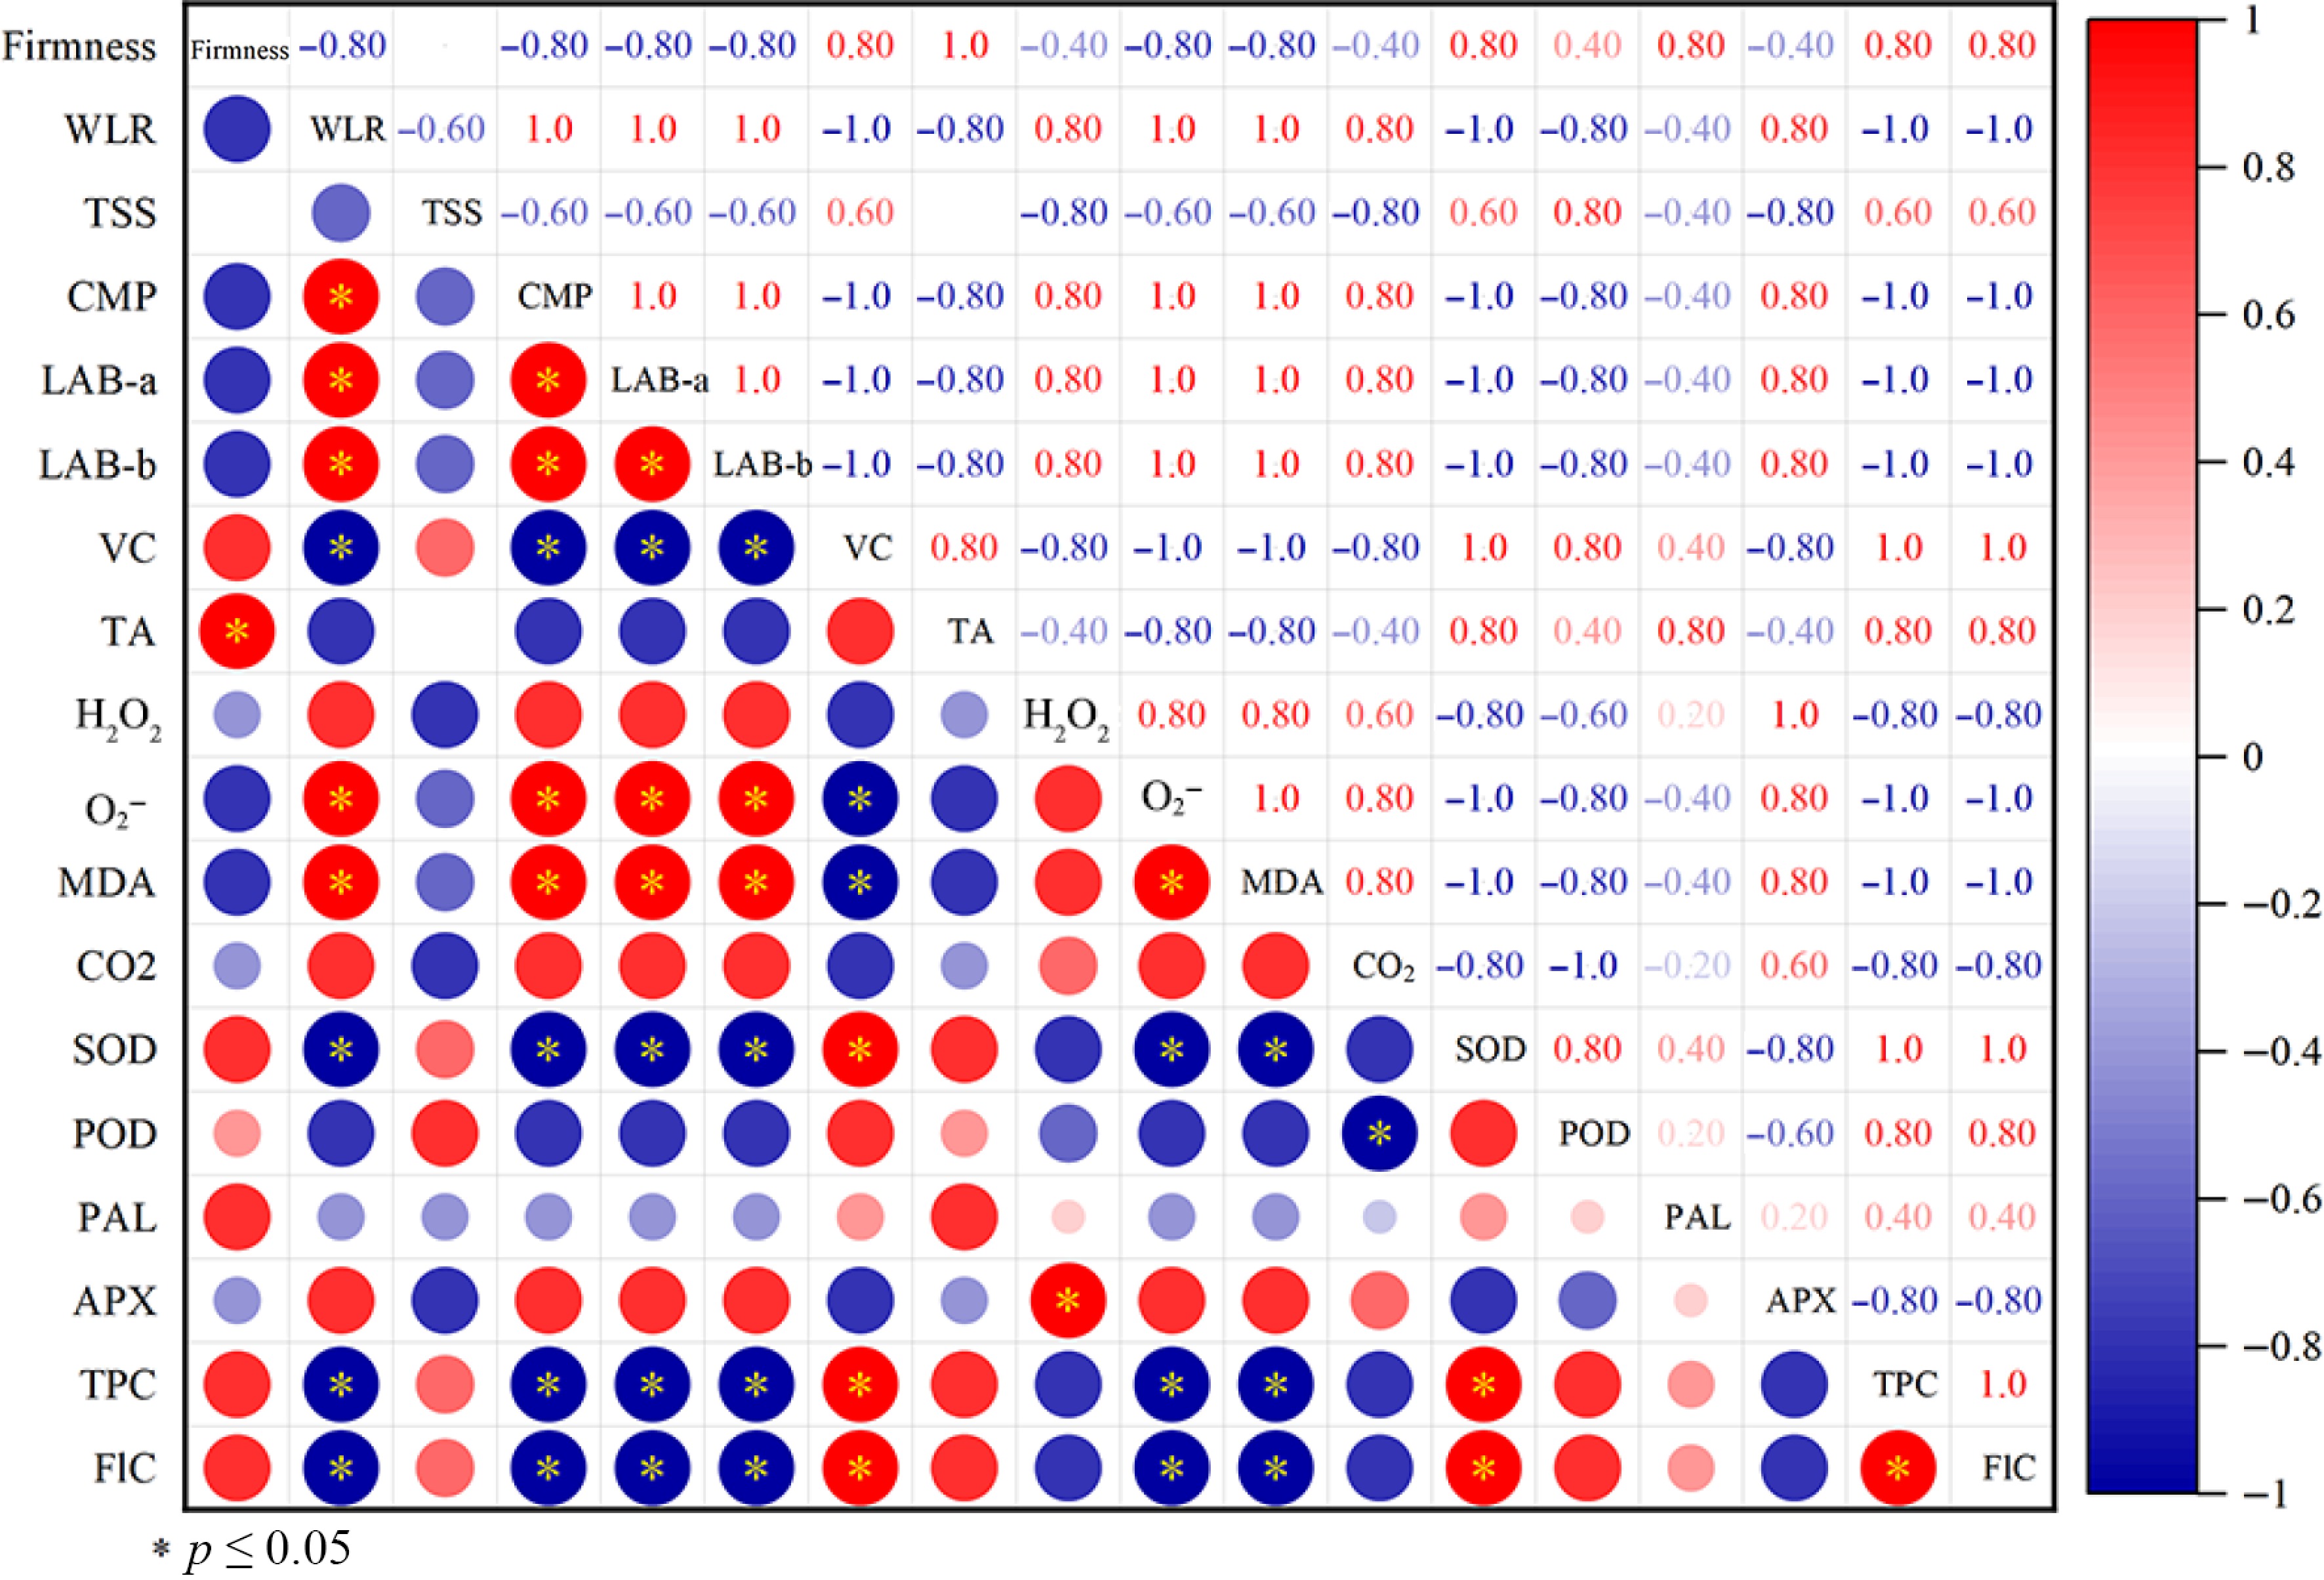
Figure 6.
Correlation analysis between quality indicators, ROS accumulation, and enzyme activities.
Figures
(6)
Tables
(0)