-
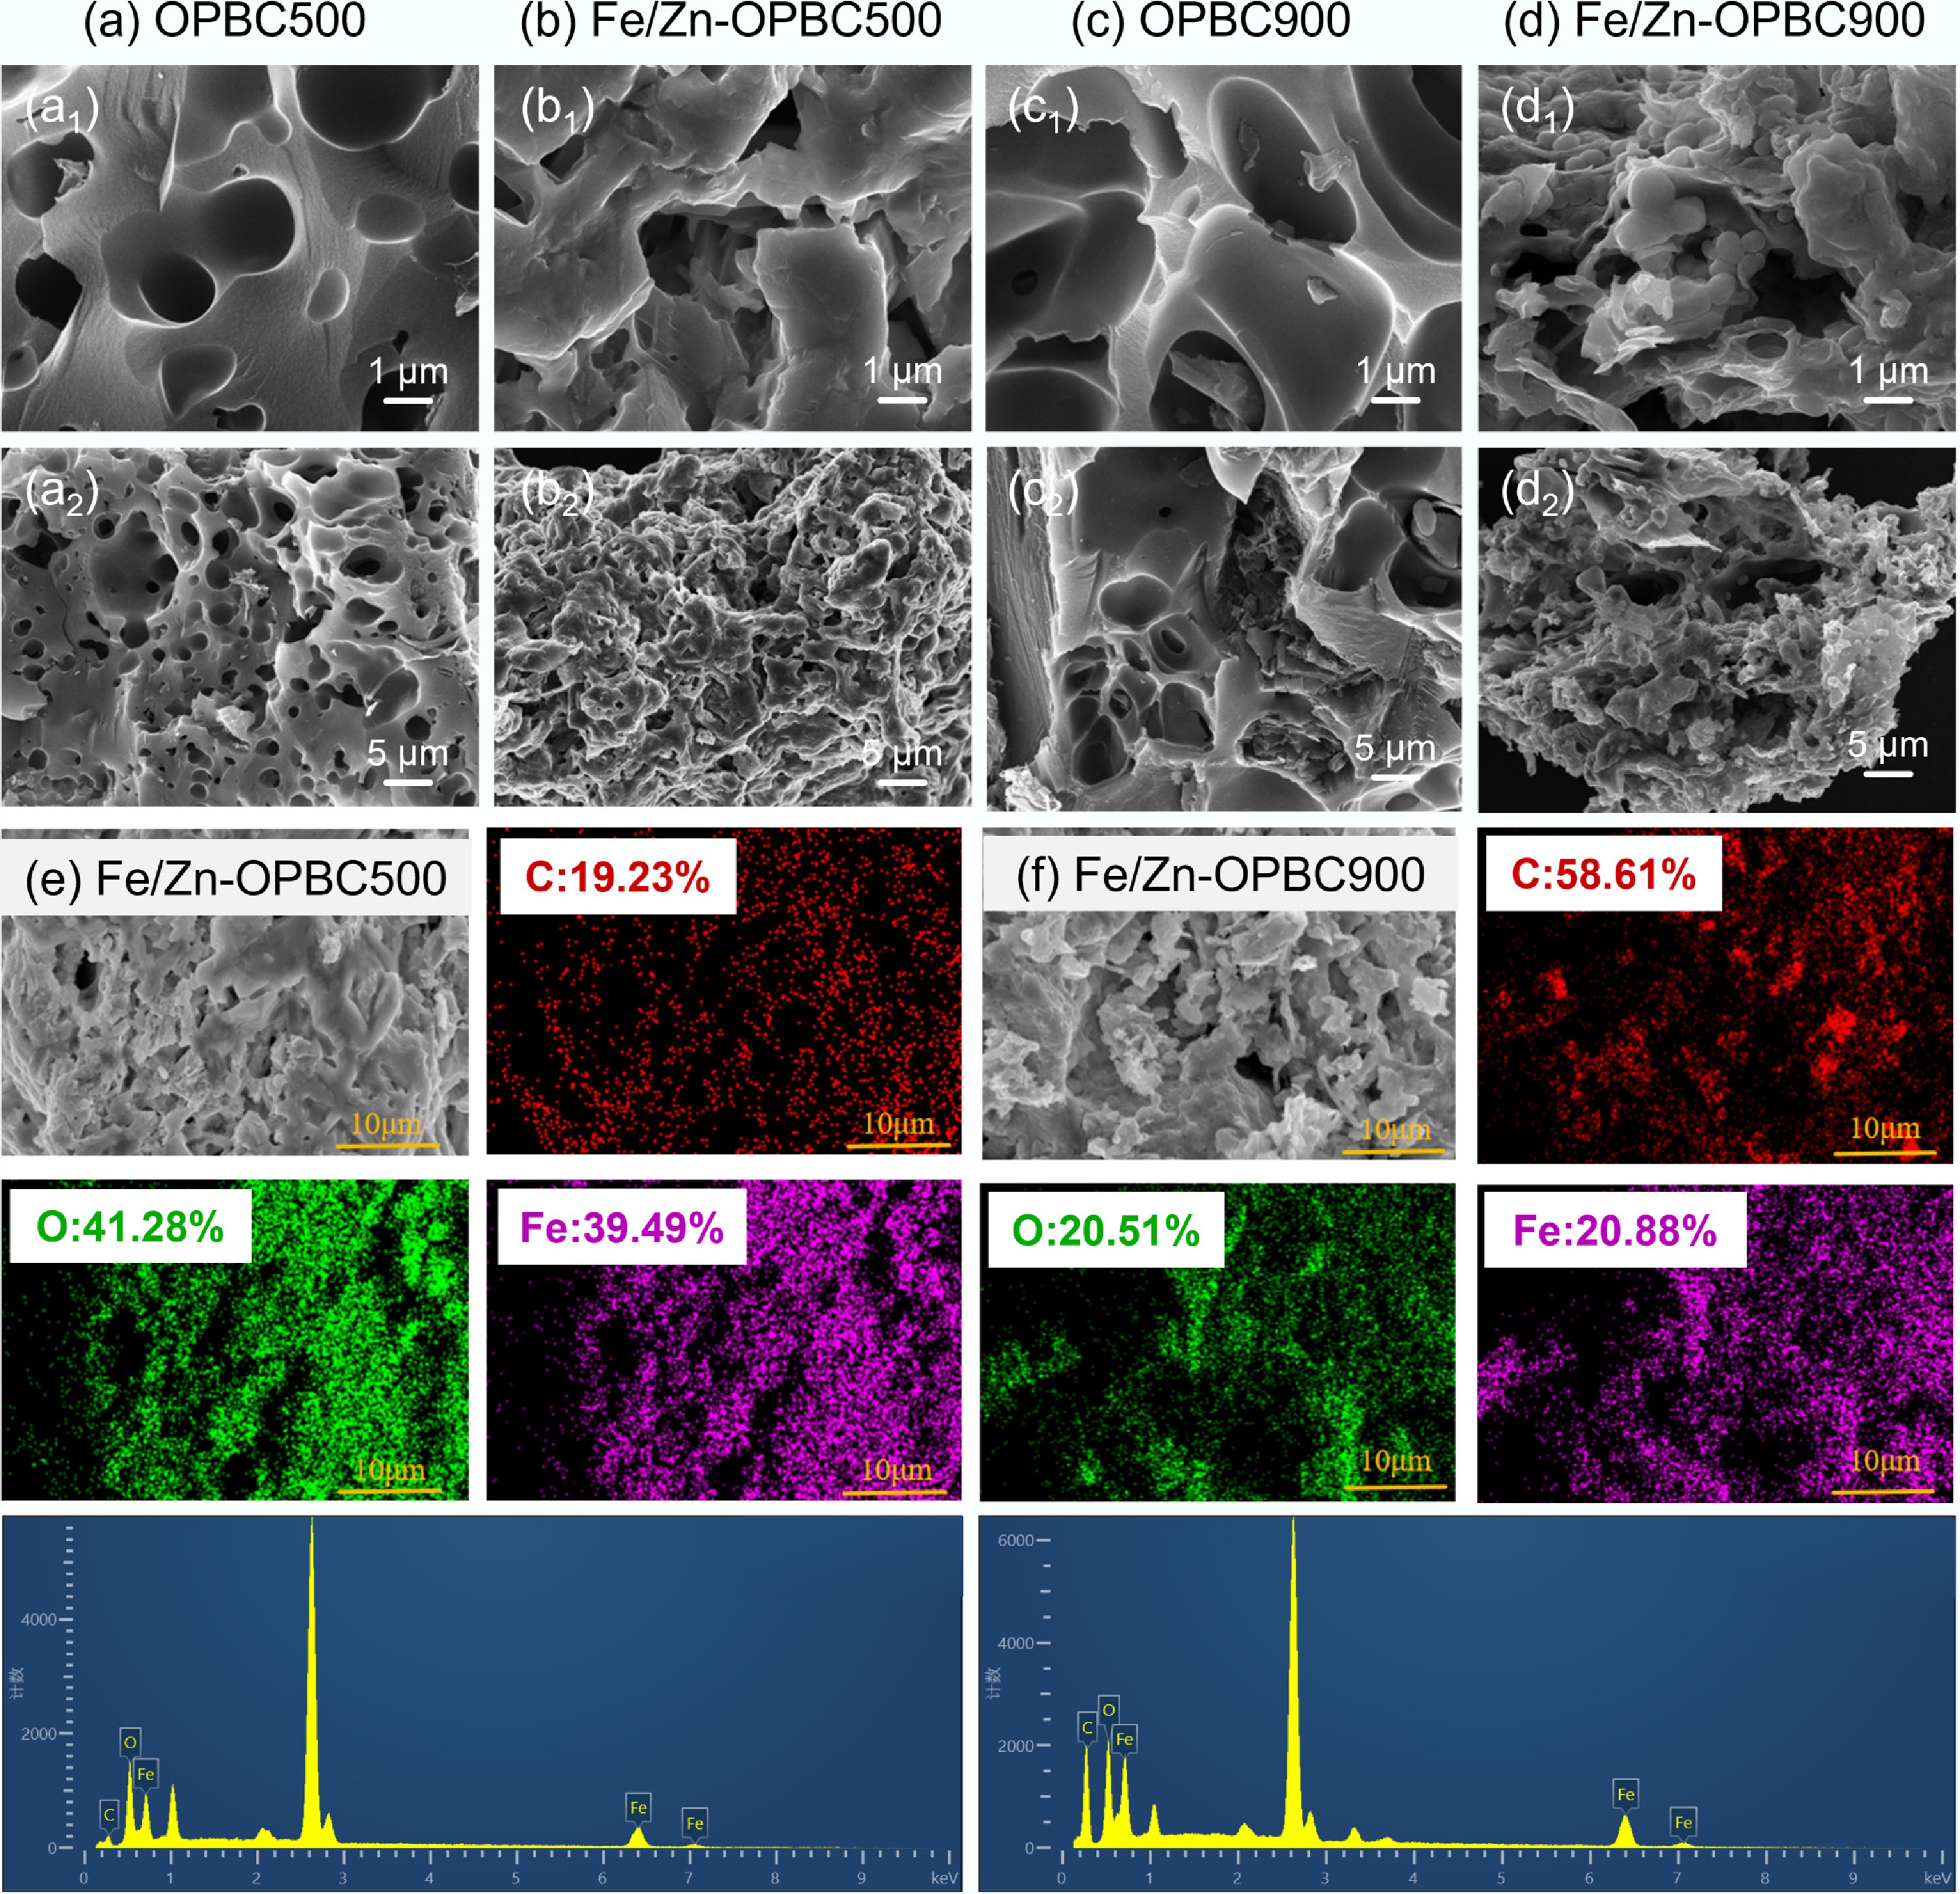
Figure 1.
SEM images of the samples at various magnifications: (a) OPBC500, (b) Fe/Zn-OPBC500, (c) OPBC900, and (d) Fe/Zn-OPBC900. Elemental mapping and compositional analysis for (e) Fe/Zn-OPBC500, and (f) Fe/Zn-OPBC900 are also presented.
-
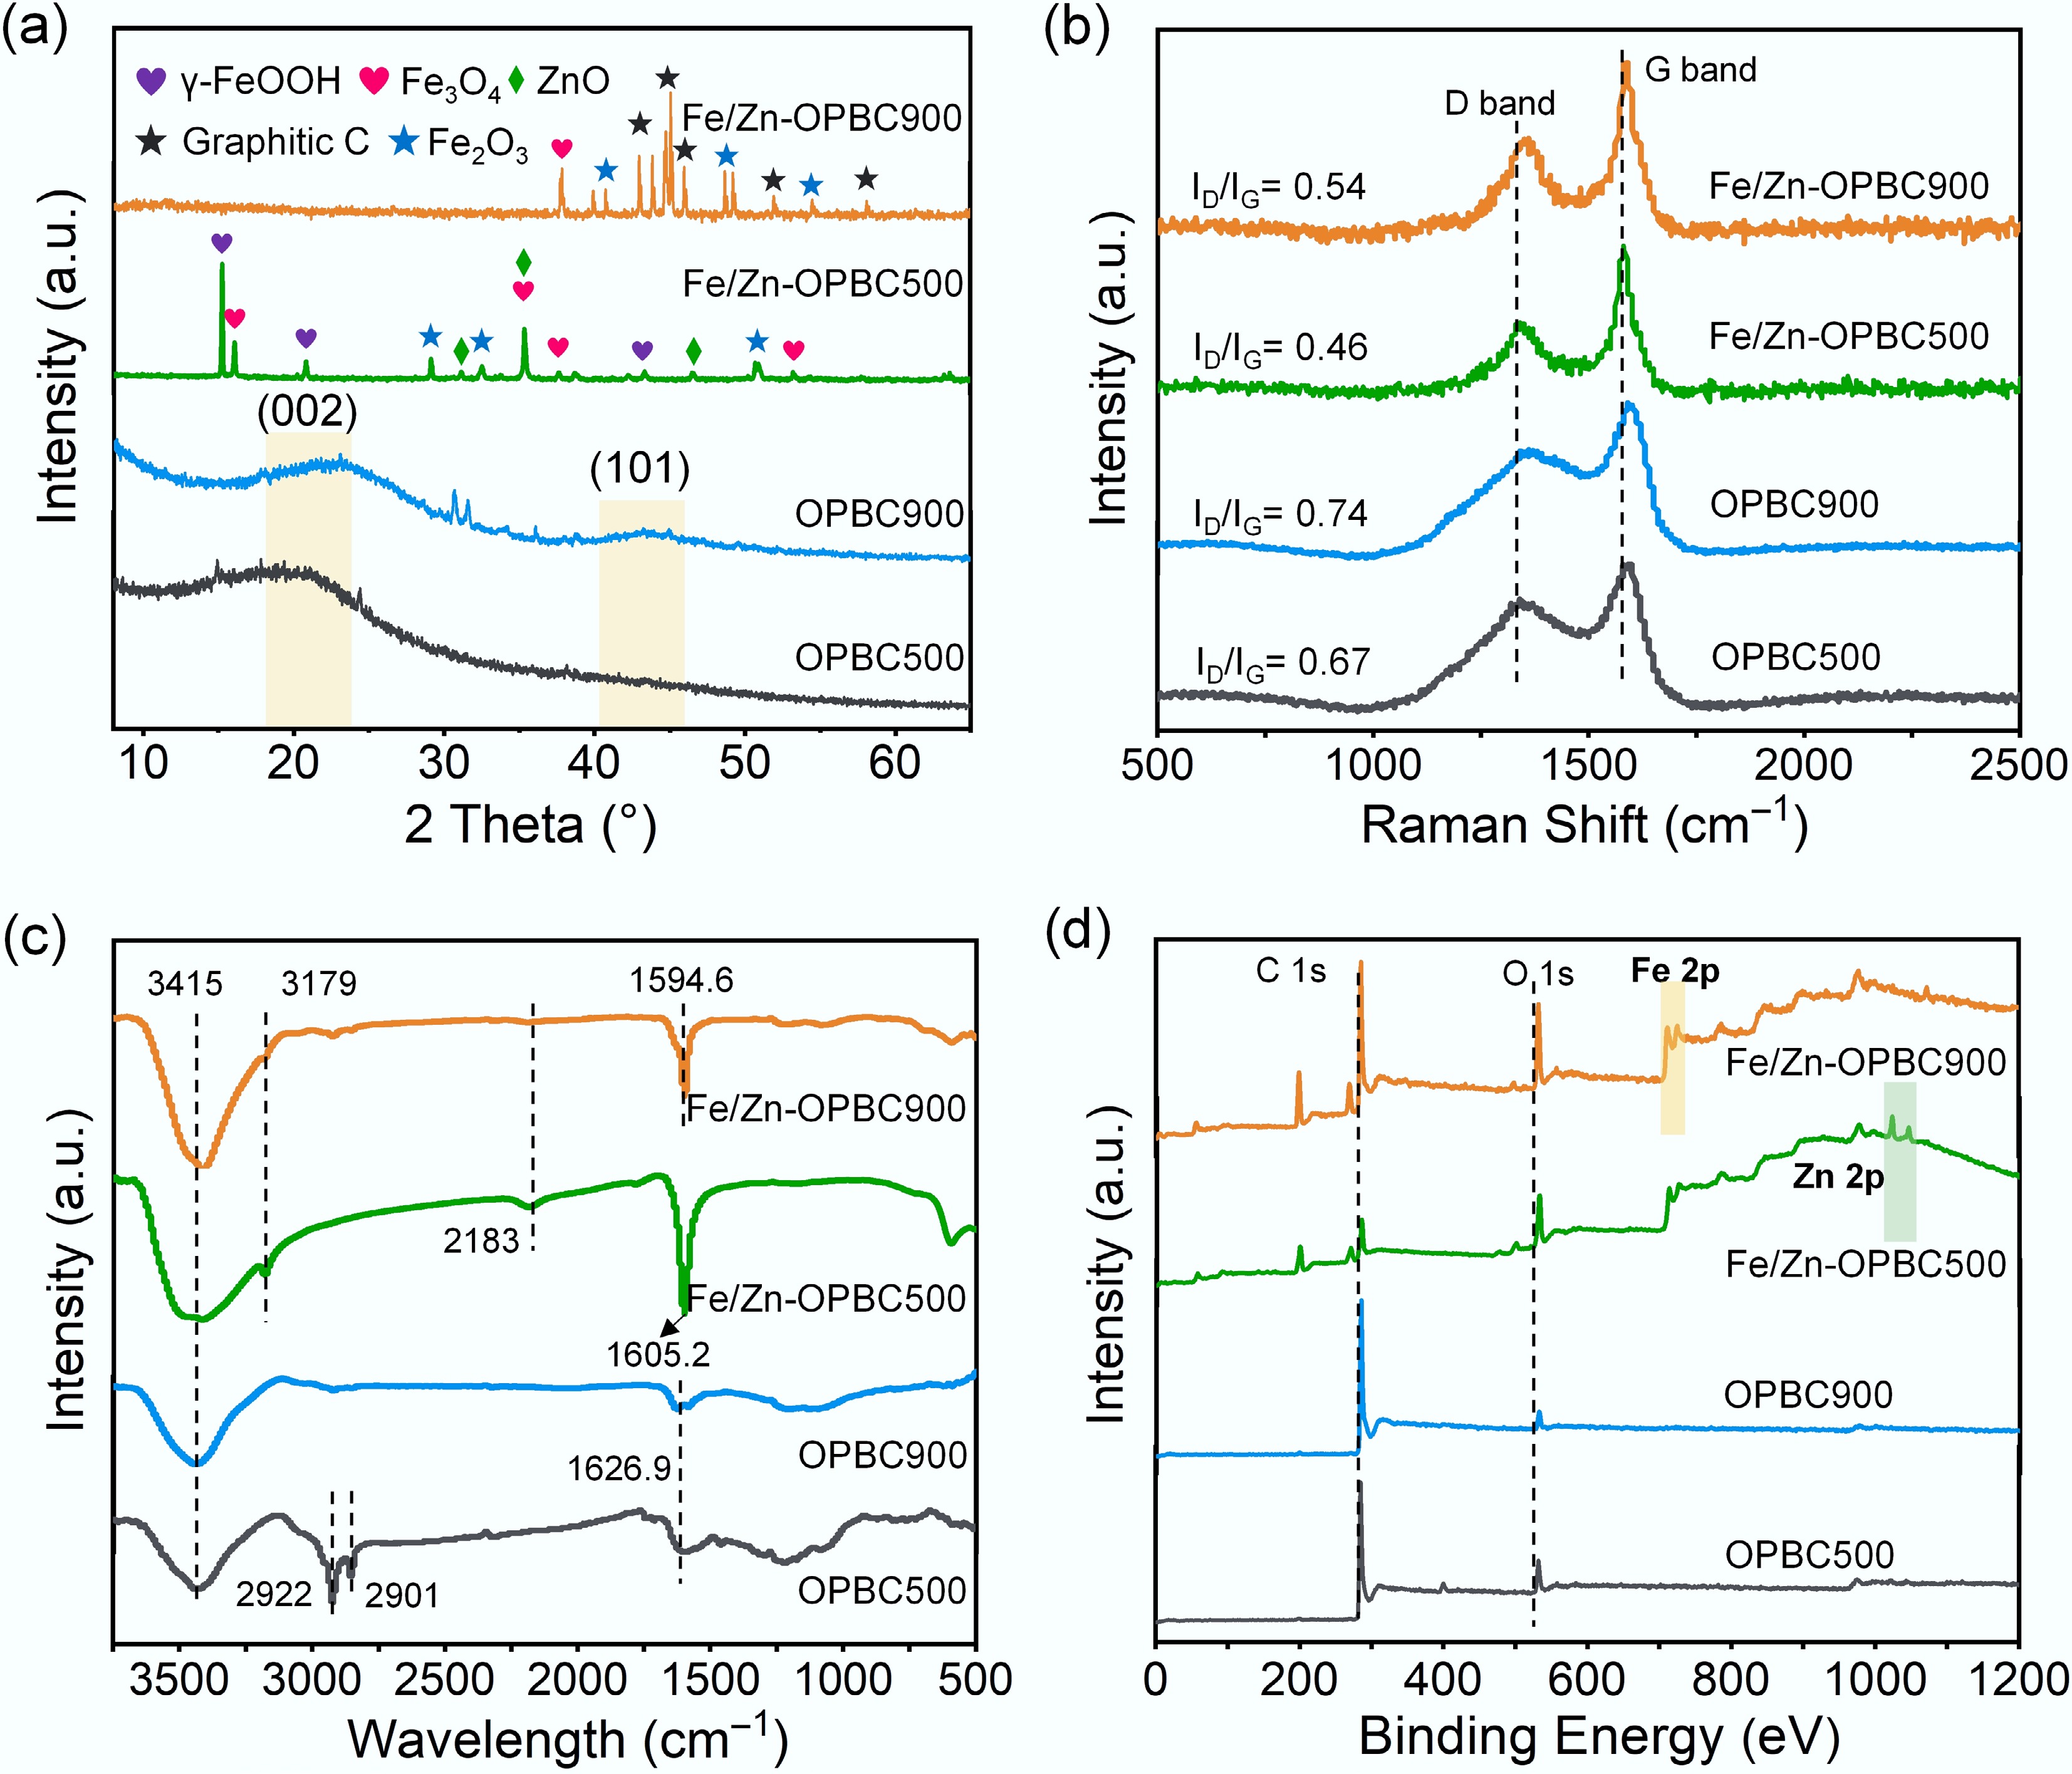
Figure 2.
(a) XRD patterns, (b) Raman spectra, (c) FTIR spectra, and (d) XPS spectra of various OPBCs.
-
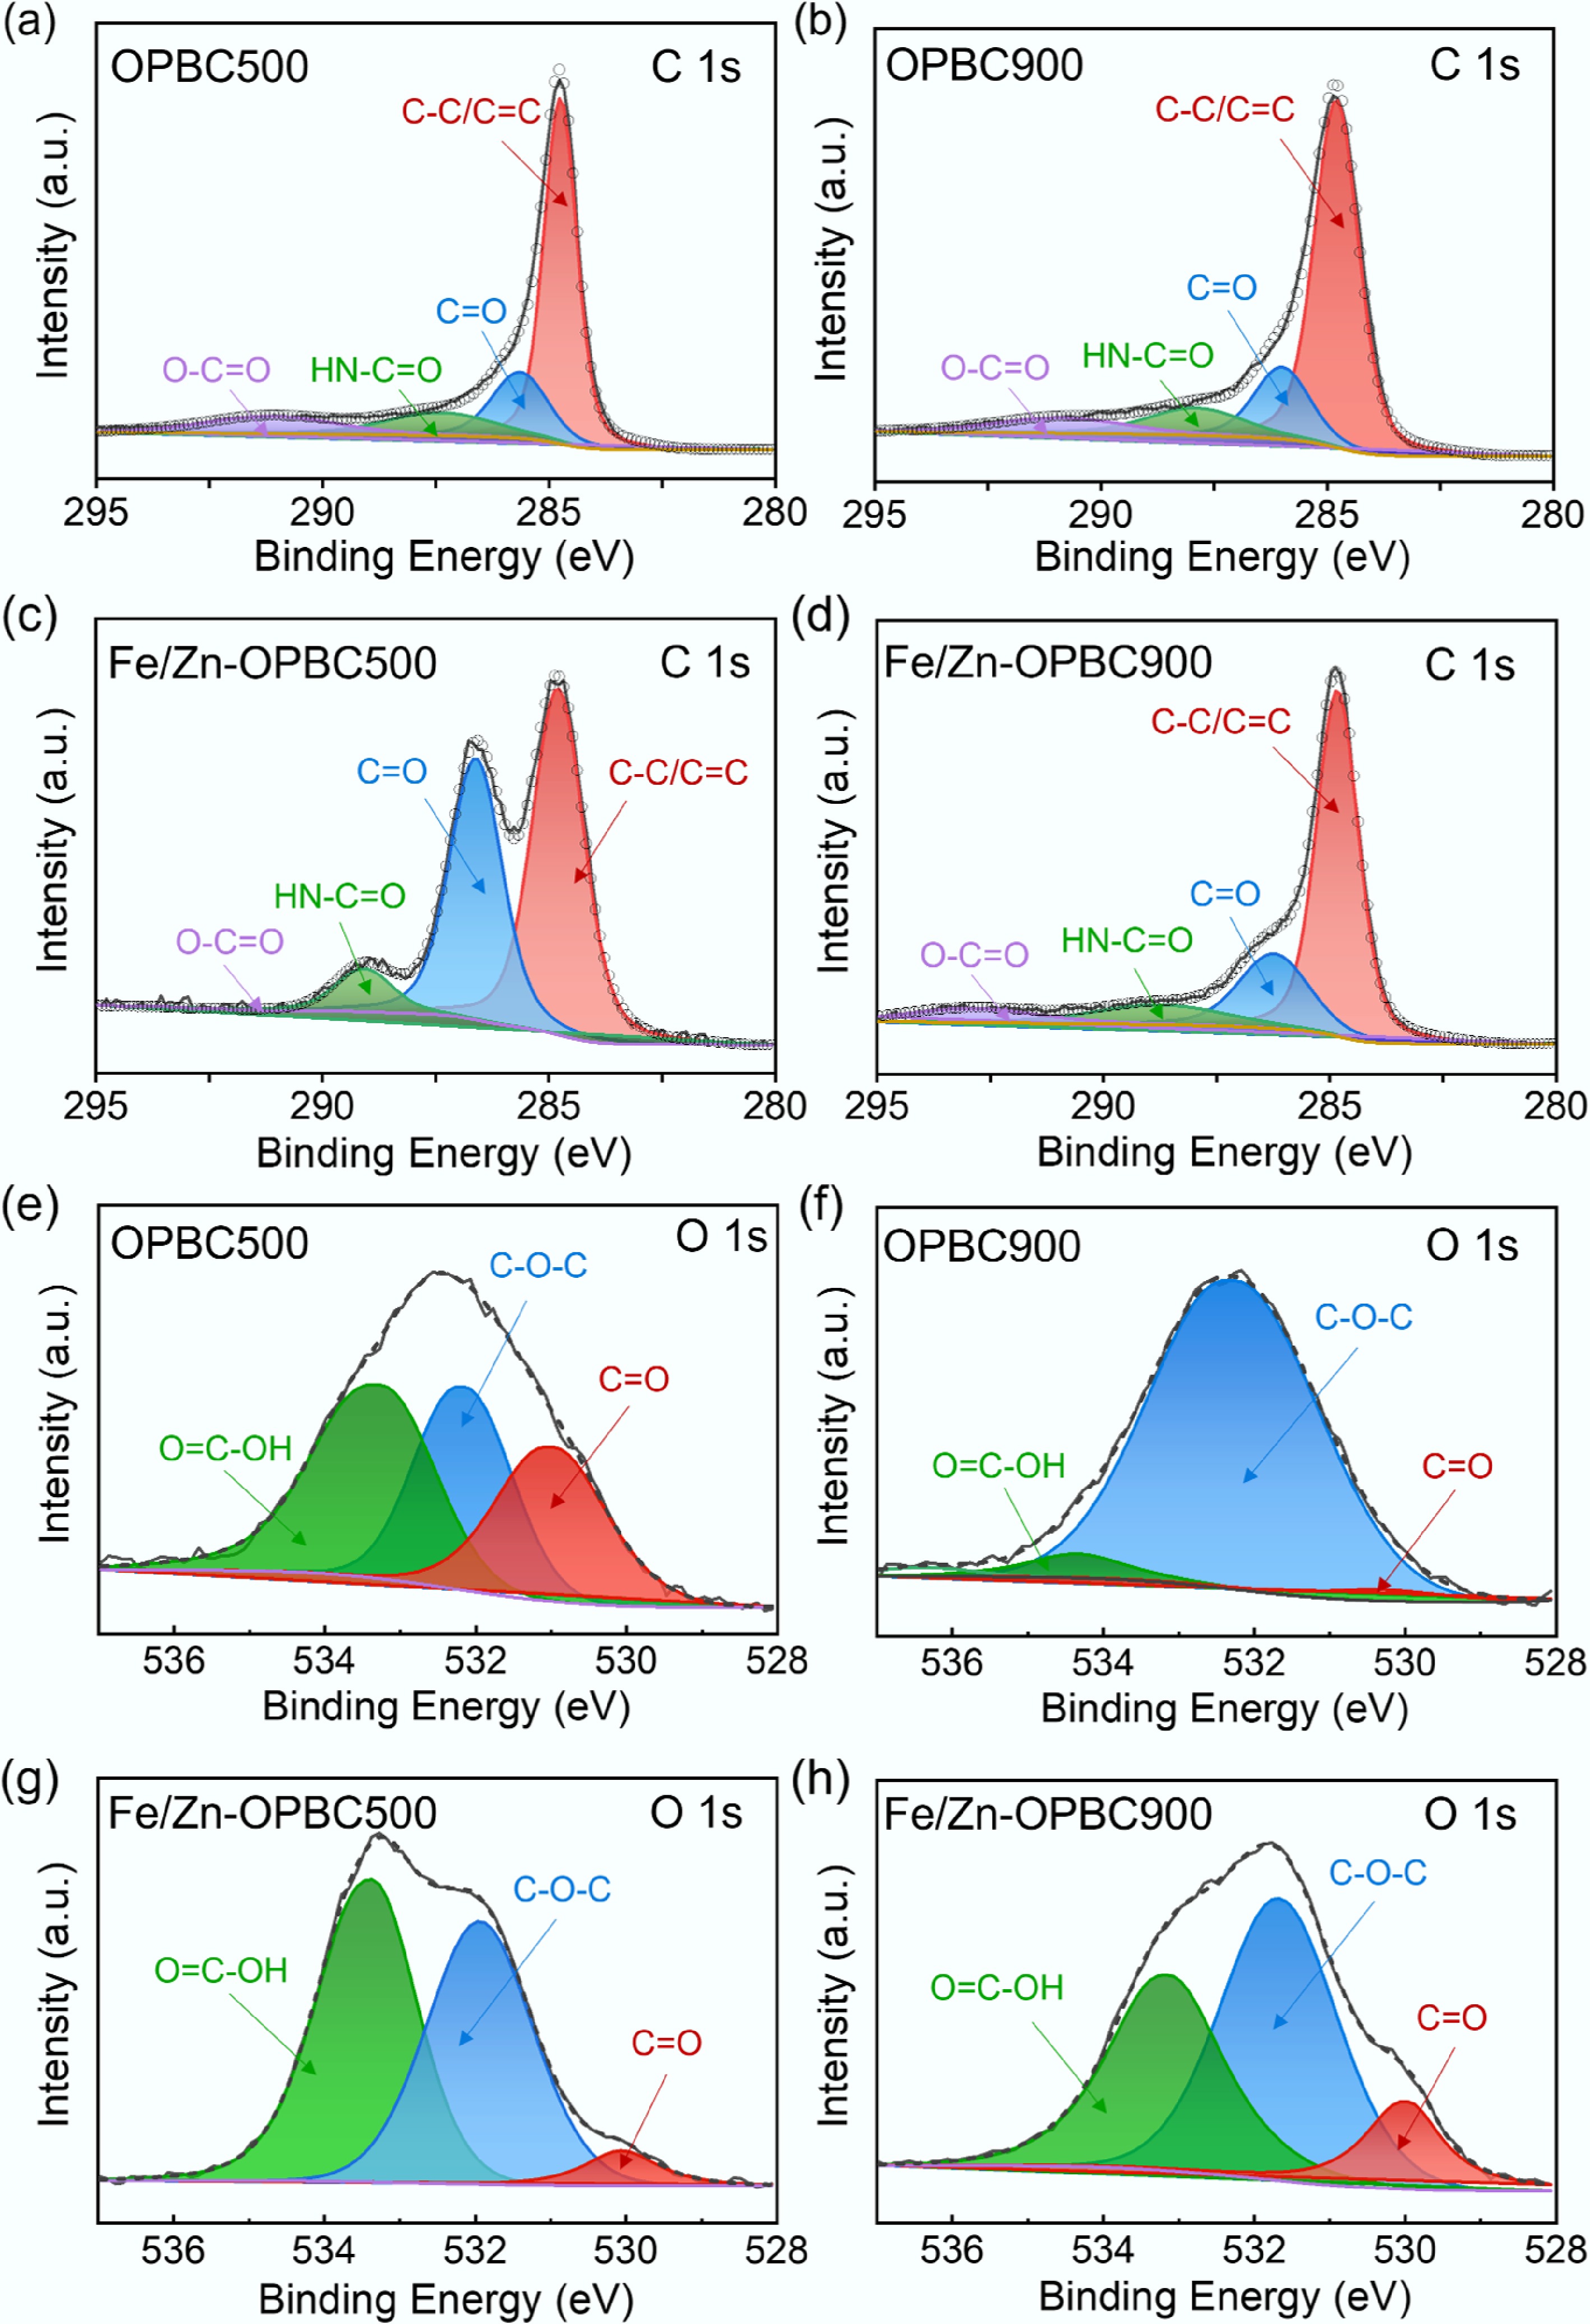
Figure 3.
High-resolution XPS spectra of (a)–(d) C 1s and (e)–(h) O 1s for OPBCs and Fe/Zn-OPBCs.
-
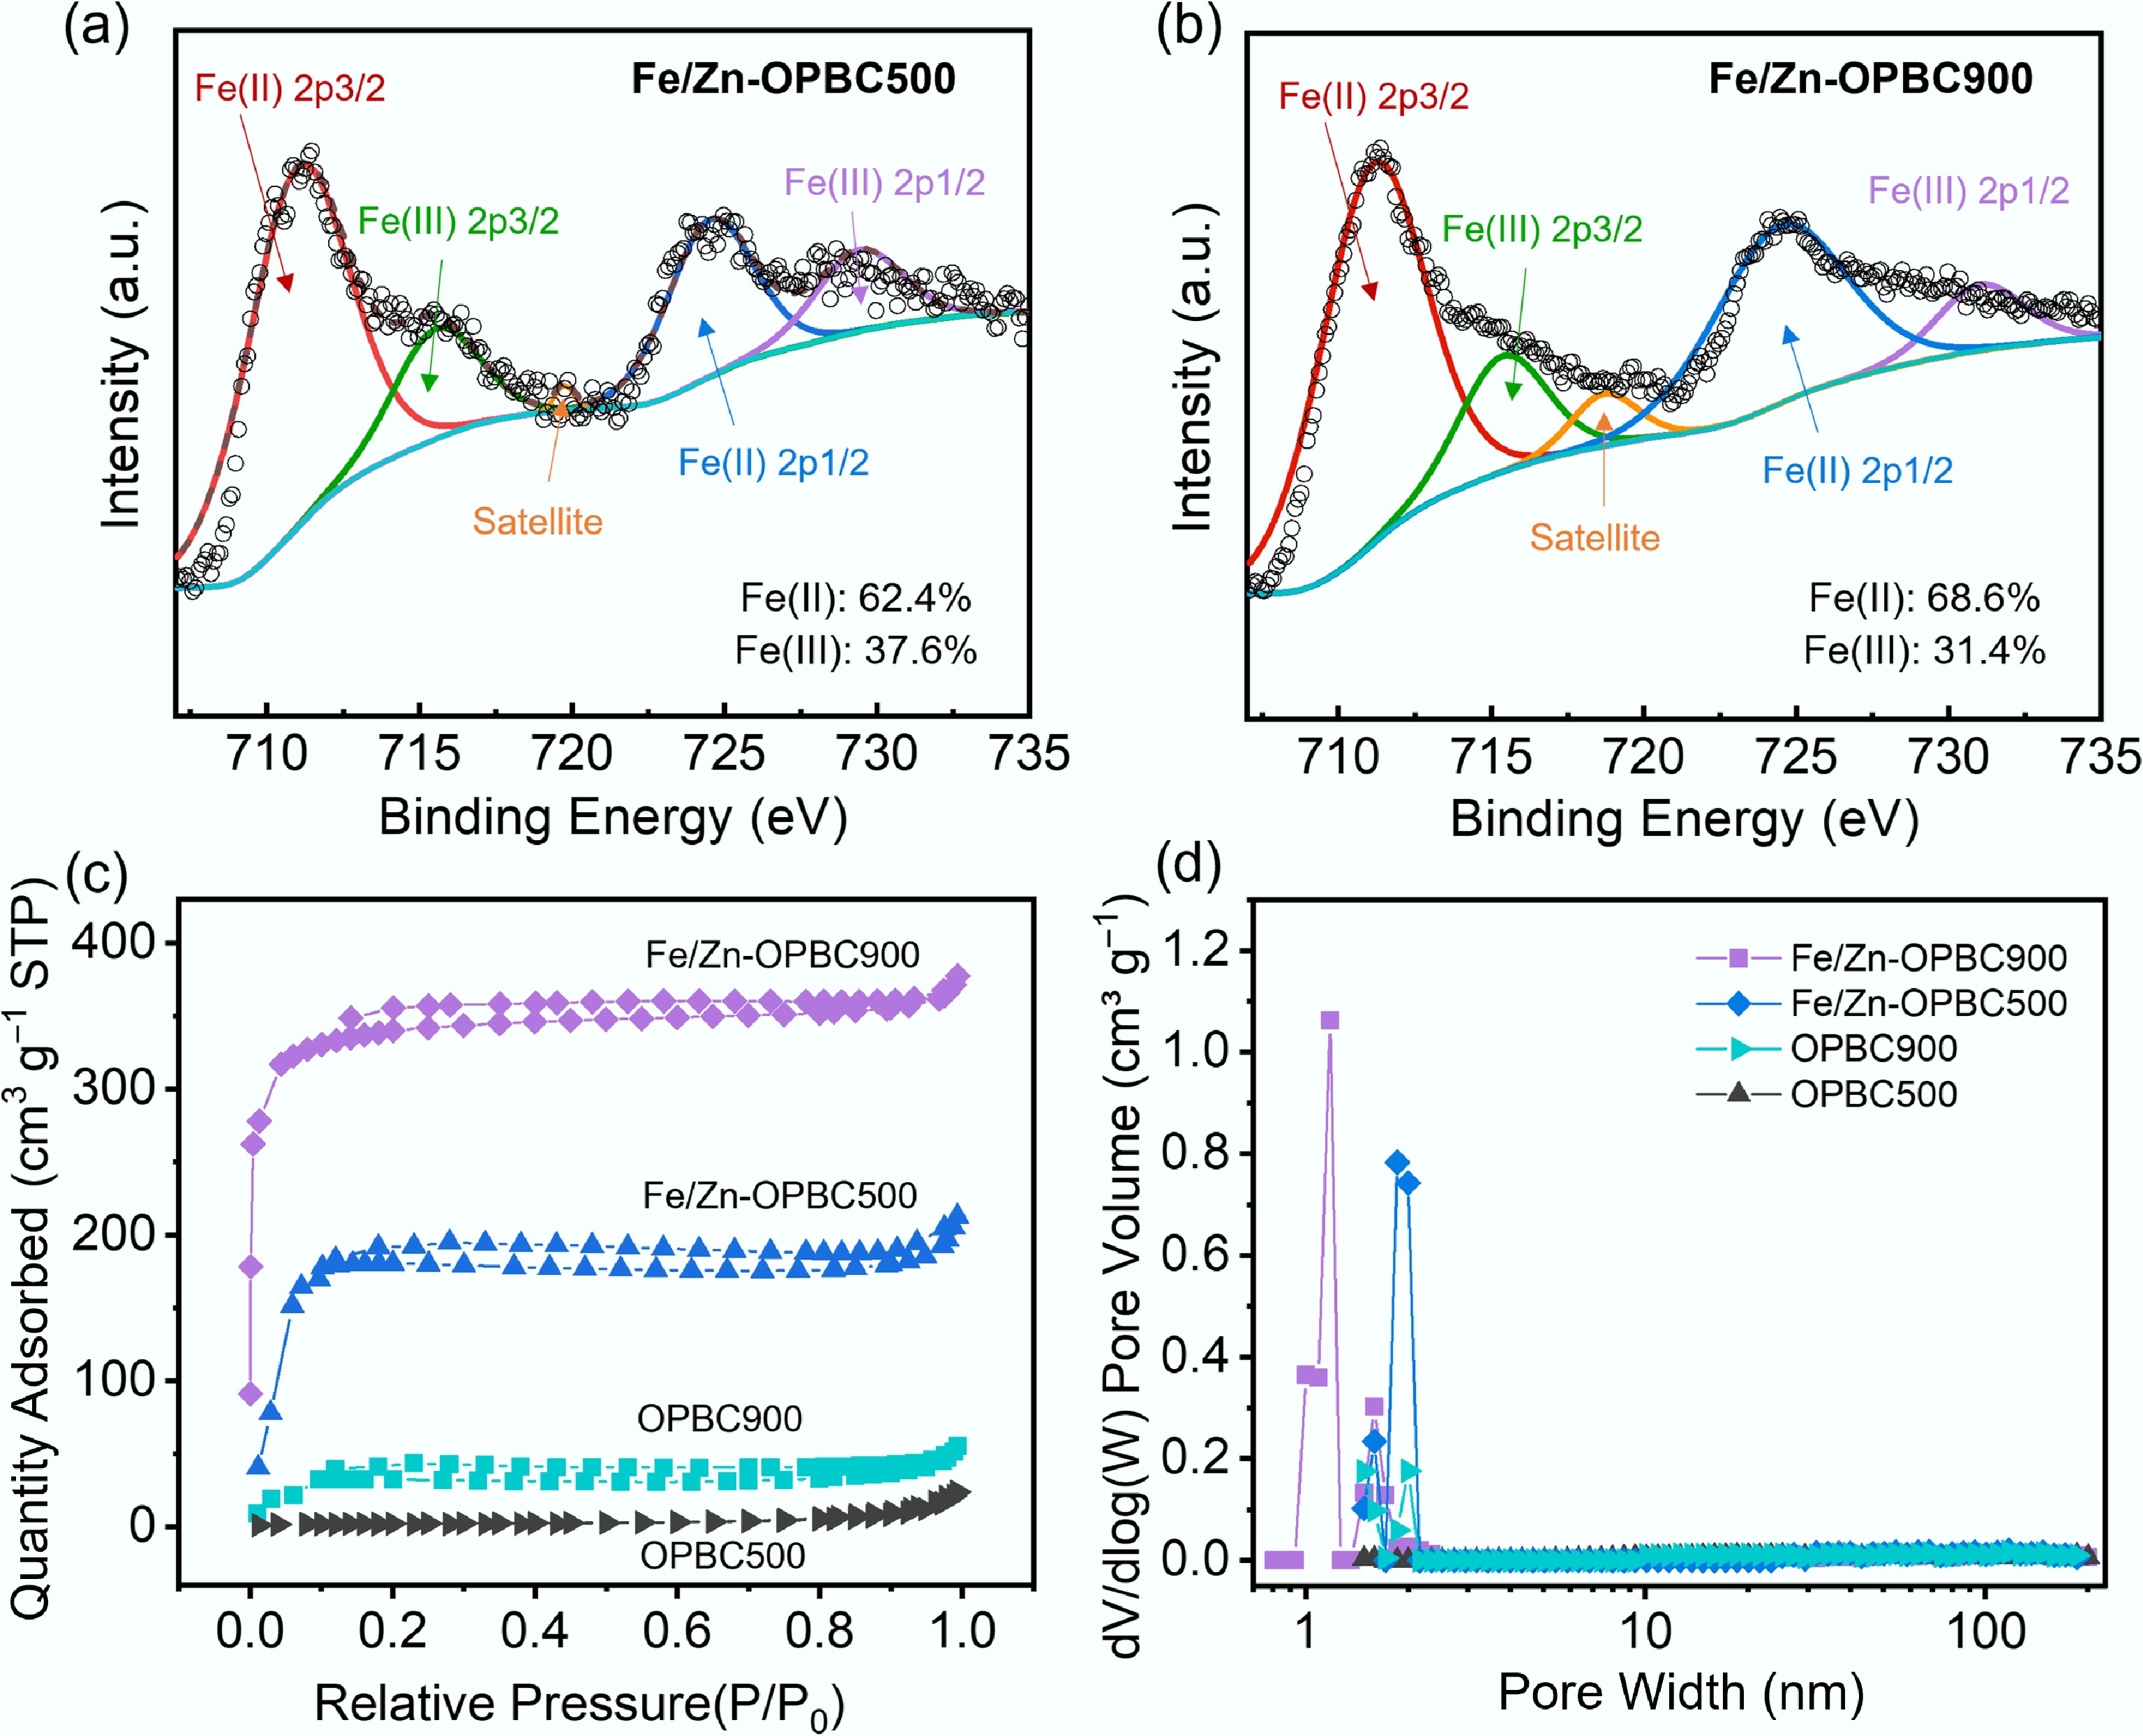
Figure 4.
High-resolution XPS spectra of Fe 2p for (a) Fe/Zn-OPBC500 and (b) Fe/Zn-OPBC900. (c) N2 adsorption-desorption isotherms. (d) Corresponding pore size distribution curves.
-
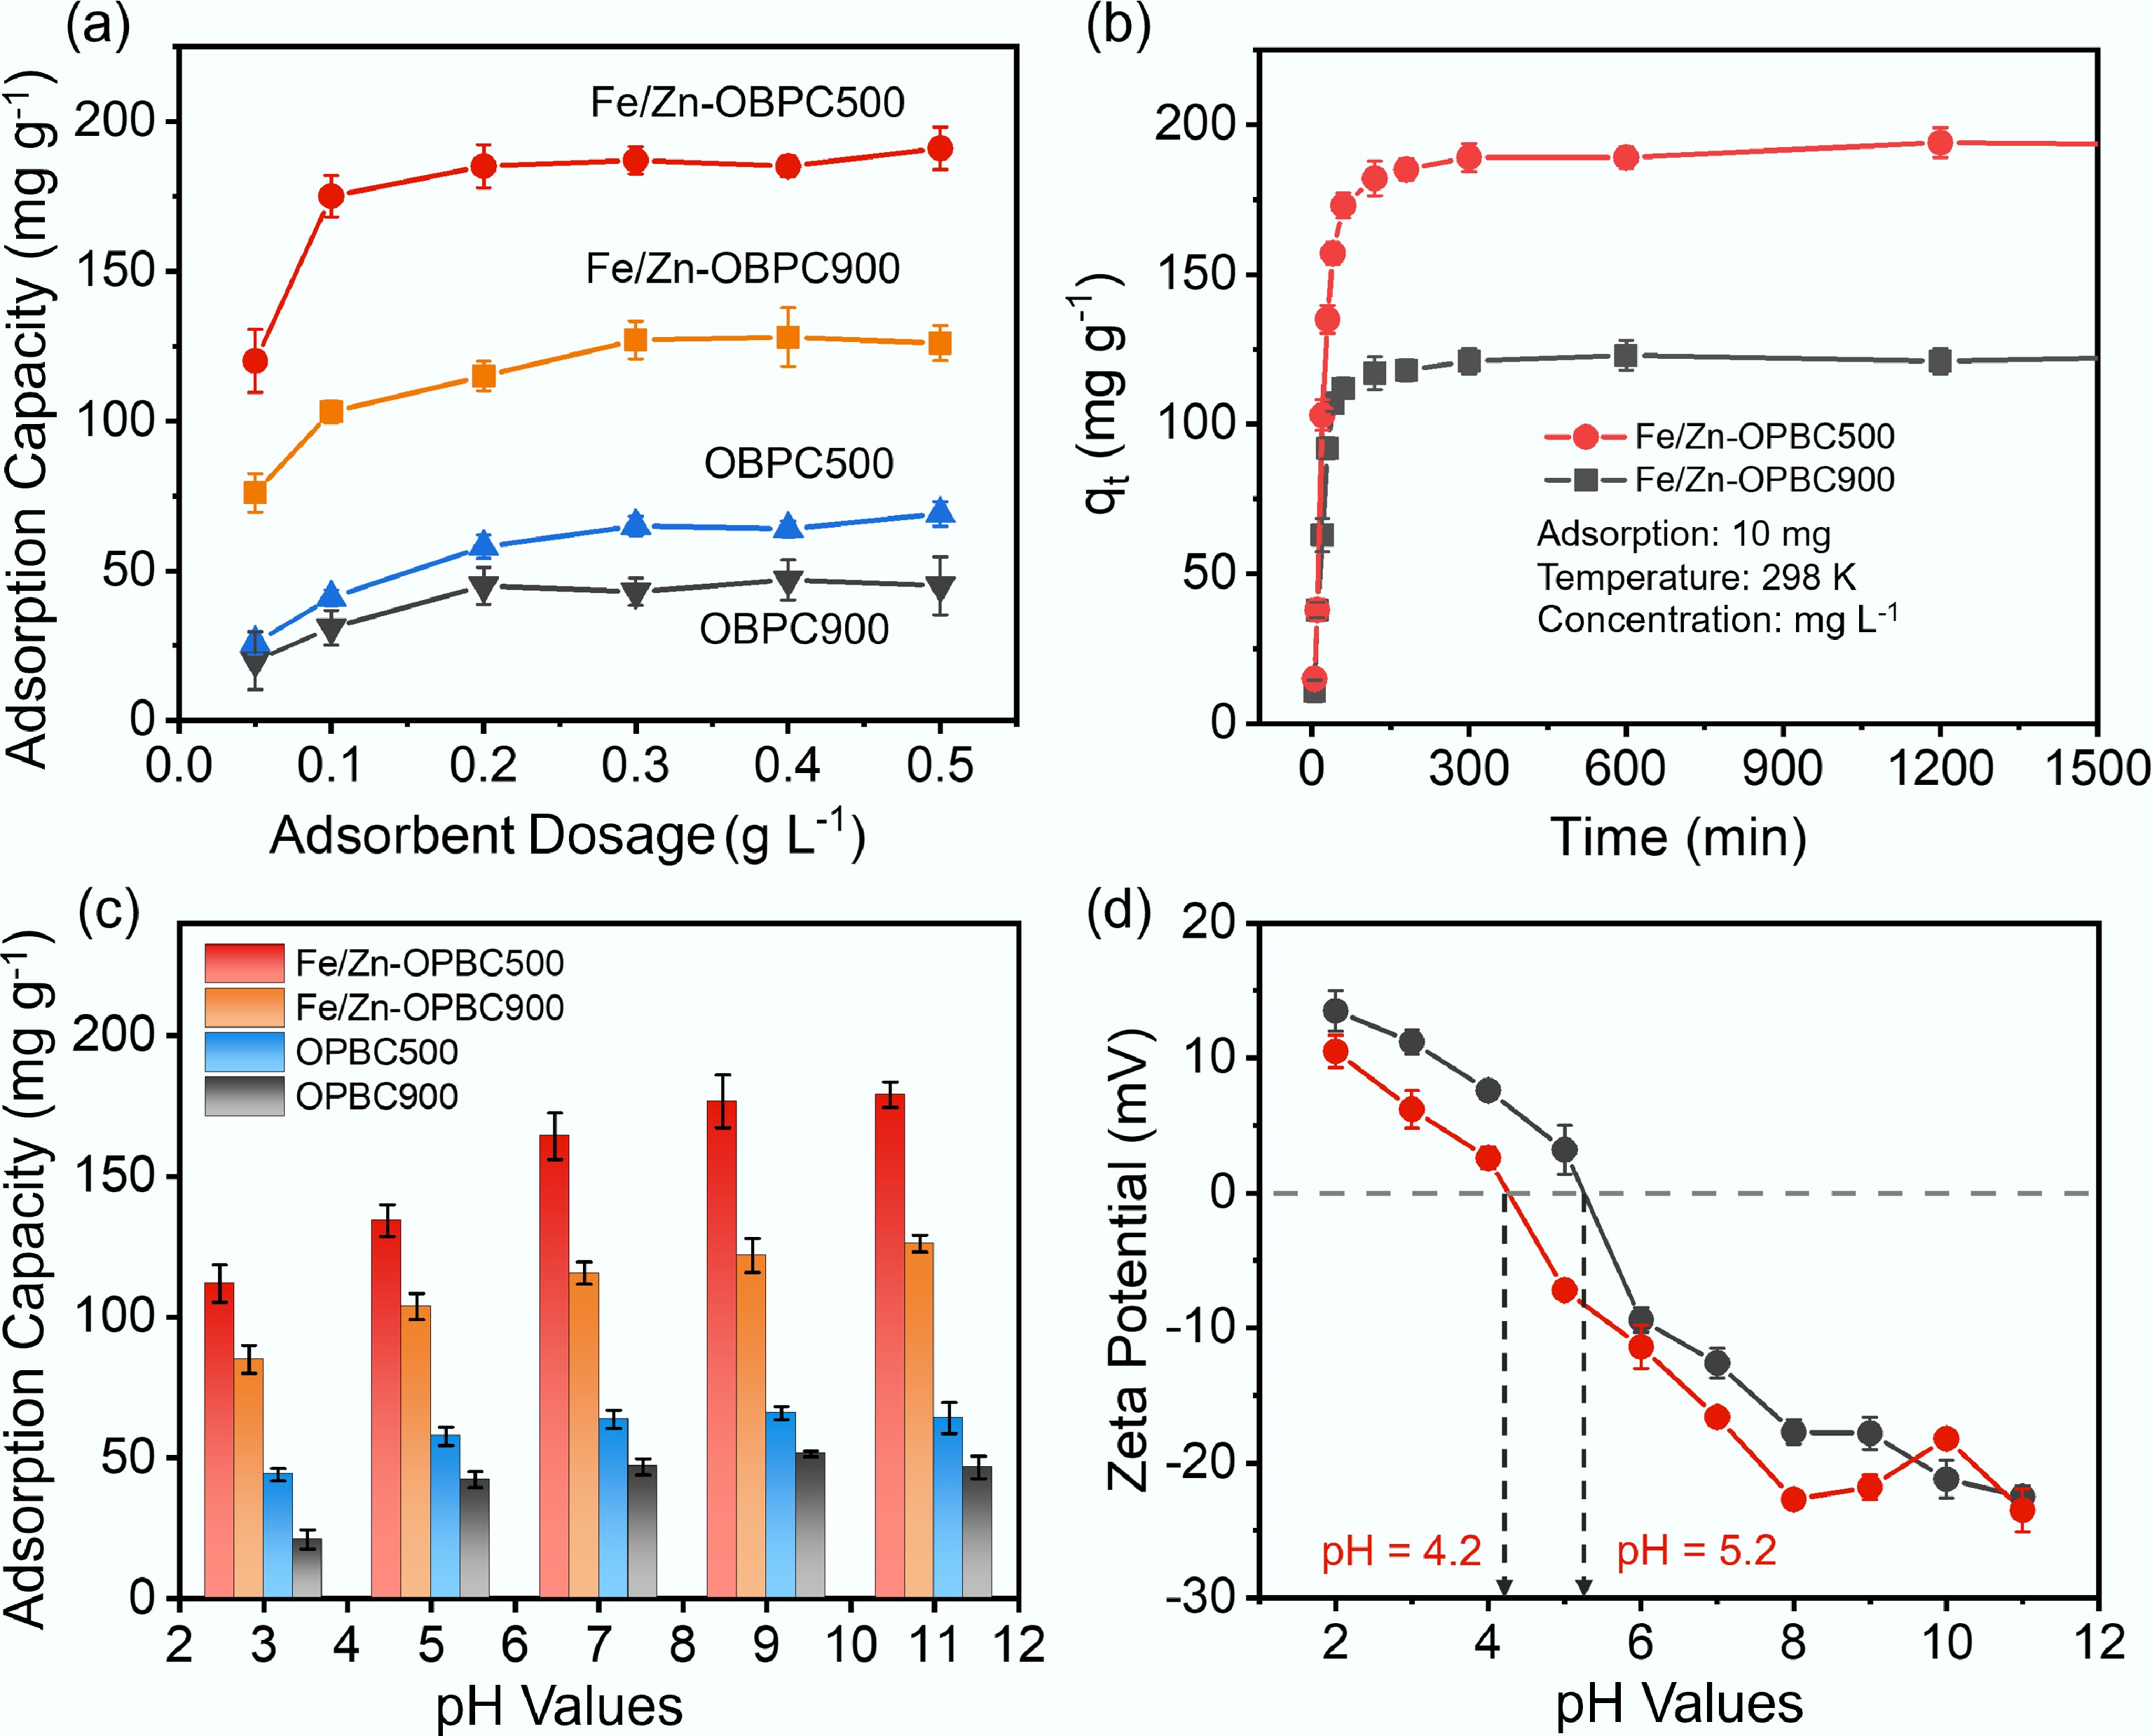
Figure 5.
(a) Effect of adsorbent dosage on adsorption capacity of MB; (b) Effect of reaction time; (c) Effect of pH on MB adsorption capacity; (d) Zeta potentials of Fe/Zn-OPBCs at different pH. Adsorption conditions: C0 = 40 mg L−1, V = 10 mL, pH = 7, and T = 298 K.
-
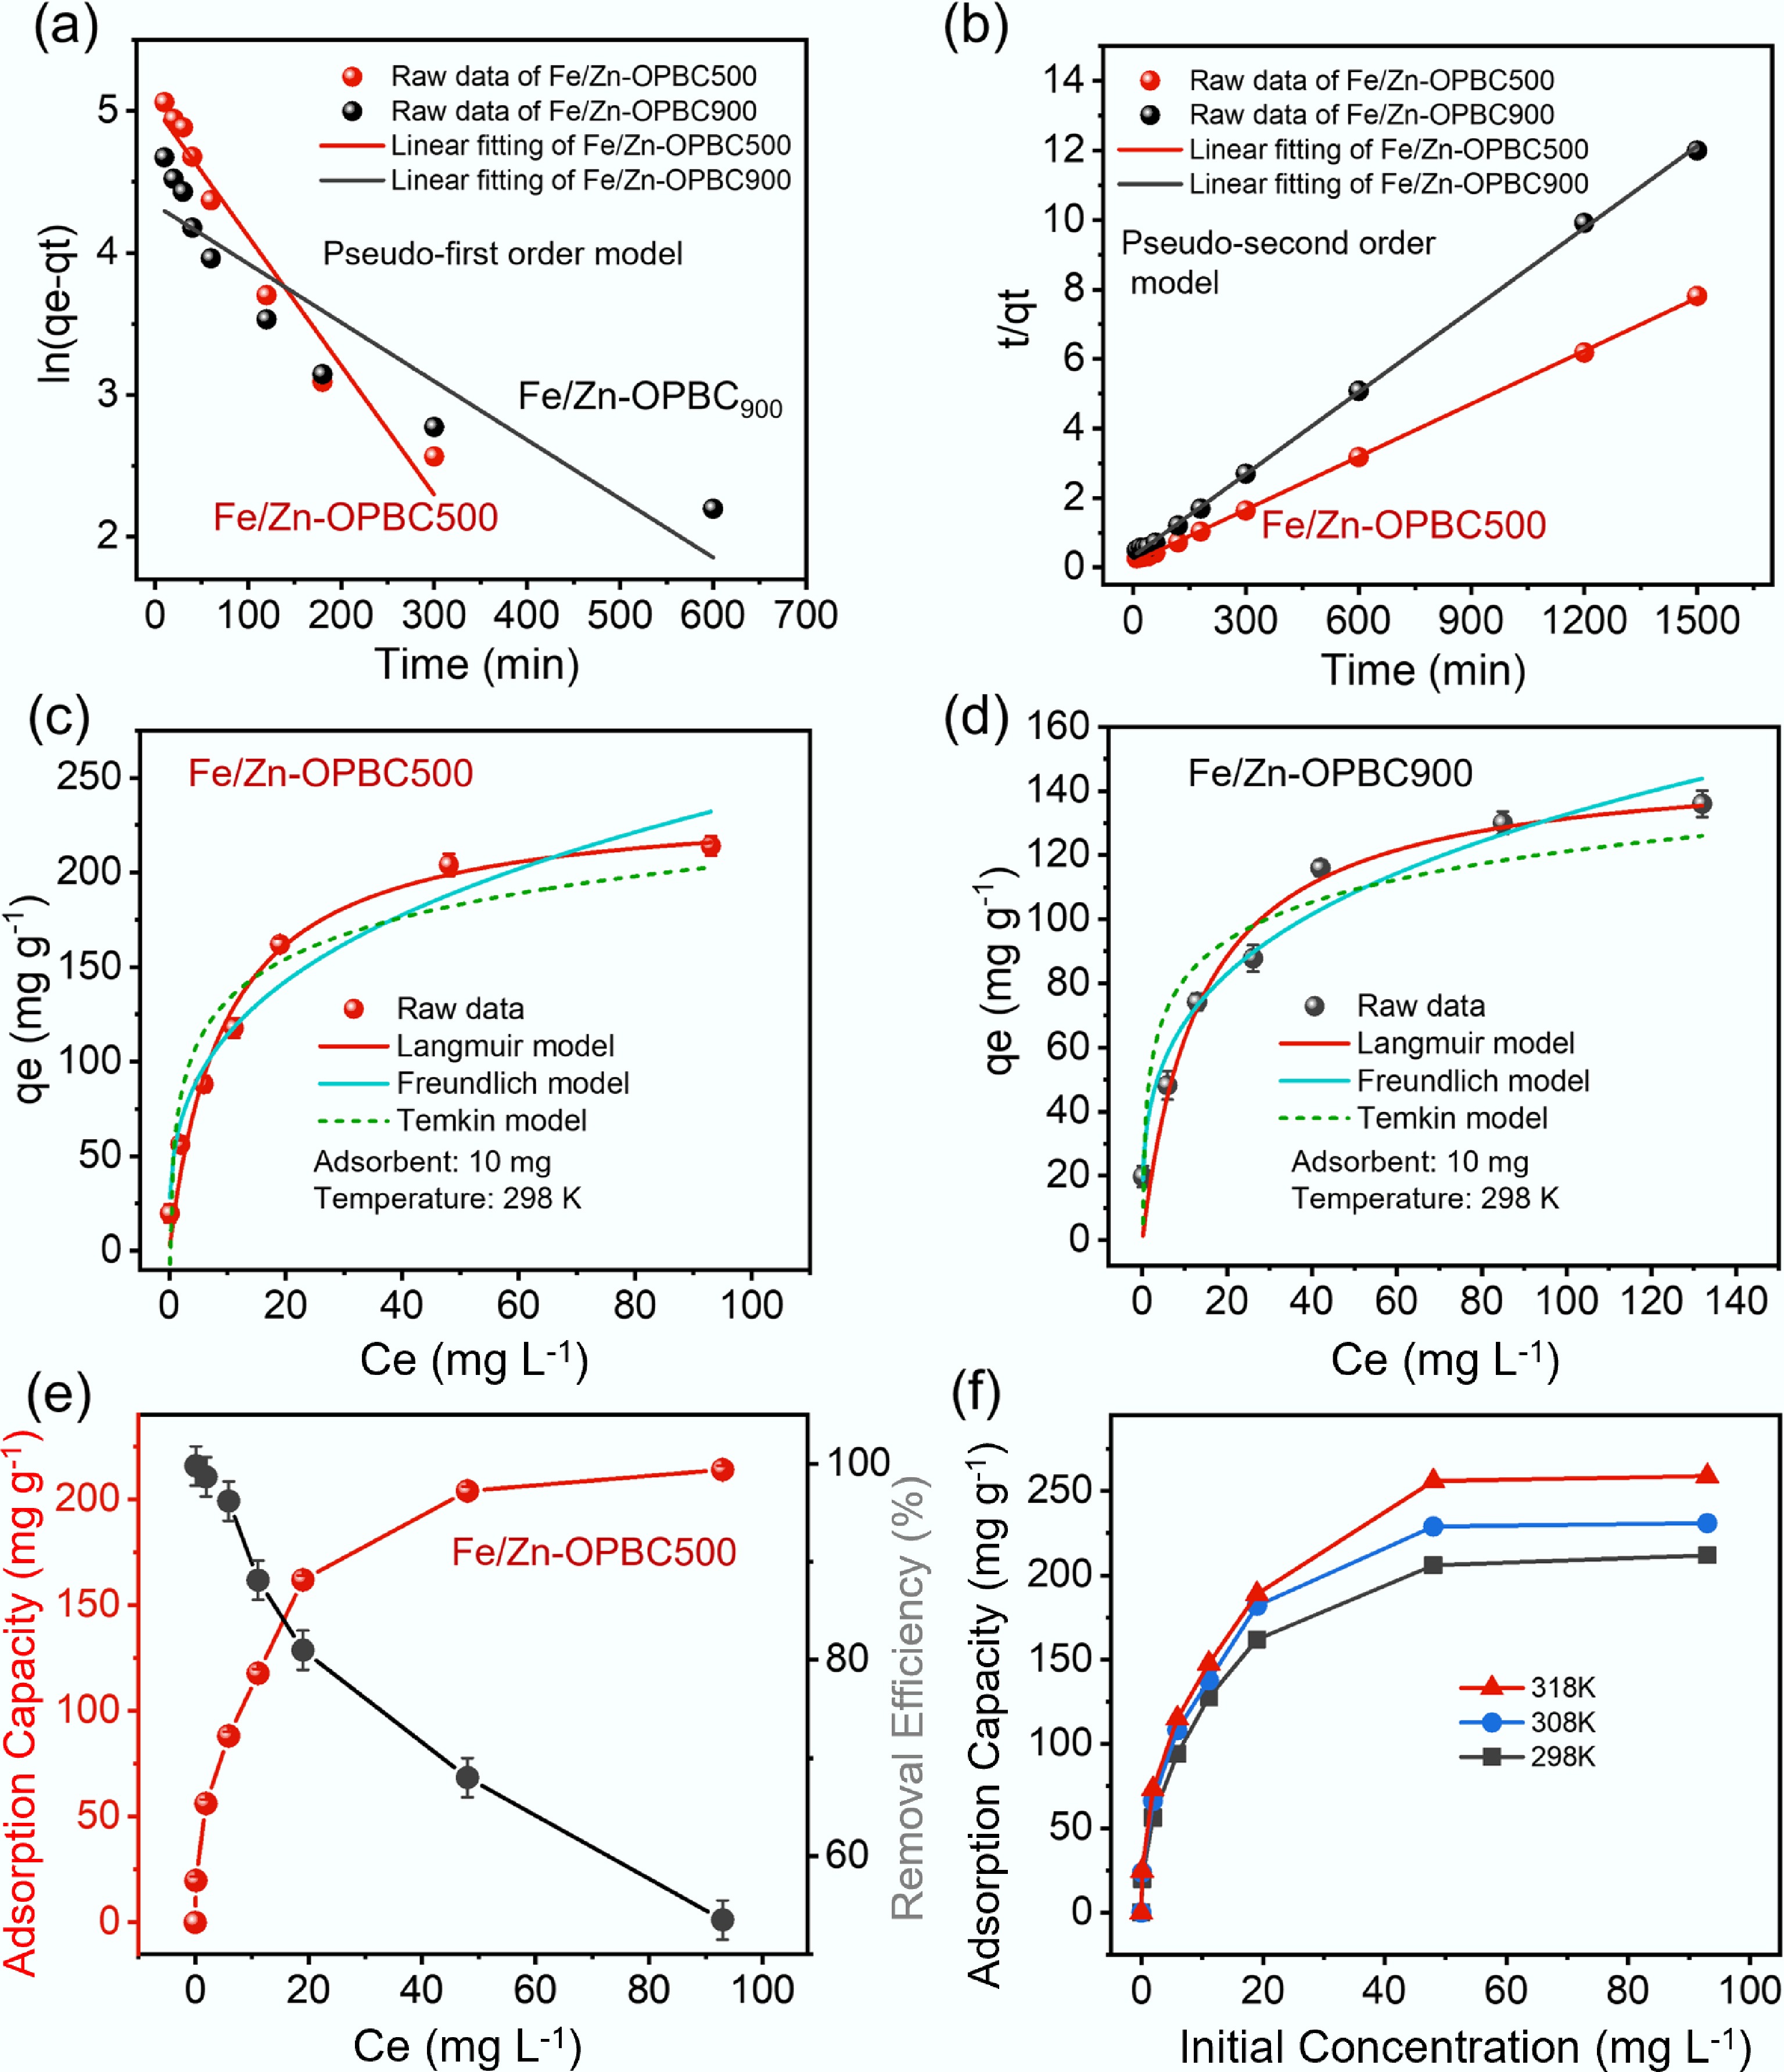
Figure 6.
Kinetic and isotherm modeling of methylene blue adsorption using Fe/Zn-OPBCs. (a) Pseudo-first-order linear fitting, (b) pseudo-second-order linear fitting, and nonlinear isotherm models for adsorption on (c) Fe/Zn-OPBC500, and (d) Fe/Zn-OPBC900; (e) Effect of initial methylene blue concentration on removal efficiency using Fe/Zn-OPBC500; (f) Temperature dependence of methylene blue adsorption.
-

Figure 7.
(a) Effect of cation concentration on the adsorption equilibrium of MB by Fe/Zn-OPBC500. (b) Adsorption behavior of cations with different valences. (c) Influence of anion concentration on adsorption performance. (d) Reusability of Fe/Zn-OPBC500 for MB removal.
-
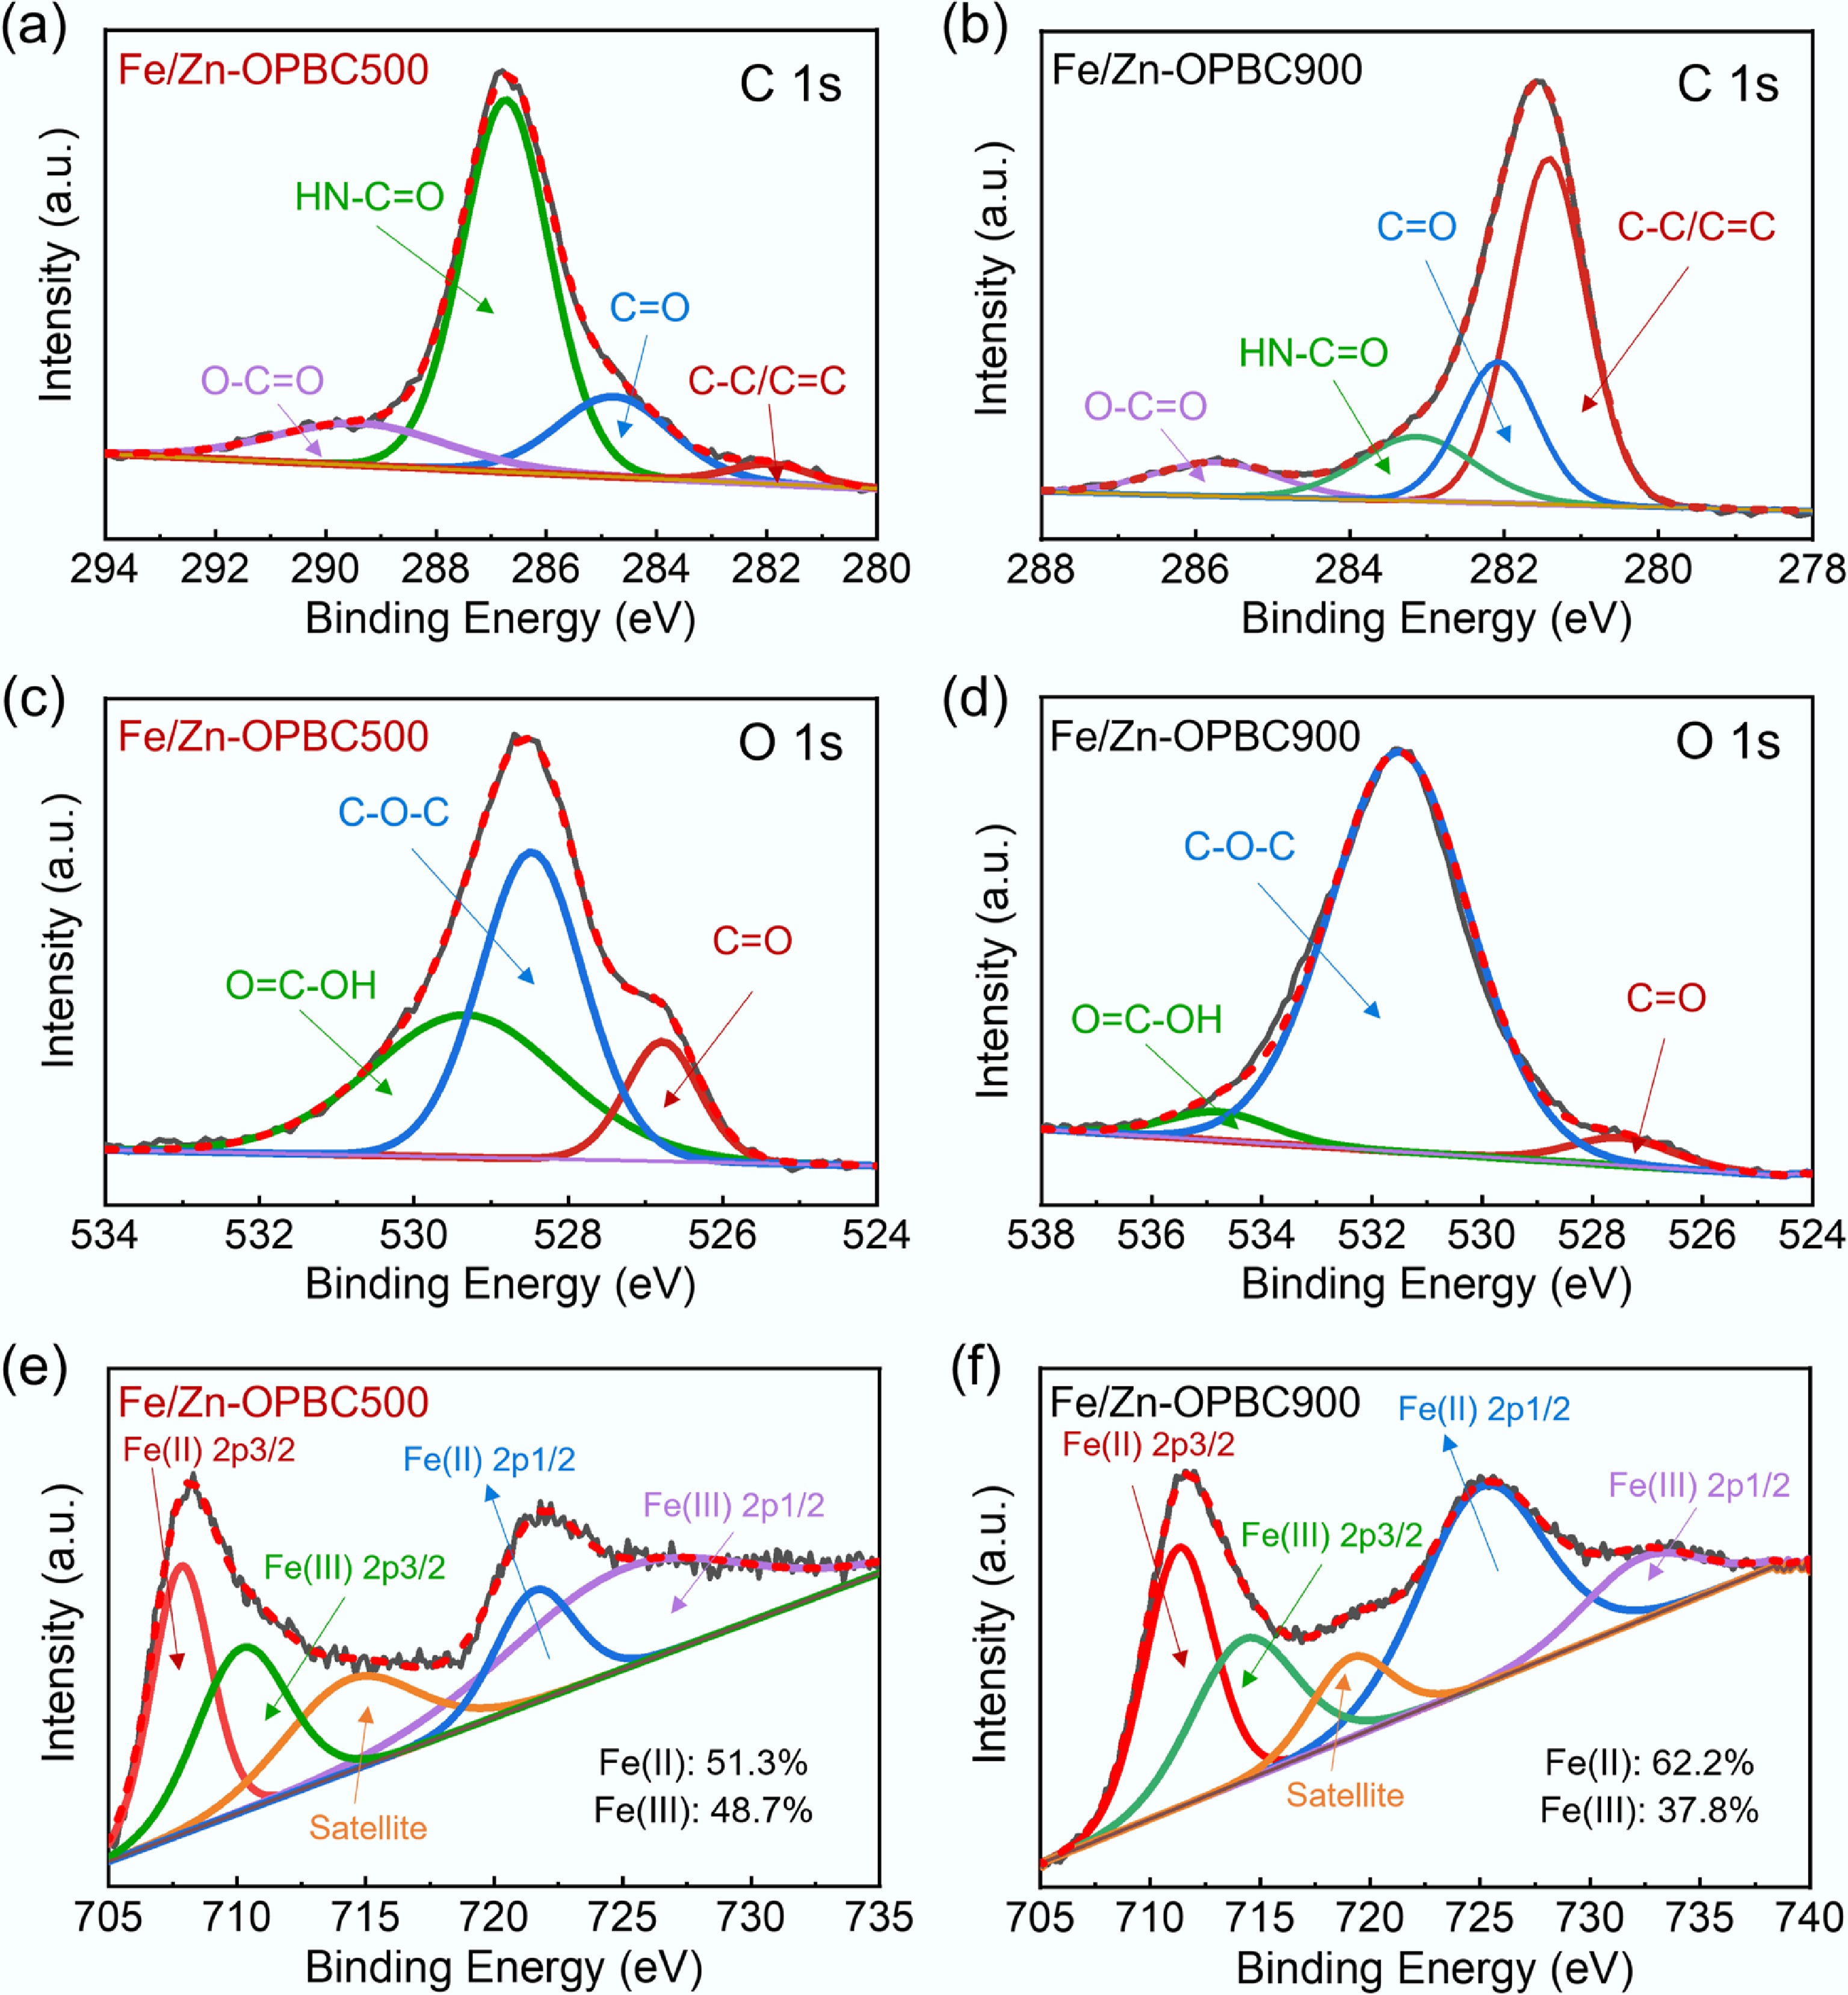
Figure 8.
XPS spectra of Fe/Zn-OPBCs after MB adsorption: (a), (b) C 1s, (c), (d) O 1s, and (e), (f) Fe 2p.
-
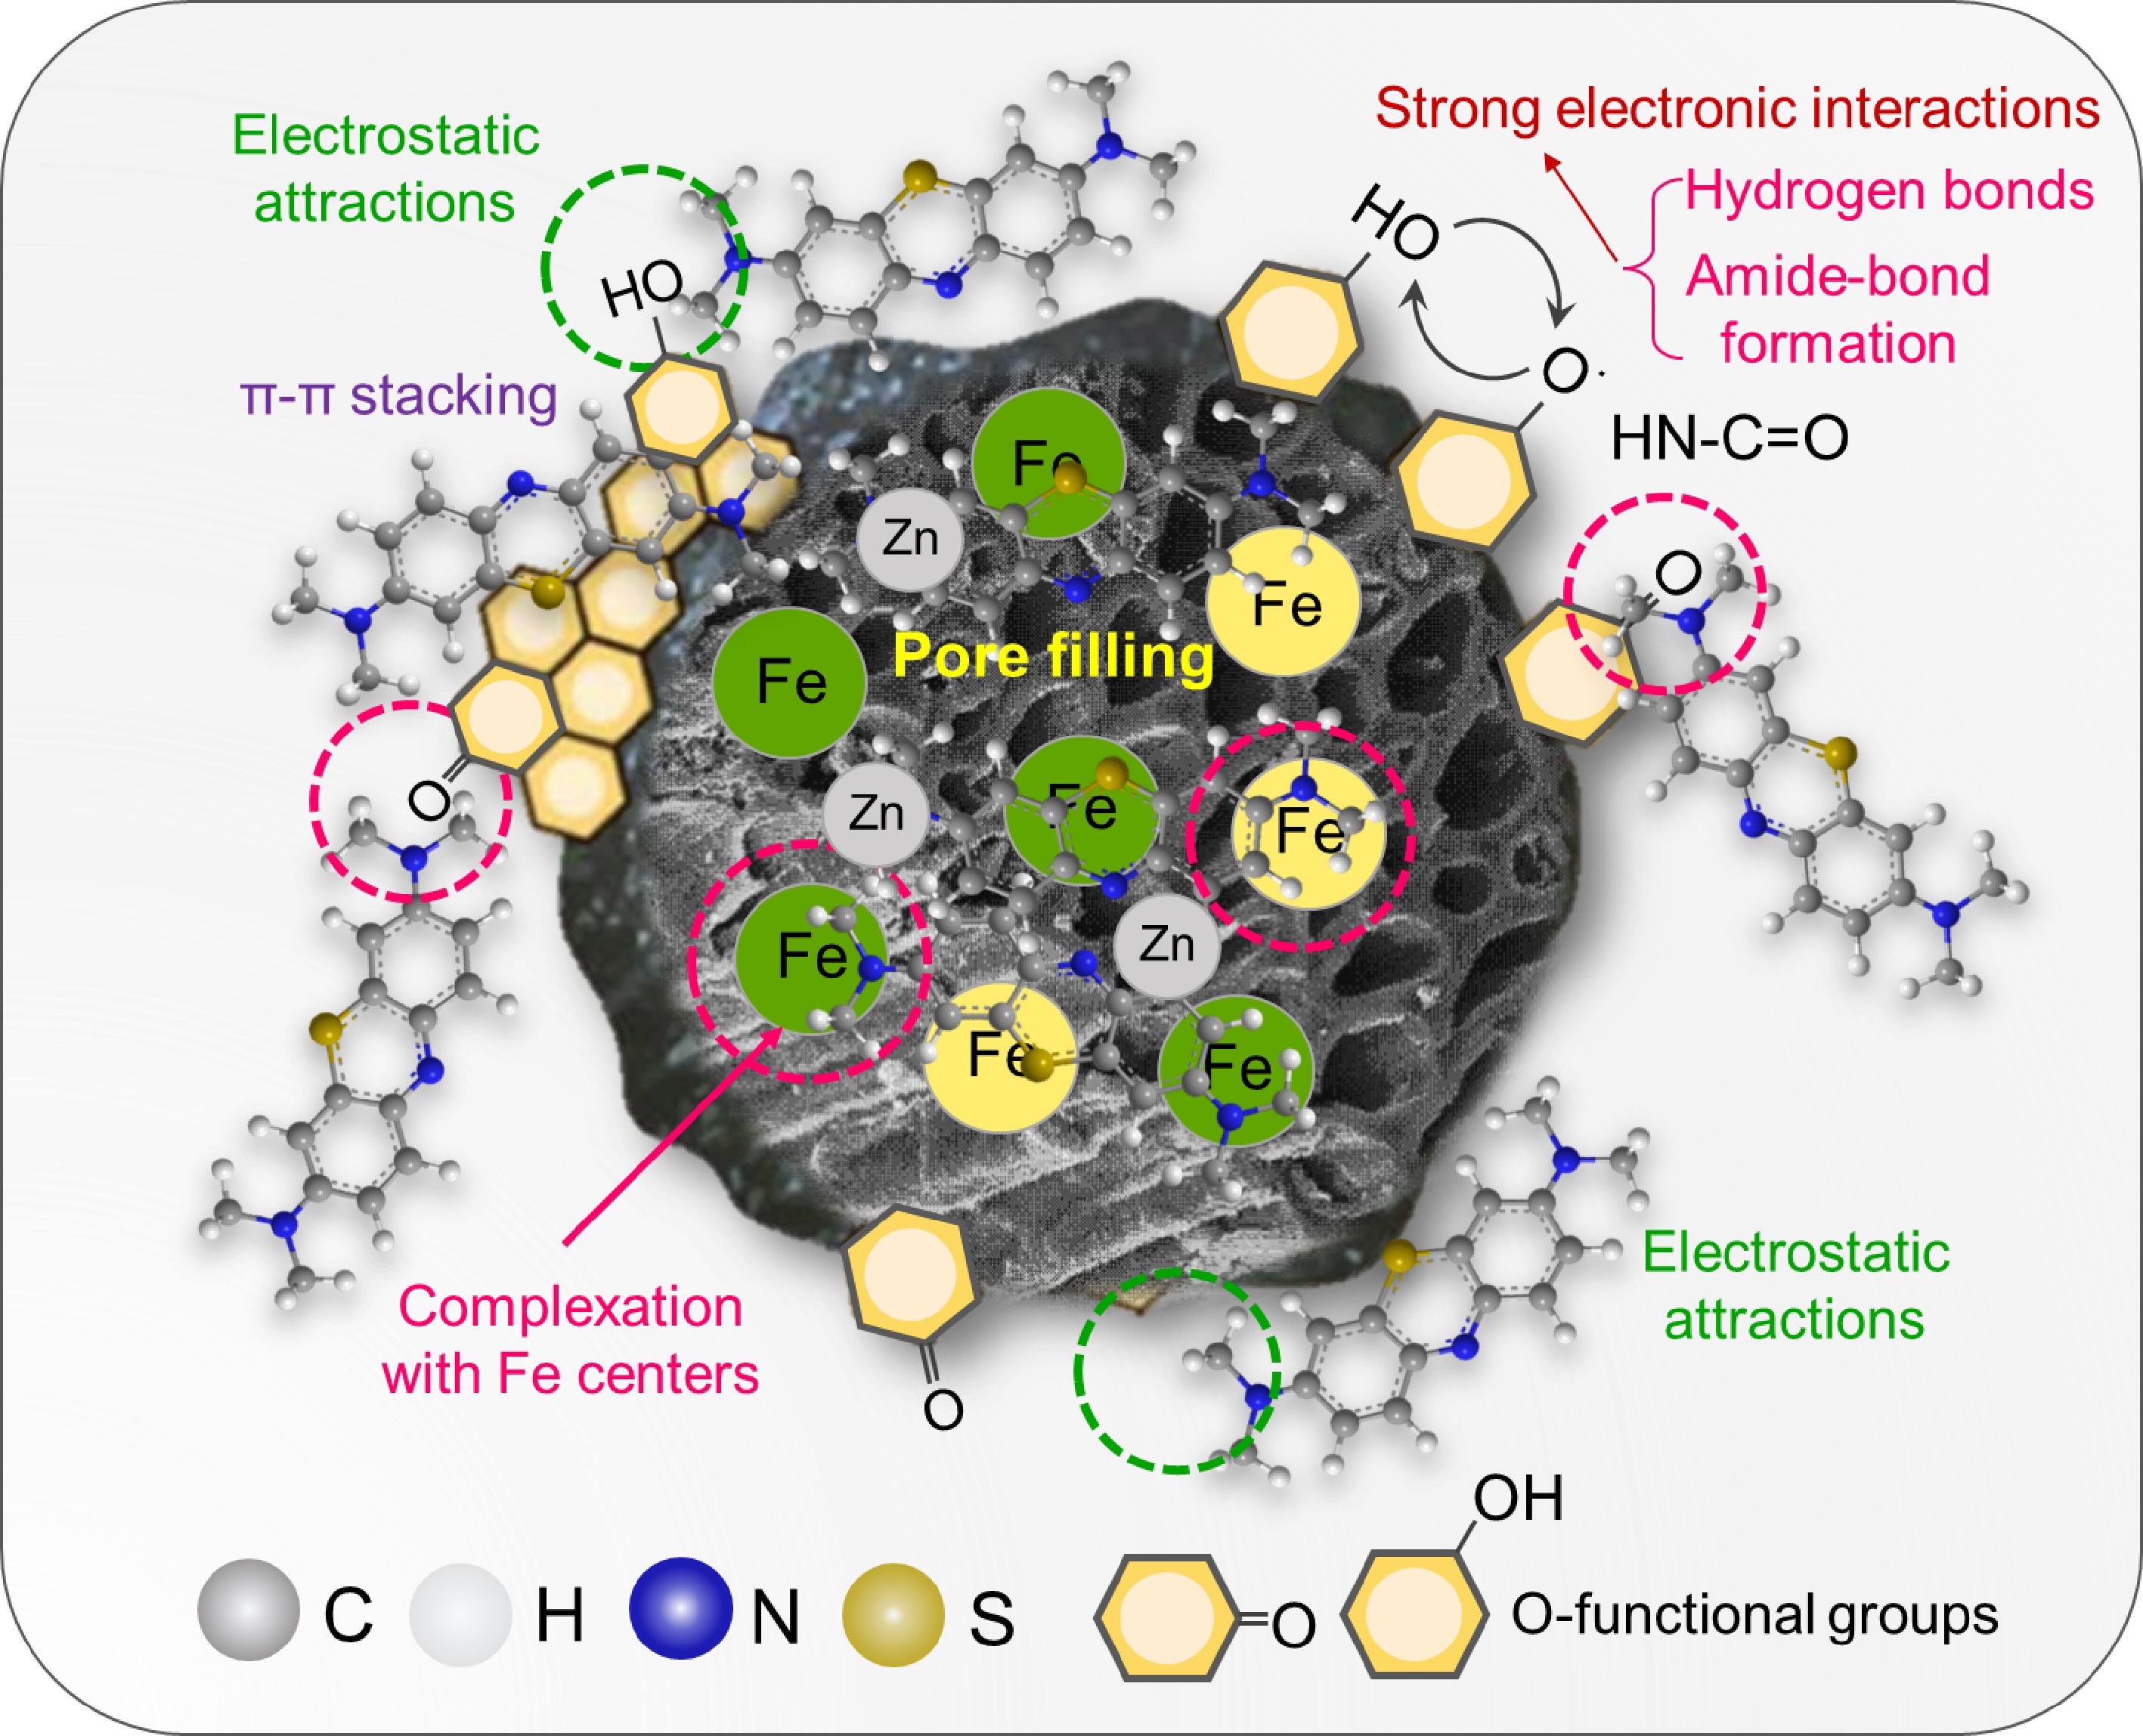
Figure 9.
The possible mechanism of adsorption of Fe/Zn-OPBC.
-
Sample N2 physisorption C/O ratio Atomic percentage SBETa (m2 g–1) Vtotalb (cm3 g–1) Mesoporec (%) Micropored (%) C (%) O (%) Fe (%) Zn (%) Fe/Zn-OPBC500 192.6 0.104 39.3 60.7 1.92 57.3 31.7 7.8 3.2 Fe/Zn-OPBC900 367.5 0.245 26.2 74.8 4.10 76.7 18.4 4.1 0.8 OPBC500 12.03 0.018 90.8 9.2 5.76 85.2 14.8 / / OPBC900 44.9 0.082 46.3 53.7 16.5 94.3 5.7 / / a Calculated via the BET method based on adsorption data within the p/p0 range of 0.05 to 0.30. b Total pore volume measured at a relative pressure (p/p0) of 0.99. c Proportion of pore volume attributed to mesopores. d The proportion of pore volume associated with micropores. Micropores are defined as pores with diameters less than 2 nm, whereas mesopores refer to those ranging from 2 to 50 nm. Table 1.
Specific surface areas, distributions of pore volumes and specific atomic percentage of Fe/Zn-OPBC
-
Sample Percentage of area C–C/C=C (%) C=O (%) HN–C=O (%) O–C=O (%) O=C–OH (%) C–O–C (%) C=O (%) Fe/Zn-OPBC500 40.8 37.5 18.3 3.4 42.9 45.7 11.4 Fe/Zn-OPBC900 43.6 31.4 15.5 9.5 38.5 44.9 16.6 OPBC500 40.9 27.3 16.6 15.2 36.2 30.7 33.1 OPBC900 48.7 28.6 13.8 8.9 6.8 90.6 2.6 Table 2.
Specific distributions of C 1s and O 1s bonding states of OPBCs
-
Kinetic model Parameter Value Fe/Zn-OPBC900 Fe/Zn-OPBC500 P-fo qe 76.566 152.37 k1 –0.004 –0.009 R2 0.84616 0.94875 P-so qe 127.23 196.85 k2 0.005 0.008 R2 0.99097 0.9995 Table 3.
The parameters of the P-fo and P-so kinetic models
-
Model Parameter Value Fe/Zn-OPBC900 Fe/Zn-OPBC500 Langmuir qm (mg g−1) 149.5790 237.53 KL (L g−1) 0.07229 0.1069 R2 0.9499 0.9738 Freundlich KF (mg g−1 (L mg−1)1/n) 34.6367 55.0039 1/n 0.2916 0.3176 R2 0.9631 0.9514 Temkin β 17.2570 31.5193 KT (L g−1) 11.2210 6.6814 R2 0.8545 0.8873 Table 4.
The fitting parameters of isotherm models
Figures
(9)
Tables
(4)