-
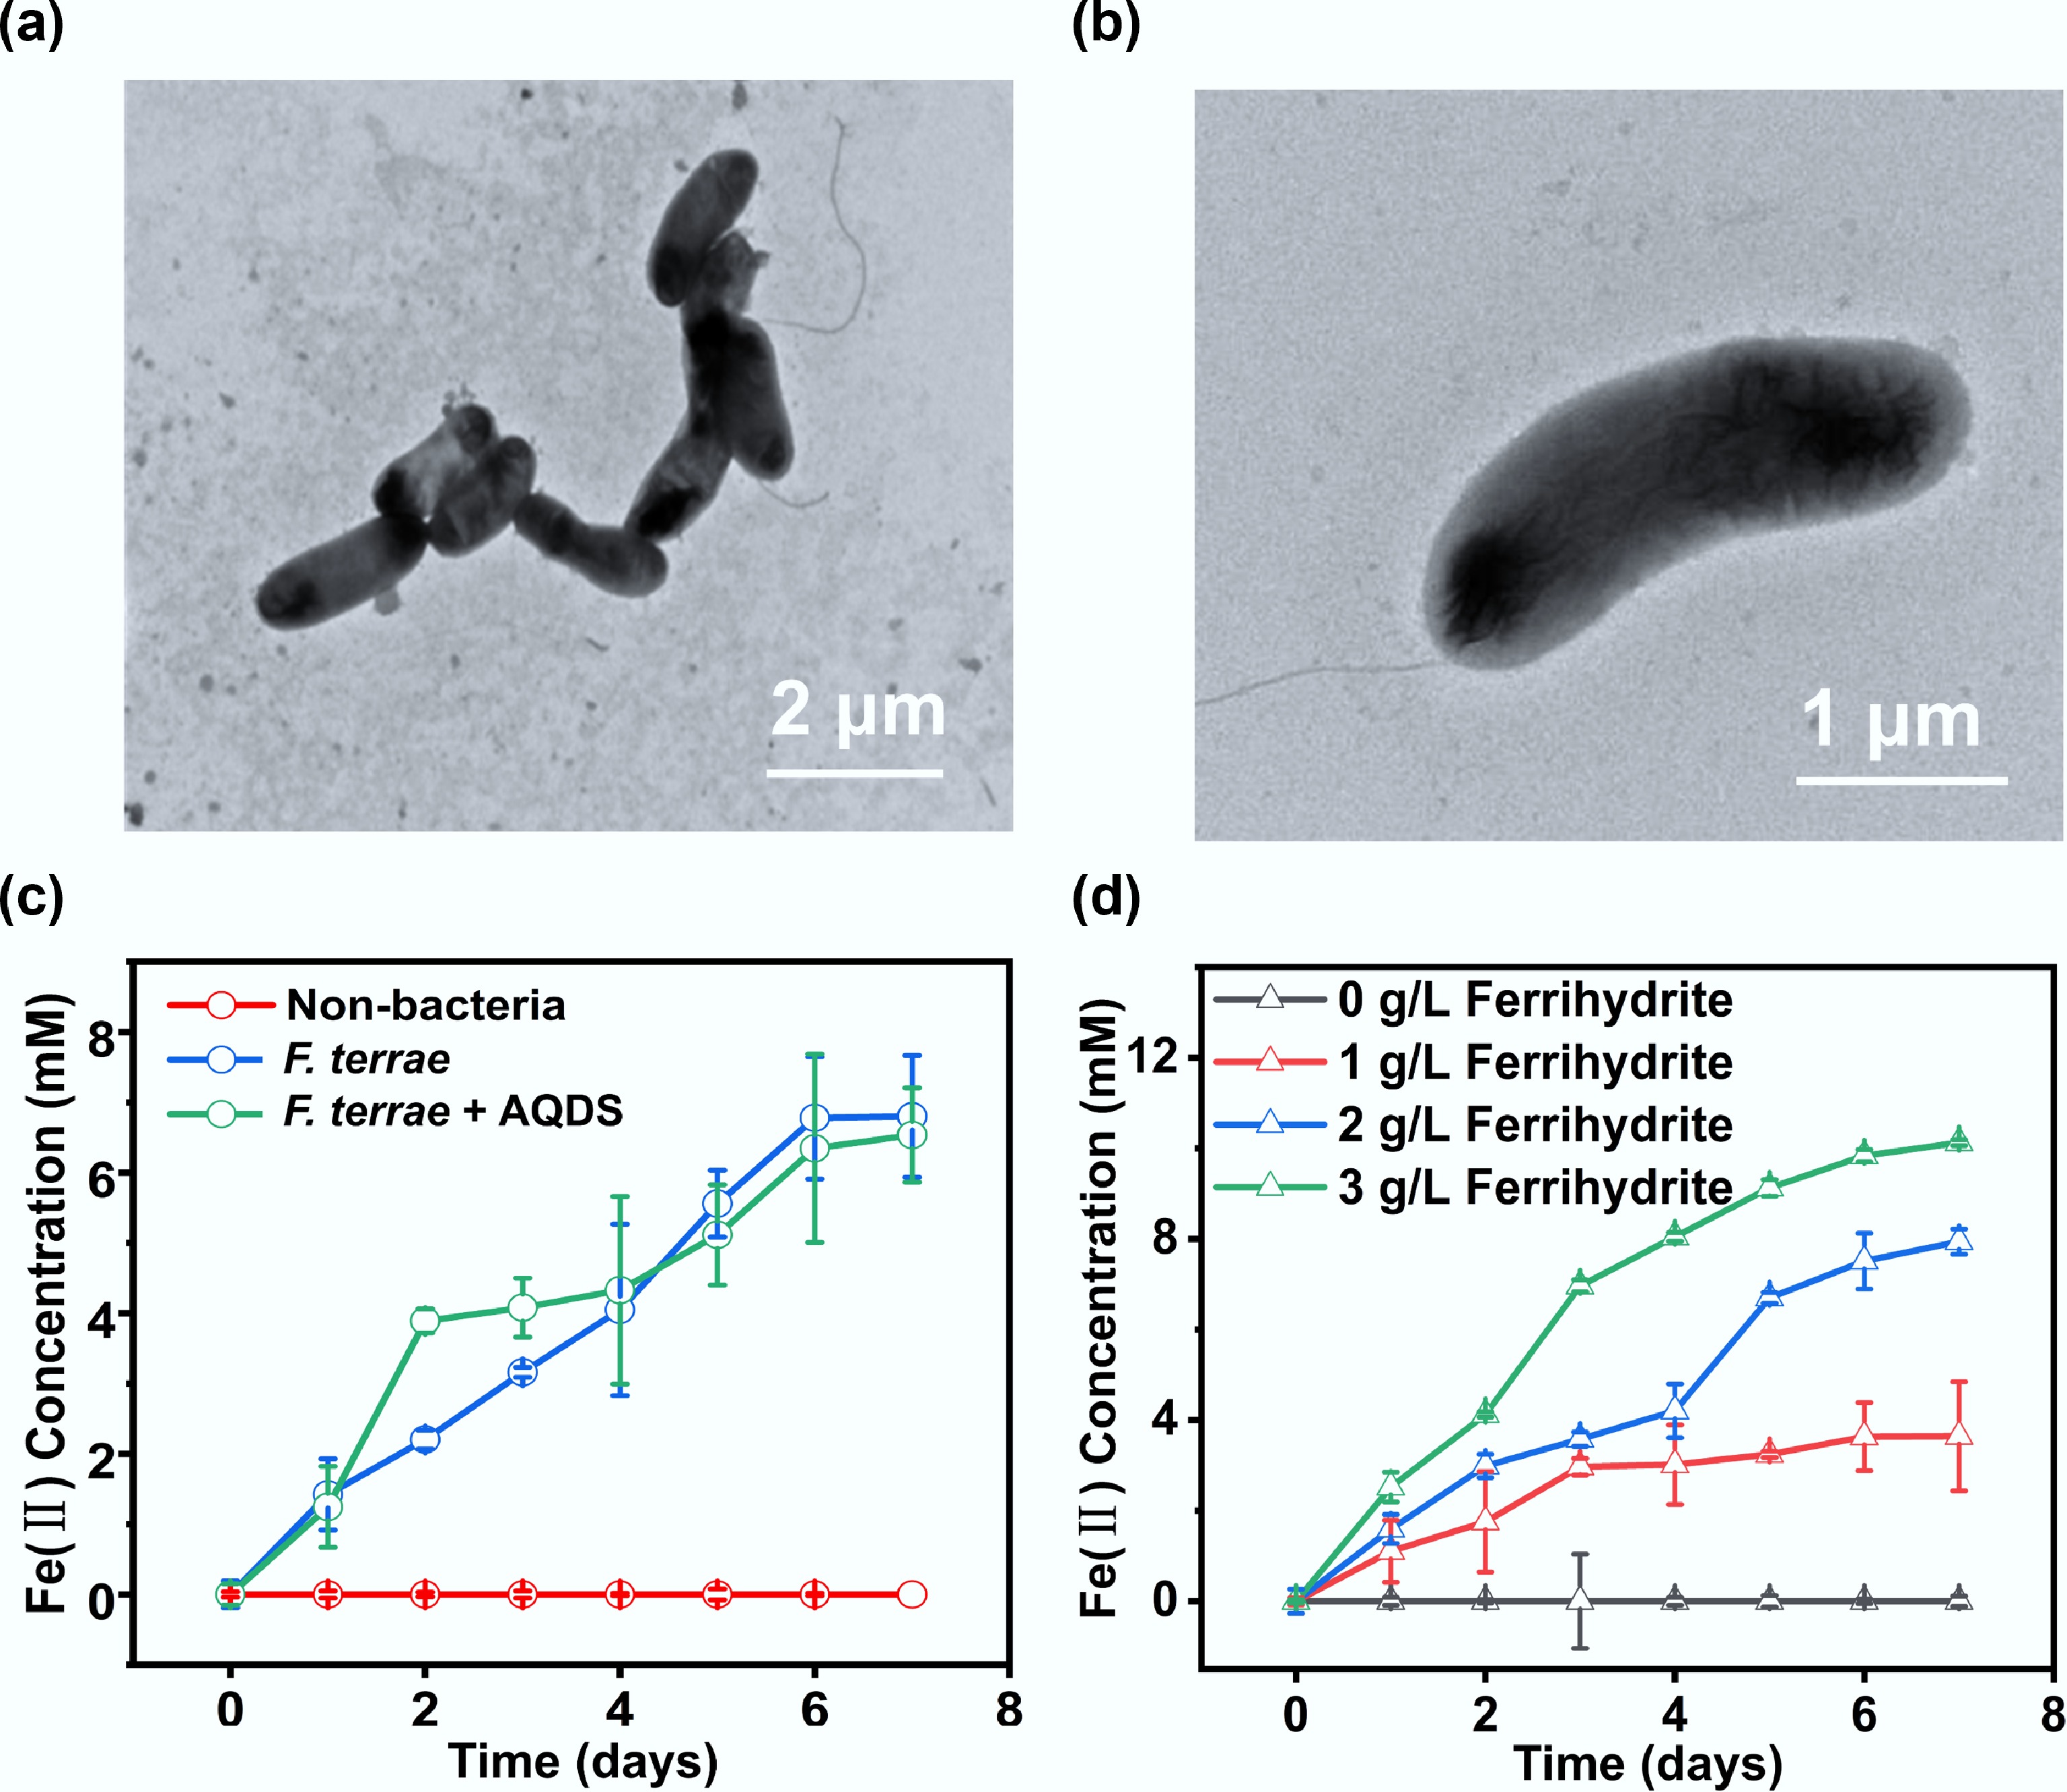
Figure 1.
Cellular morphology and Fe(III) reduction of F. terrae. (a) Low- and (b) high-magnification transmission electron microscopy (TEM) images of F. terrae cells; (c) Fe(II) production yields by F. terrae across different experimental treatment; (d) Fe(II) production as a function of ferrihydrite concentration. Data are presented as mean ± s.d. from n = 3 independent replicates.
-
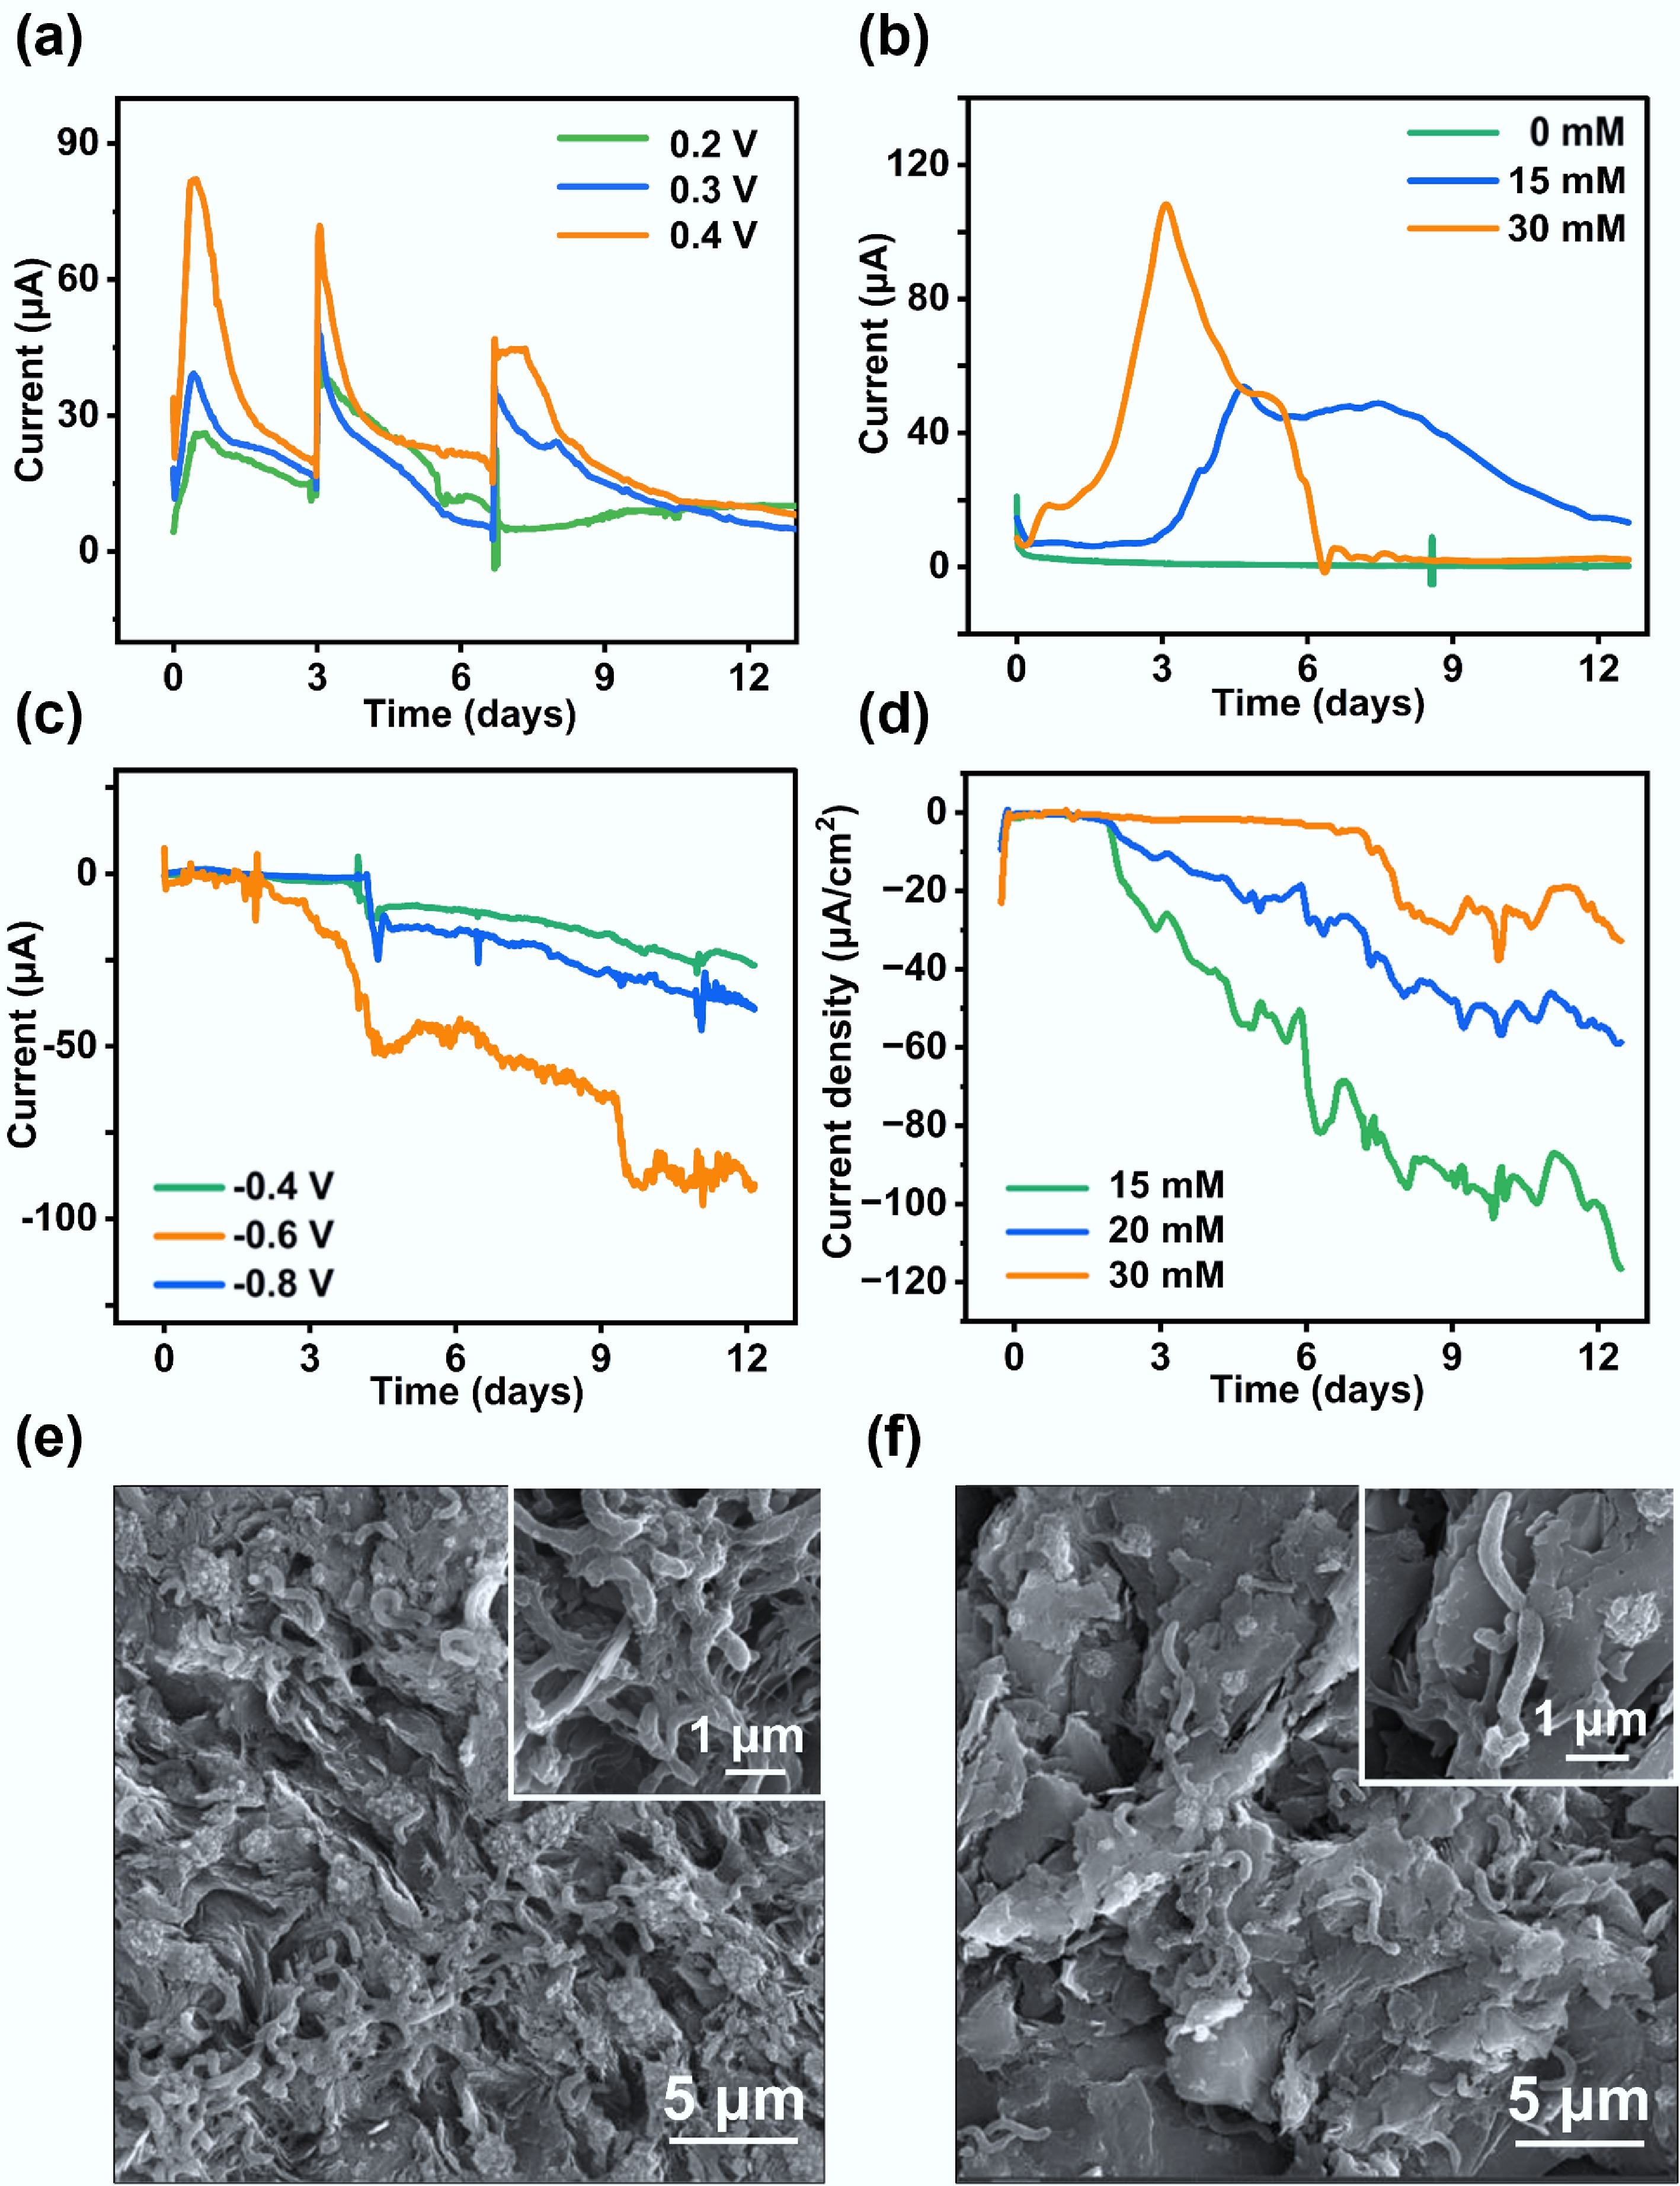
Figure 2.
Bidirectional EET performance of F. terrae in a BES. (a) Anodic current generated by F. terrae under different applied potentials; (b) Anodic current responses under varying concentrations of the electron donor; (c) Cathodic current recorded at different applied potentials; (d) Cathodic current responses under varying concentrations of the electron acceptor; SEM images of the electroactive biofilm formed on the (e) anode and (f) cathode surfaces.
-
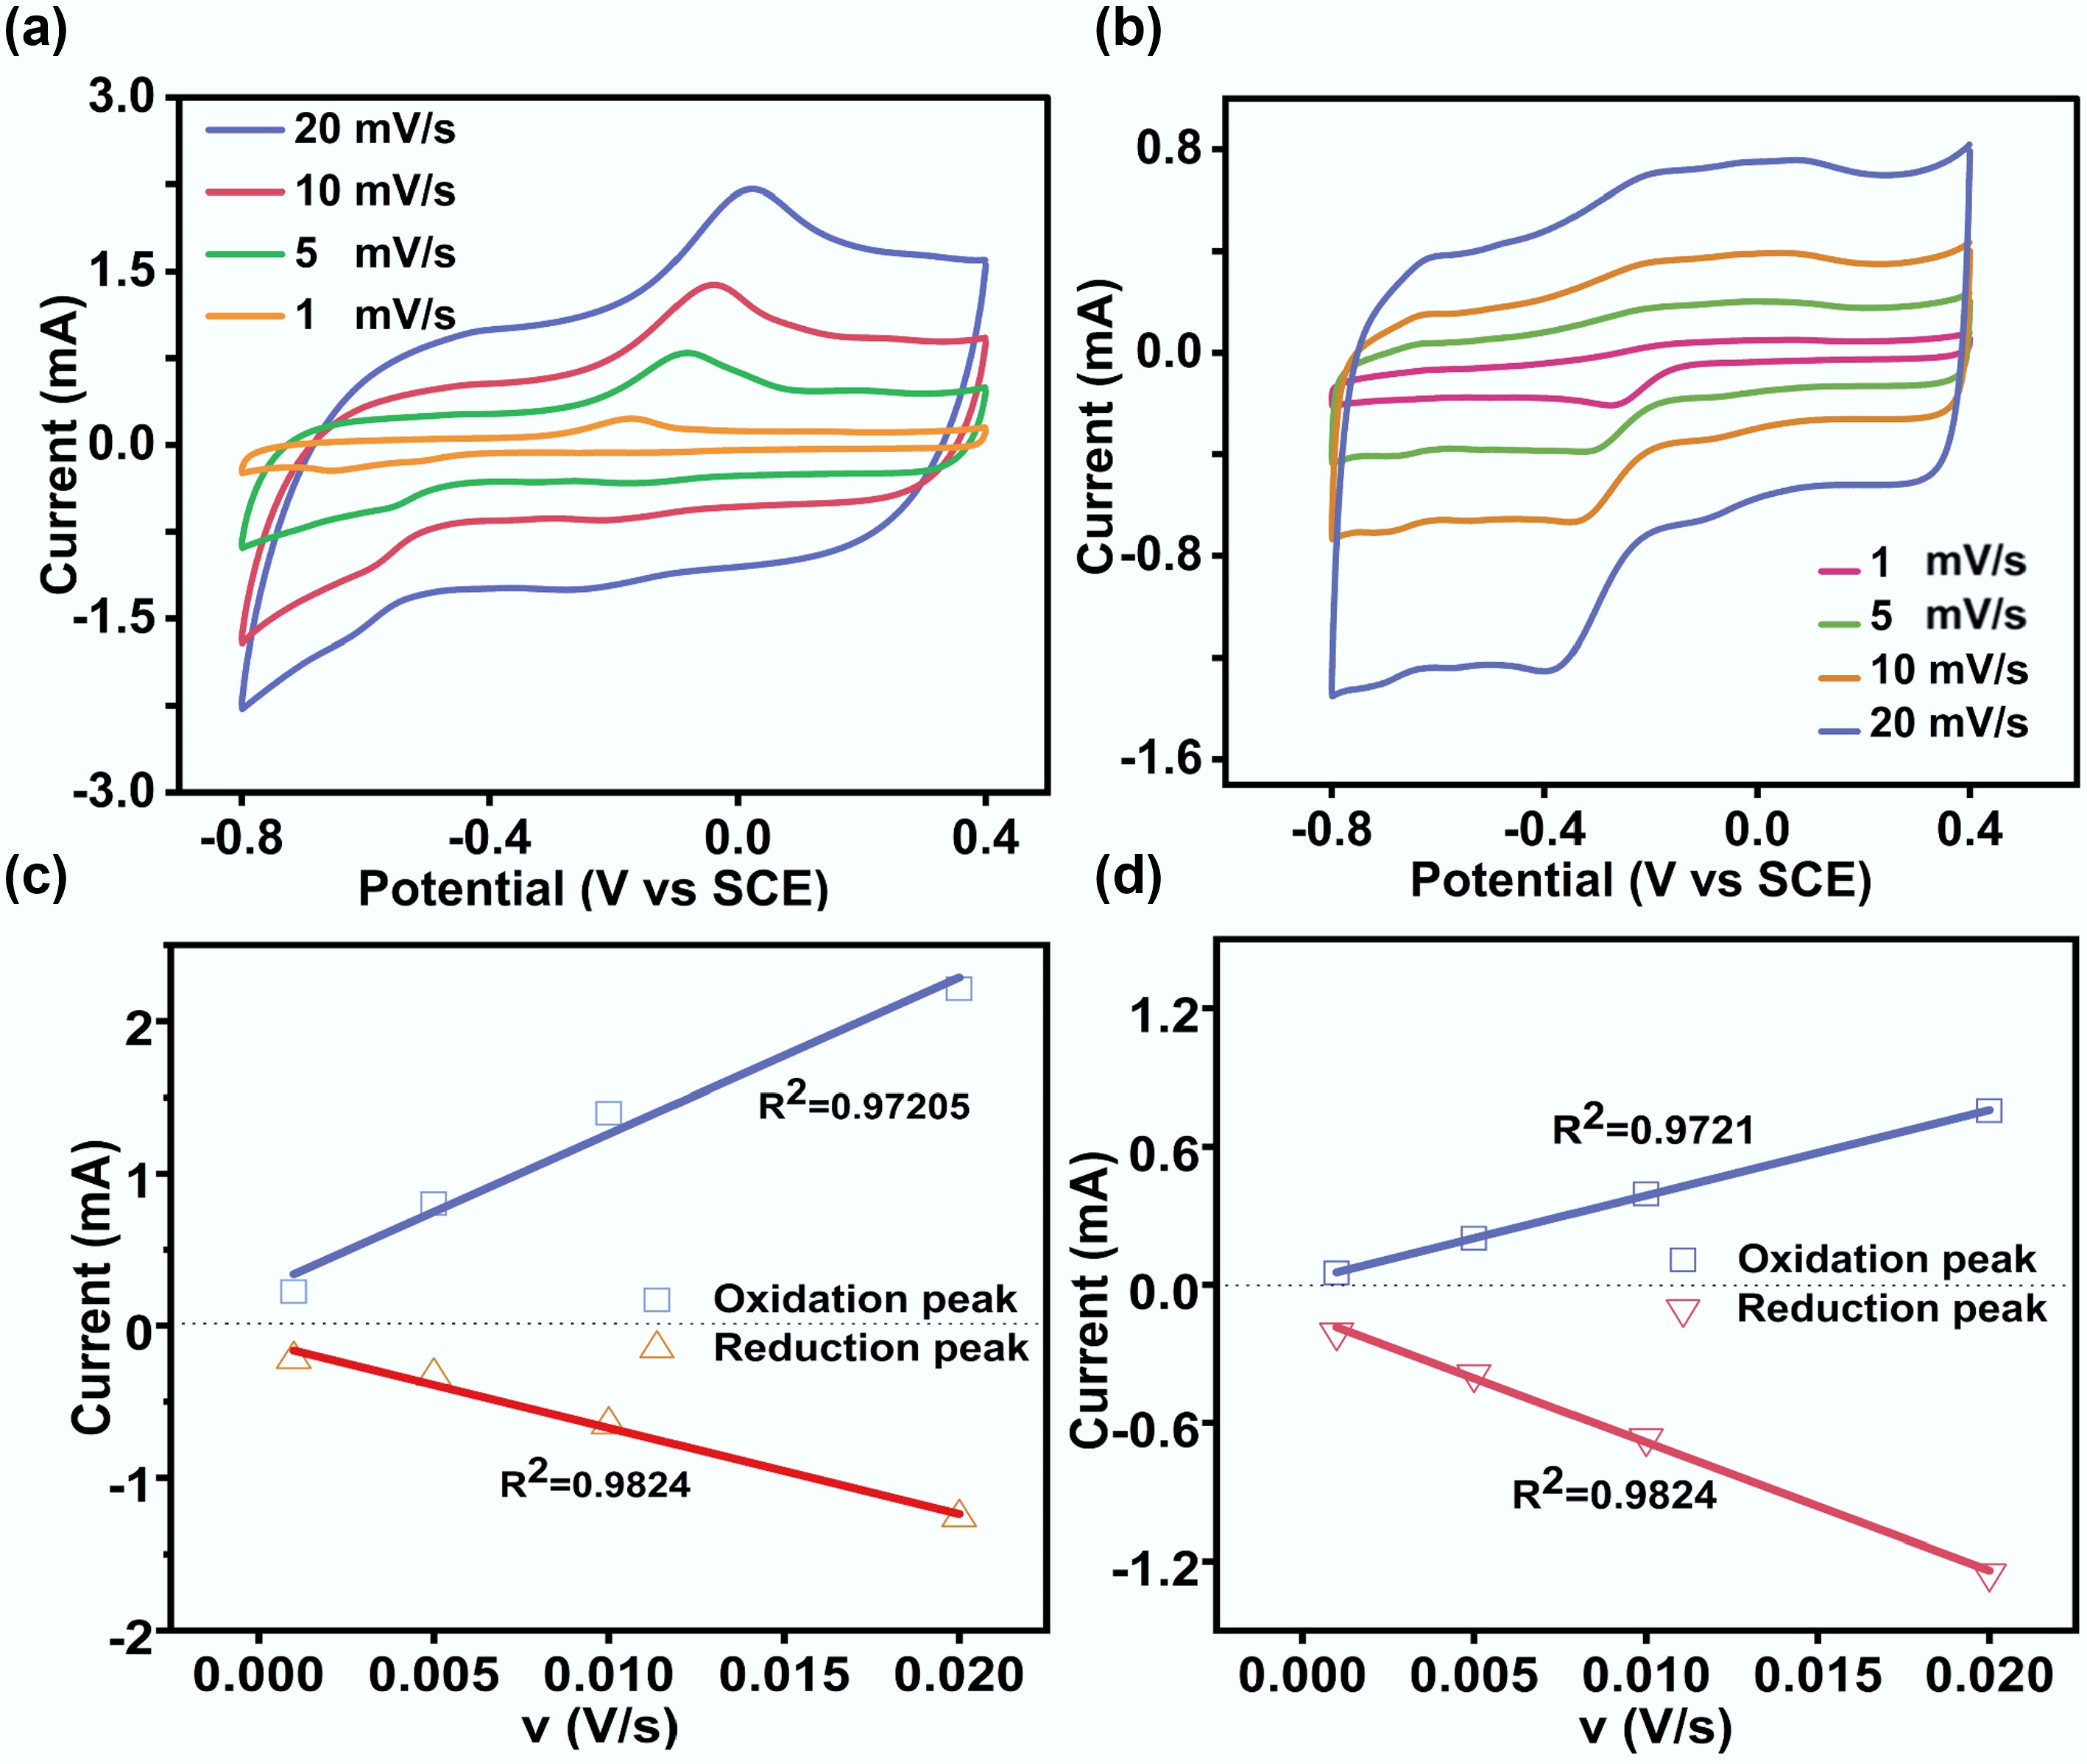
Figure 3.
Cyclic voltammetry analysis of anode and cathode biofilms at different scan rates. (a) Anode biofilm; (b) Cathode biofilm; (c) Linear relationship between peak current and the scan rate derived from non-turnover CVs of anode biofilms; (d) Linear relationship between peak current and the scan rate derived from non-turnover CVs of cathode biofilms.
-
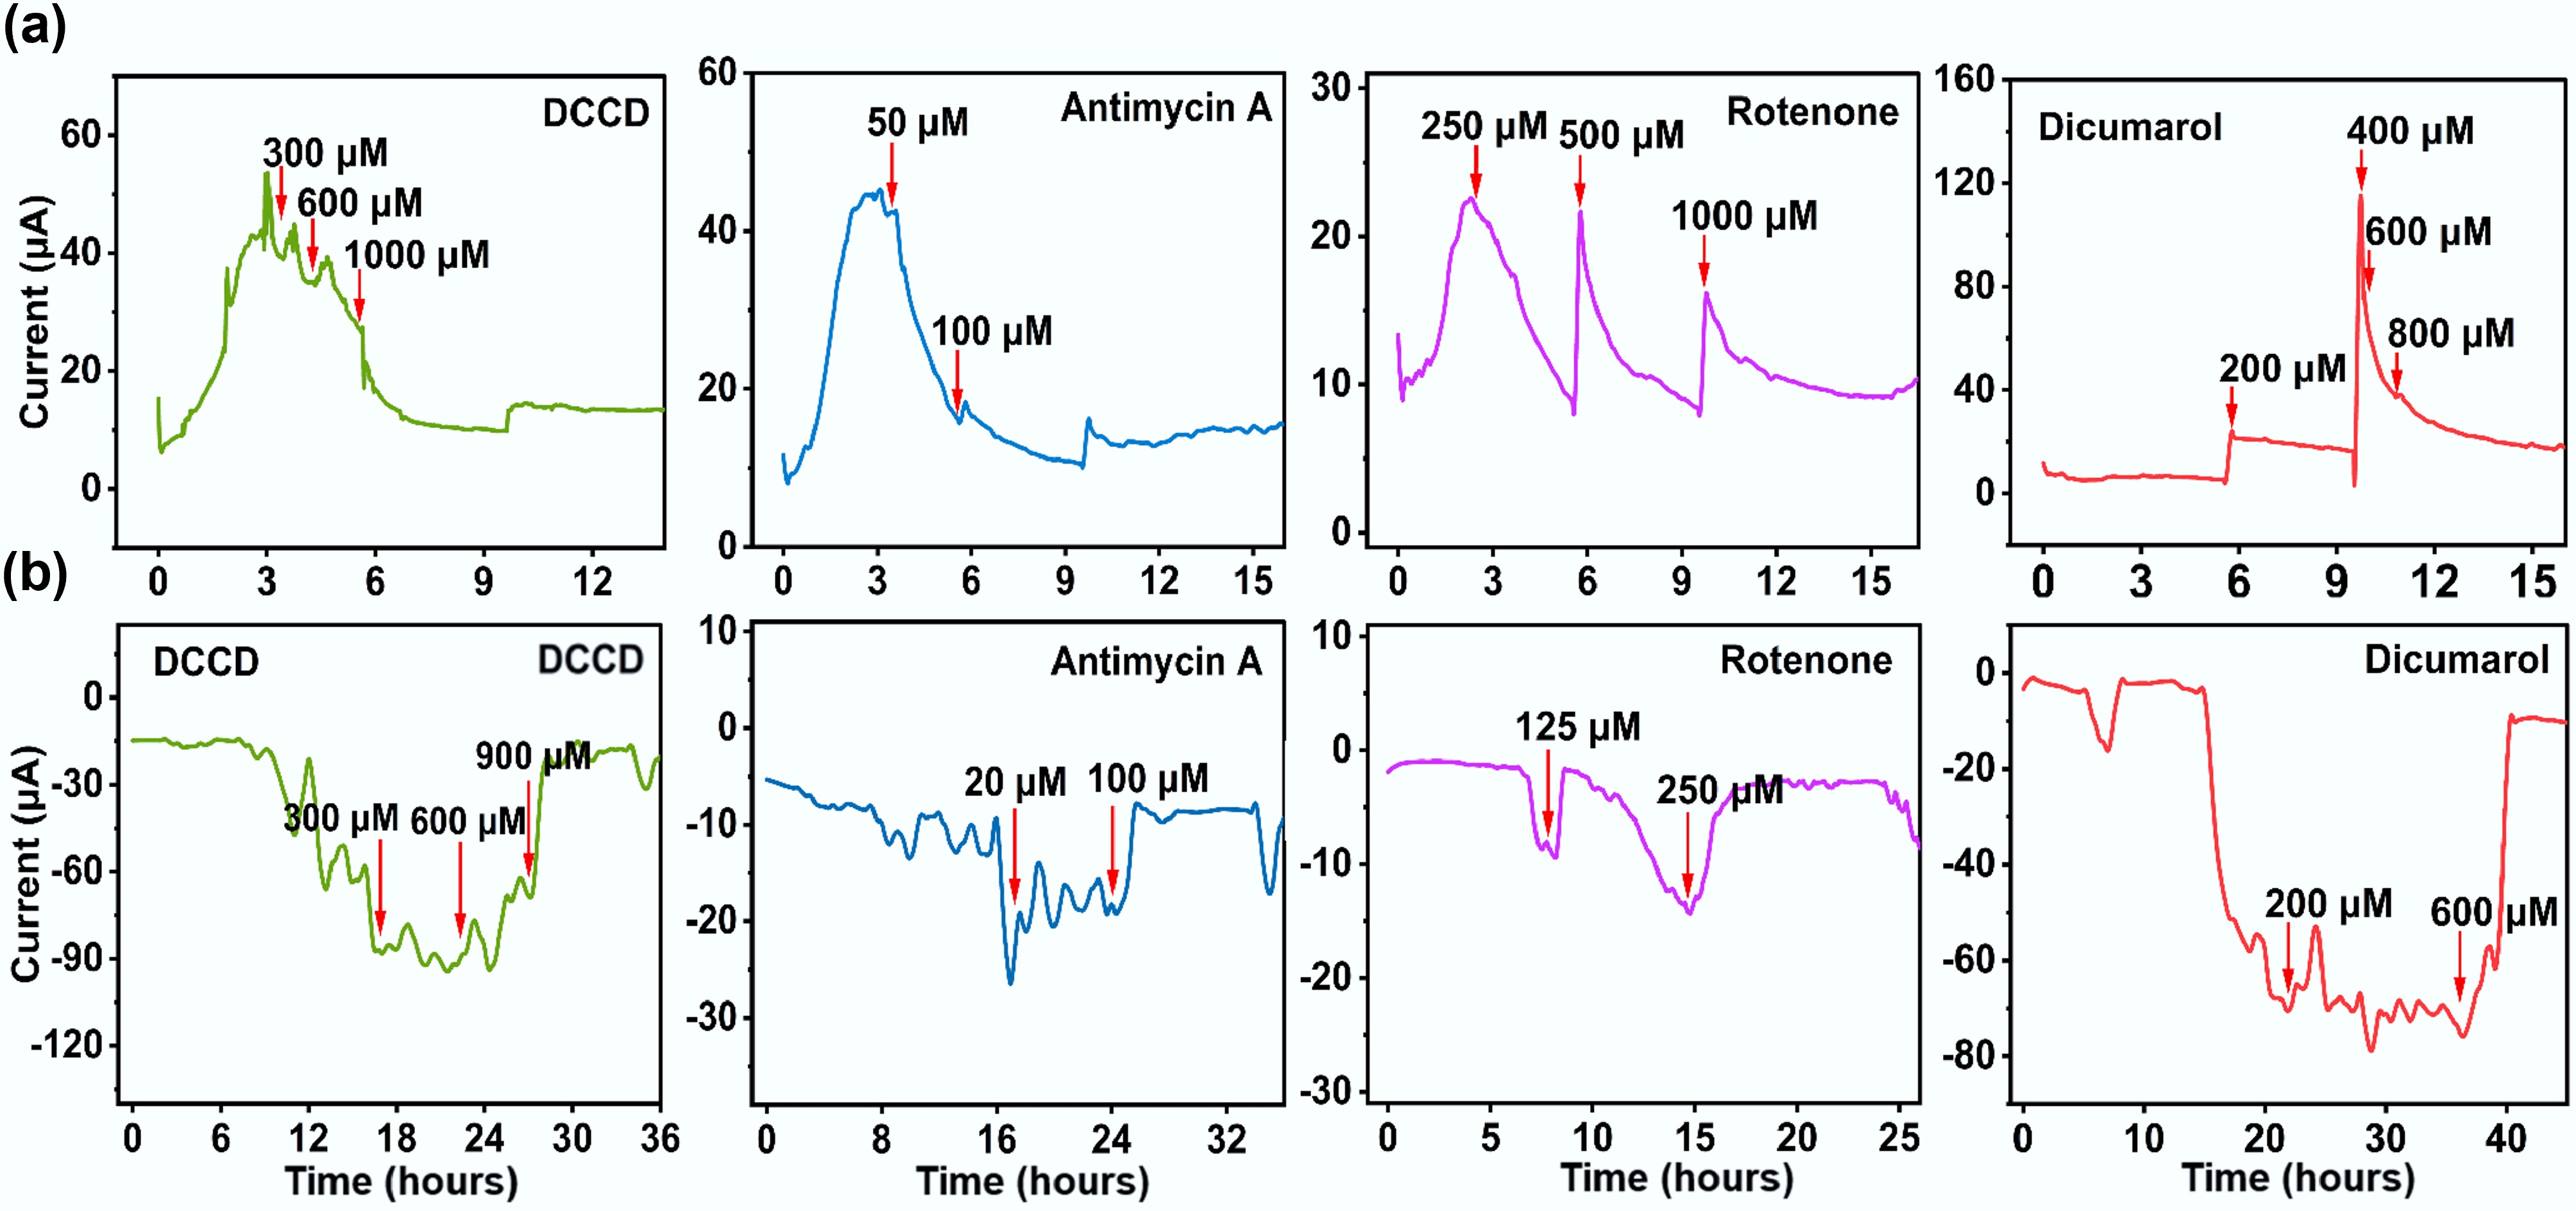
Figure 4.
Effects of electron transport inhibitors on bidirectional EET. (a) Outward EET; (b) Inward EET.
-
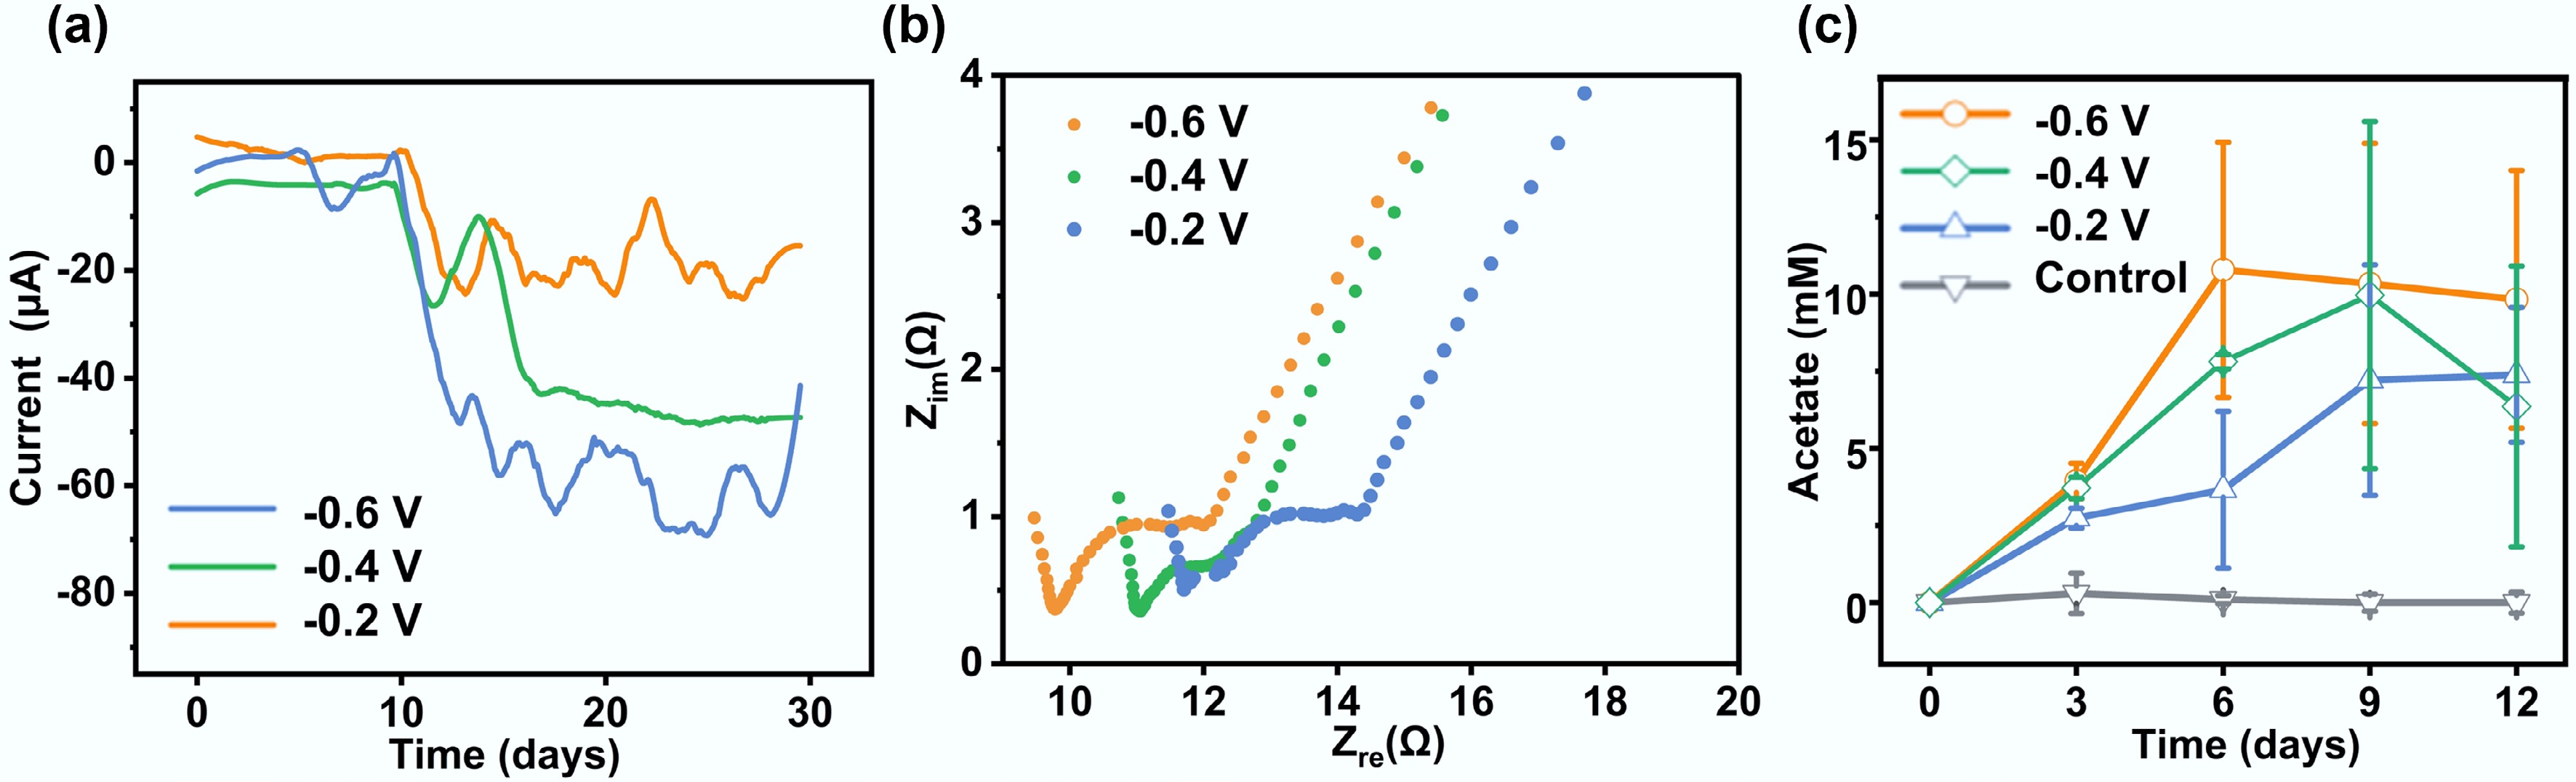
Figure 5.
Microbial electrosynthesis performance of F. terrae. (a) Cathodic current densities recorded at different electrode potentials; (b) Electrochemical impedance spectroscopy (Nyquist plots) of F. terrae-colonized electrodes under varying potentials; (c) Acetic acid yields correlated with applied potentials, reflecting bioelectrocatalytic efficiency.
-
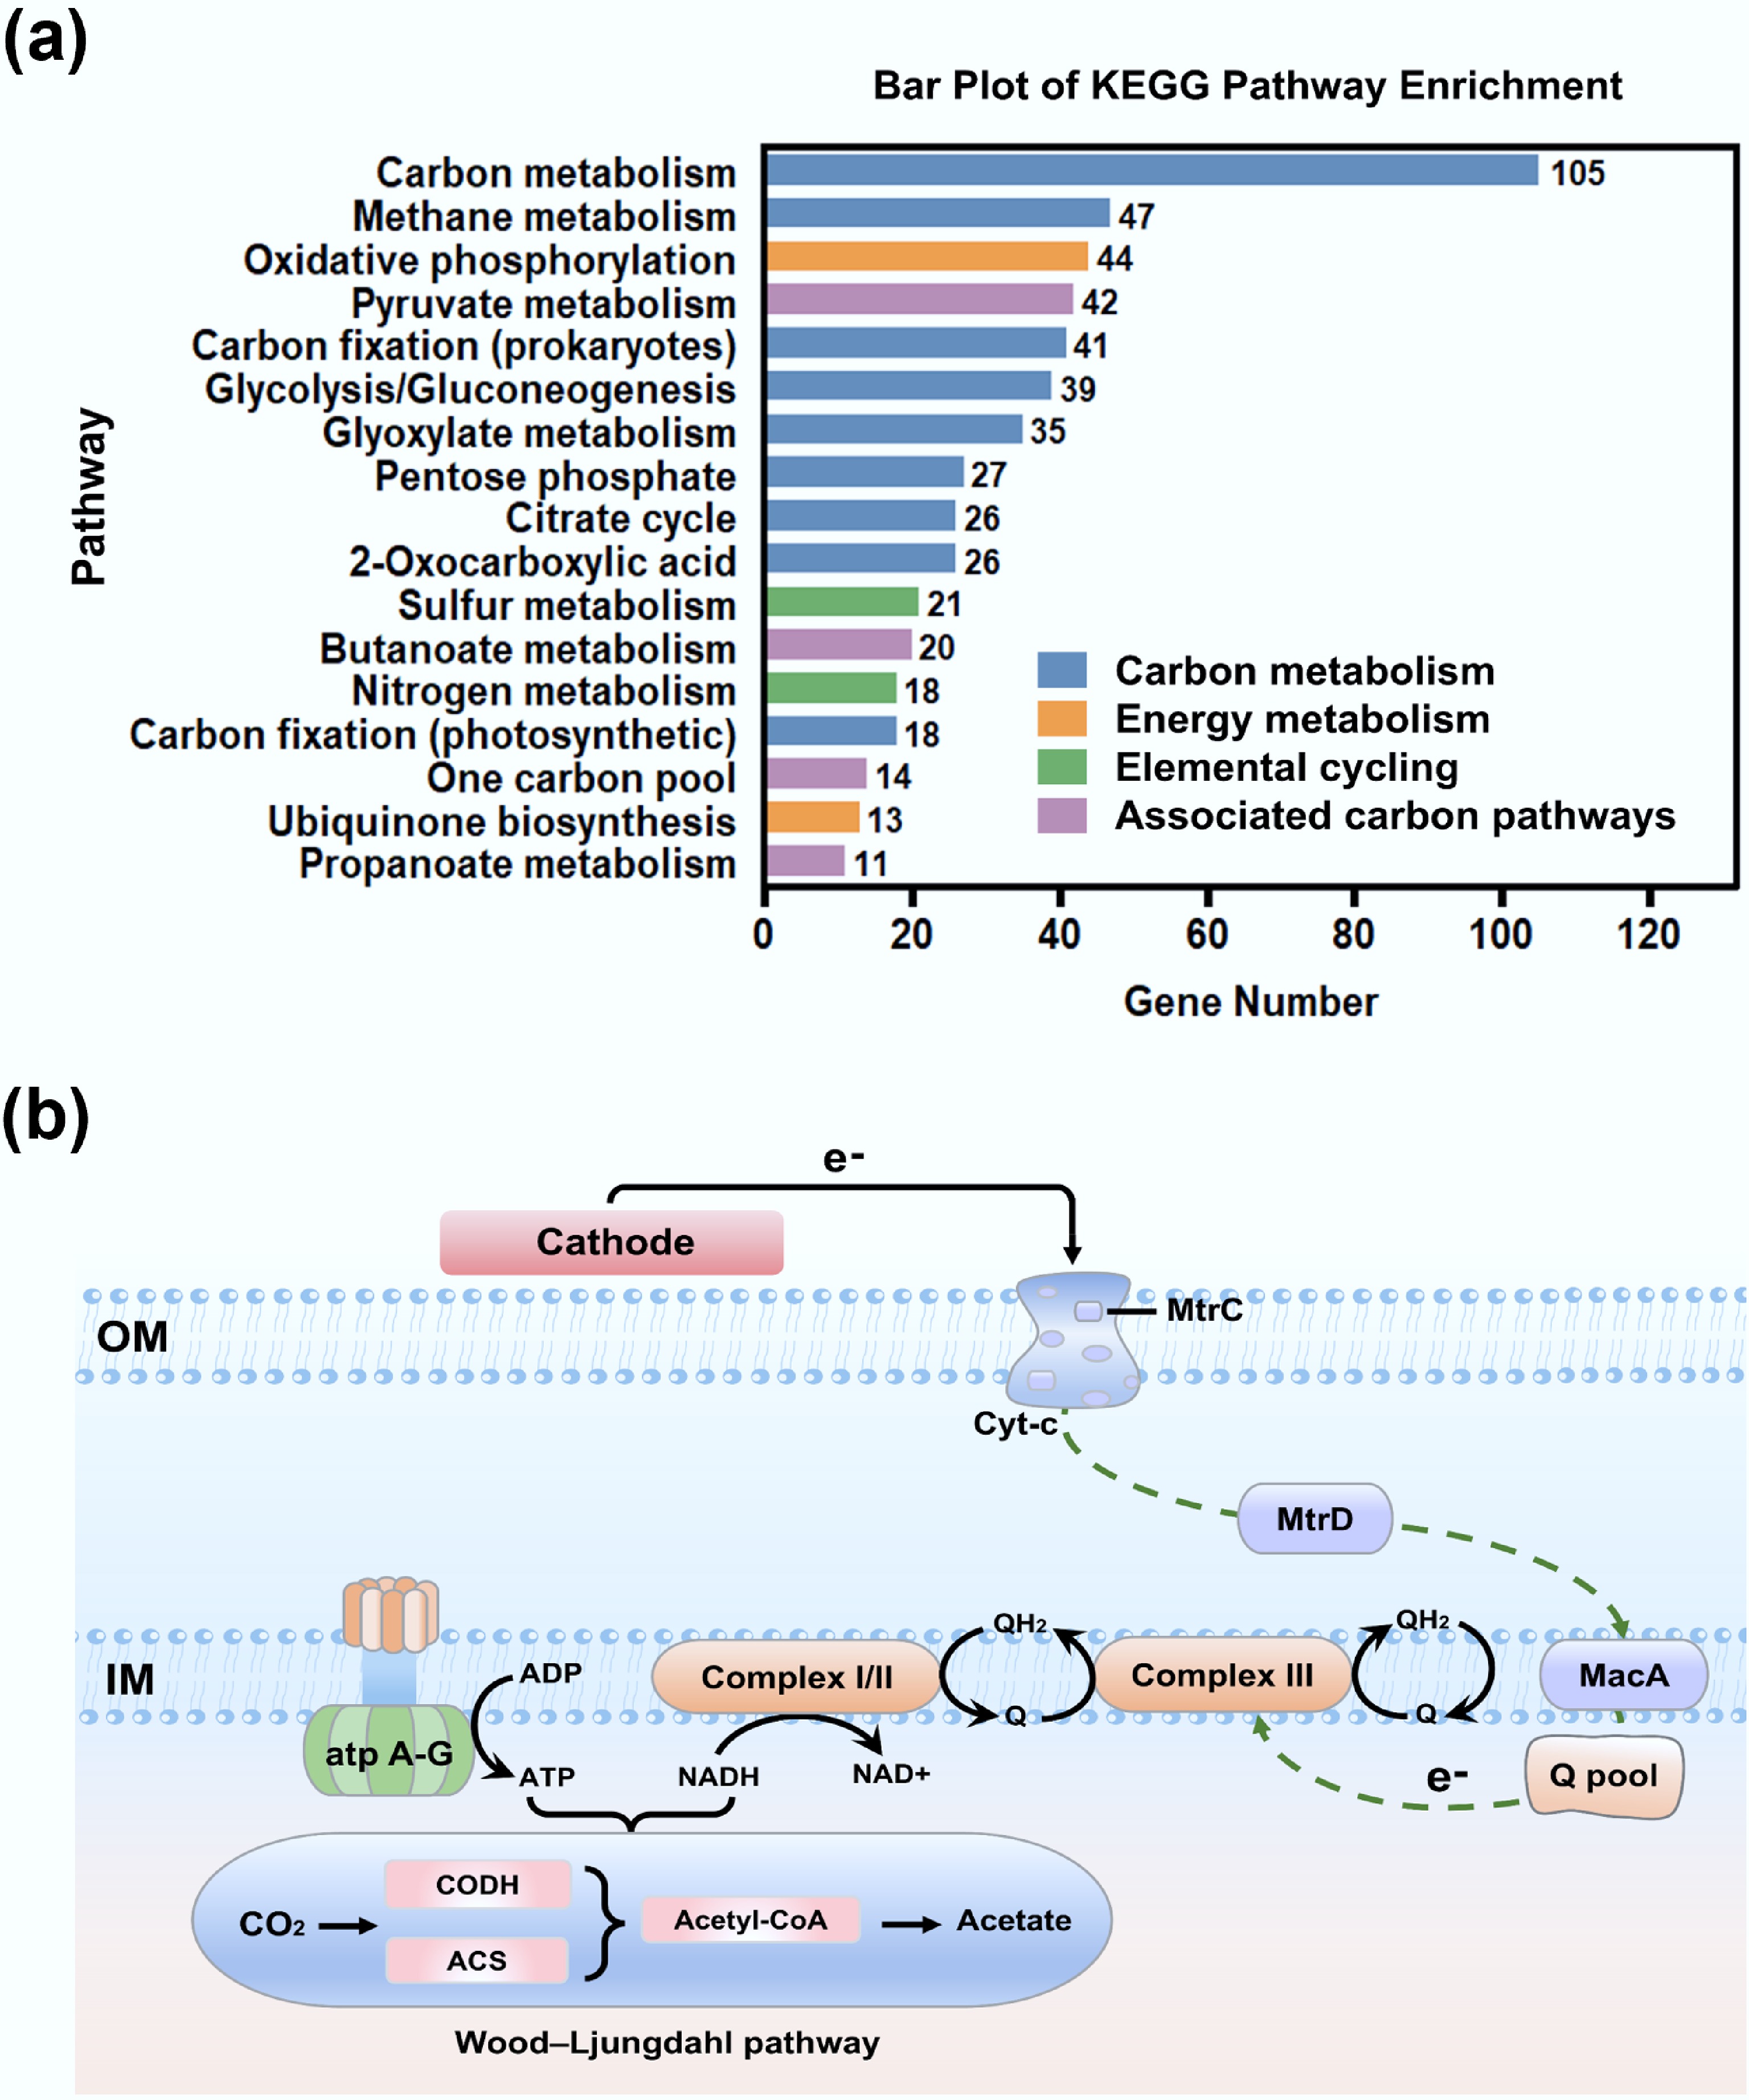
Figure 6.
Microbial electrochemical carbon fixation pathways of F. terrae. (a) Functional distribution of genes associated with carbon metabolism and related processes: carbon metabolism (glycolysis, TCA cycle, carbon fixation) in blue; energy metabolism in orange; elemental cycling (N, S) in green; other carbon-related pathways in purple; (b) Schematic representation of the carbon fixation pathway in F. terrae.
Figures
(6)
Tables
(0)