-
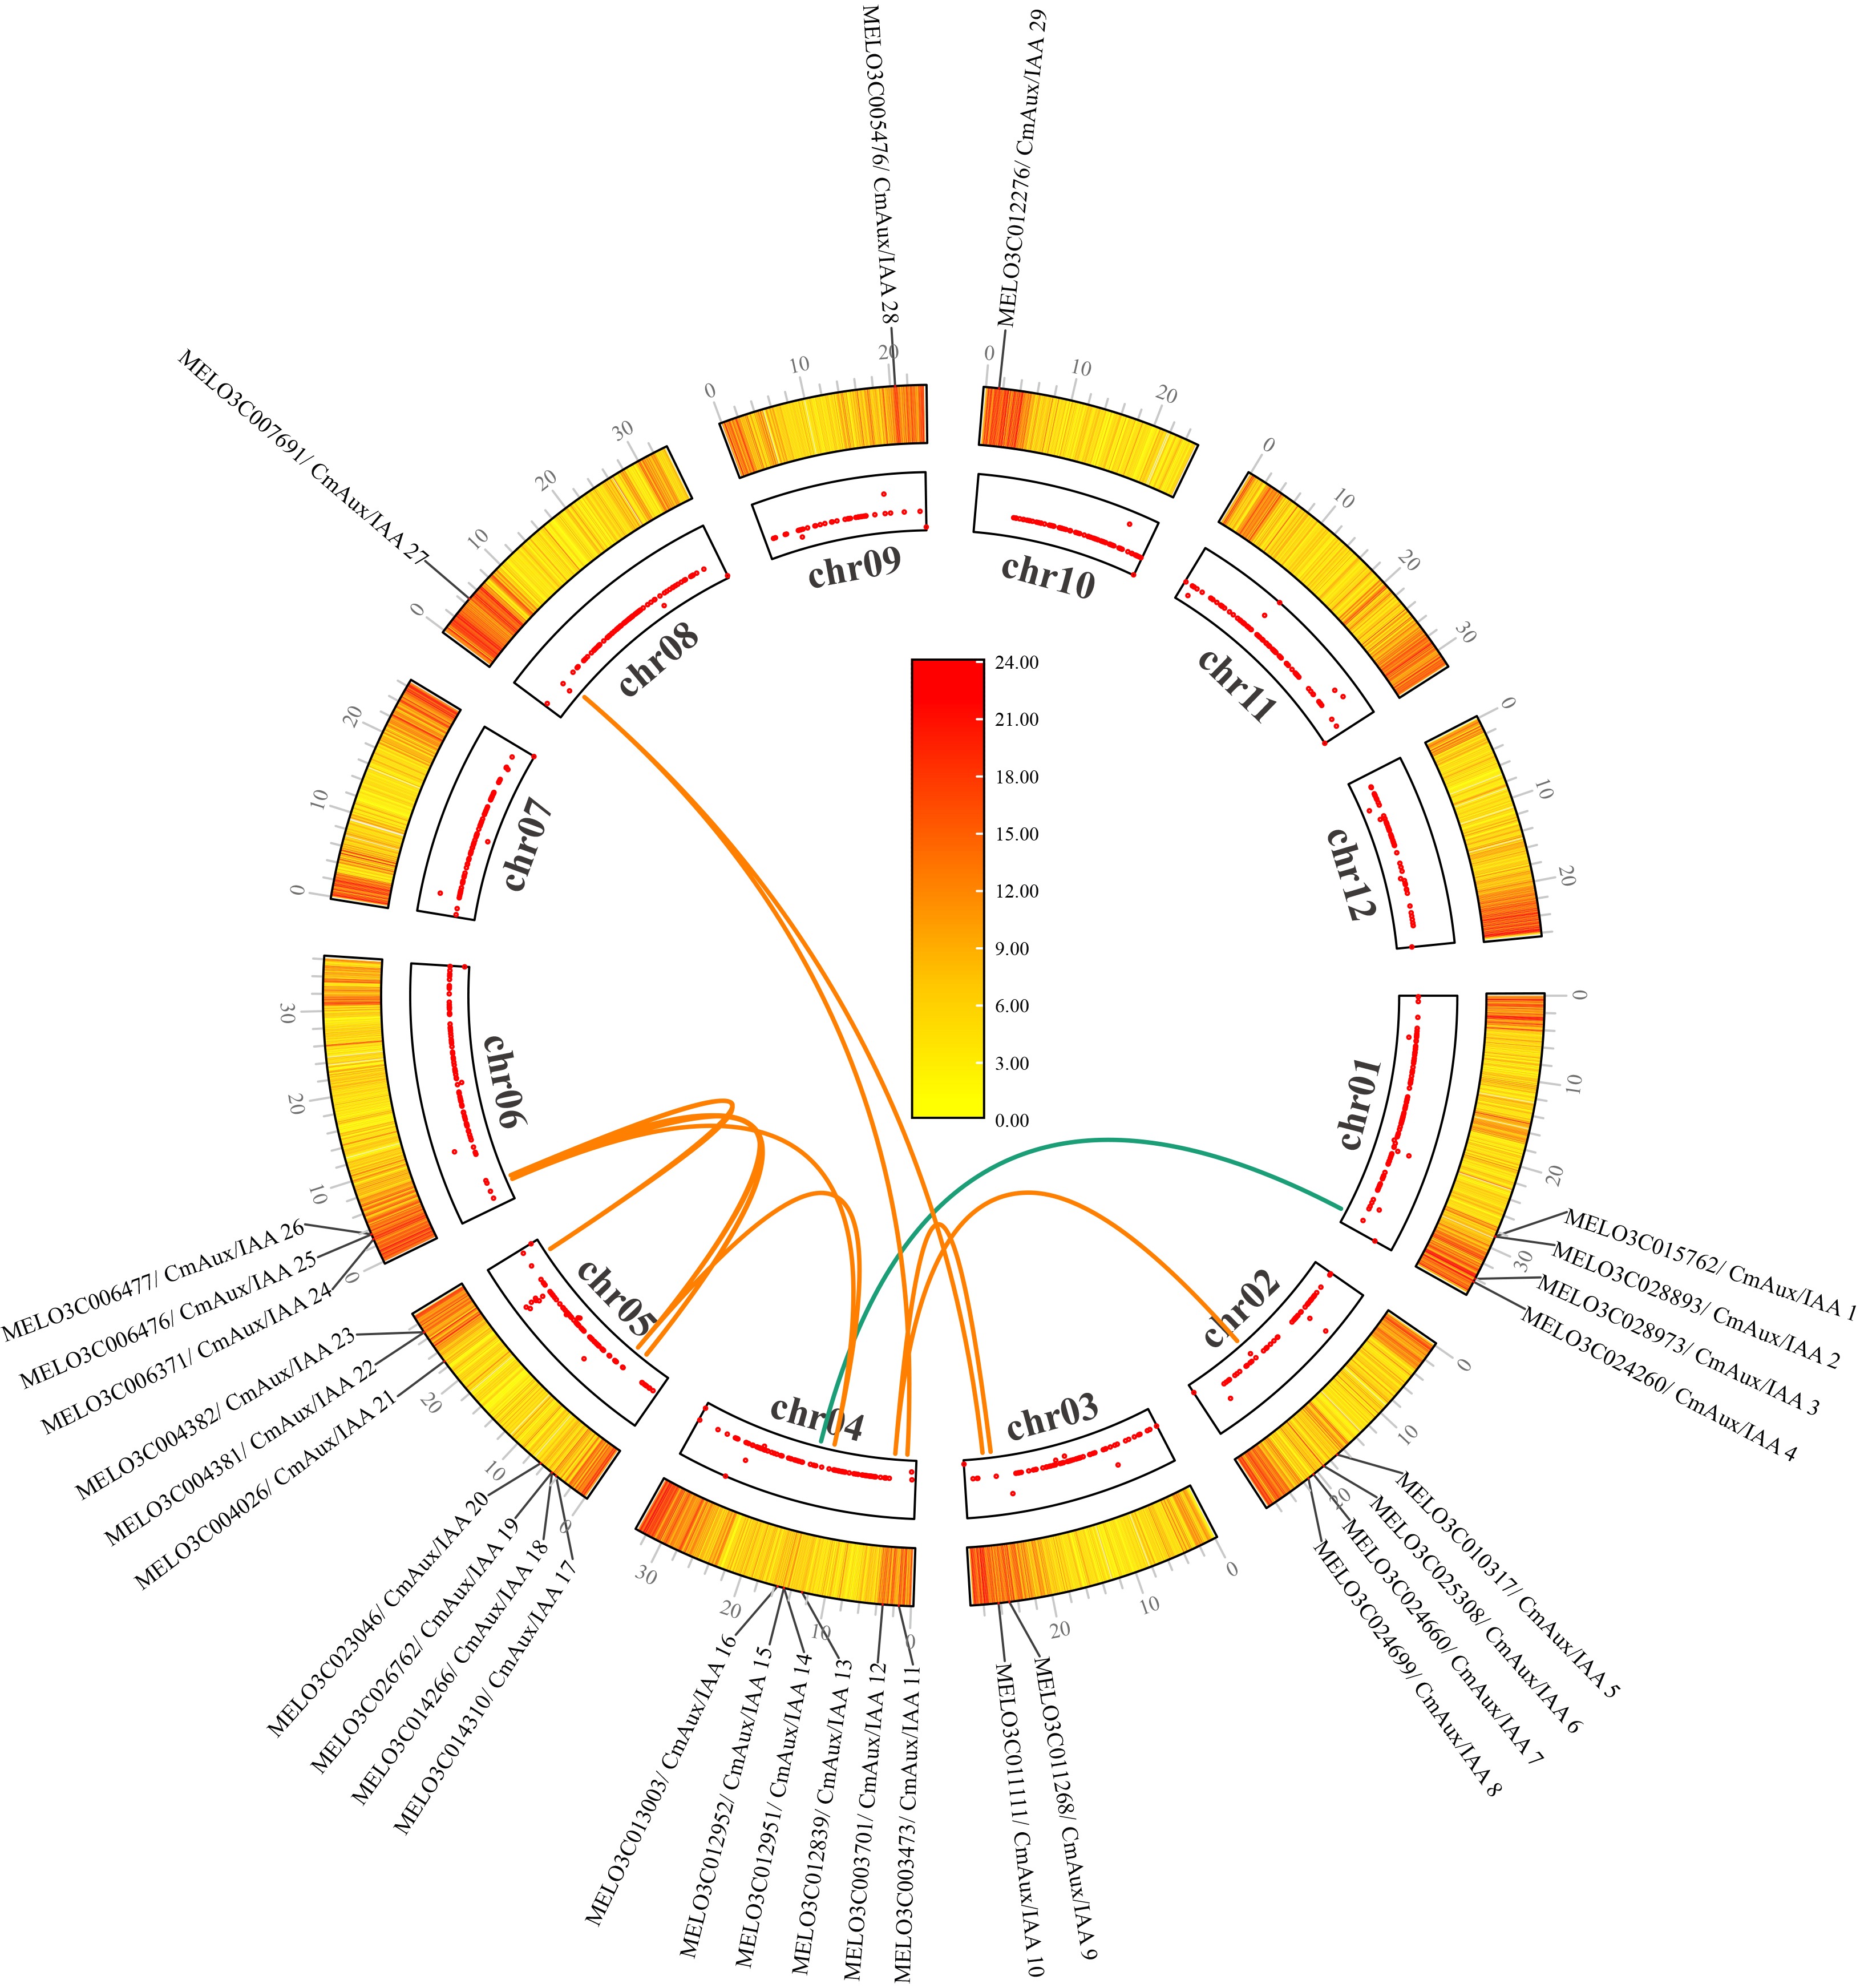
Figure 1.
Genomic distribution and collinearity analysis of AuxIAA genes in Cucumis melo.
-
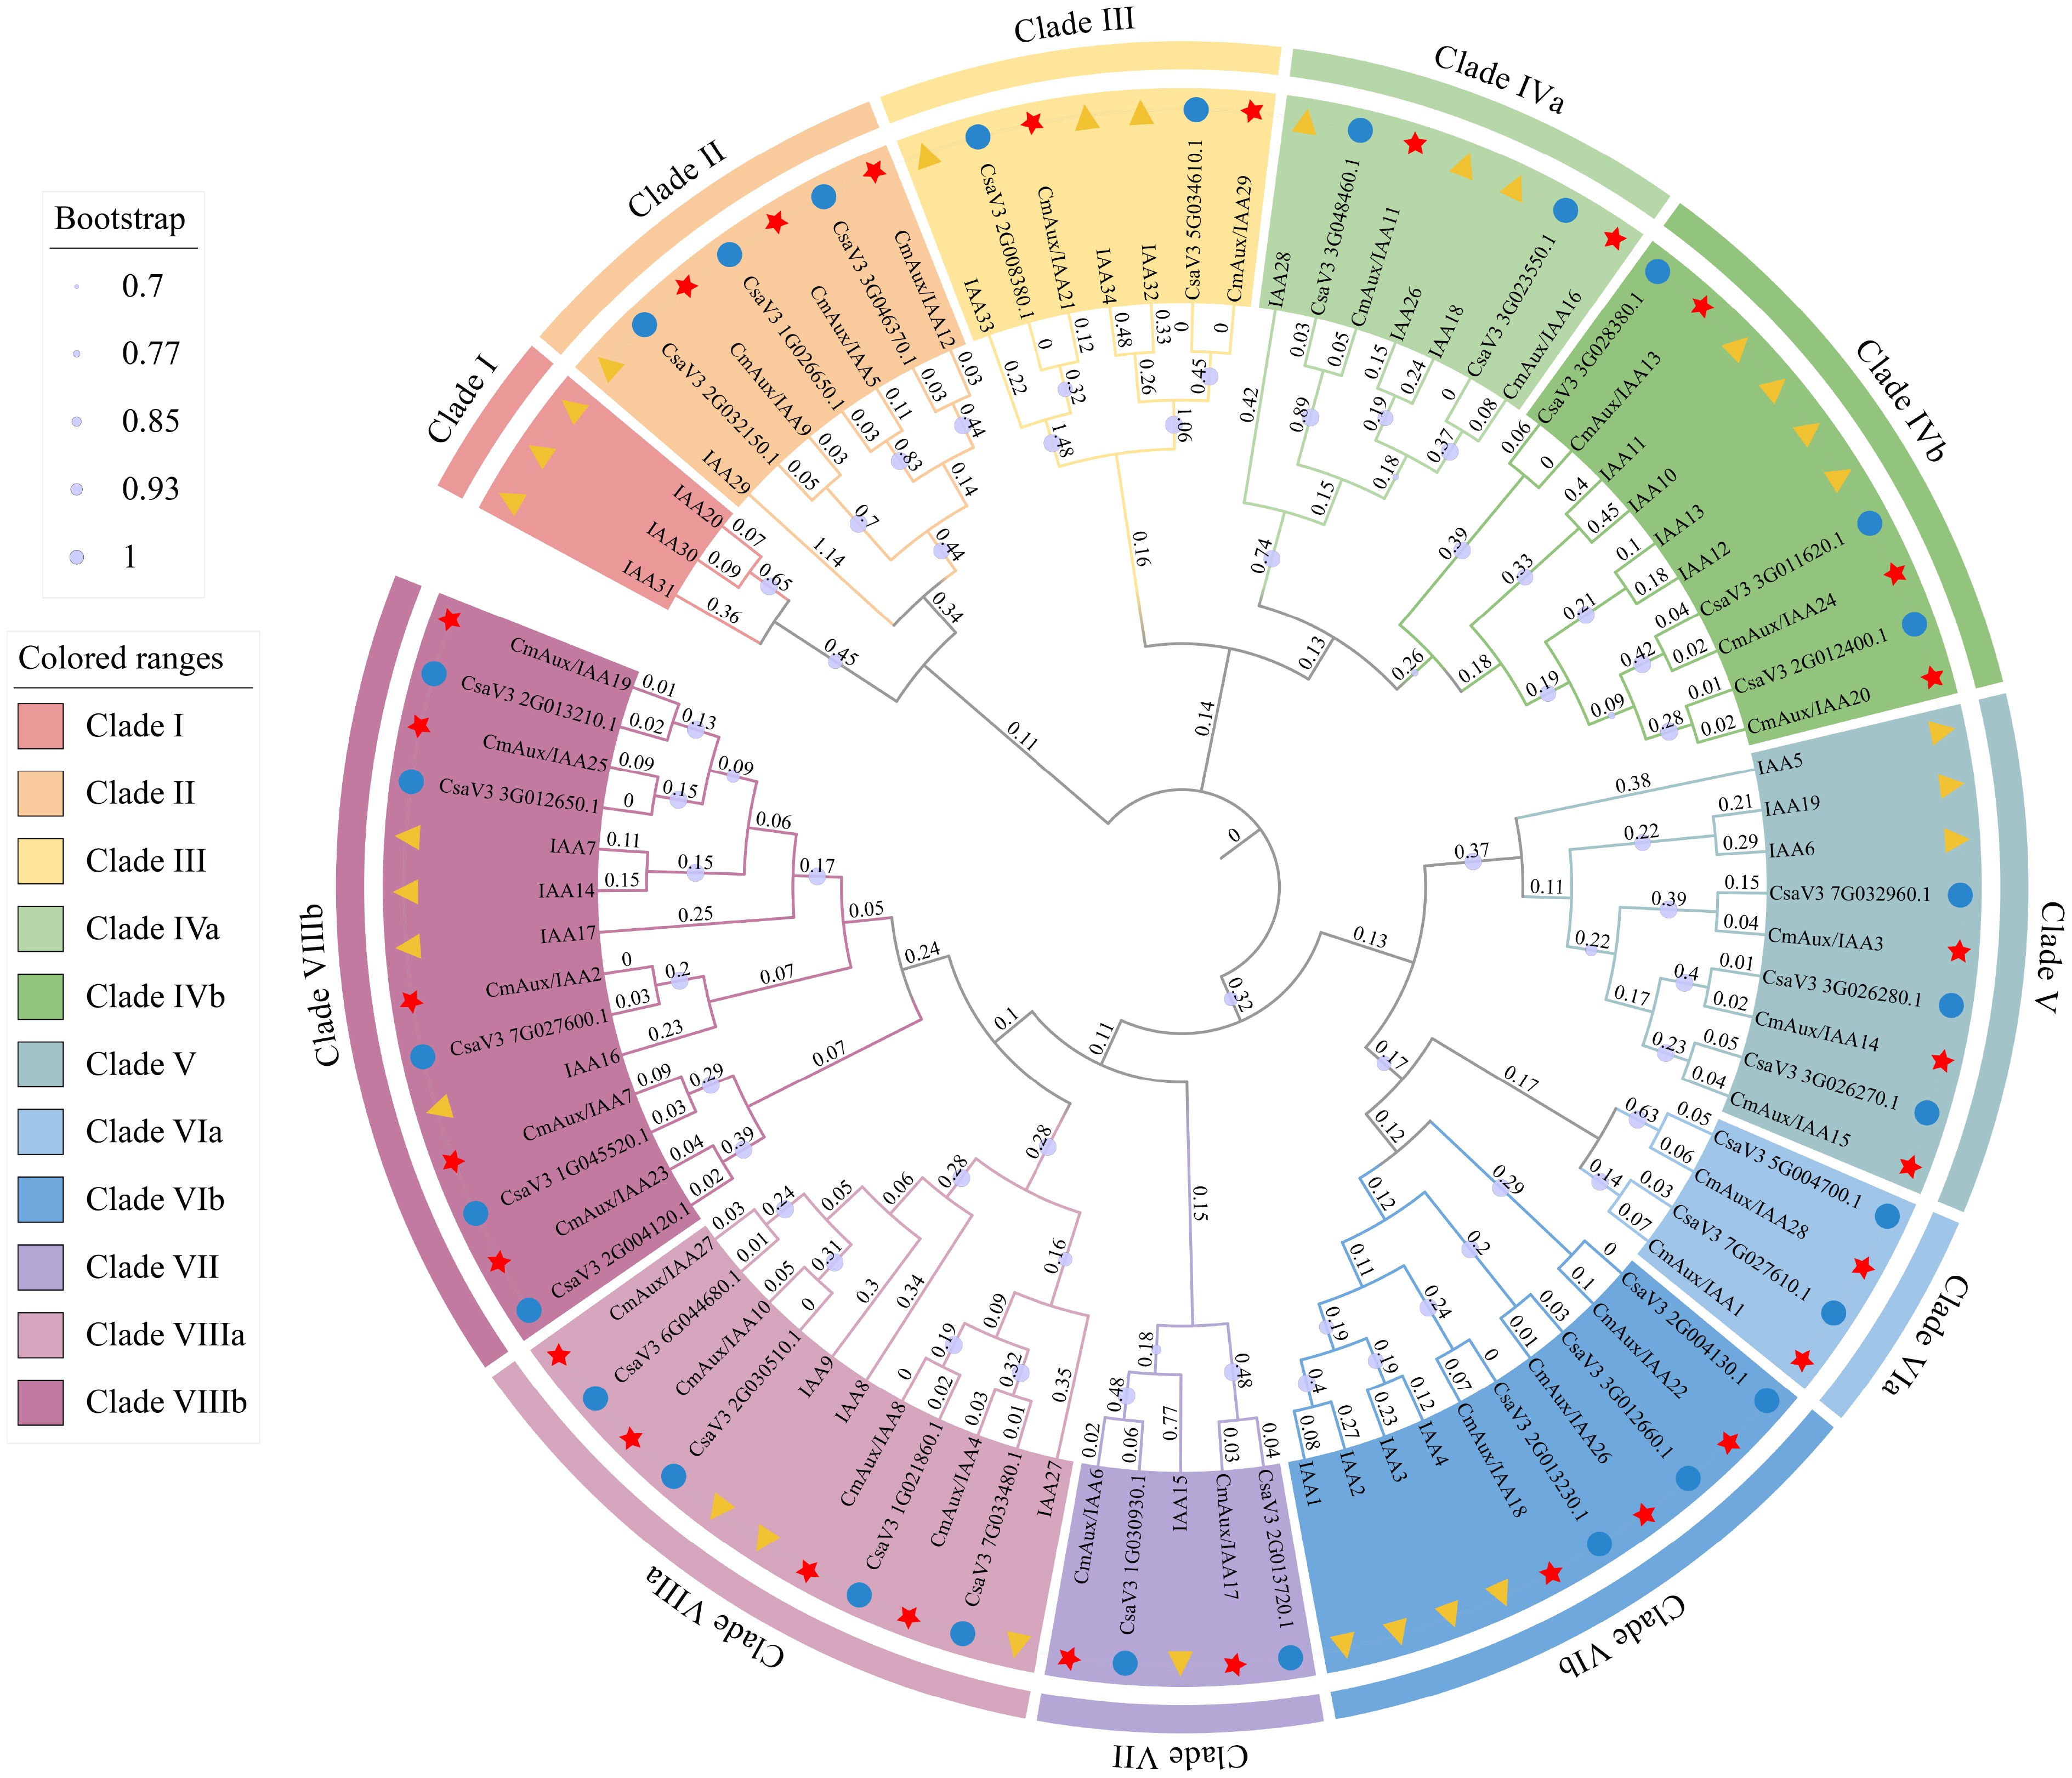
Figure 2.
Phylogenetic analysis of Aux/IAA proteins. The Aux/IAA amino acid sequences of A. thaliana, C. sativus, and C. melo were aligned via ClustalX 2.1, and the phylogenetic tree was constructed via the maximum likelihood method with 1,000 bootstrap replicates. The sequences were divided into eight clades. Different clades in the outer ring are distinguished by different colors, and different colors/shapes in the inner ring represent different species (yellow triangle is Arabidopsis, blue circle is cucumber, and red star is melon). This phylogenetic tree was generated by MEGA 11 (
www.megasoftware.net ), and iTOL online site (https://itol.embl.de ). -
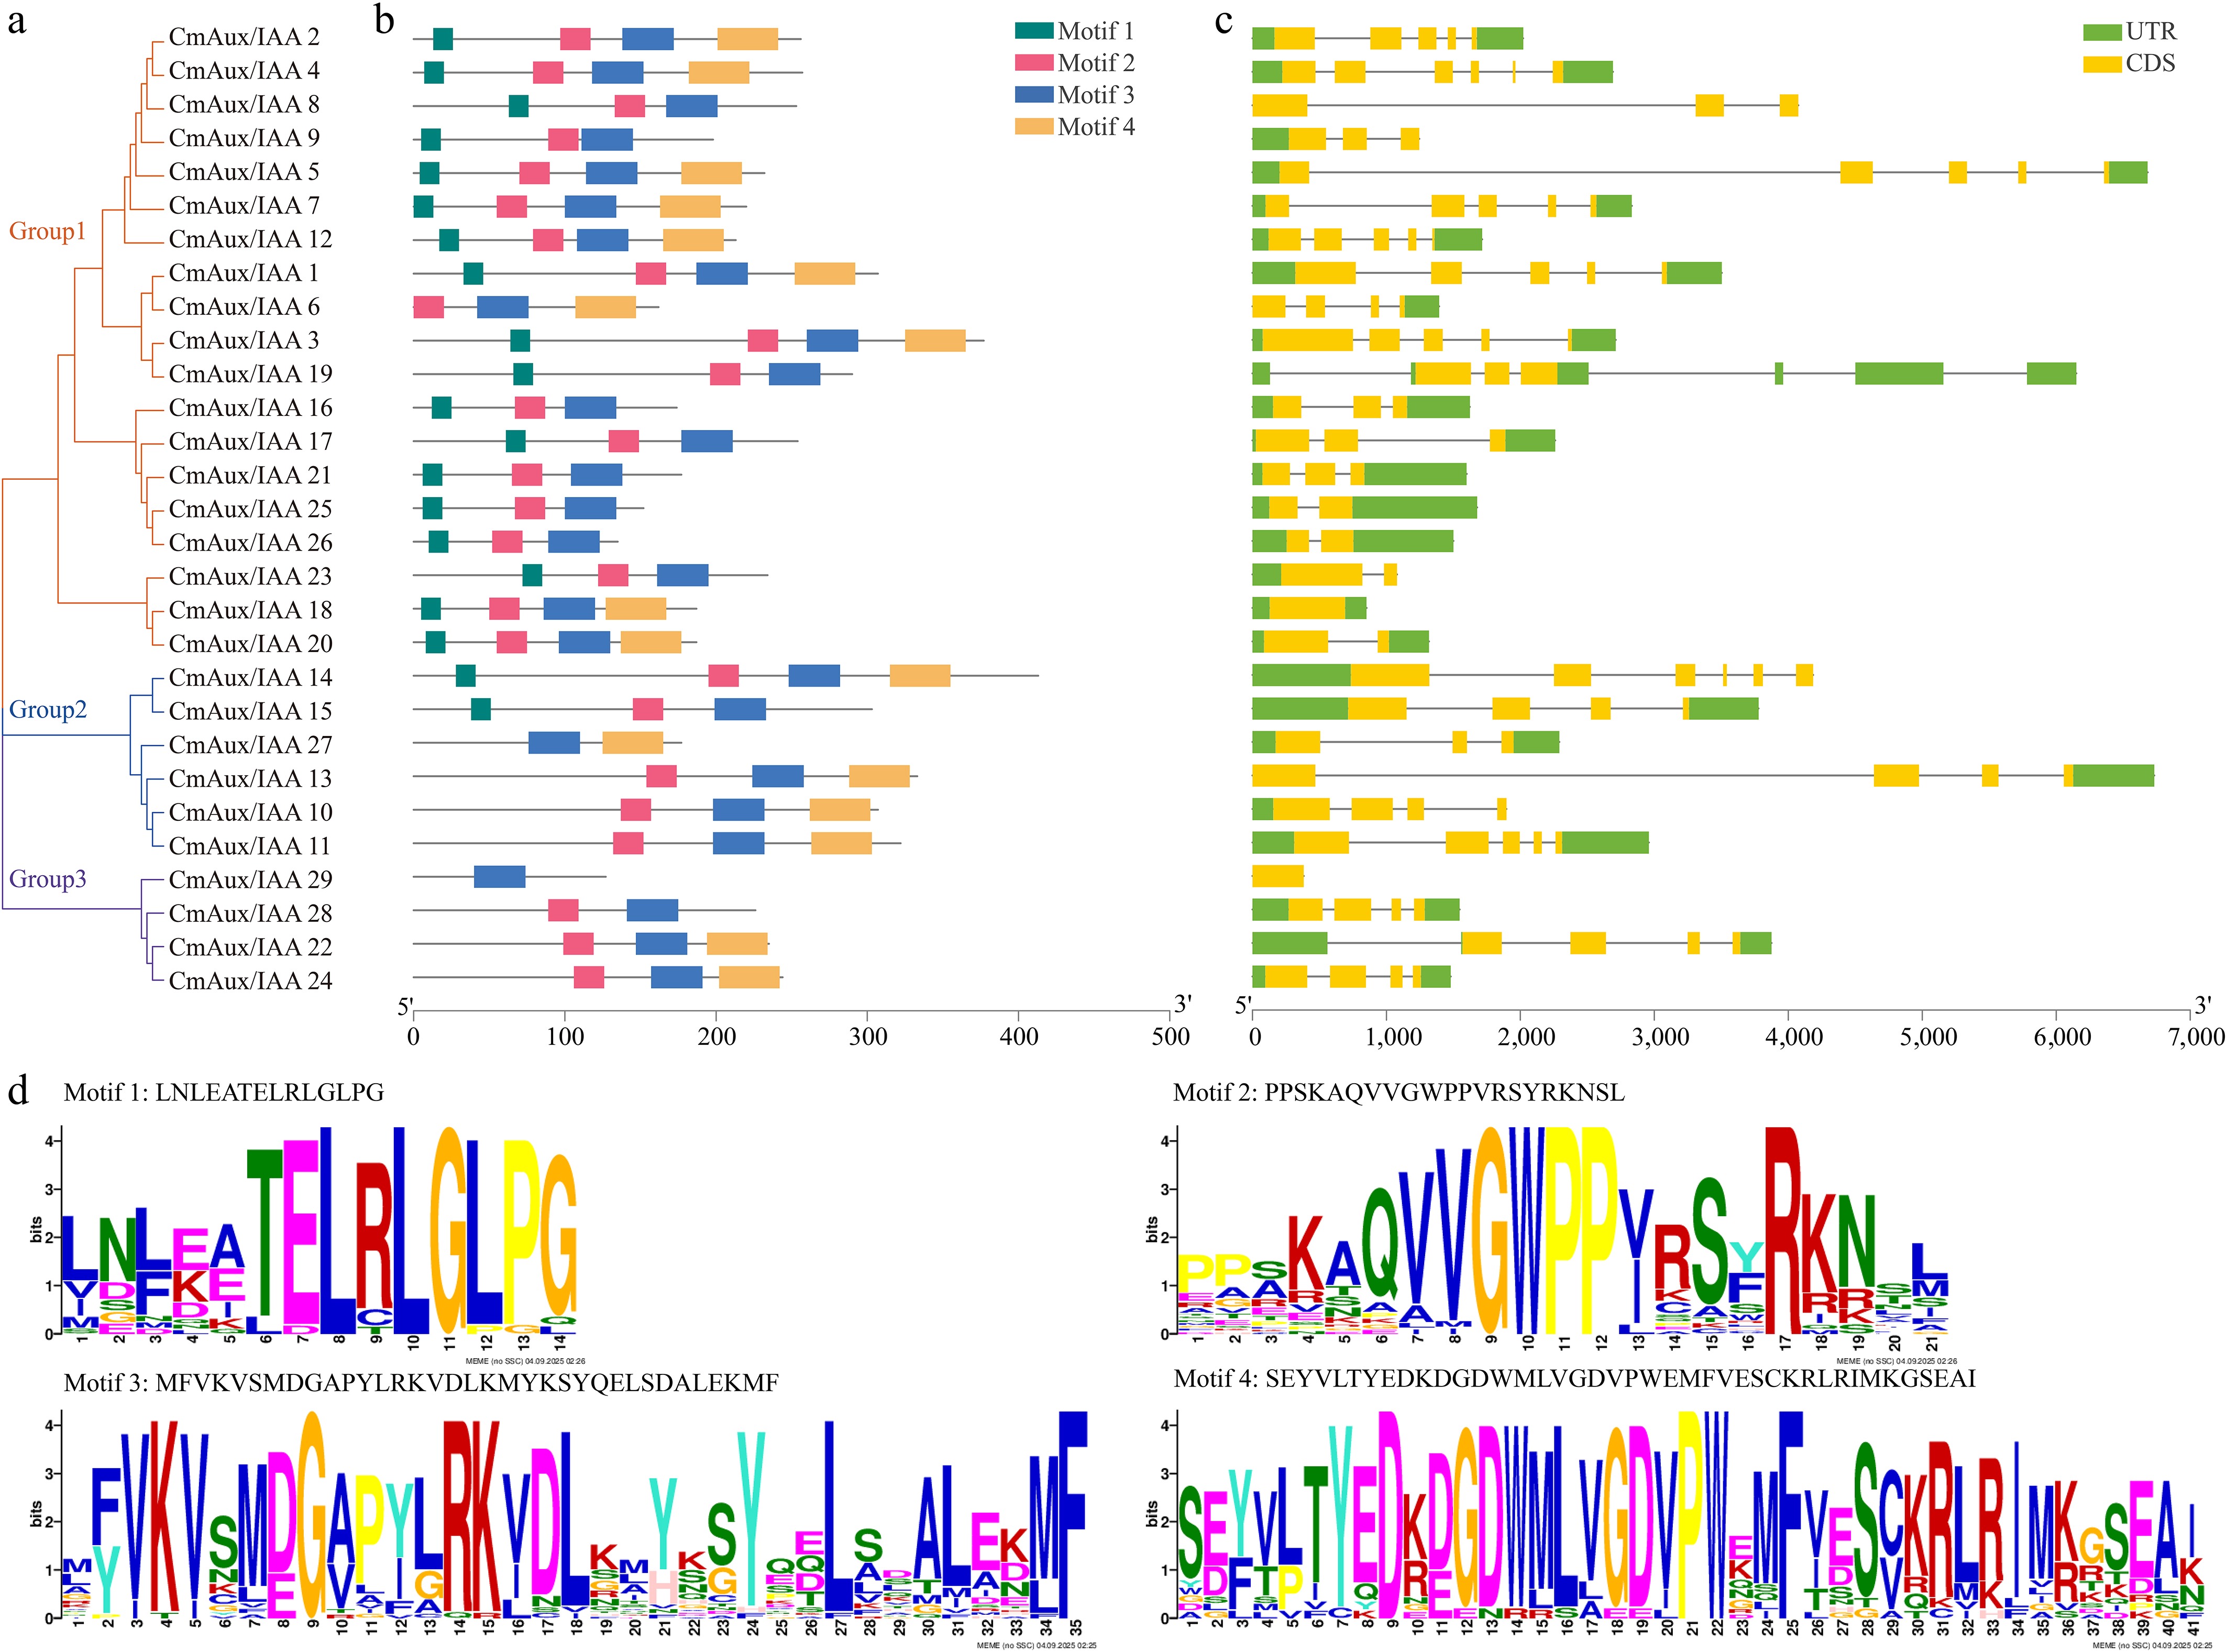
Figure 3.
Phylogenetic relationships, gene structure, and motif distribution of CmAux/IAA > gene family. (a) Phylogenetic tree of CmAux/IAA protein with 1,000 replicates per node. (b) The distribution of conserved motifs of CmAux/IAA proteins by the MEME. Different color boxes represent four conserved motifs. (c) Exon-intron structures of CmAux/IAA genes. Green rectangles, yellow rectangles, and black lines indicate UTR (non-coding region), CDS (coding sequence or exons), introns, respectively. (d) Amino acids' sequence logos for the four motifs.
-
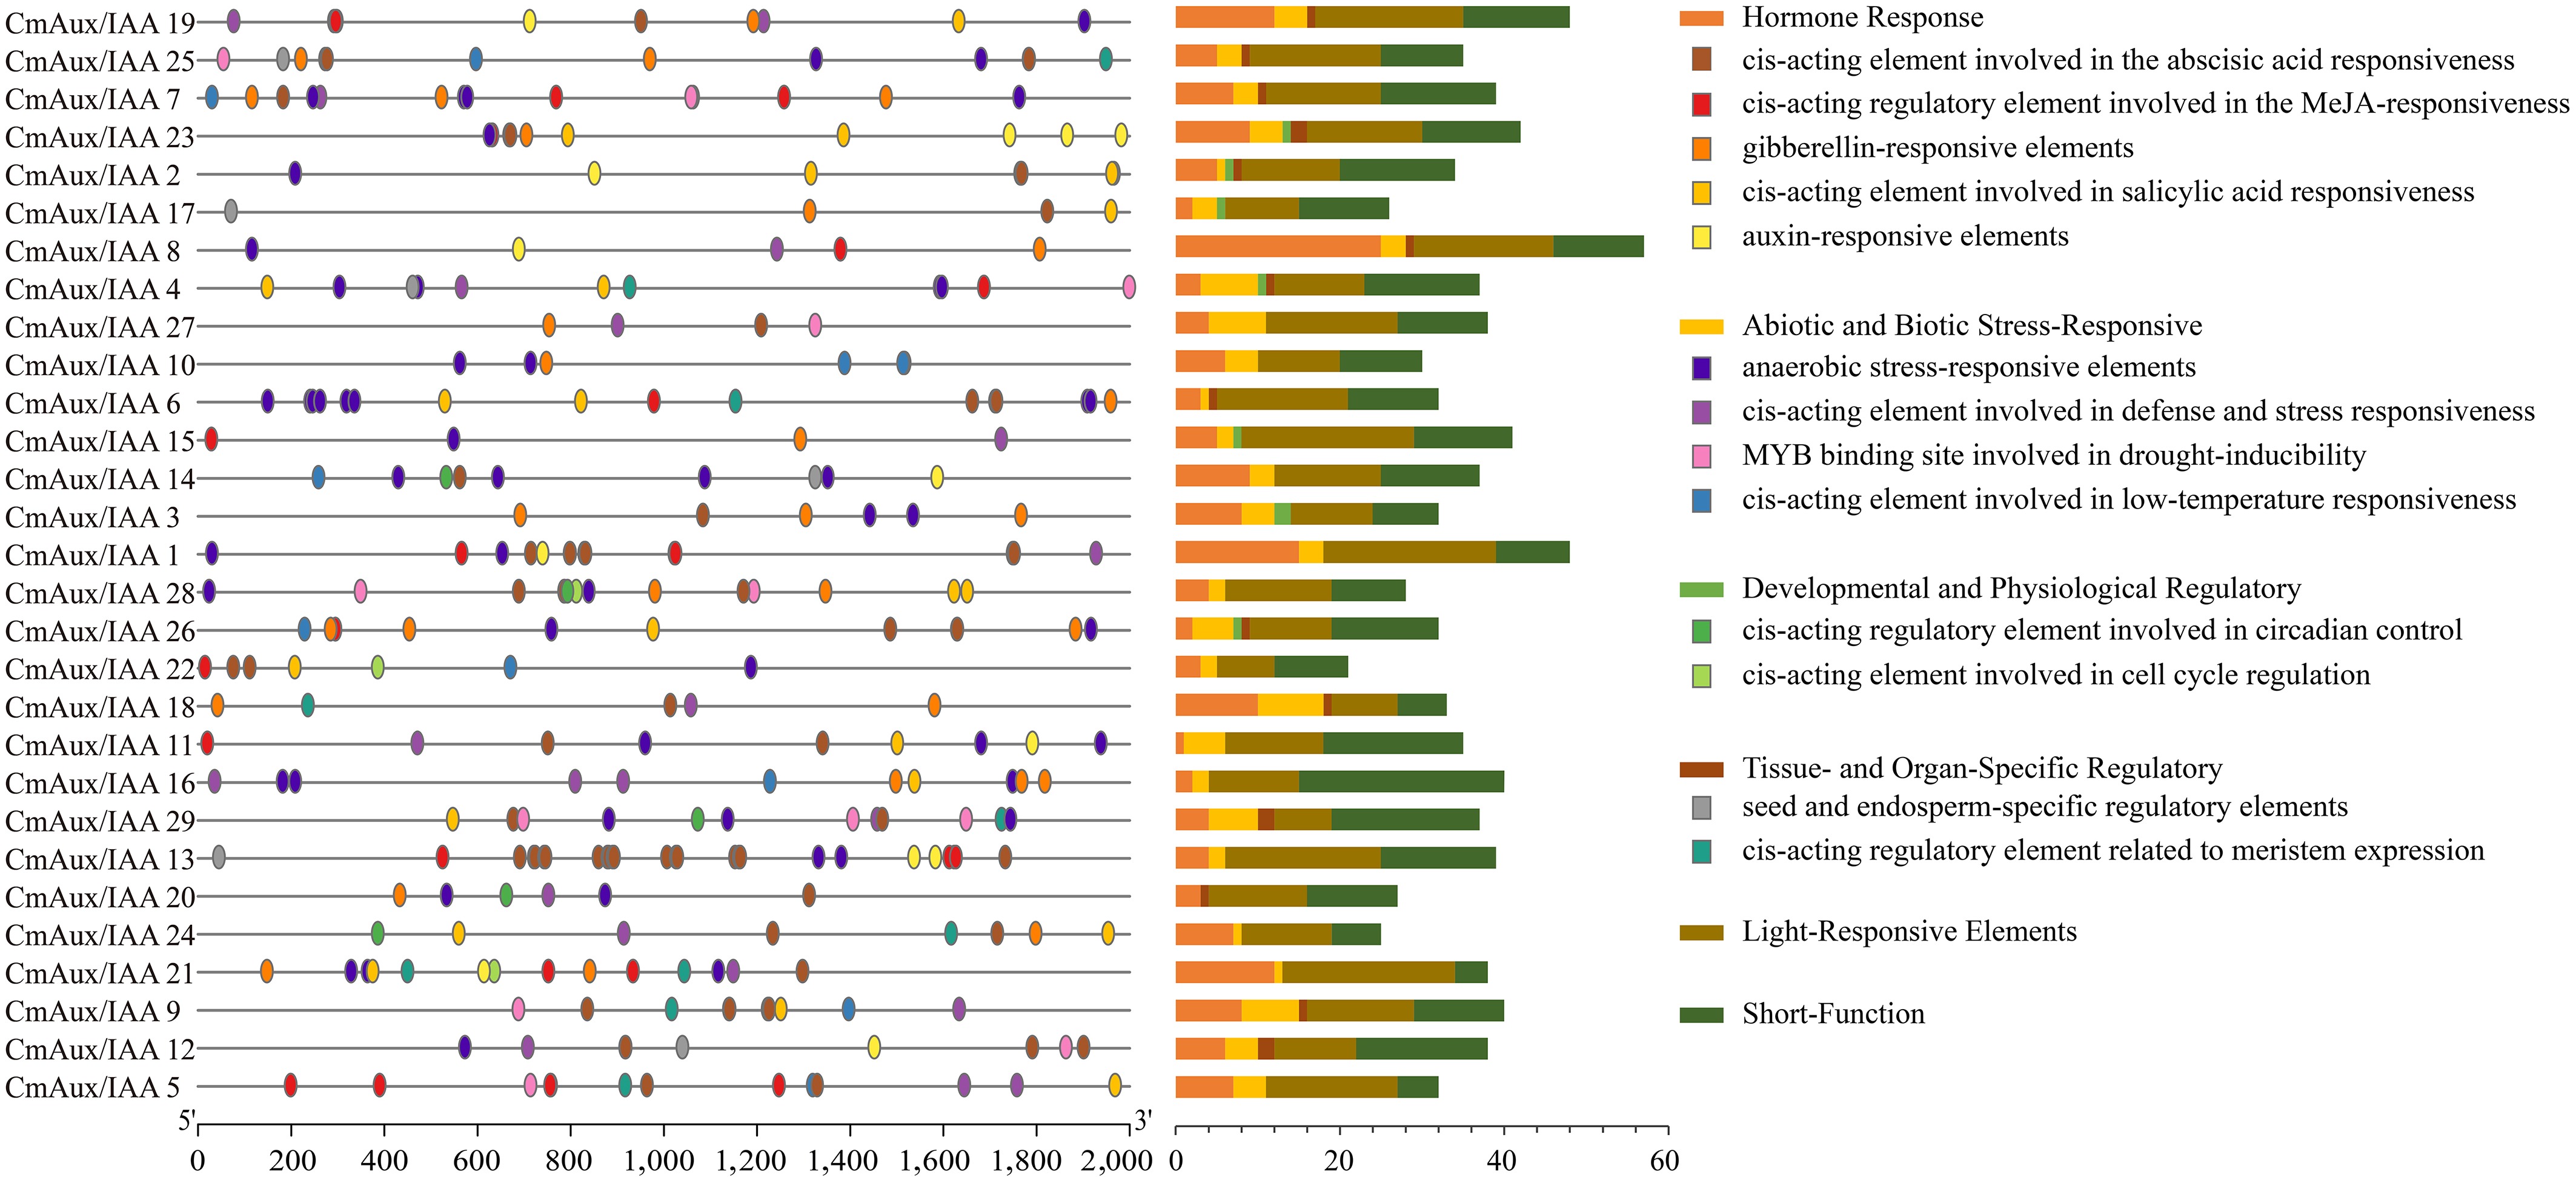
Figure 4.
Cis-acting element of the Aux/IAA gene family in melon. Elements are represented by differently colored ovals on the left, with each type possessing a distinct biological role. The number of elements within each major category is presented in the stacked bar chart on the right.
-
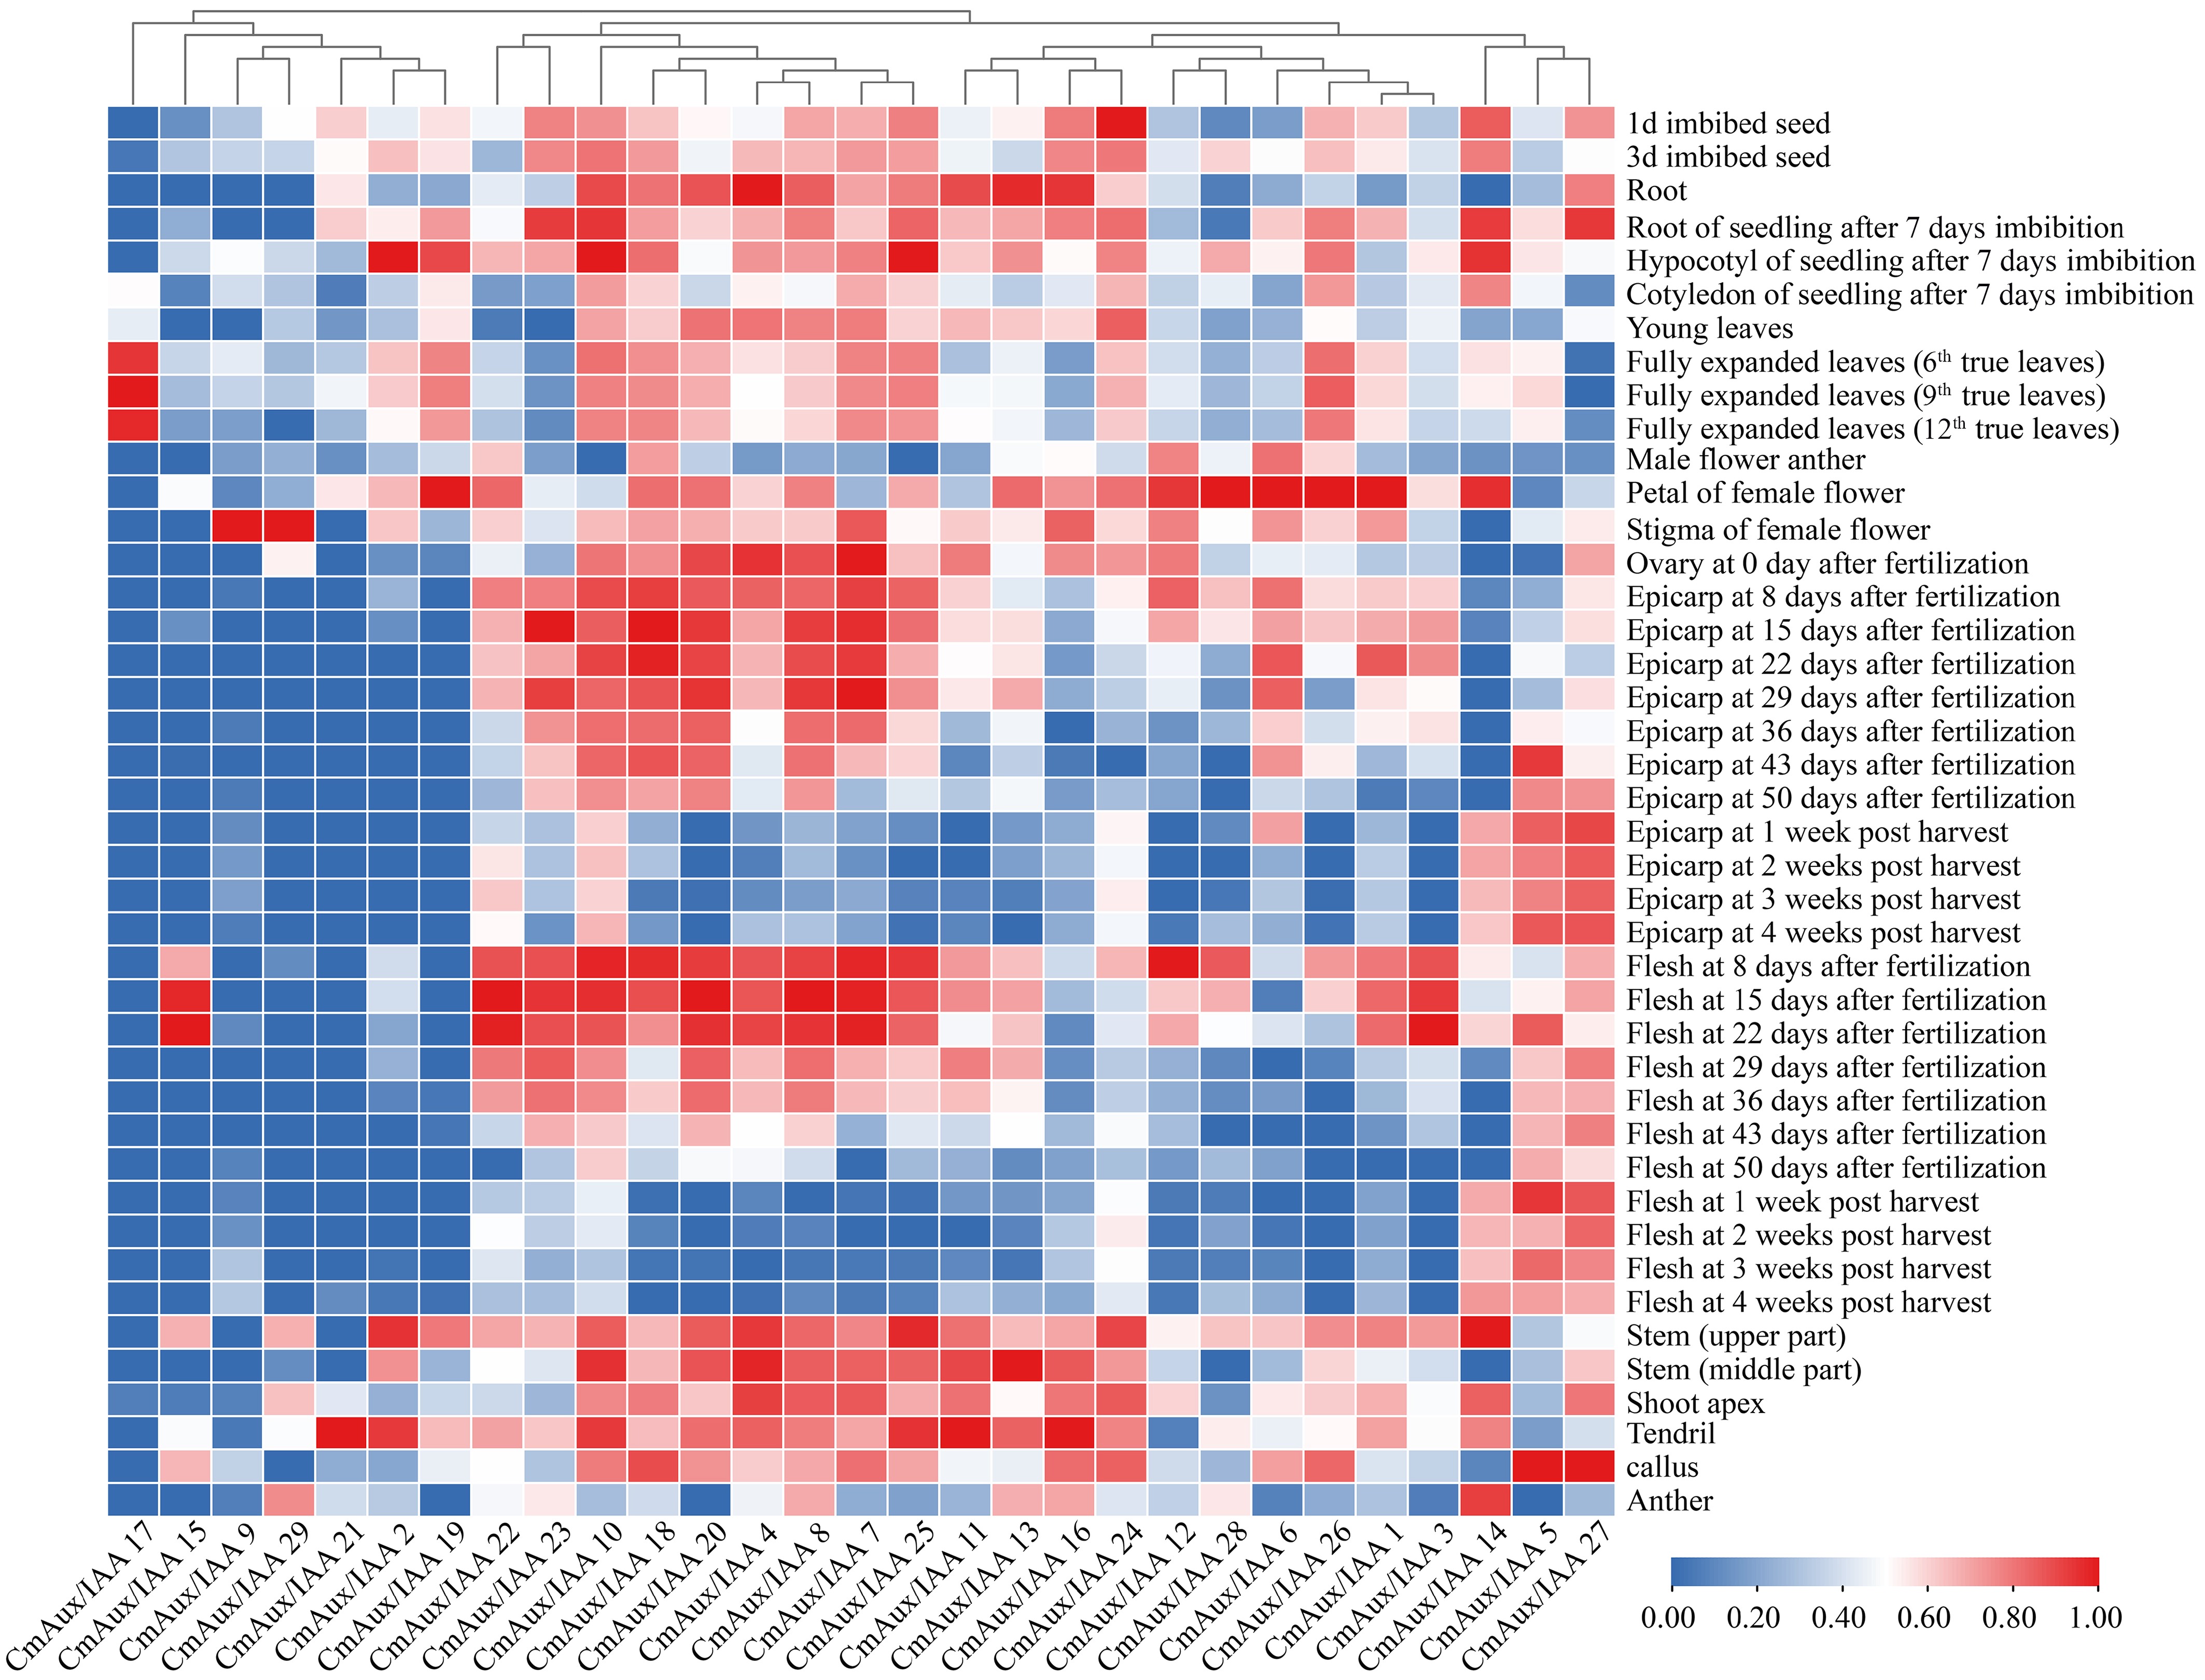
Figure 5.
Tissue-specific expression patterns of the Aux/IAA gene family in melon. Integration of RNA-seq data from 27 and 15 developmental tissues (NCBI BioProjects PRJDB6414 and PRJNA603204). The heatmap was generated using TBtools based on log2-transformed fluorescence intensity values. Expression values for each gene (columns) across different samples (rows) were standardized by Z-score normalization. Genes were clustered using Pearson correlation coefficients. The color gradient from blue to red represents relative expression levels from low (0.00) to high (1.00).
-
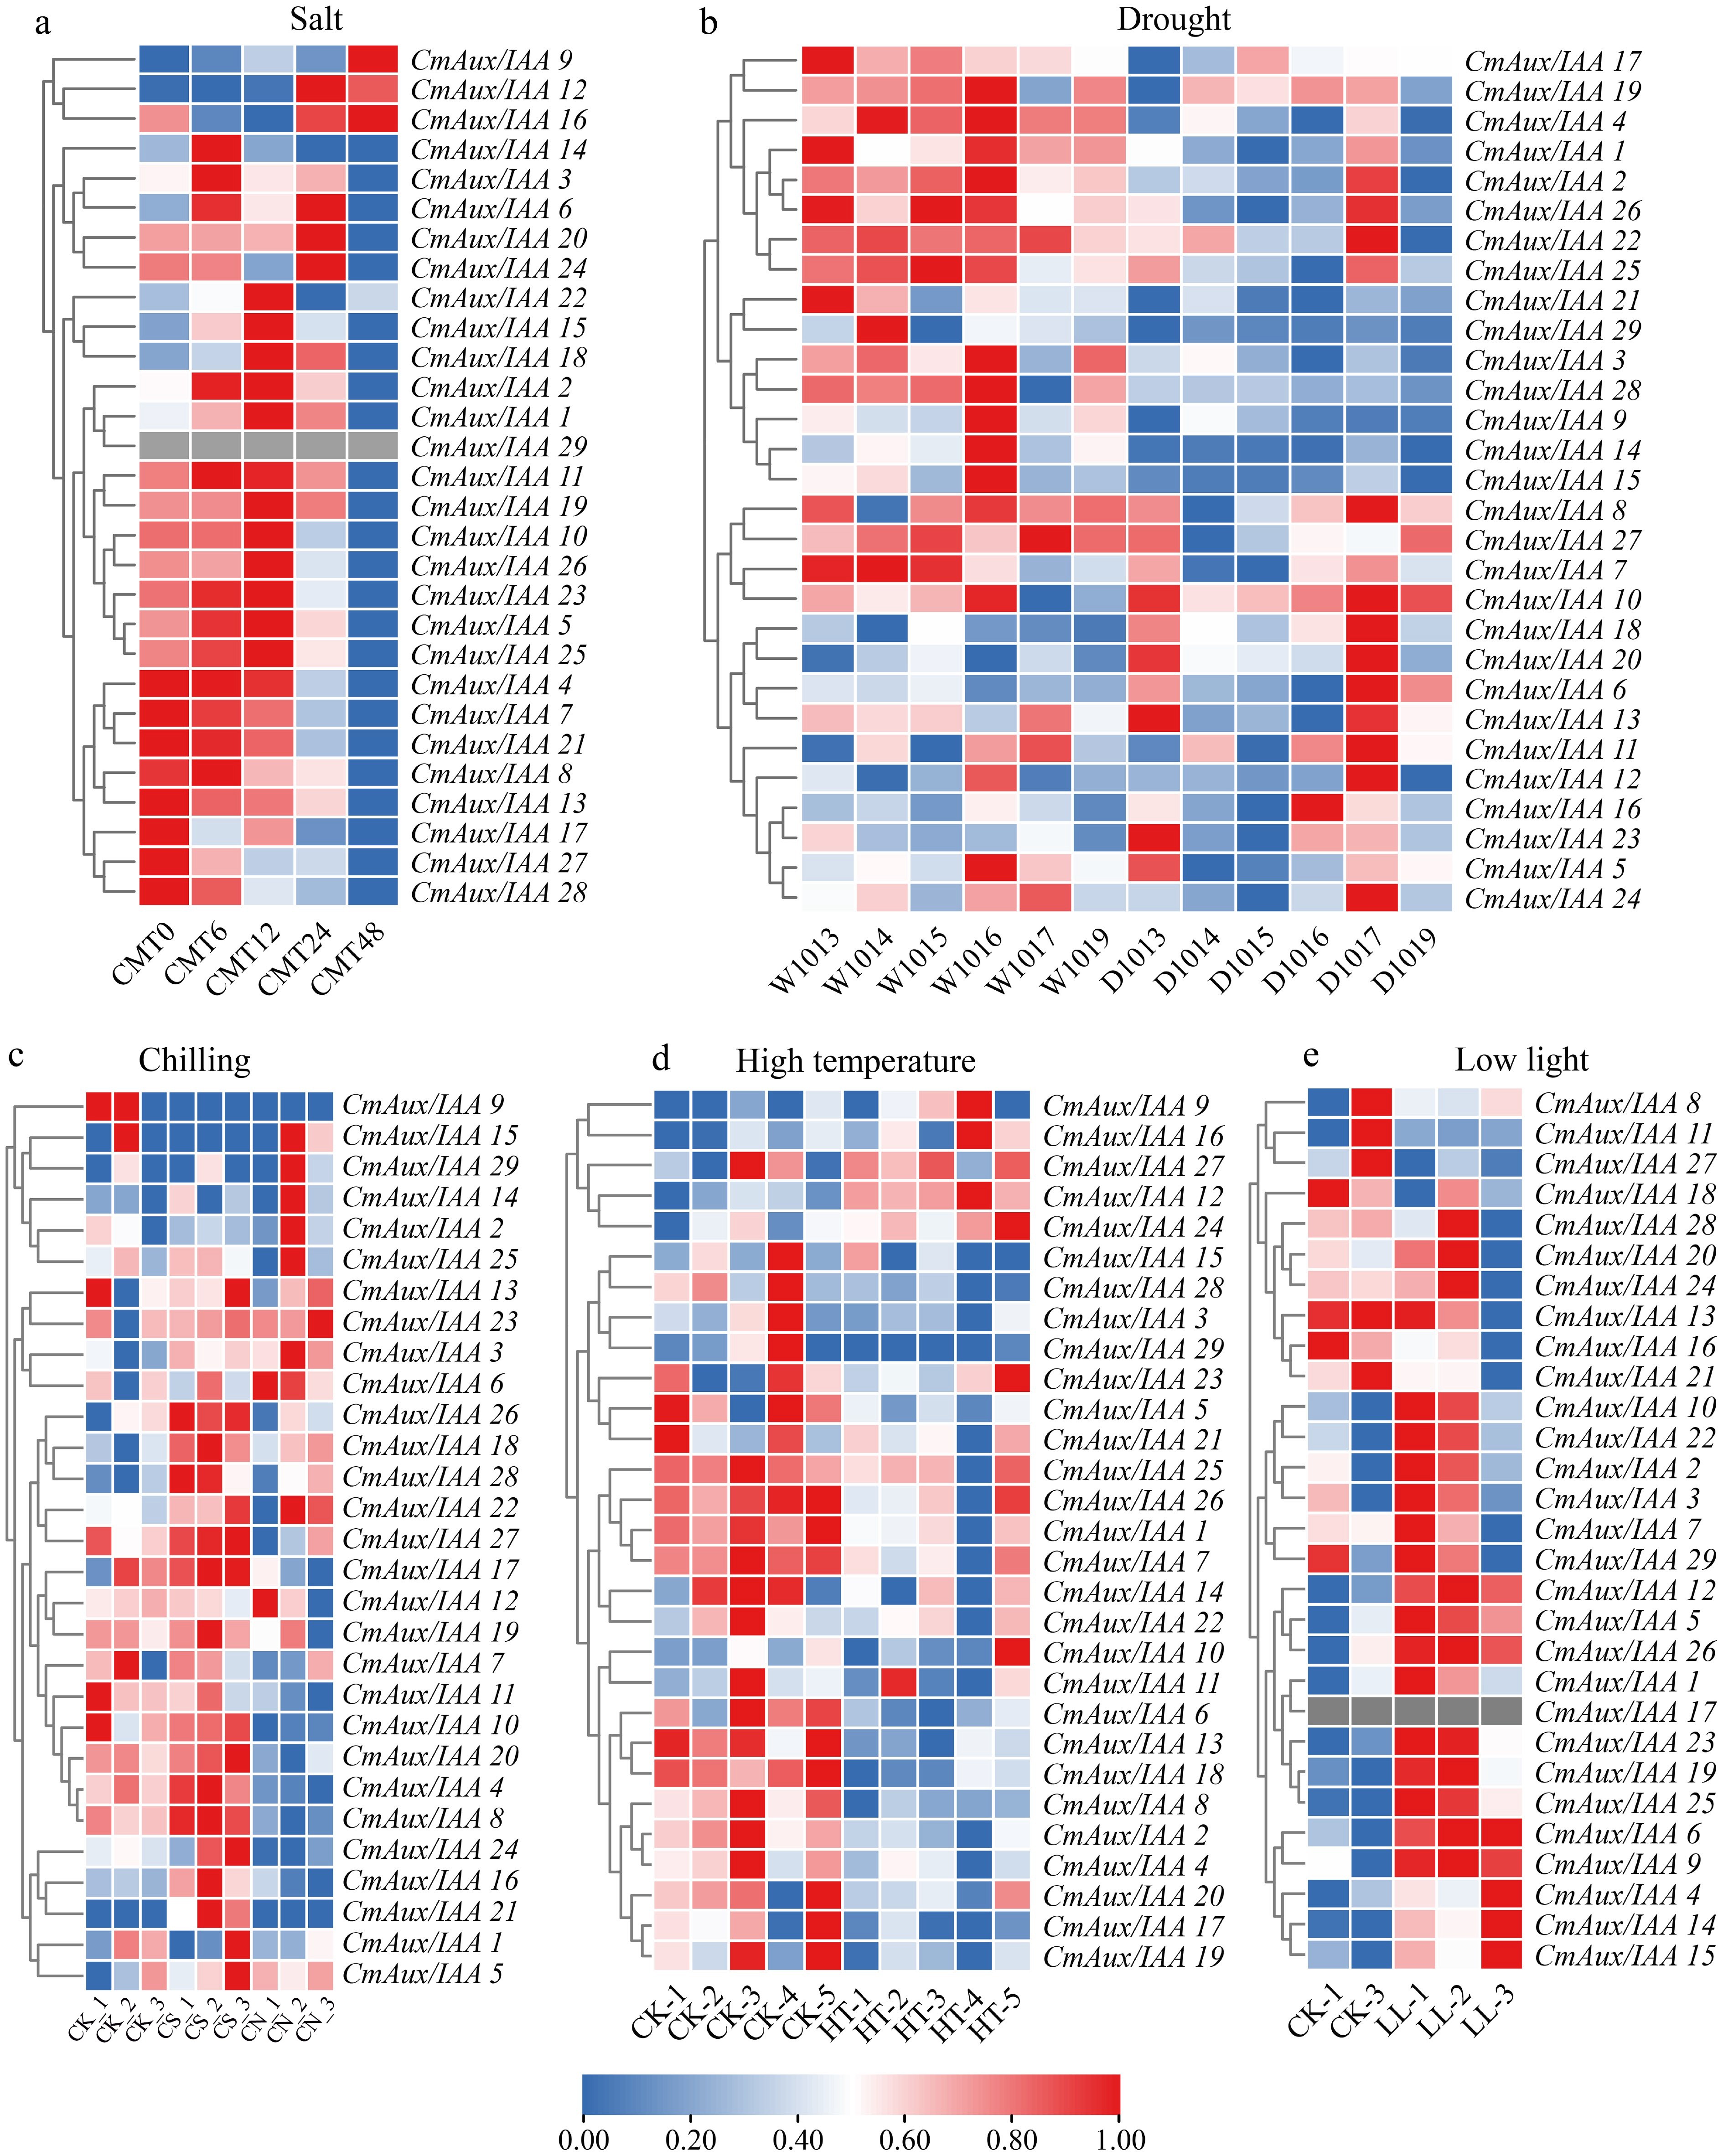
Figure 6.
Expression profiles of CmAux/IAA genes under abiotic stresses. (a) Root expression in cultivar 'Longqing' under salt stress at indicated time points (0, 6, 12, 24, 48 h). (b) Response to drought stress across six distinct melon varieties. (c) Response to chilling stress (CS) and the combined treatment of chilling with the nitric oxide donor sodium nitroprusside (CN) in seedlings. (d) Response to high-temperature stress. (e) Response to low-light stress. Data for (a) and (c) were obtained from public databases (NCBI BioProject: PRJNA987131 and PRJNA553119, respectively); data for (b), (d), and (e) were generated in this study. For the salt stress condition, expression values are reported as the median of three biological replicates. The heatmap was generated in TBtools based on log2-transformed fluorescence intensity values, with Z-score normalization applied to each gene (rows) across all samples (columns). Hierarchical clustering was performed using Pearson correlation coefficients. A blue-to-red color gradient indicates relative expression levels from low (0.00) to high (1.00).
-
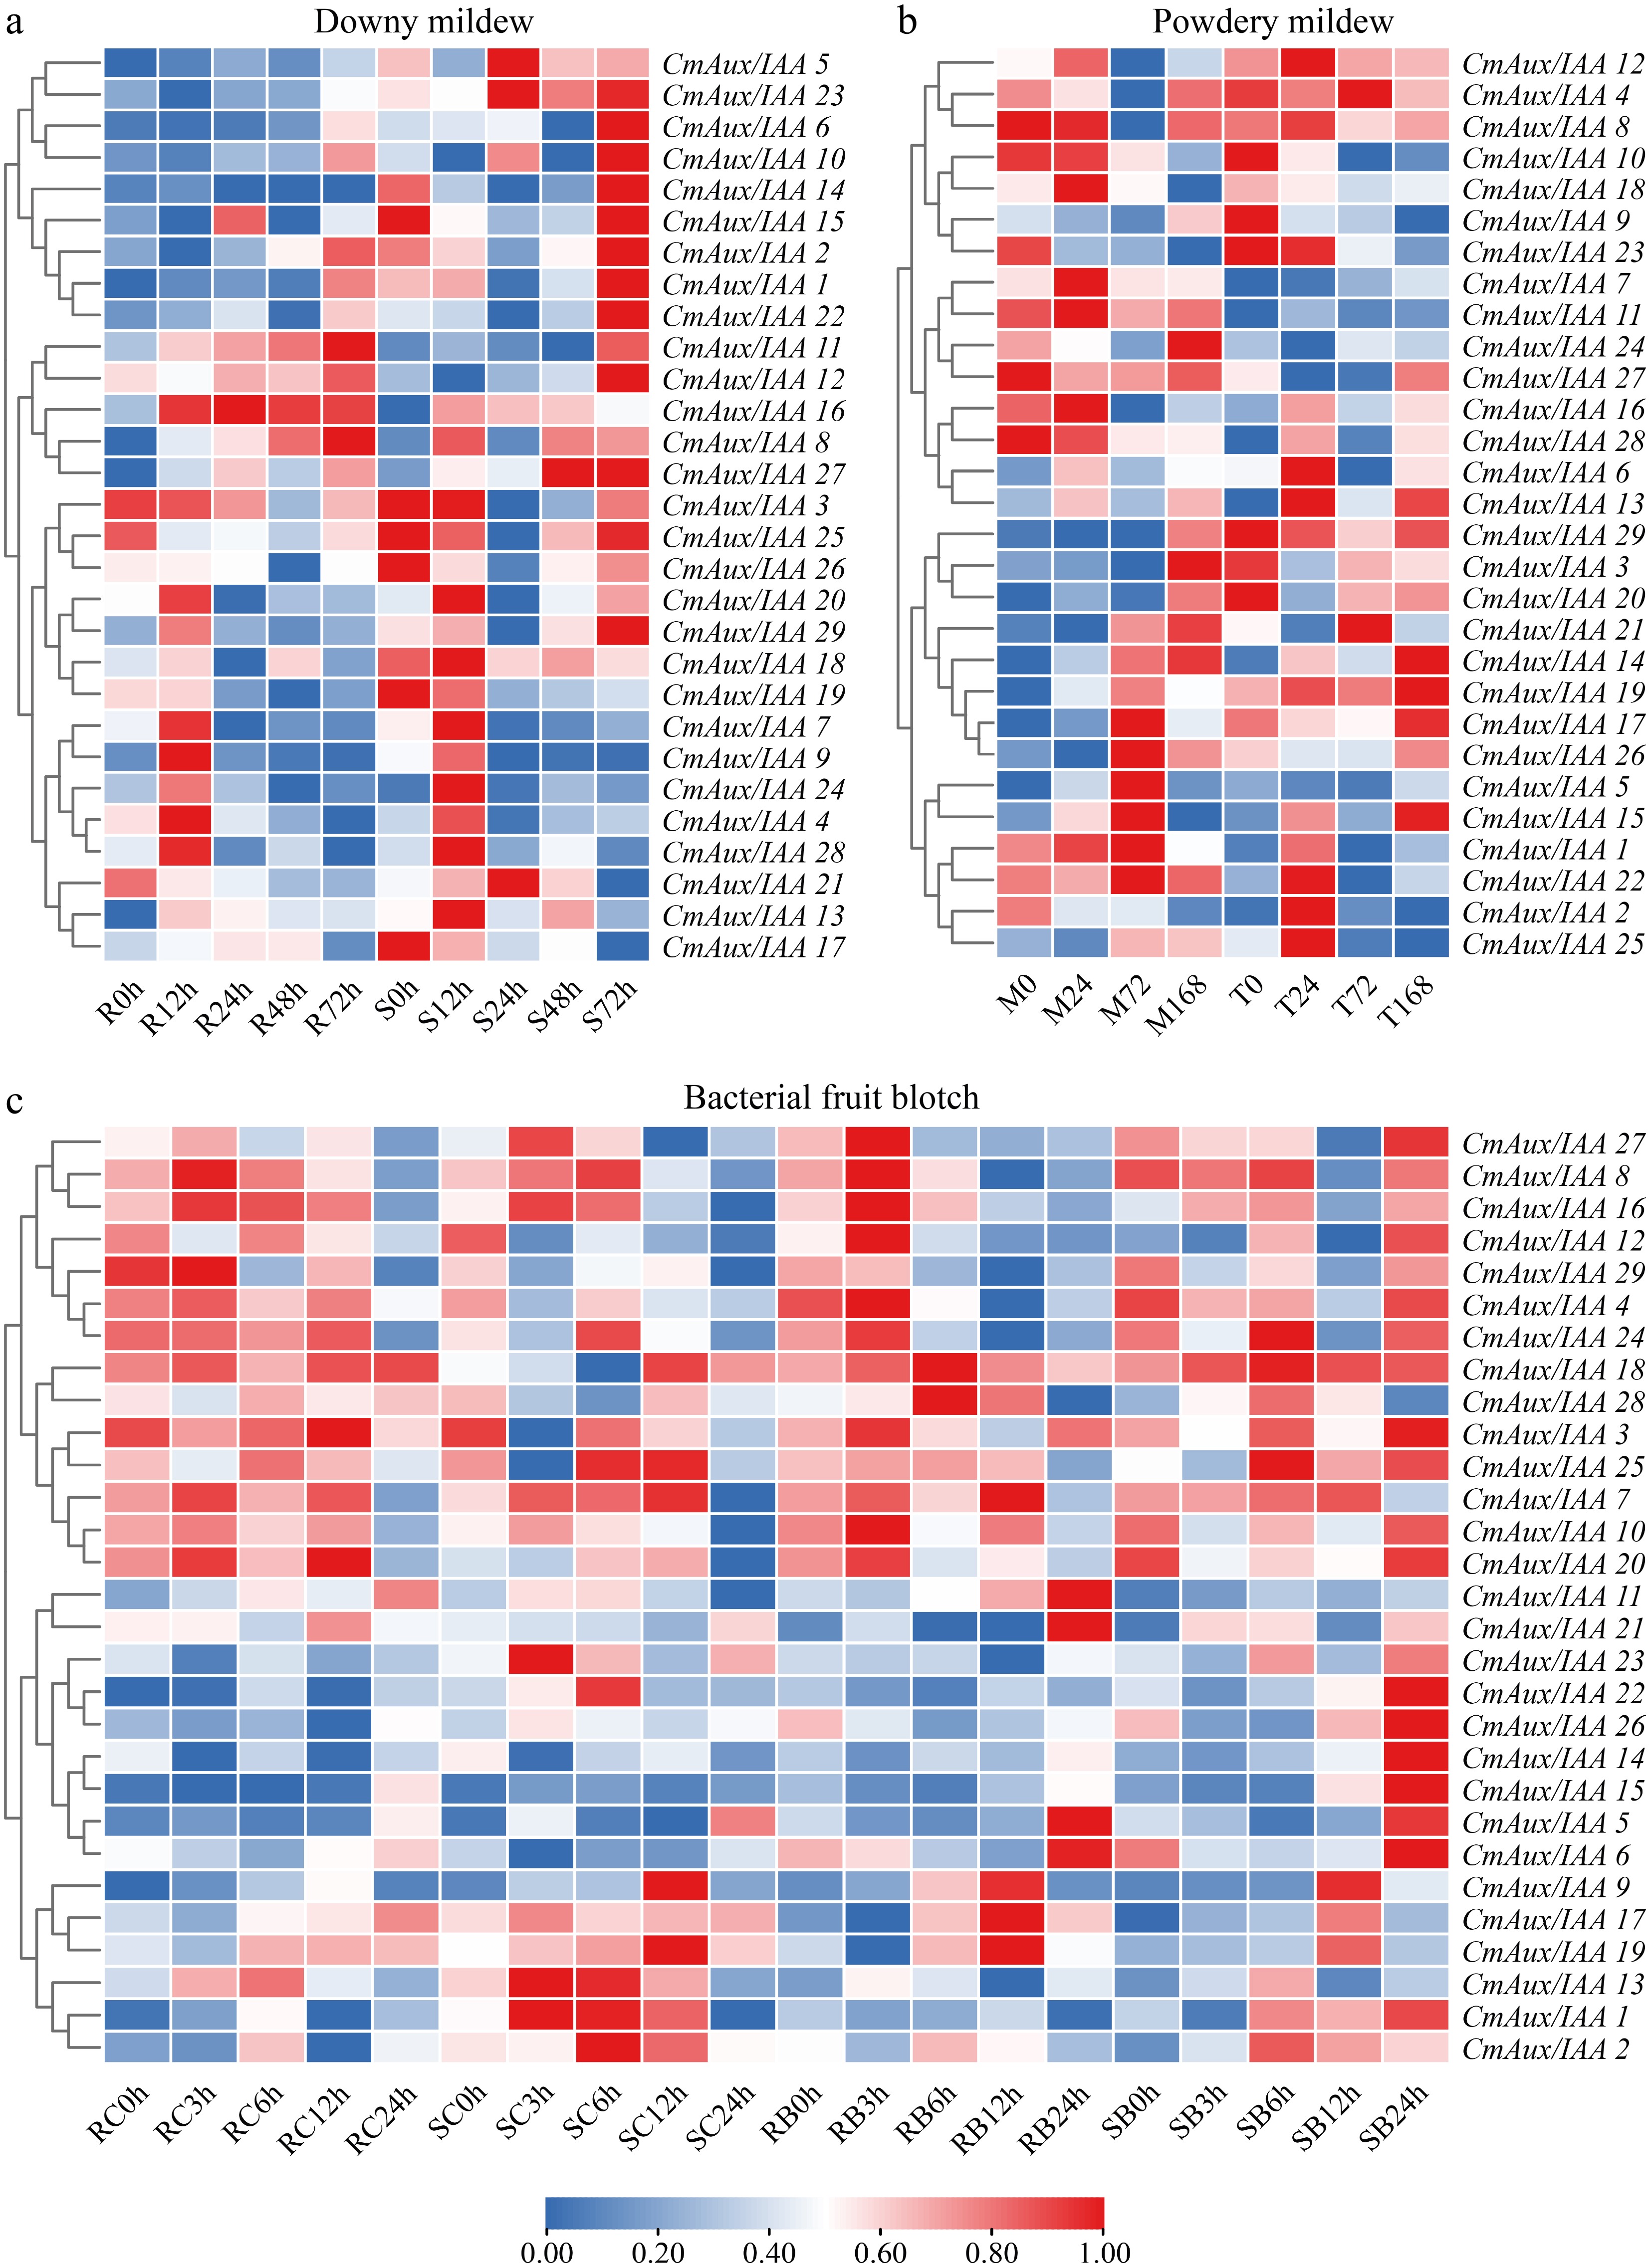
Figure 7.
Disease-responsive expression patterns of Aux/IAA genes in melon. (a) Expression profiles in downy mildew-resistant 'R' and -susceptible 'S' at 0, 12, 24, 48, and 72 h post-inoculation (hpi). (b) Expression dynamics in cultivars 'MR-1' (M) and 'Top Mark' (T) at 0, 24, 72, and 168 hpi with powdery mildew. (c) Expression profiles in bacterial fruit blotch-resistant 'R' and -susceptible 'S' at 0, 3, 6, 12, and 24 hpi. Data for (b) were obtained from public databases (BioProject: PRJNA358655 and PRJNA358674); data for (a) and (c) were generated in this study. Expression values for downy mildew and bacterial fruit blotch infections represent median values of three biological replicates. The heatmap was generated using TBtools based on log2-transformed fluorescence intensity values. The heatmap illustrates Z-score normalized expression values for each gene (rows) across different samples (columns). Hierarchical clustering was performed using Pearson correlation coefficients. A blue-to-red color gradient indicates expression levels from low (0.00) to high (1.00).
-
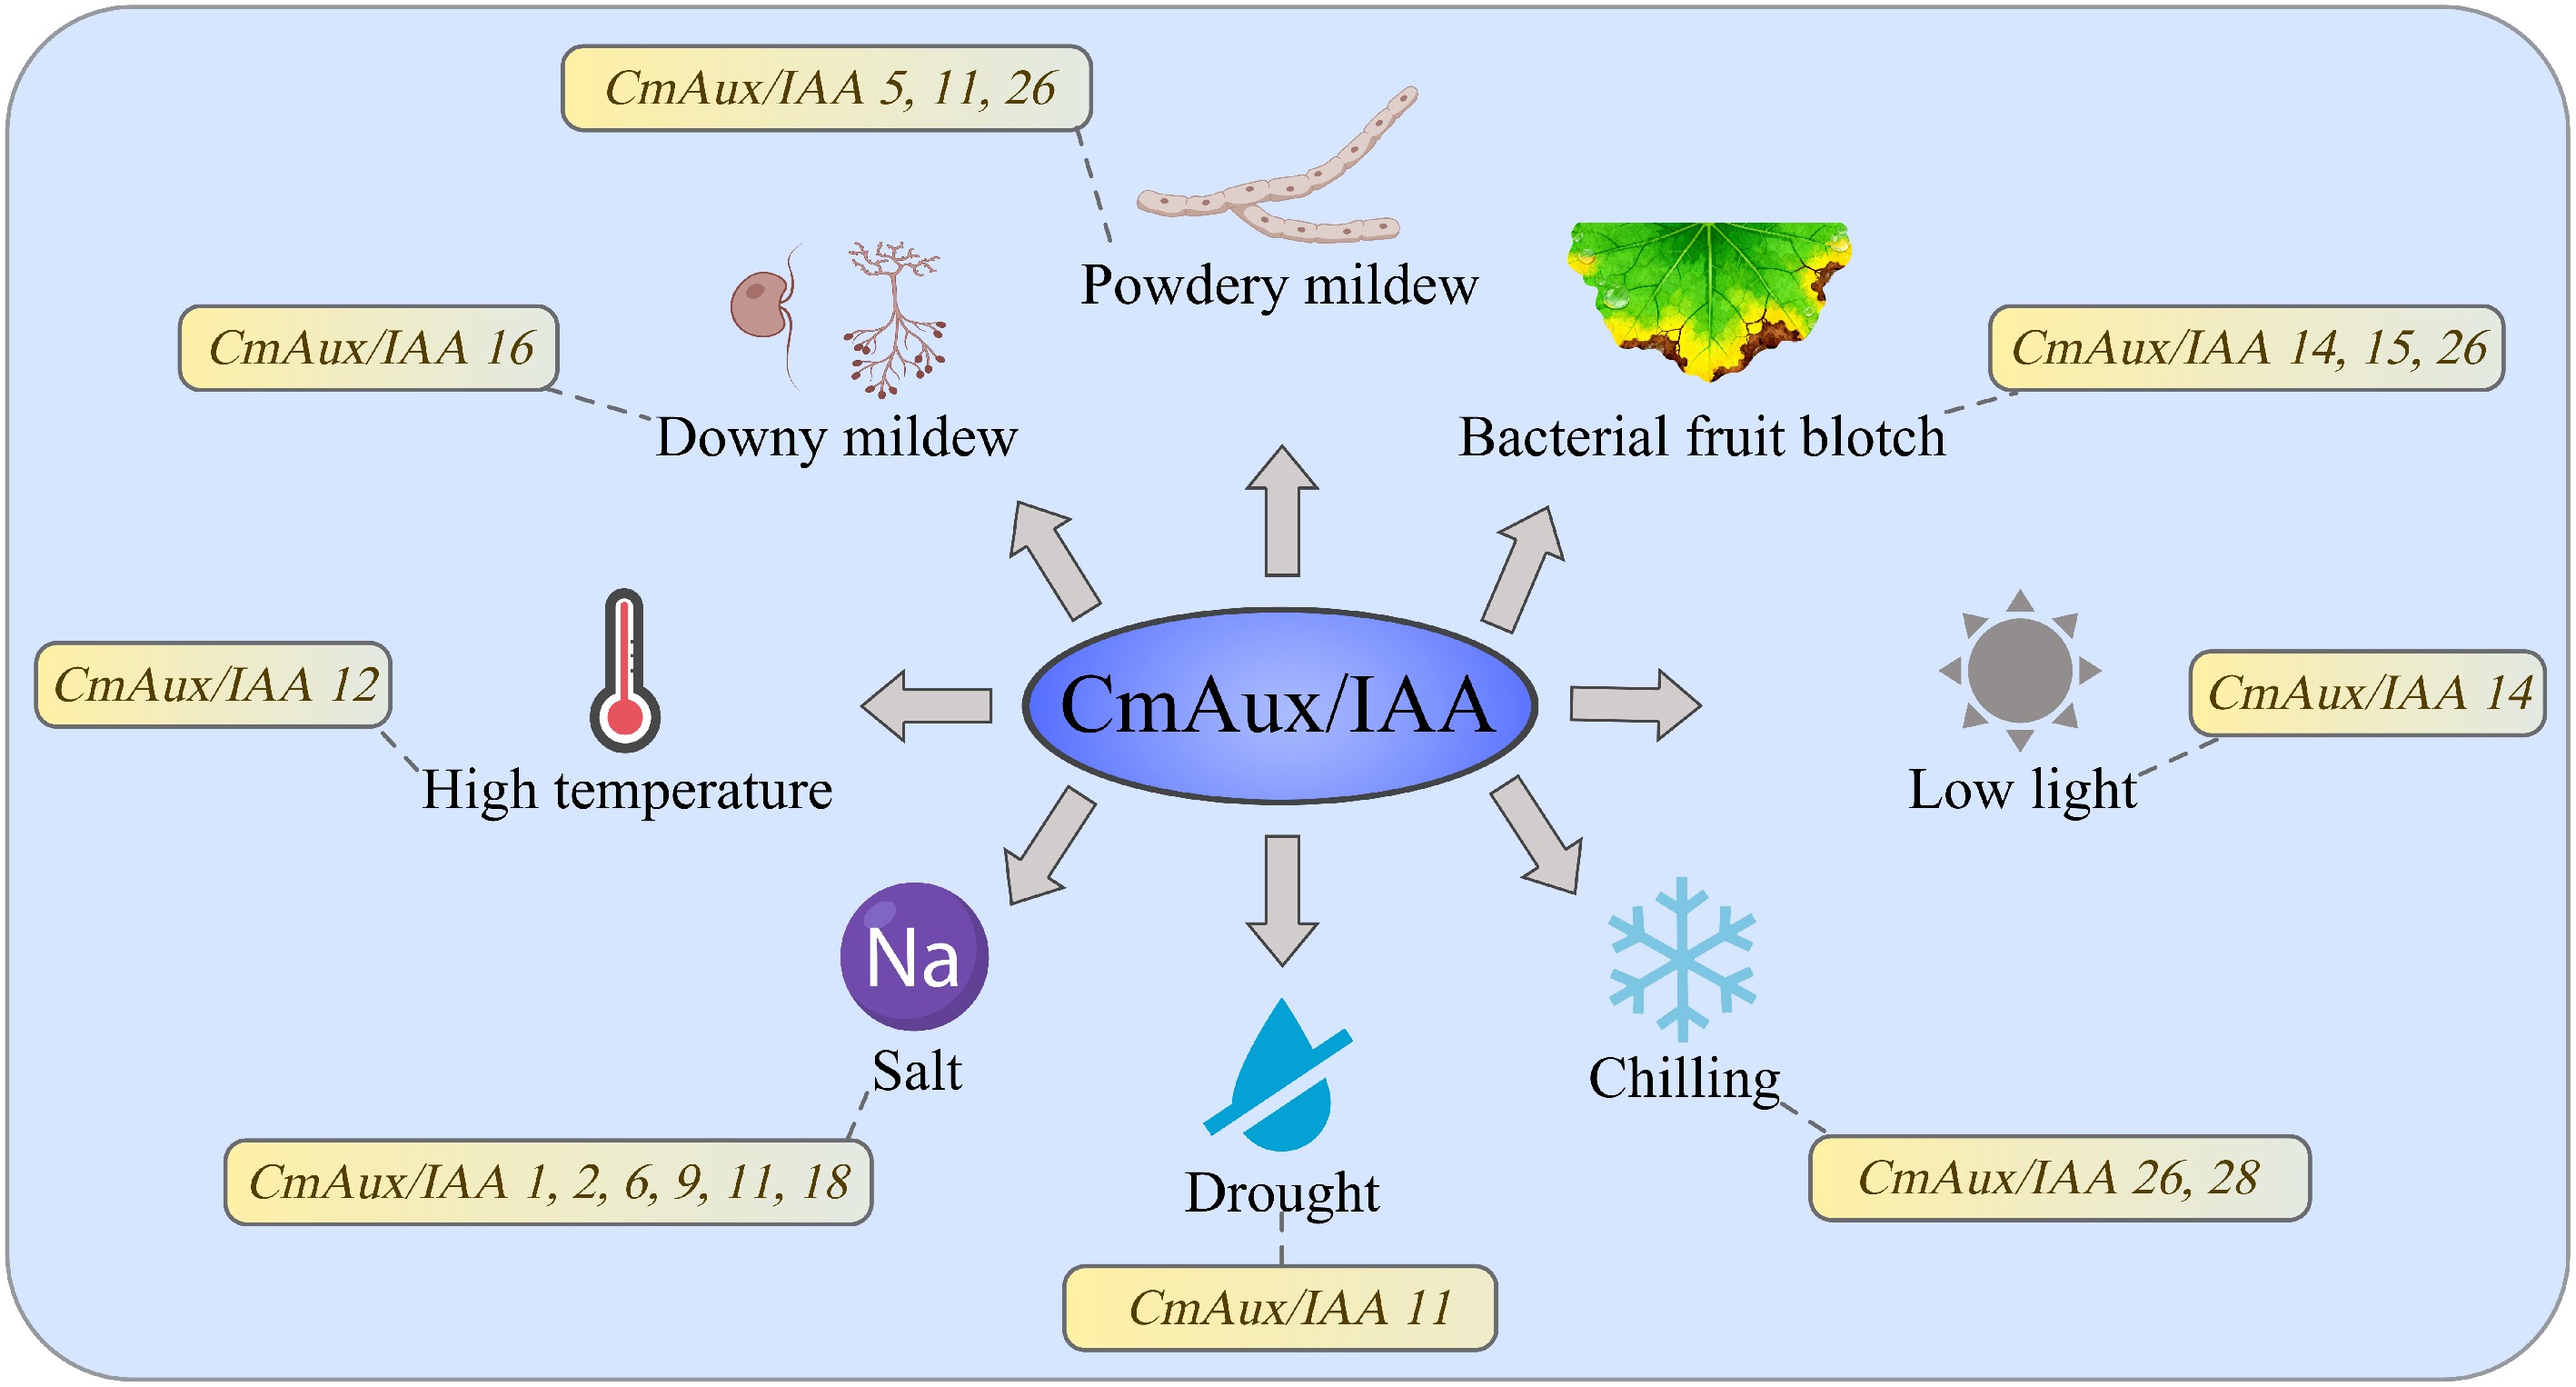
Figure 8.
Prediction and screening of key CmAux/IAA candidate genes responsive to biotic and abiotic stresses based on transcriptome data.
Figures
(8)
Tables
(0)