-
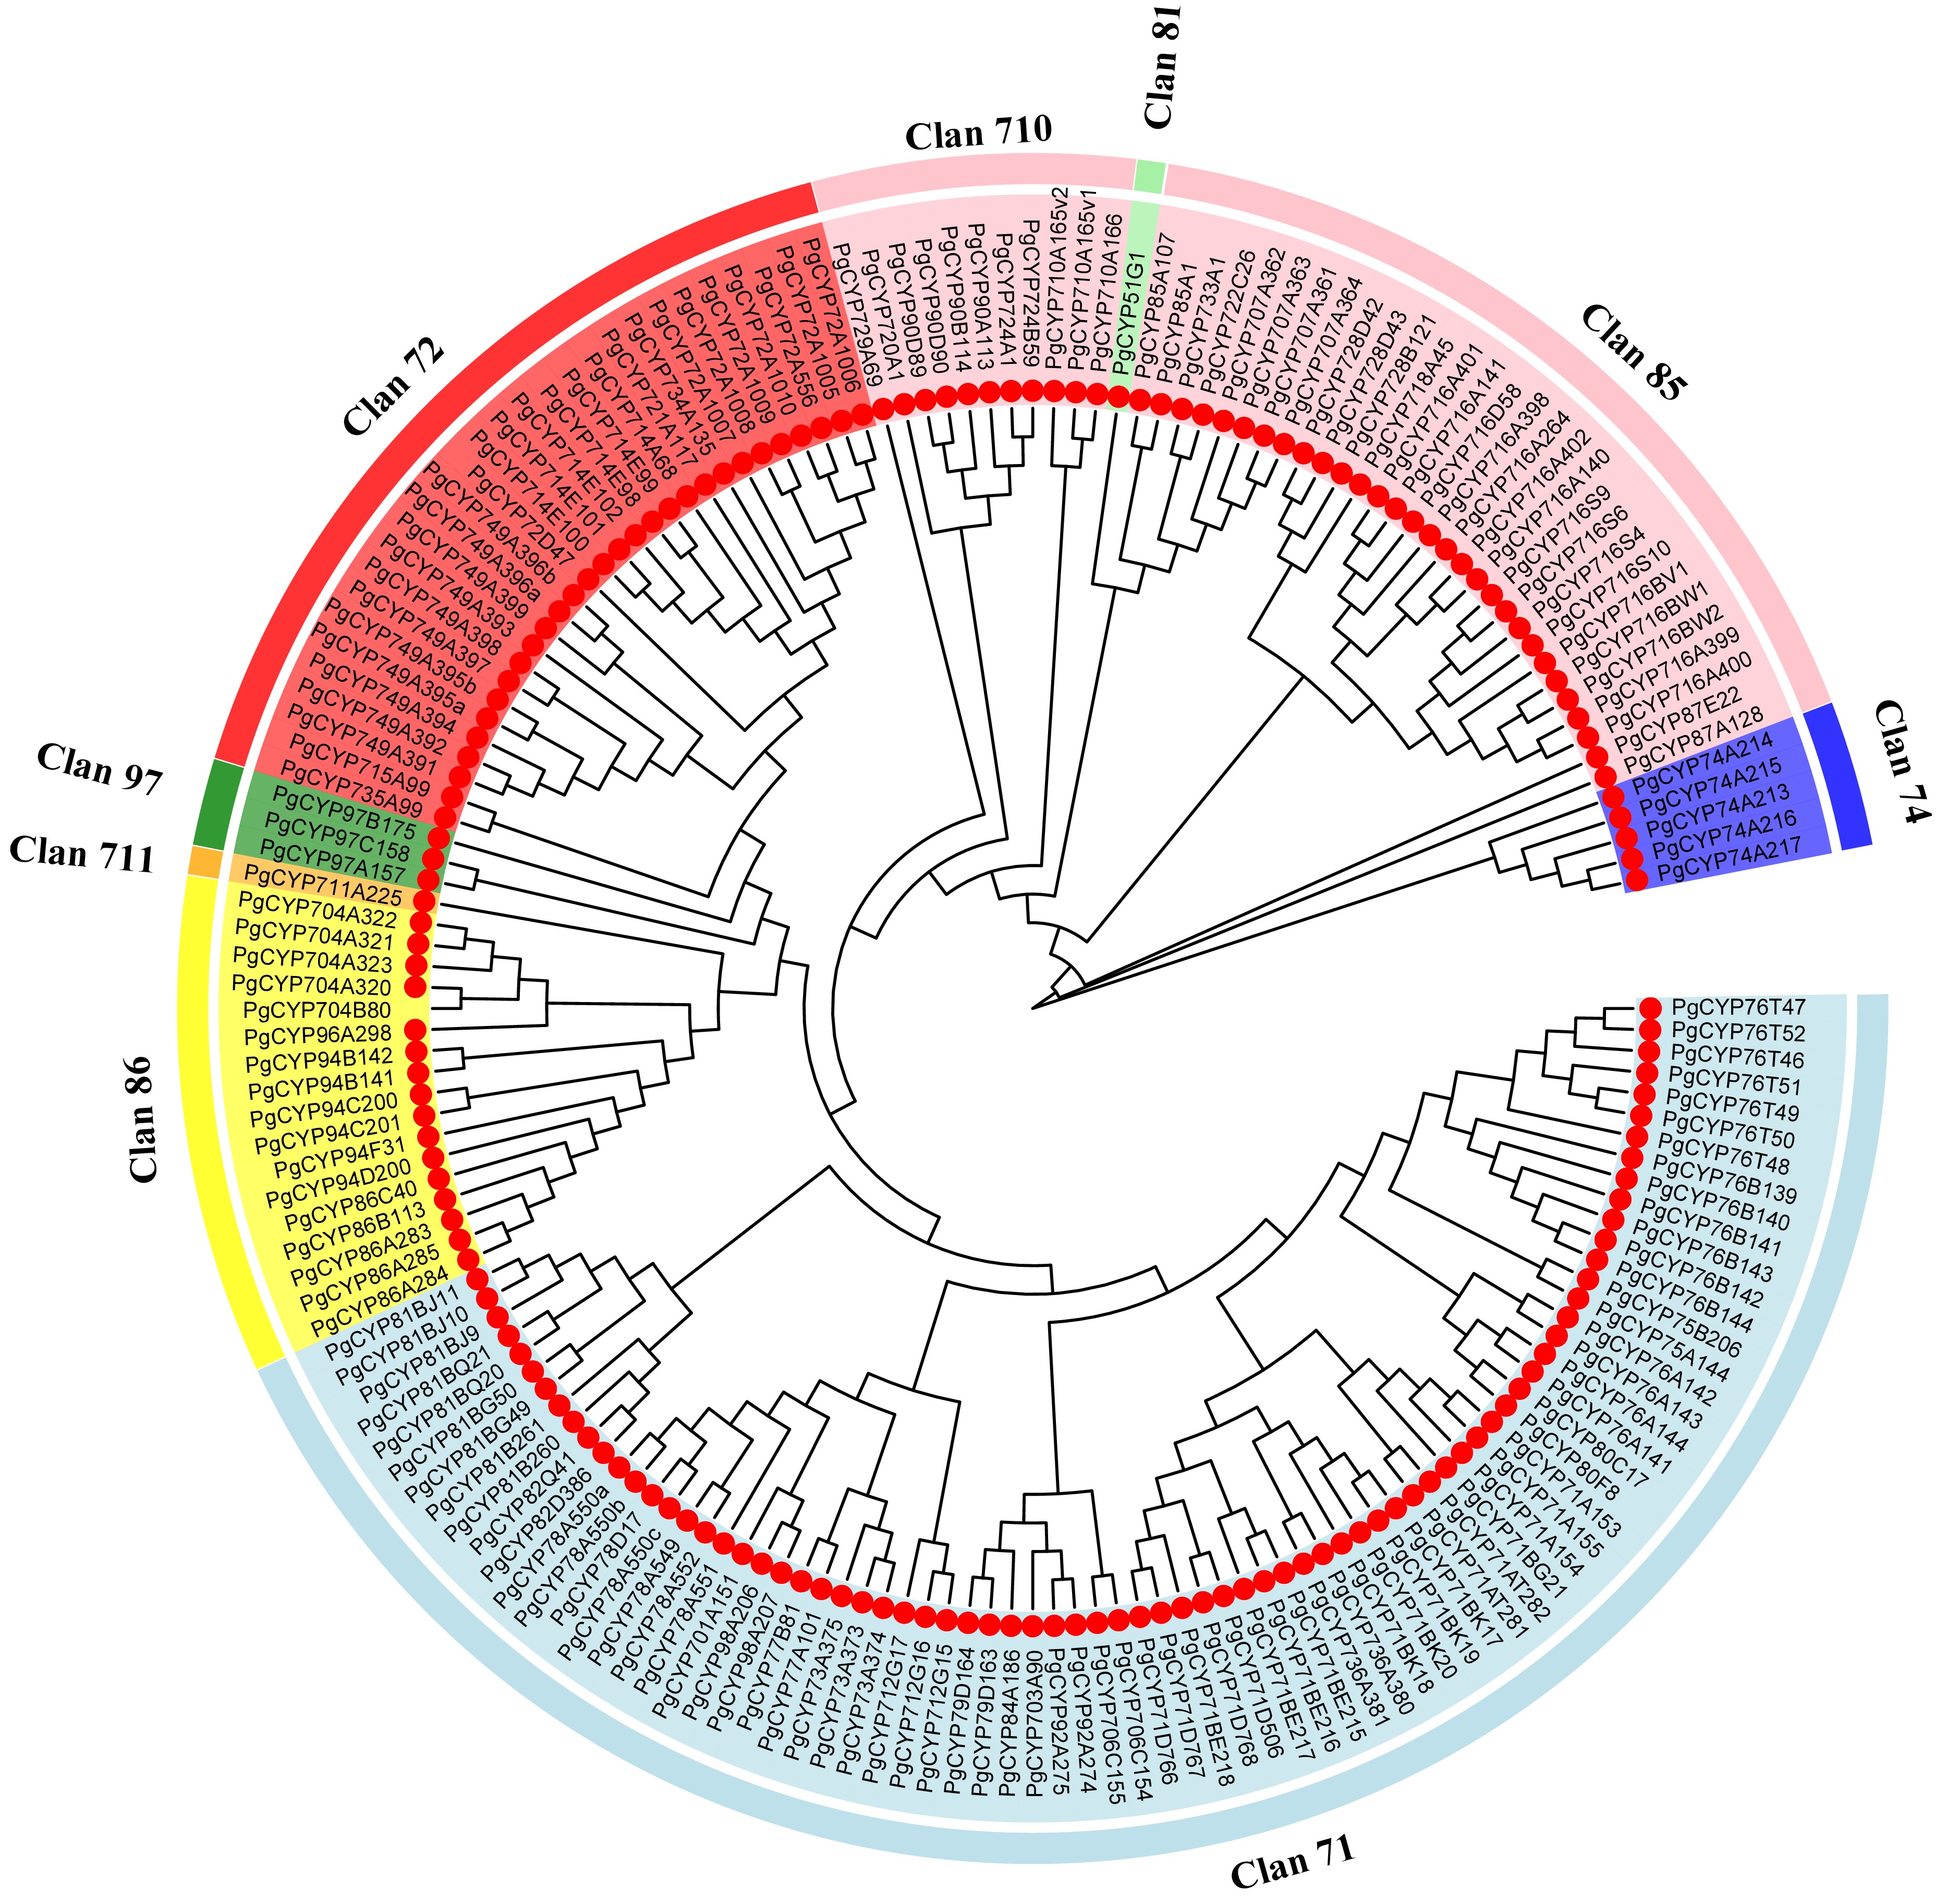
Figure 1.
Phylogenetic relationships of the Platycodon grandiflorus CYP450 proteins. A neighbor-joining phylogenetic tree was generated based on the alignment of full-length amino acid sequences of the 175 PgCYP450 proteins in P. grandiflorus.
-
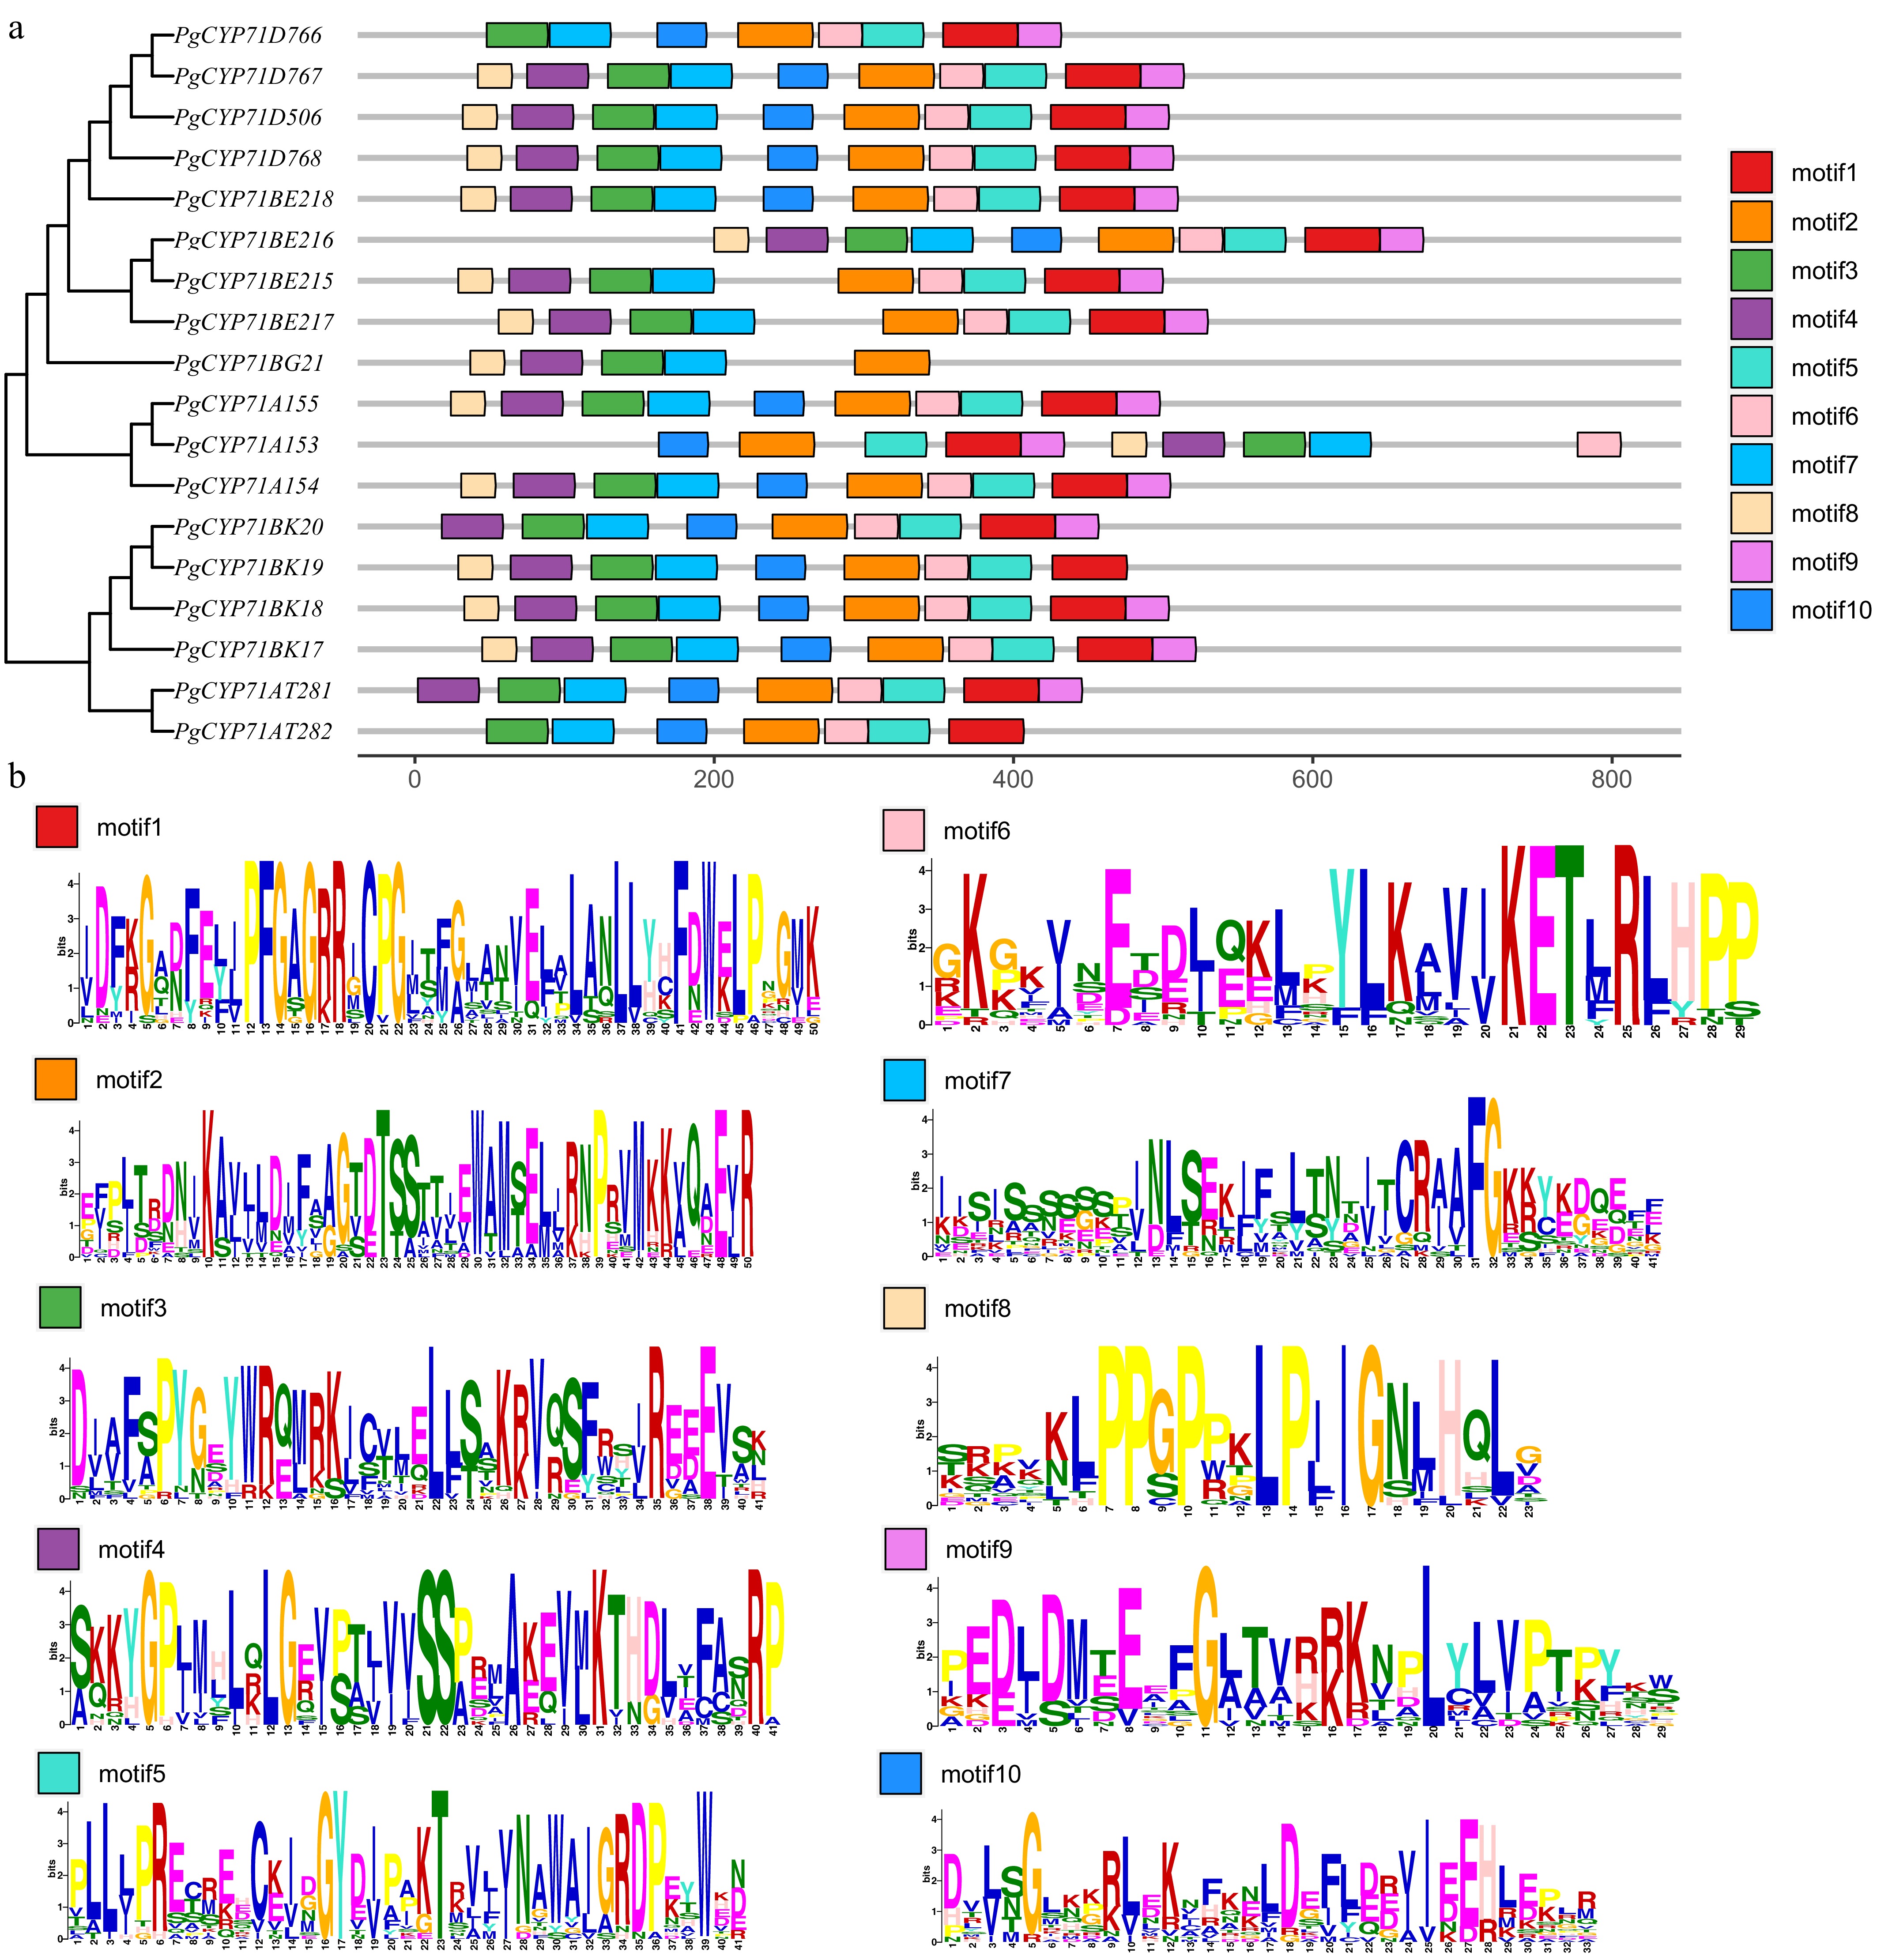
Figure 2.
Phylogenetic relationships and conserved motifs of P. grandiflorus PgCYP71 proteins. 18 PgCYP71s in P. grandiflorus have their full-length amino acid sequences aligned to generate a neighbor-joining phylogenetic tree. (a) Phylogenetic tree and onserved motifs distribution of PgCYP71 proteins. (b) Composition of the conserved motifs in PgCYP71 proteins.
-
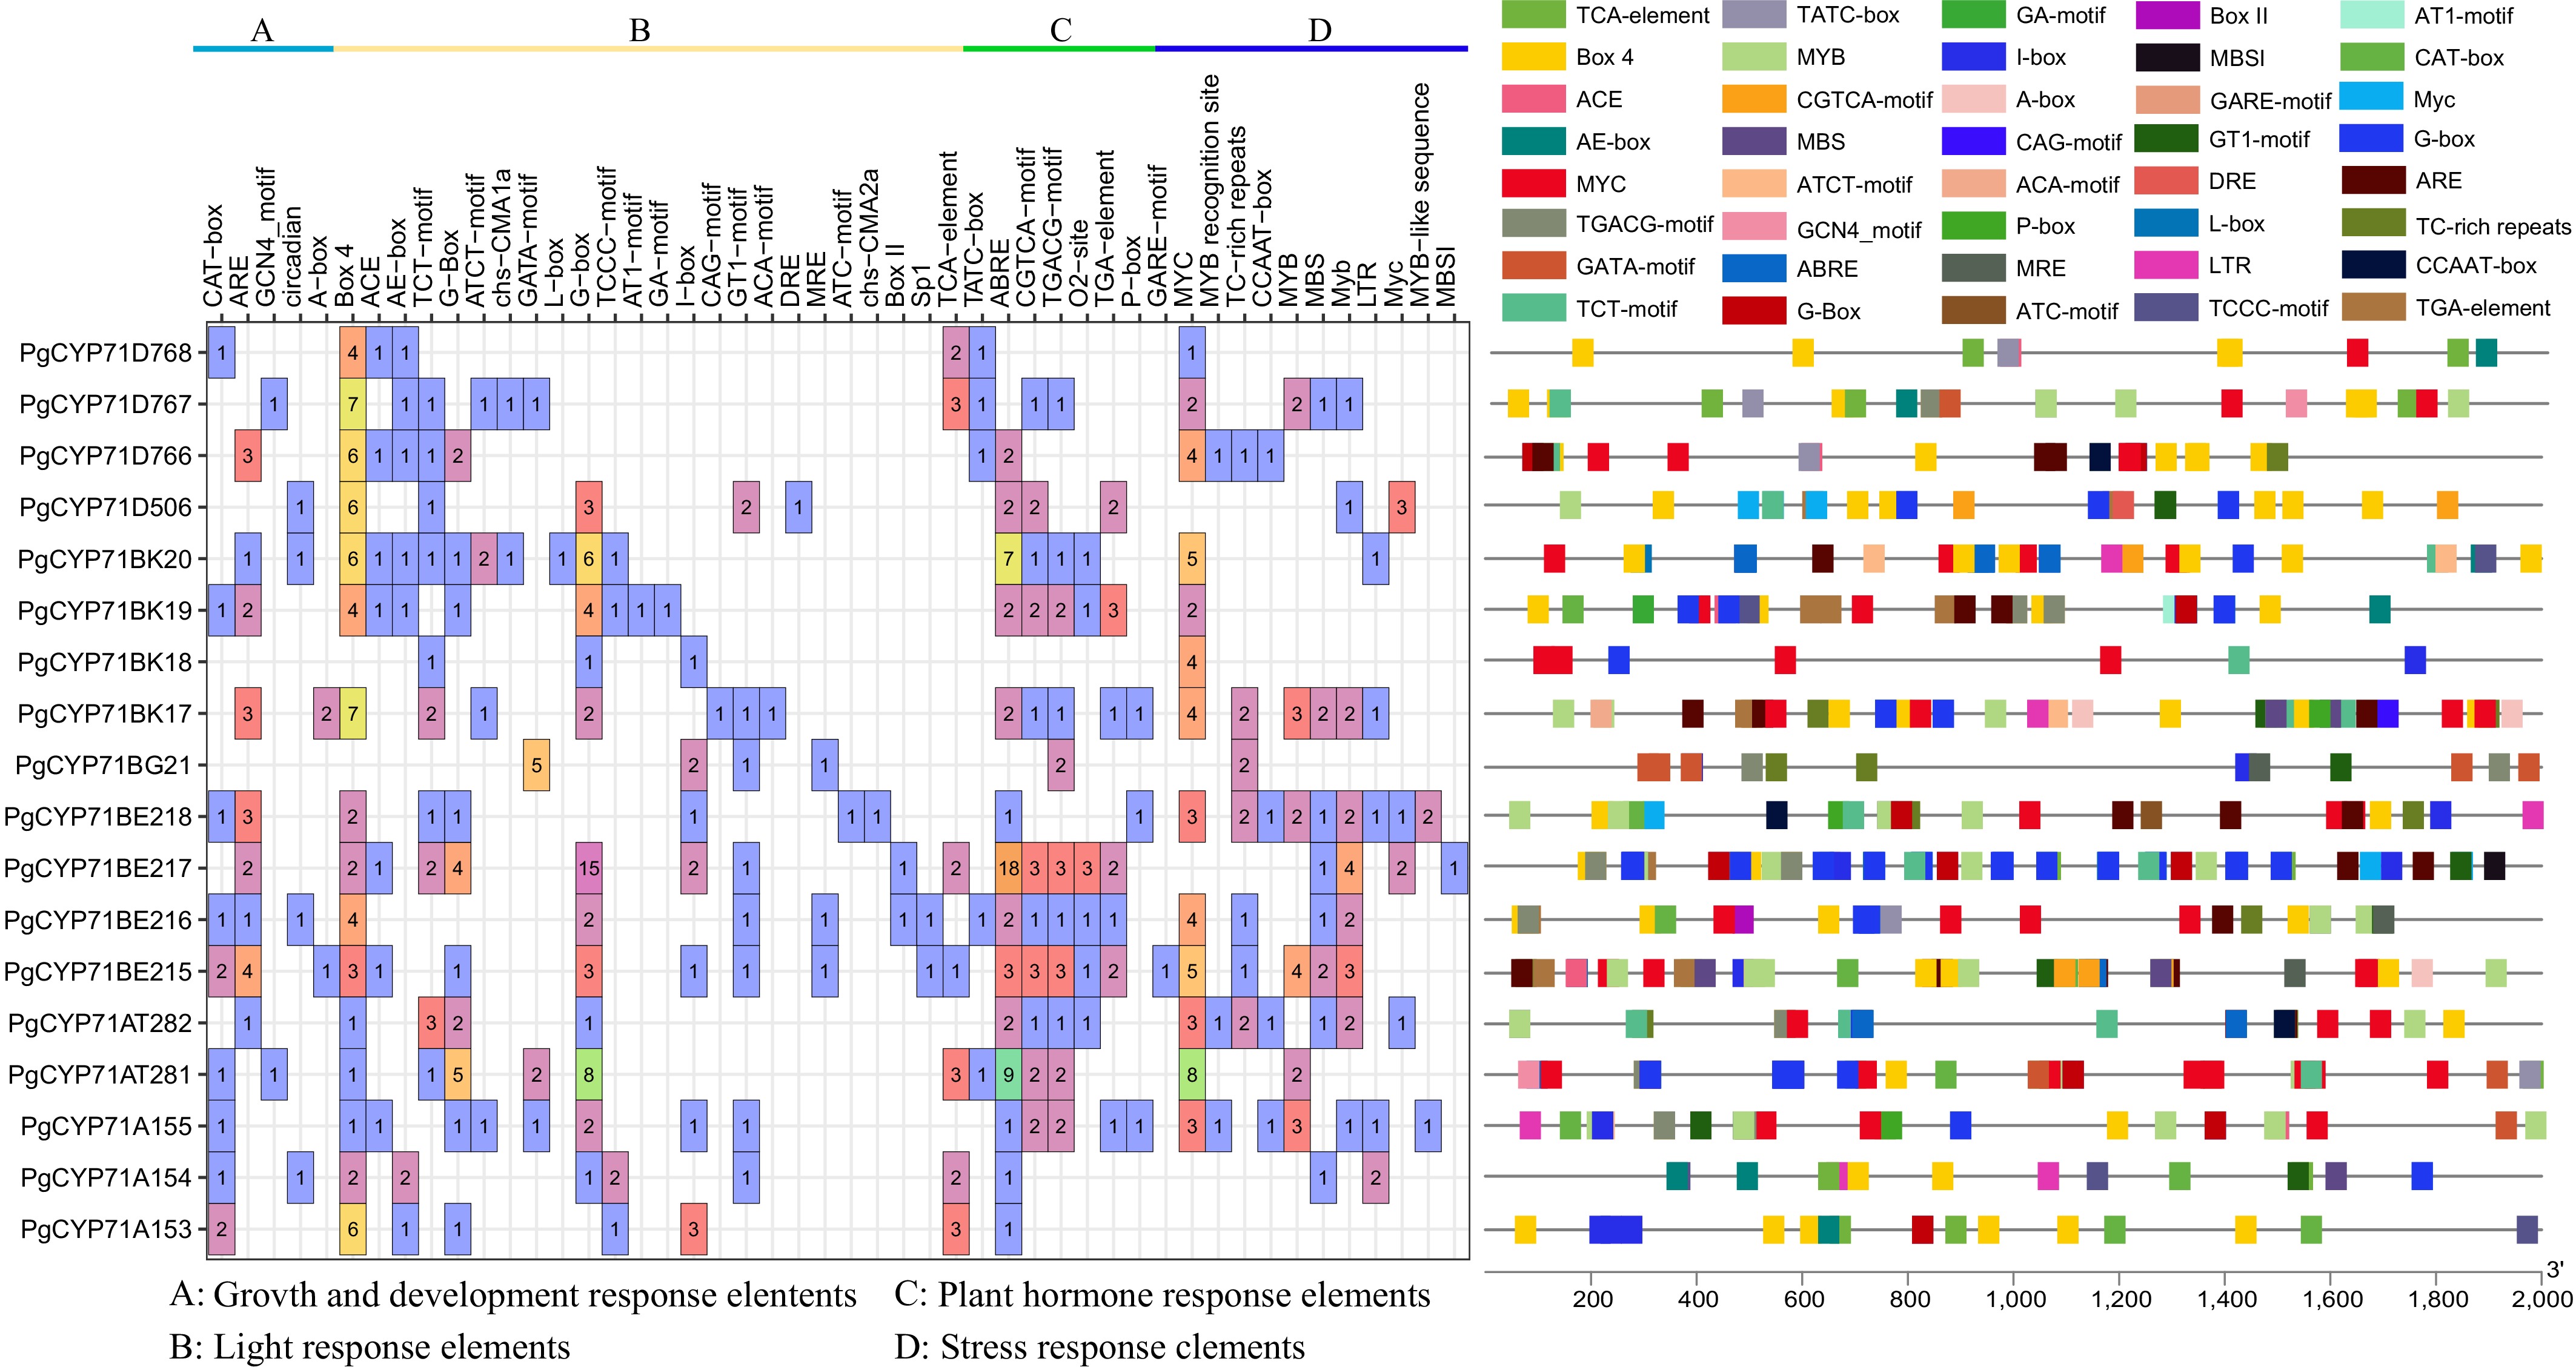
Figure 3.
Cis-acting elements in the promoter regions of PgCYP71 genes. Left - Distribution and functional classification of cis-acting elements identified in each PgCYP71 gene. Right - Visualization of major cis-acting elements, with each category represented by a distinct color.
-
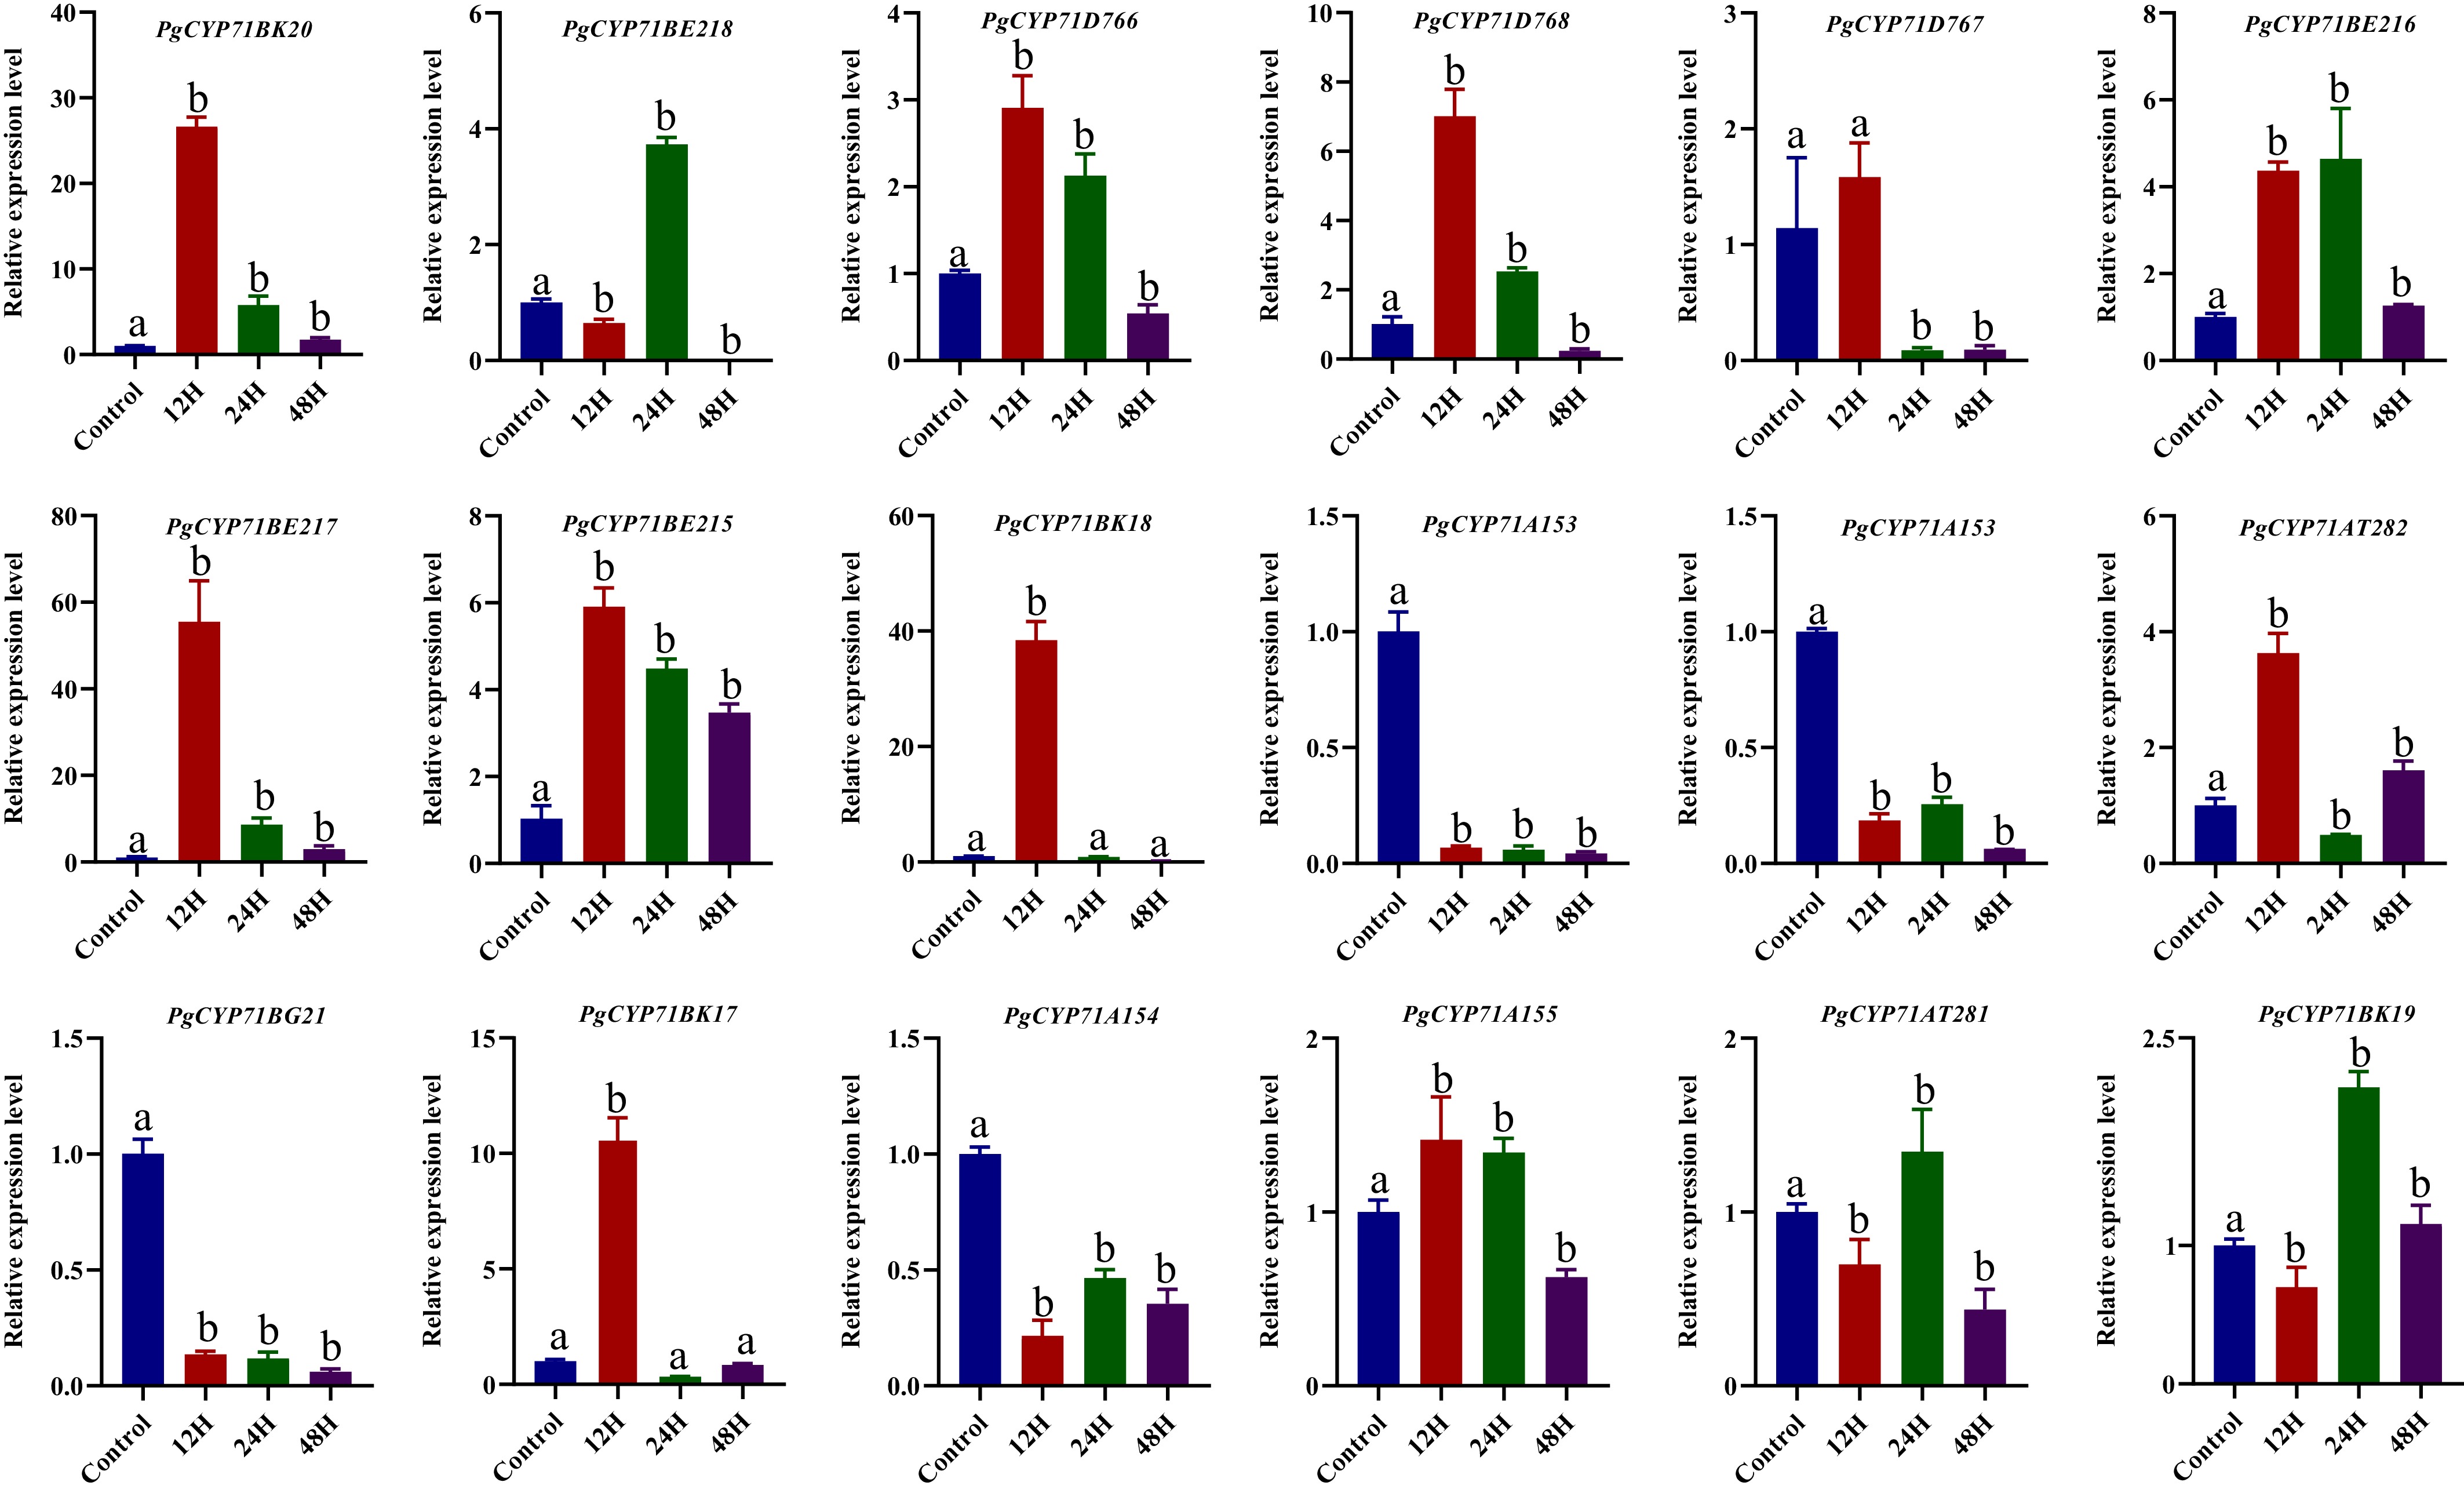
Figure 4.
The qRT-PCR has shown the expression pattern of the PgCYP71 gene family at 0 (control), 12, 24, and 48 h after 100 μmol MeJA treatment. Different letters indicate significant differences (p < 0.05).
-
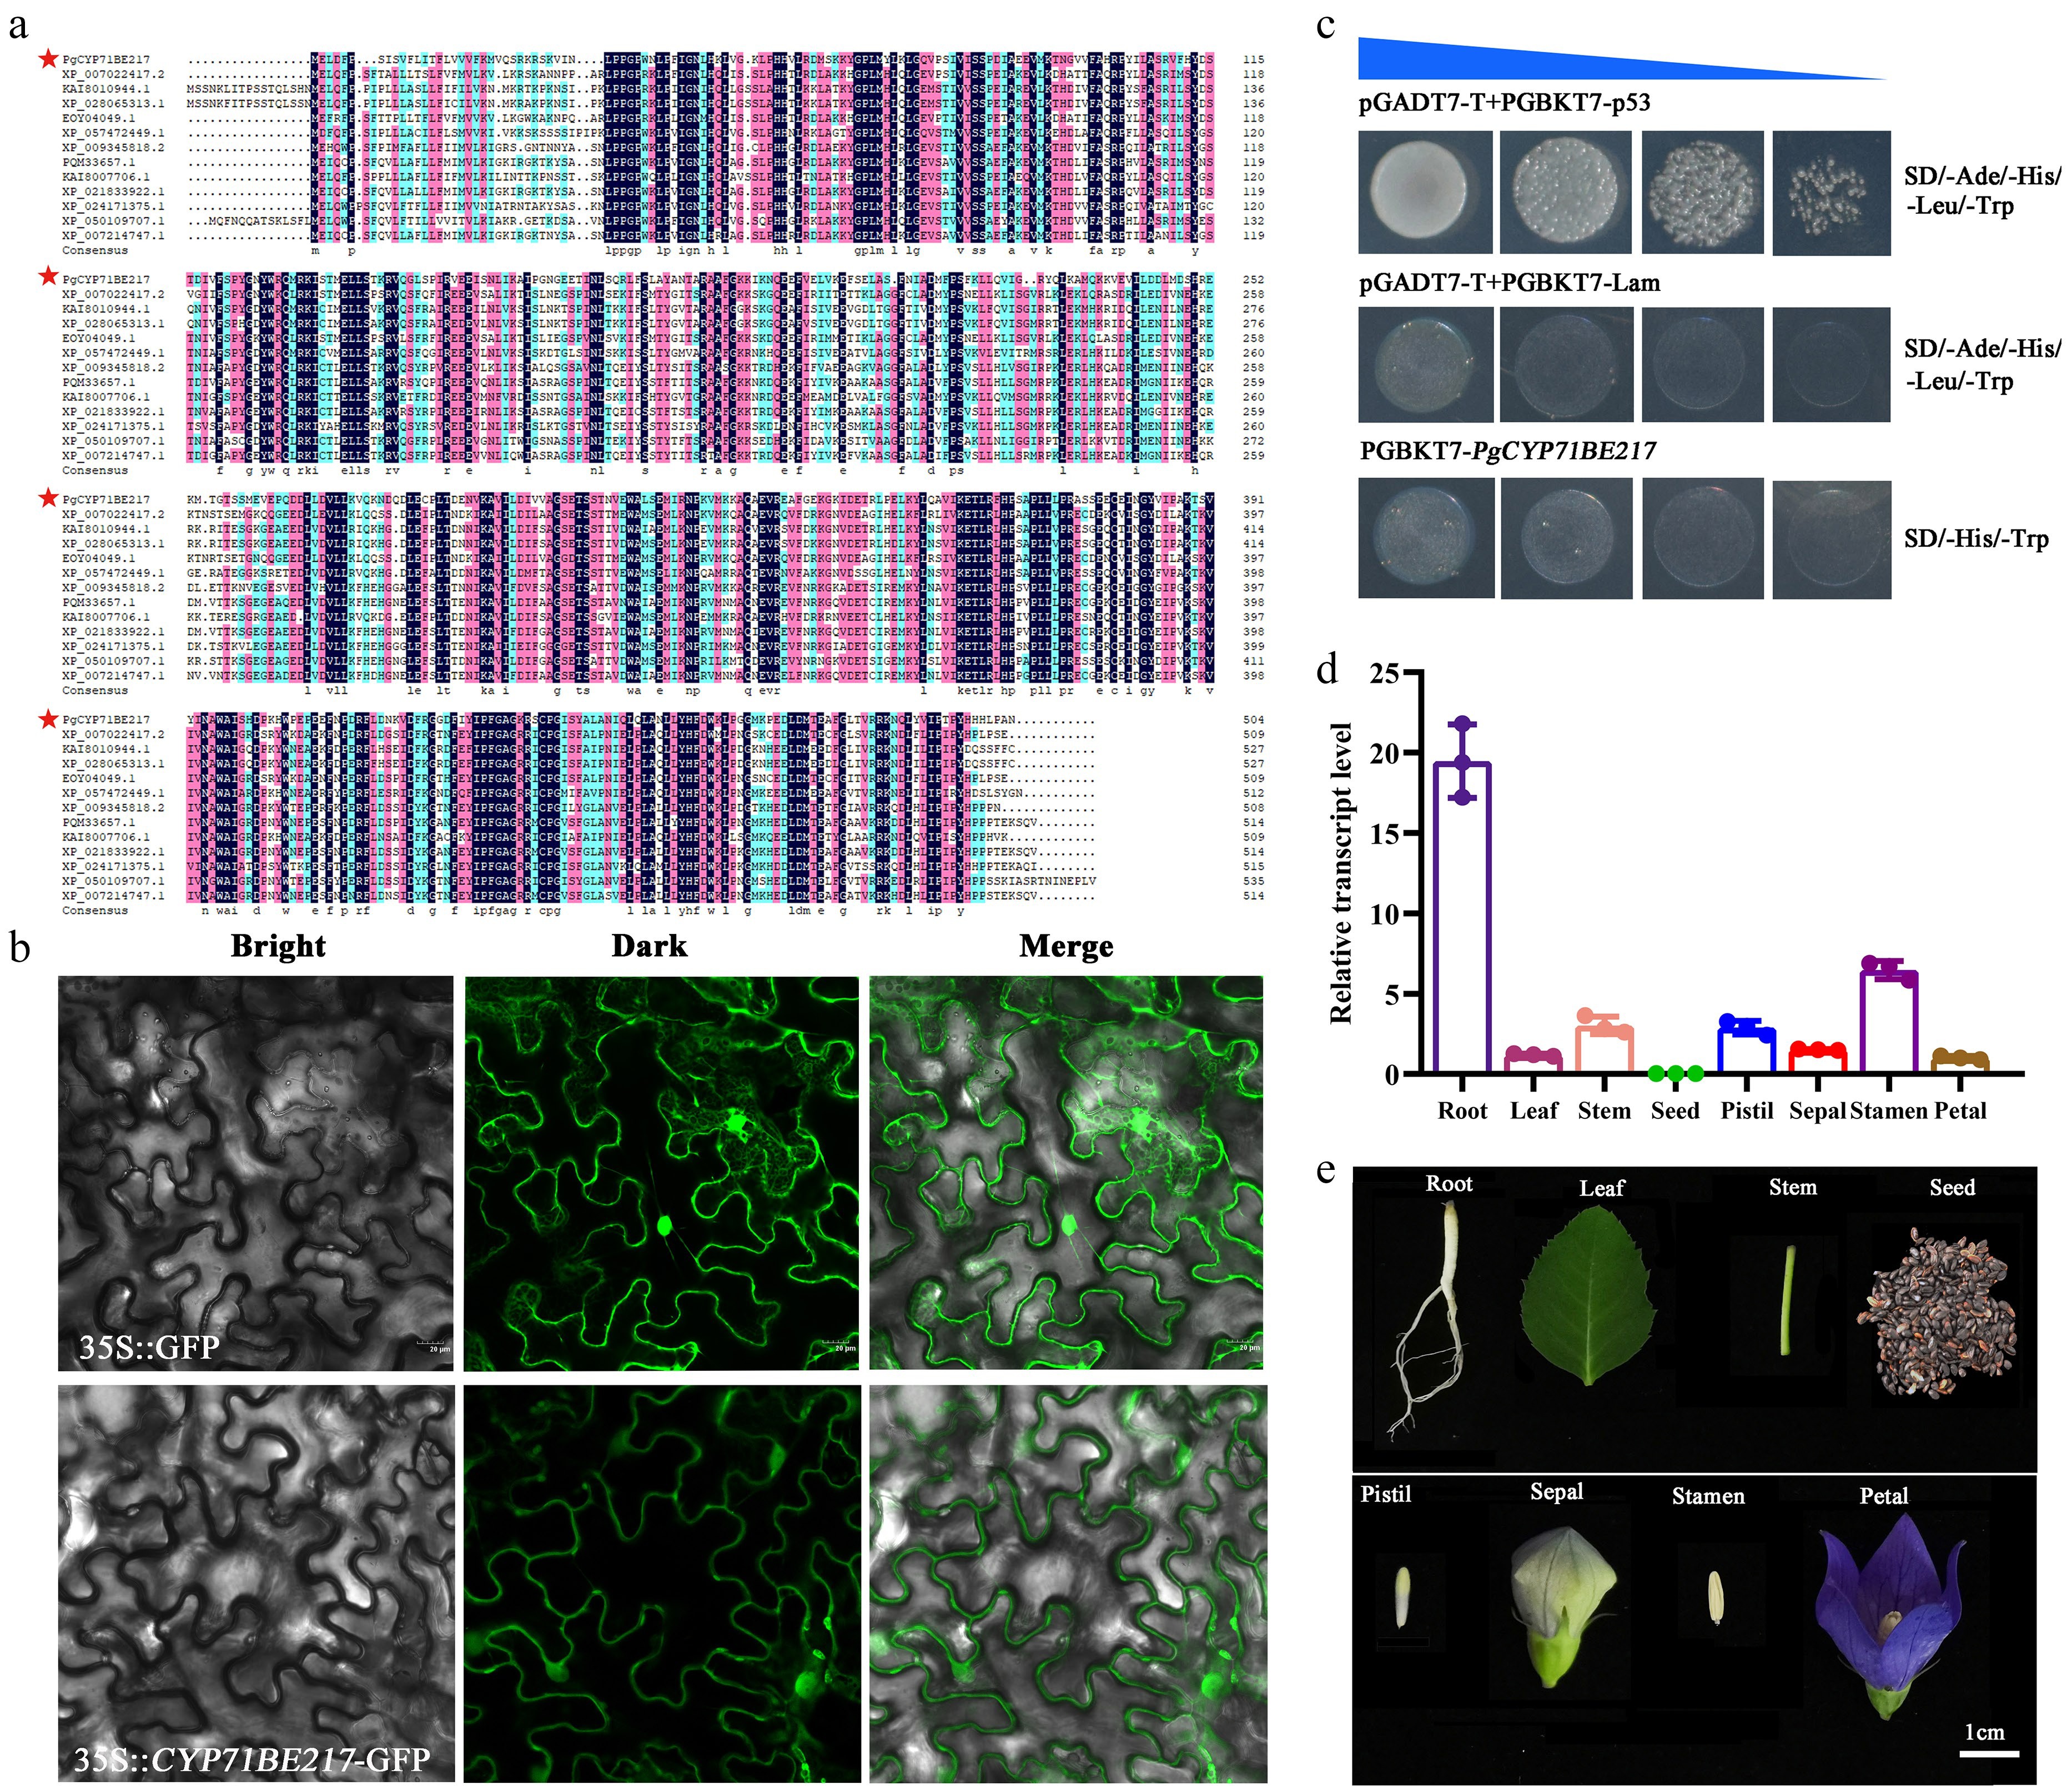
Figure 5.
PgCYP71BE217 expression patterns in P. grandiflorus. (a) PgCYP71BE217 multiple sequence alignment. (b) Subcellular localization of PgCYP71BE217. PgCYP71BE217 was primarily seen at the plasma membrane and in the cytoplasm; (Top) subcellular localization of the empty pCAMBIA1300-GFP vector used as the positive control; (Bottom) Bright field, dark field, and merged field are represented by the left, center, and right panels, respectively. (c) Evaluation of self-activation of PgCYP71BE217. (d) The expression level of PgCYP71BE217 in eight different tissues as revealed by qRT-PCR. (e) The eight different tissues of P. grandiflorus subjected to qRT-PCR of (d).
-
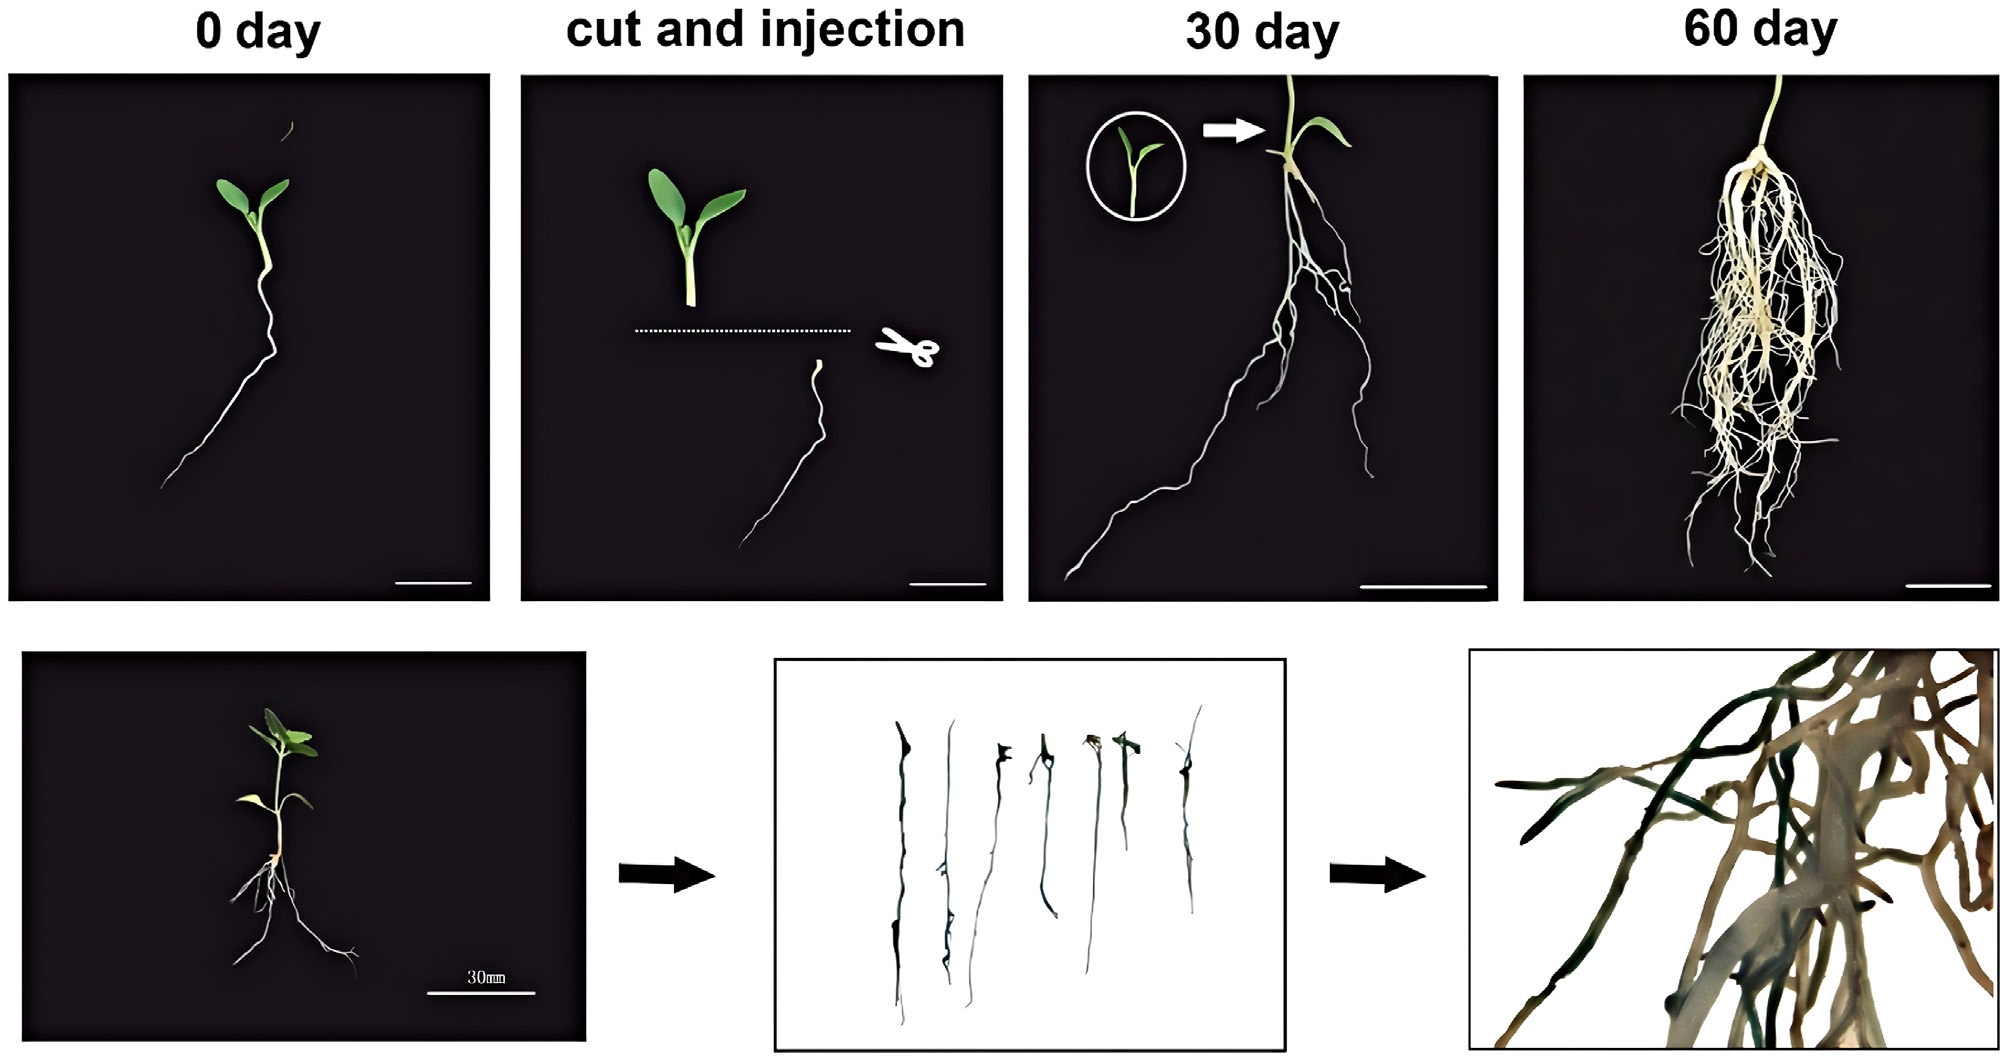
Figure 6.
Establishment of hairy root transformation system and GUS validation. Top - Schematic diagram illustrating the procedure for hairy root transformation. Bottom - GUS assay results confirming transgenic hairy roots.
-
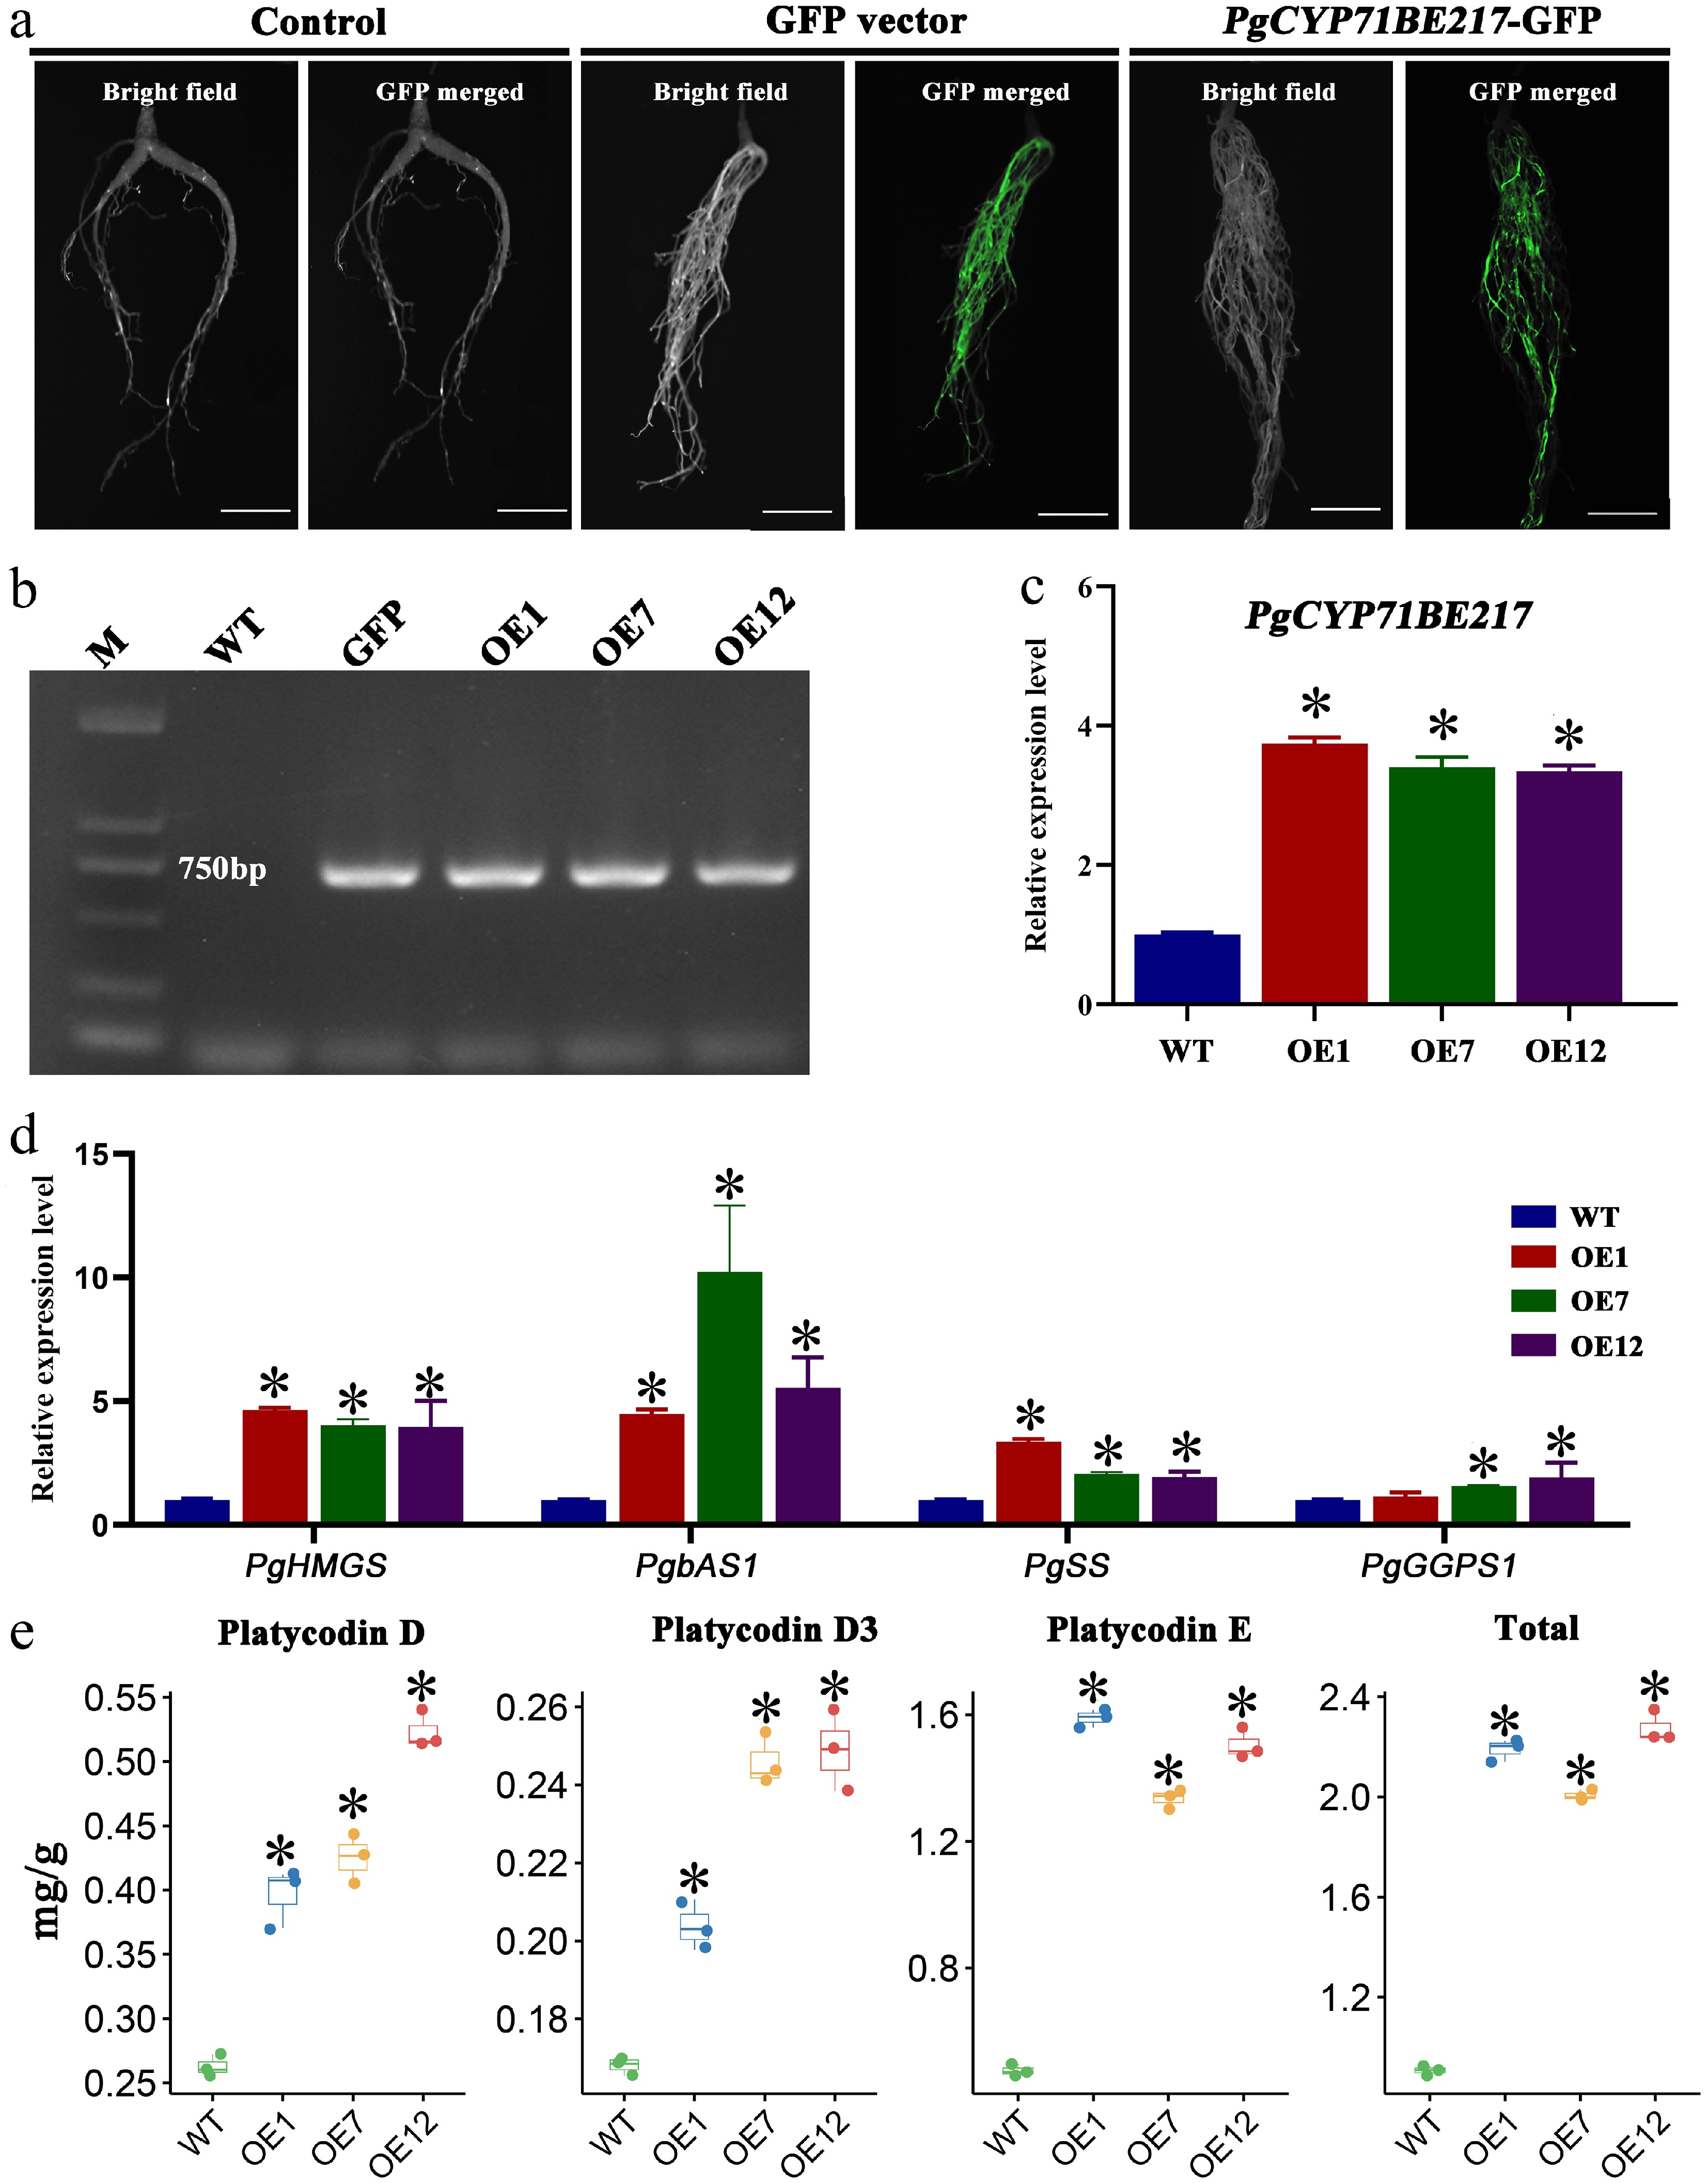
Figure 7.
Functional verification of PgCYP71BE217. (a) Phenotypic characterization of PgCYP71BE217-OE transgenic hairy roots using GFP detection. (b) DNA verification of PgCYP71BE217-OE vector. (c) qRT-PCR analysis of PgCYP71BE217 expression in transgenic and wild-type hairy roots. (d) The expression levels of PgHMGS, PgbAS1, and PgSS were significantly increased in the transgenic hairy roots of plants with PgCYP71BE217 overexpression. (e) Changes in saponin content after PgCYP71BE217 overexpression. The asterisk denotes a statistically significant difference compared to the WT (p < 0.05).
Figures
(7)
Tables
(0)