-
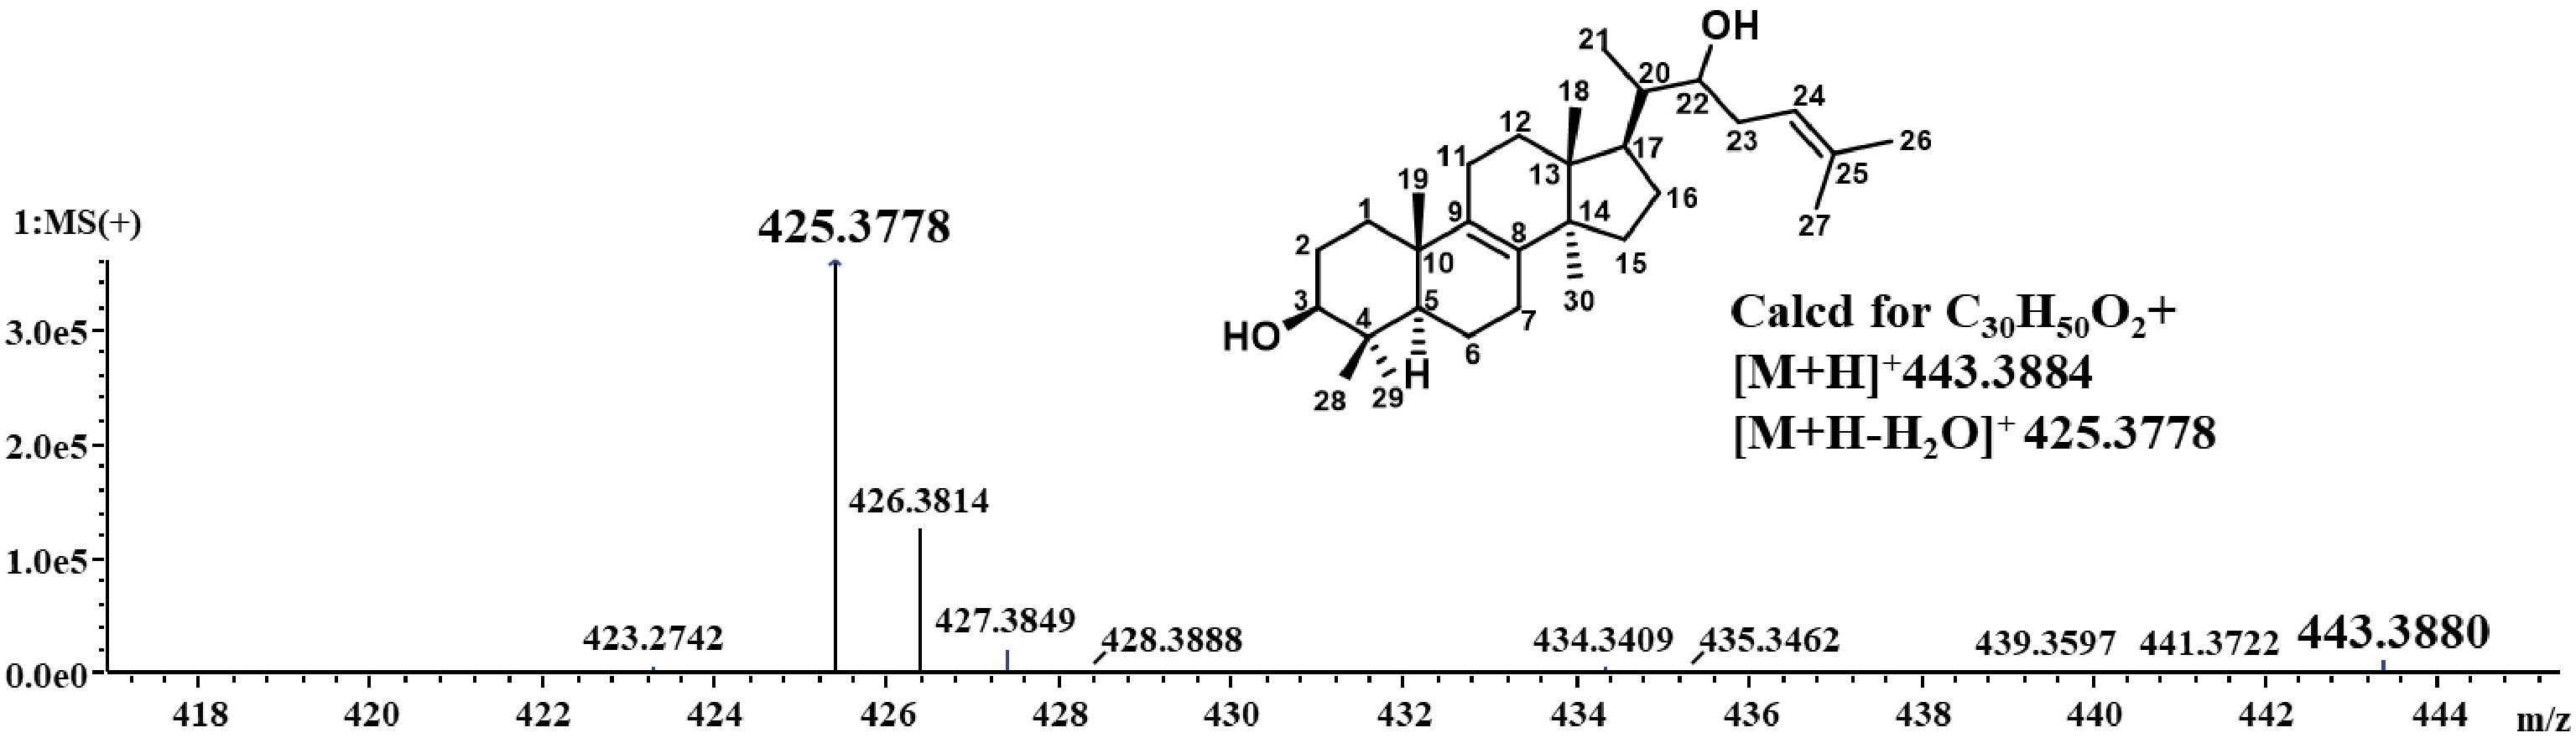
Figure 1.
Detection of inotodiol by LC-MS.
-
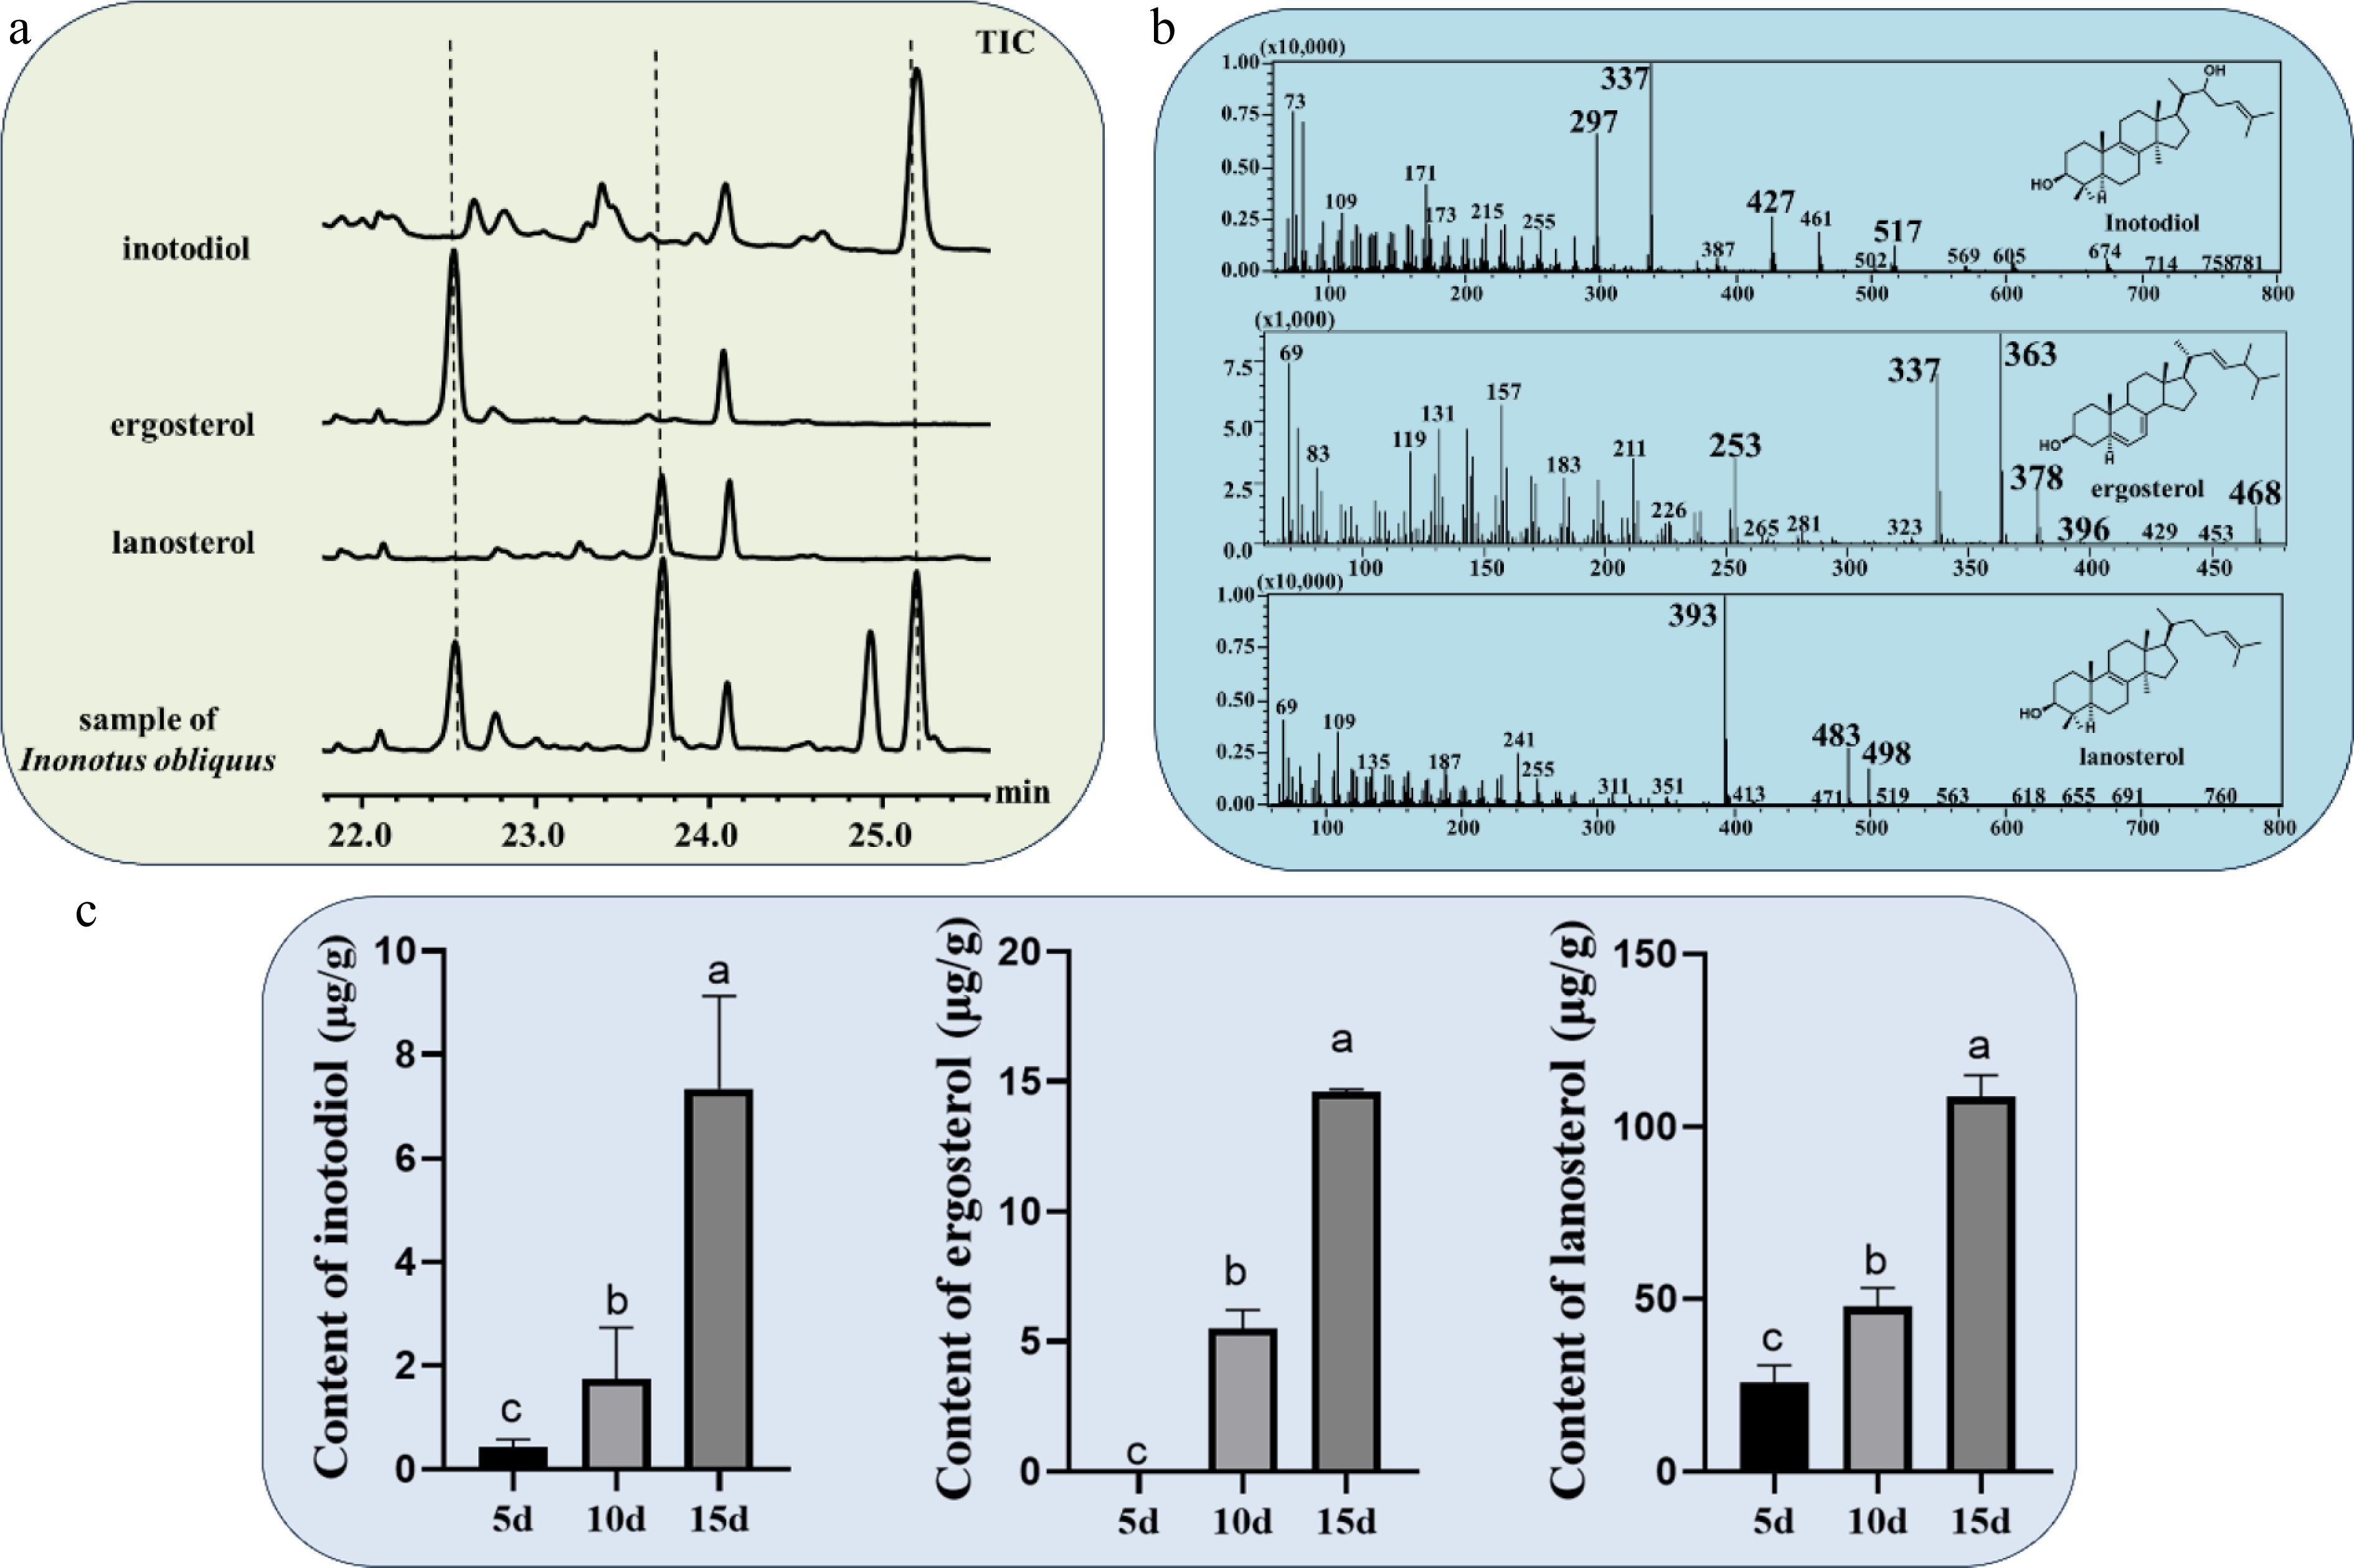
Figure 2.
(a) GC-MS chromatograms analysis sample of I. obliquus in rice culture medium and three triterpene skeleton standards. (b) Mass spectra of inotodiol, ergosterol, and lanosterol. (c) Content of different triterpenoids in I. obliquus under different times.
-
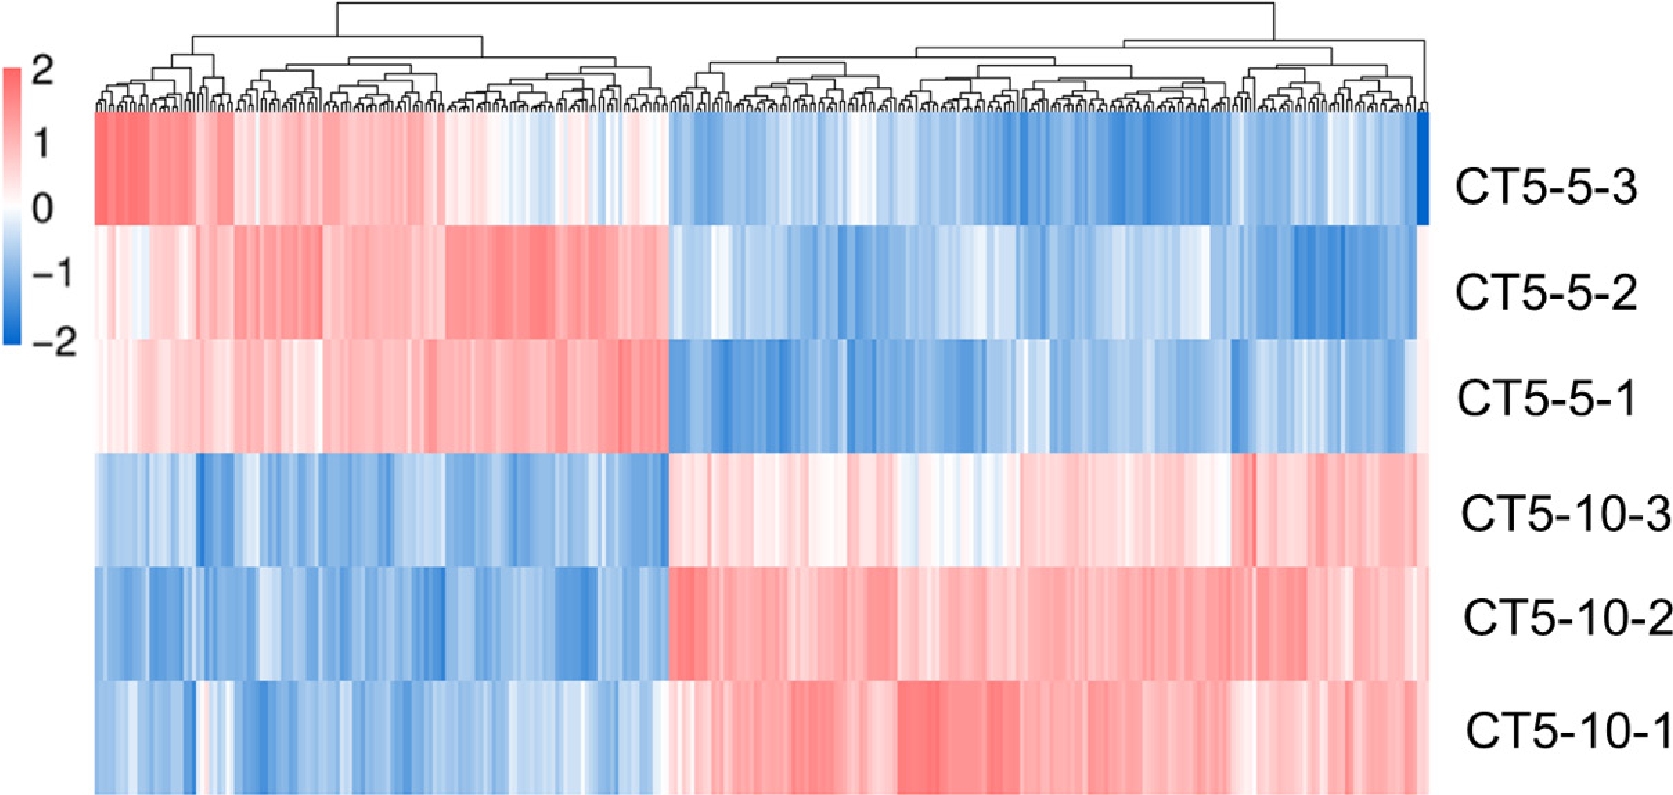
Figure 3.
Differential gene distribution of transcriptome at different times.
-
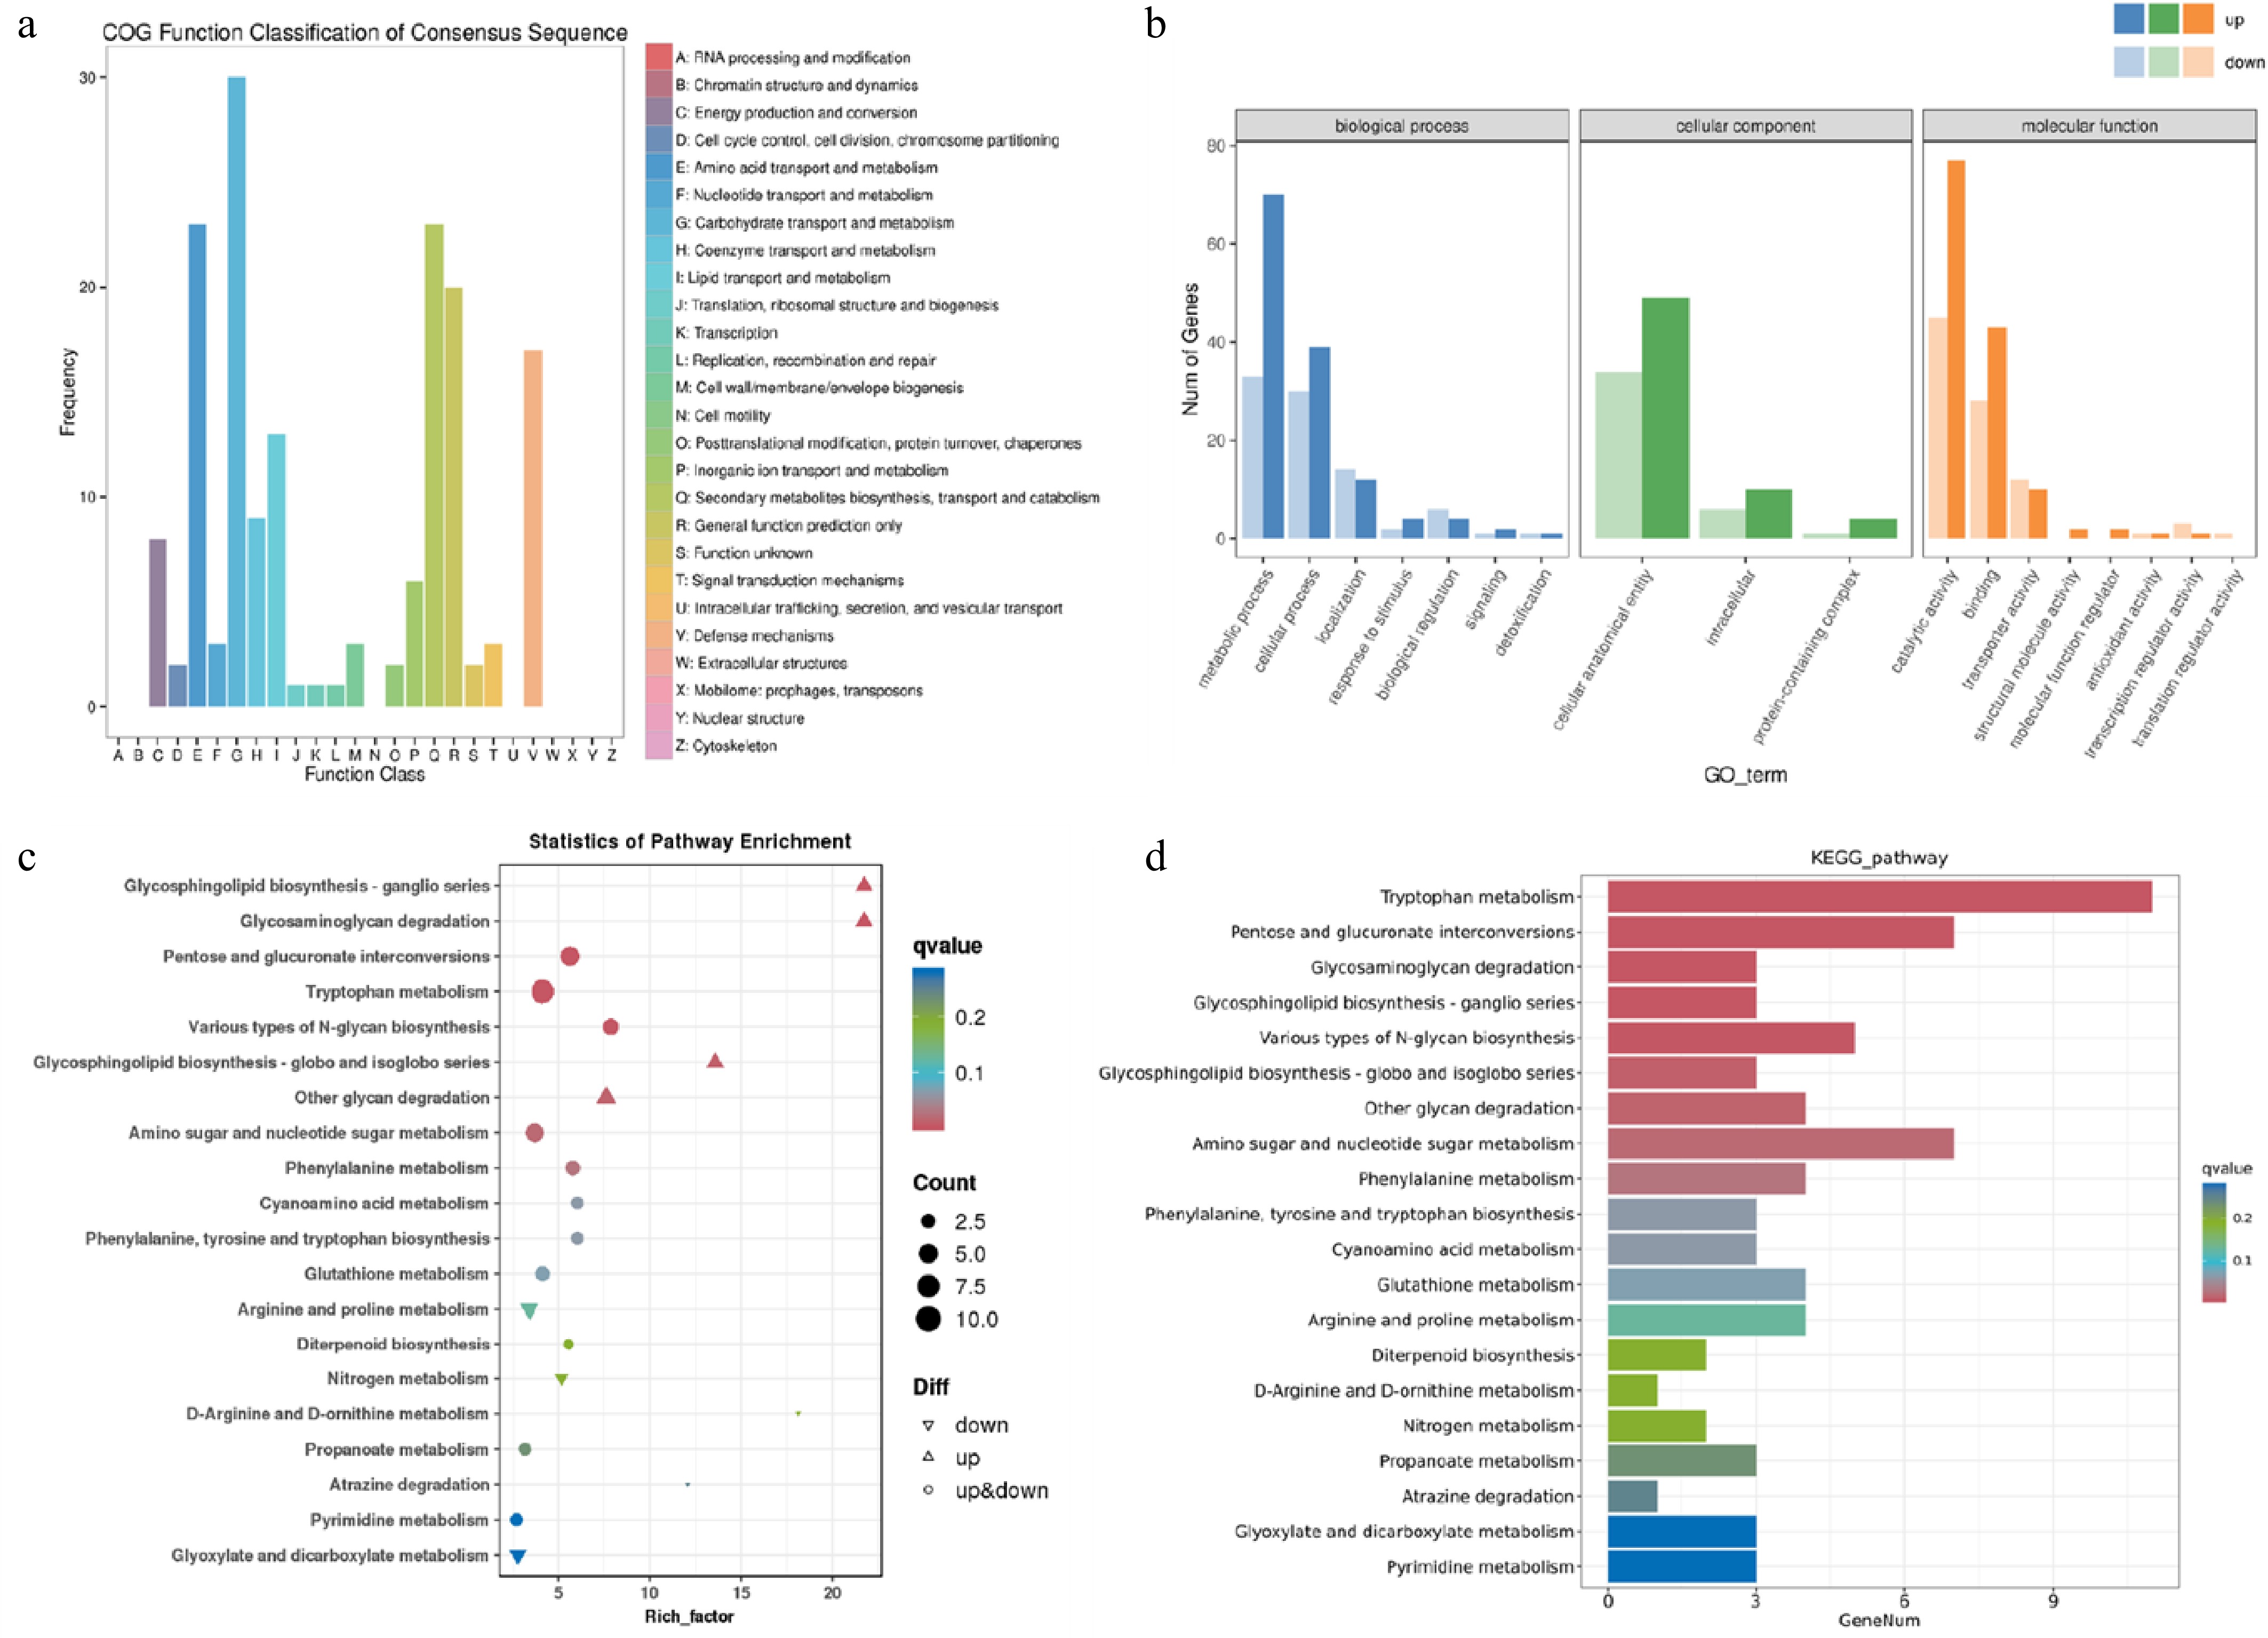
Figure 4.
Functional classification and enrichment analysis of DEGs between the 5 and 10vd groups. (a) COG functional classification of DEGs. (b) GO enrichment analysis of DEGs. (c) KEGG pathway enrichment analysis of DEGs. The rich factor represents the degree of enrichment. (d) KEGG functional classification of DEGs. The bar length indicates the number of DEGs involved in each pathway.
-
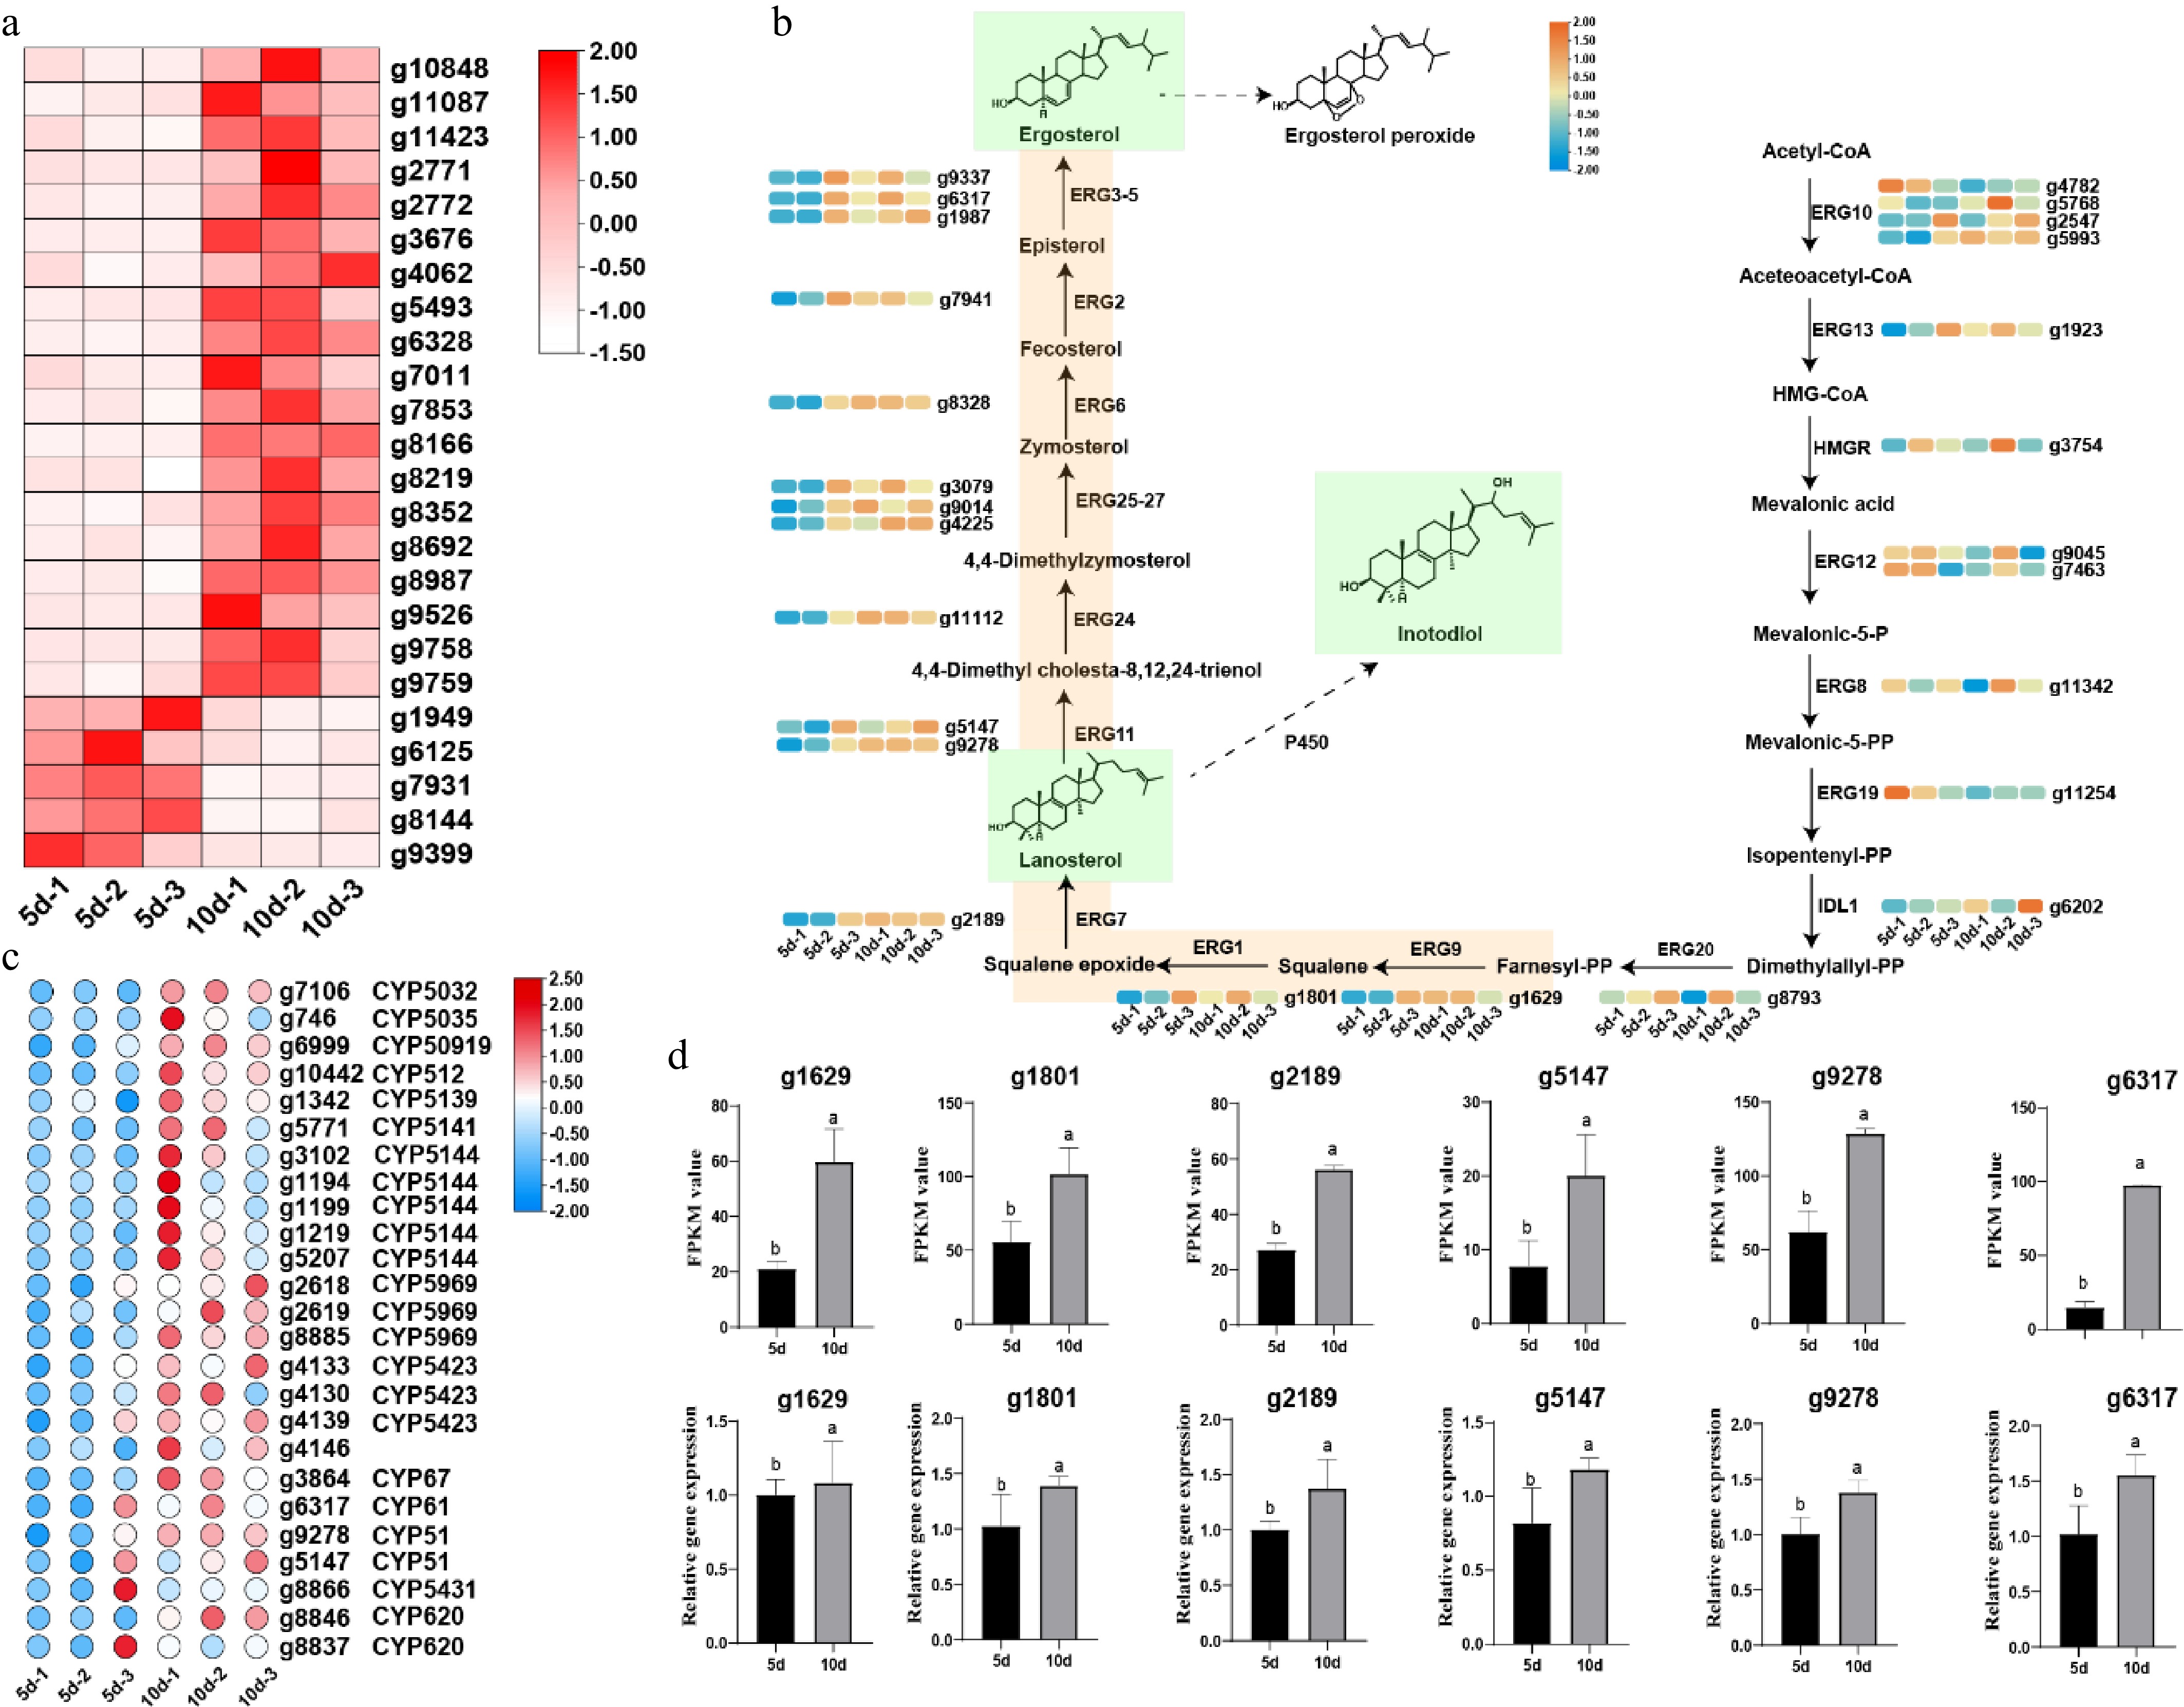
Figure 5.
Analysis and validation of key metabolic pathways during the developmental transition (5 vs 10 d). (a) Expression profiles of differentially expressed genes (DEGs) related to carbohydrate transport and metabolism. (b) DEGs involved in the mevalonate (MVA) pathway and downstream ergosterol biosynthesis. (c) Heatmap of cytochrome P450 (CYP450)-related DEGs, showing a predominant upregulation pattern. (d) Quantitative PCR (qPCR) validation of selected genes from the triterpenoid and ergosterol biosynthesis pathways at 5 and 10 d. Data are presented as mean ± SD (n = 3). The classification of the CYP family was directly distinguished based on the CYP database website (
https://p450atlas.org/index.html ). -
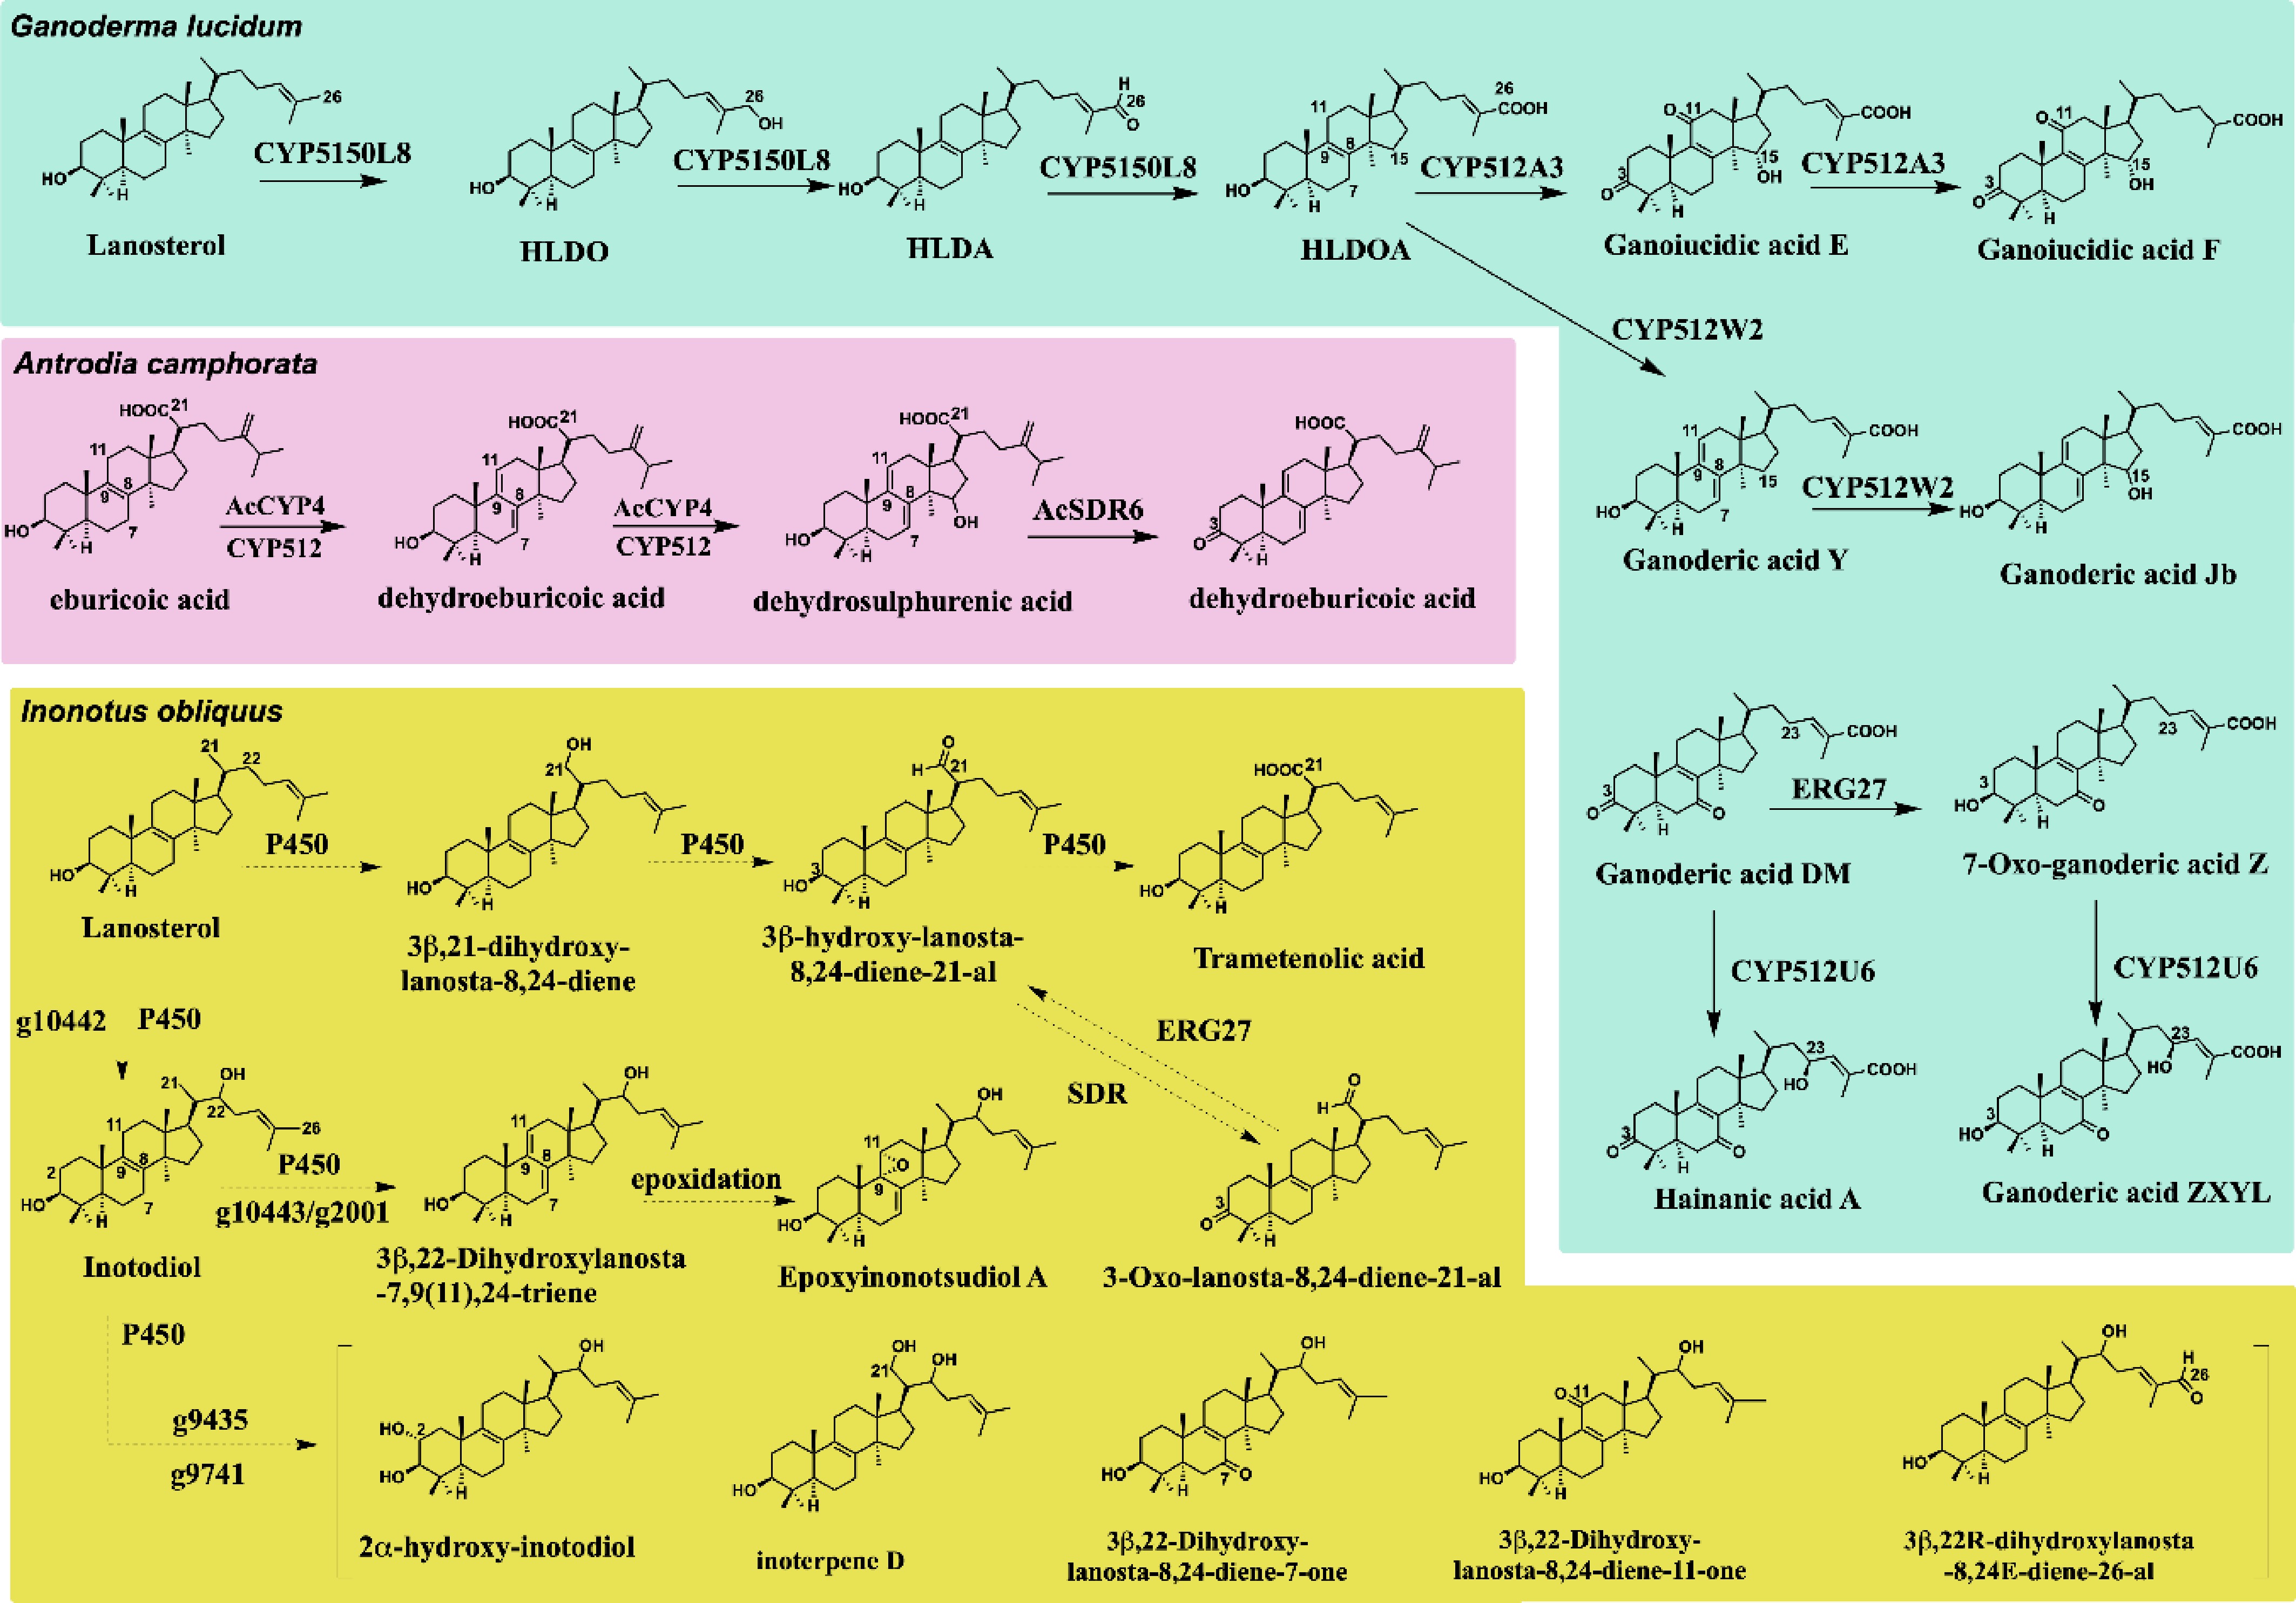
Figure 6.
Based on the functional analysis of P450, SDR, and ERG27 in G. lucidum and A. camphorata, the biosynthetic pathway of reported triterpenoids in I. obliquus was speculated. Solid lines indicate experimentally confirmed reaction conversions; dashed lines to represent predicted reactions in the study.
Figures
(6)
Tables
(0)