-
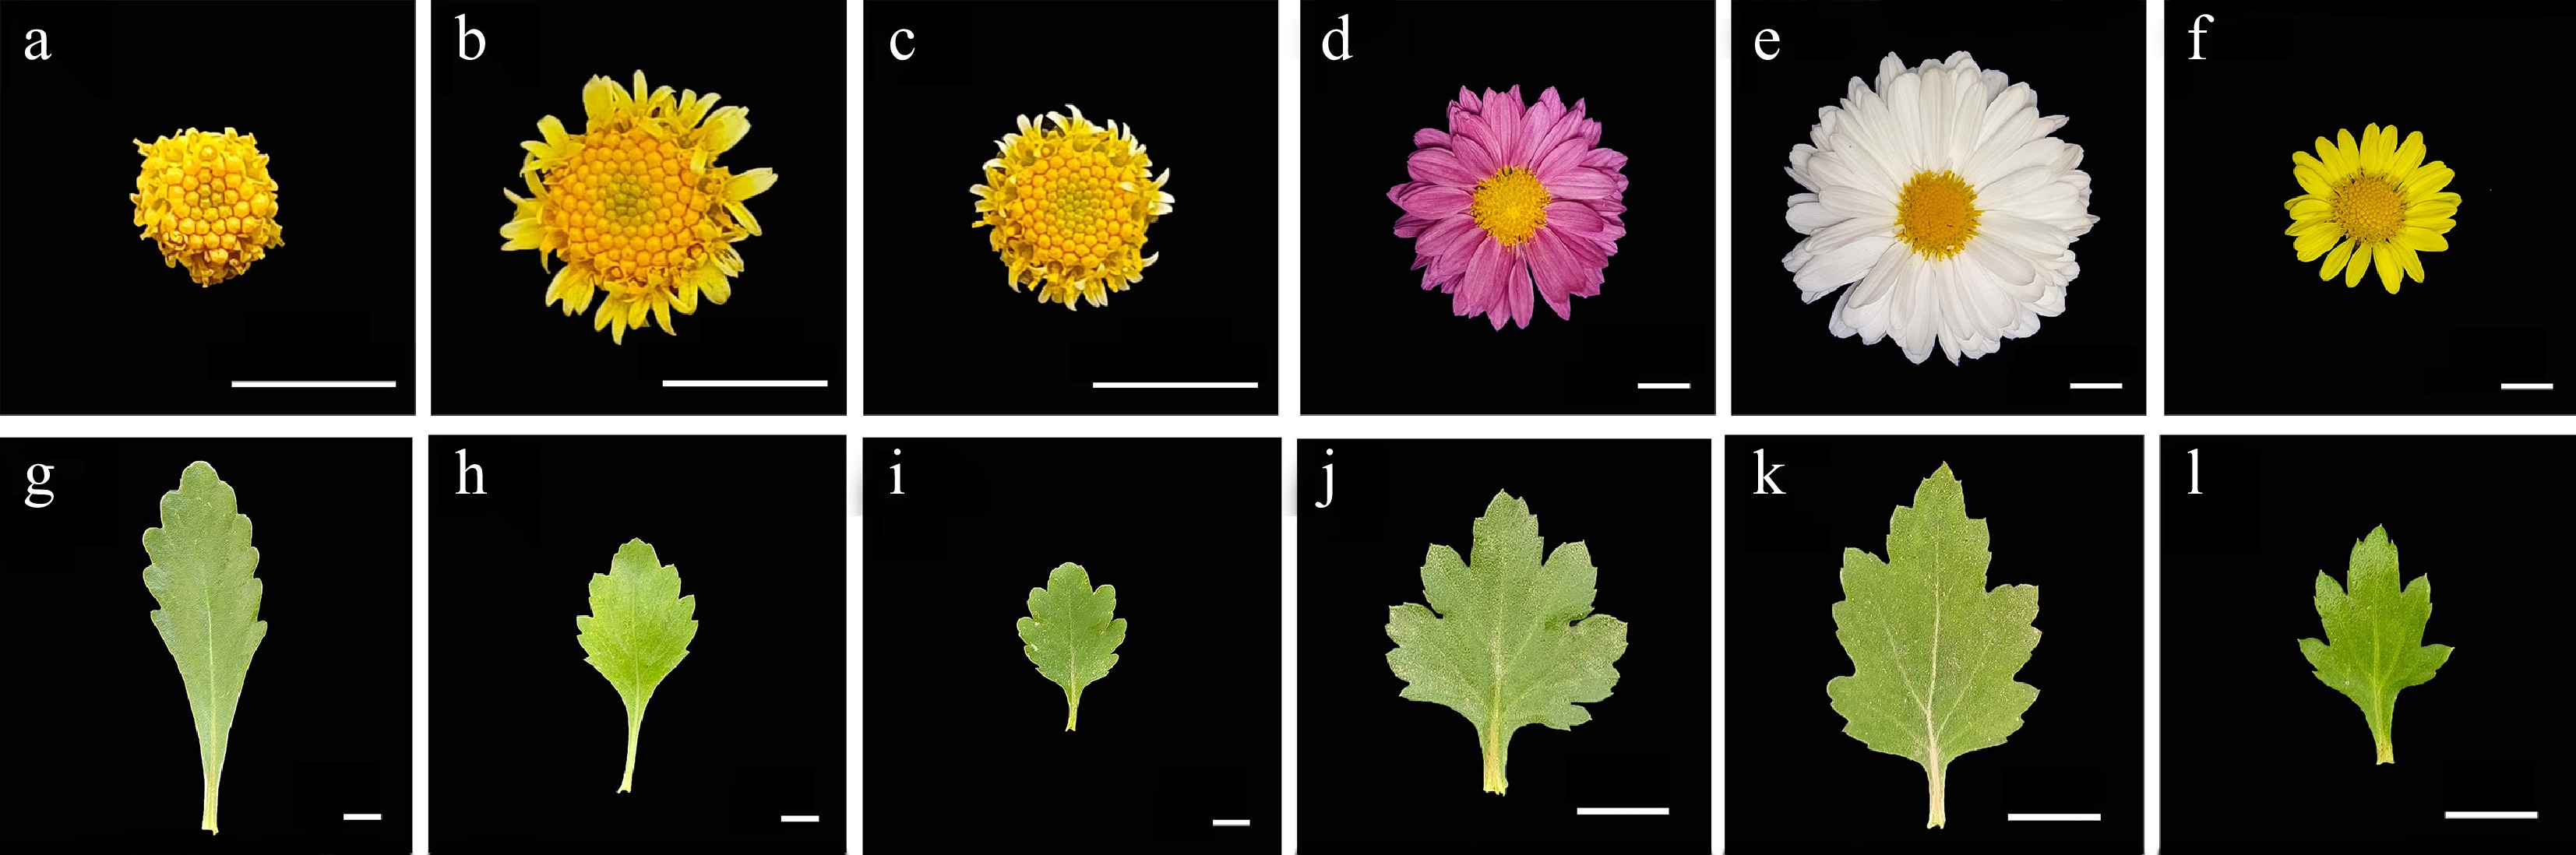
Figure 1.
Phenotype of capitula and leaves of hybrid parents. (a)–(f) and (g)–(l) represent the capitulum and leaf of A. pacifica, A. pacifica F1 'LP18', A. pacifica F1 'GHJ10', C. morifolium 'Jinglinliuyan', C. morifolium 'Jinseqionglu', and C. morifolium 'Maoxiangyu', respectively. Bar = 1 cm.
-
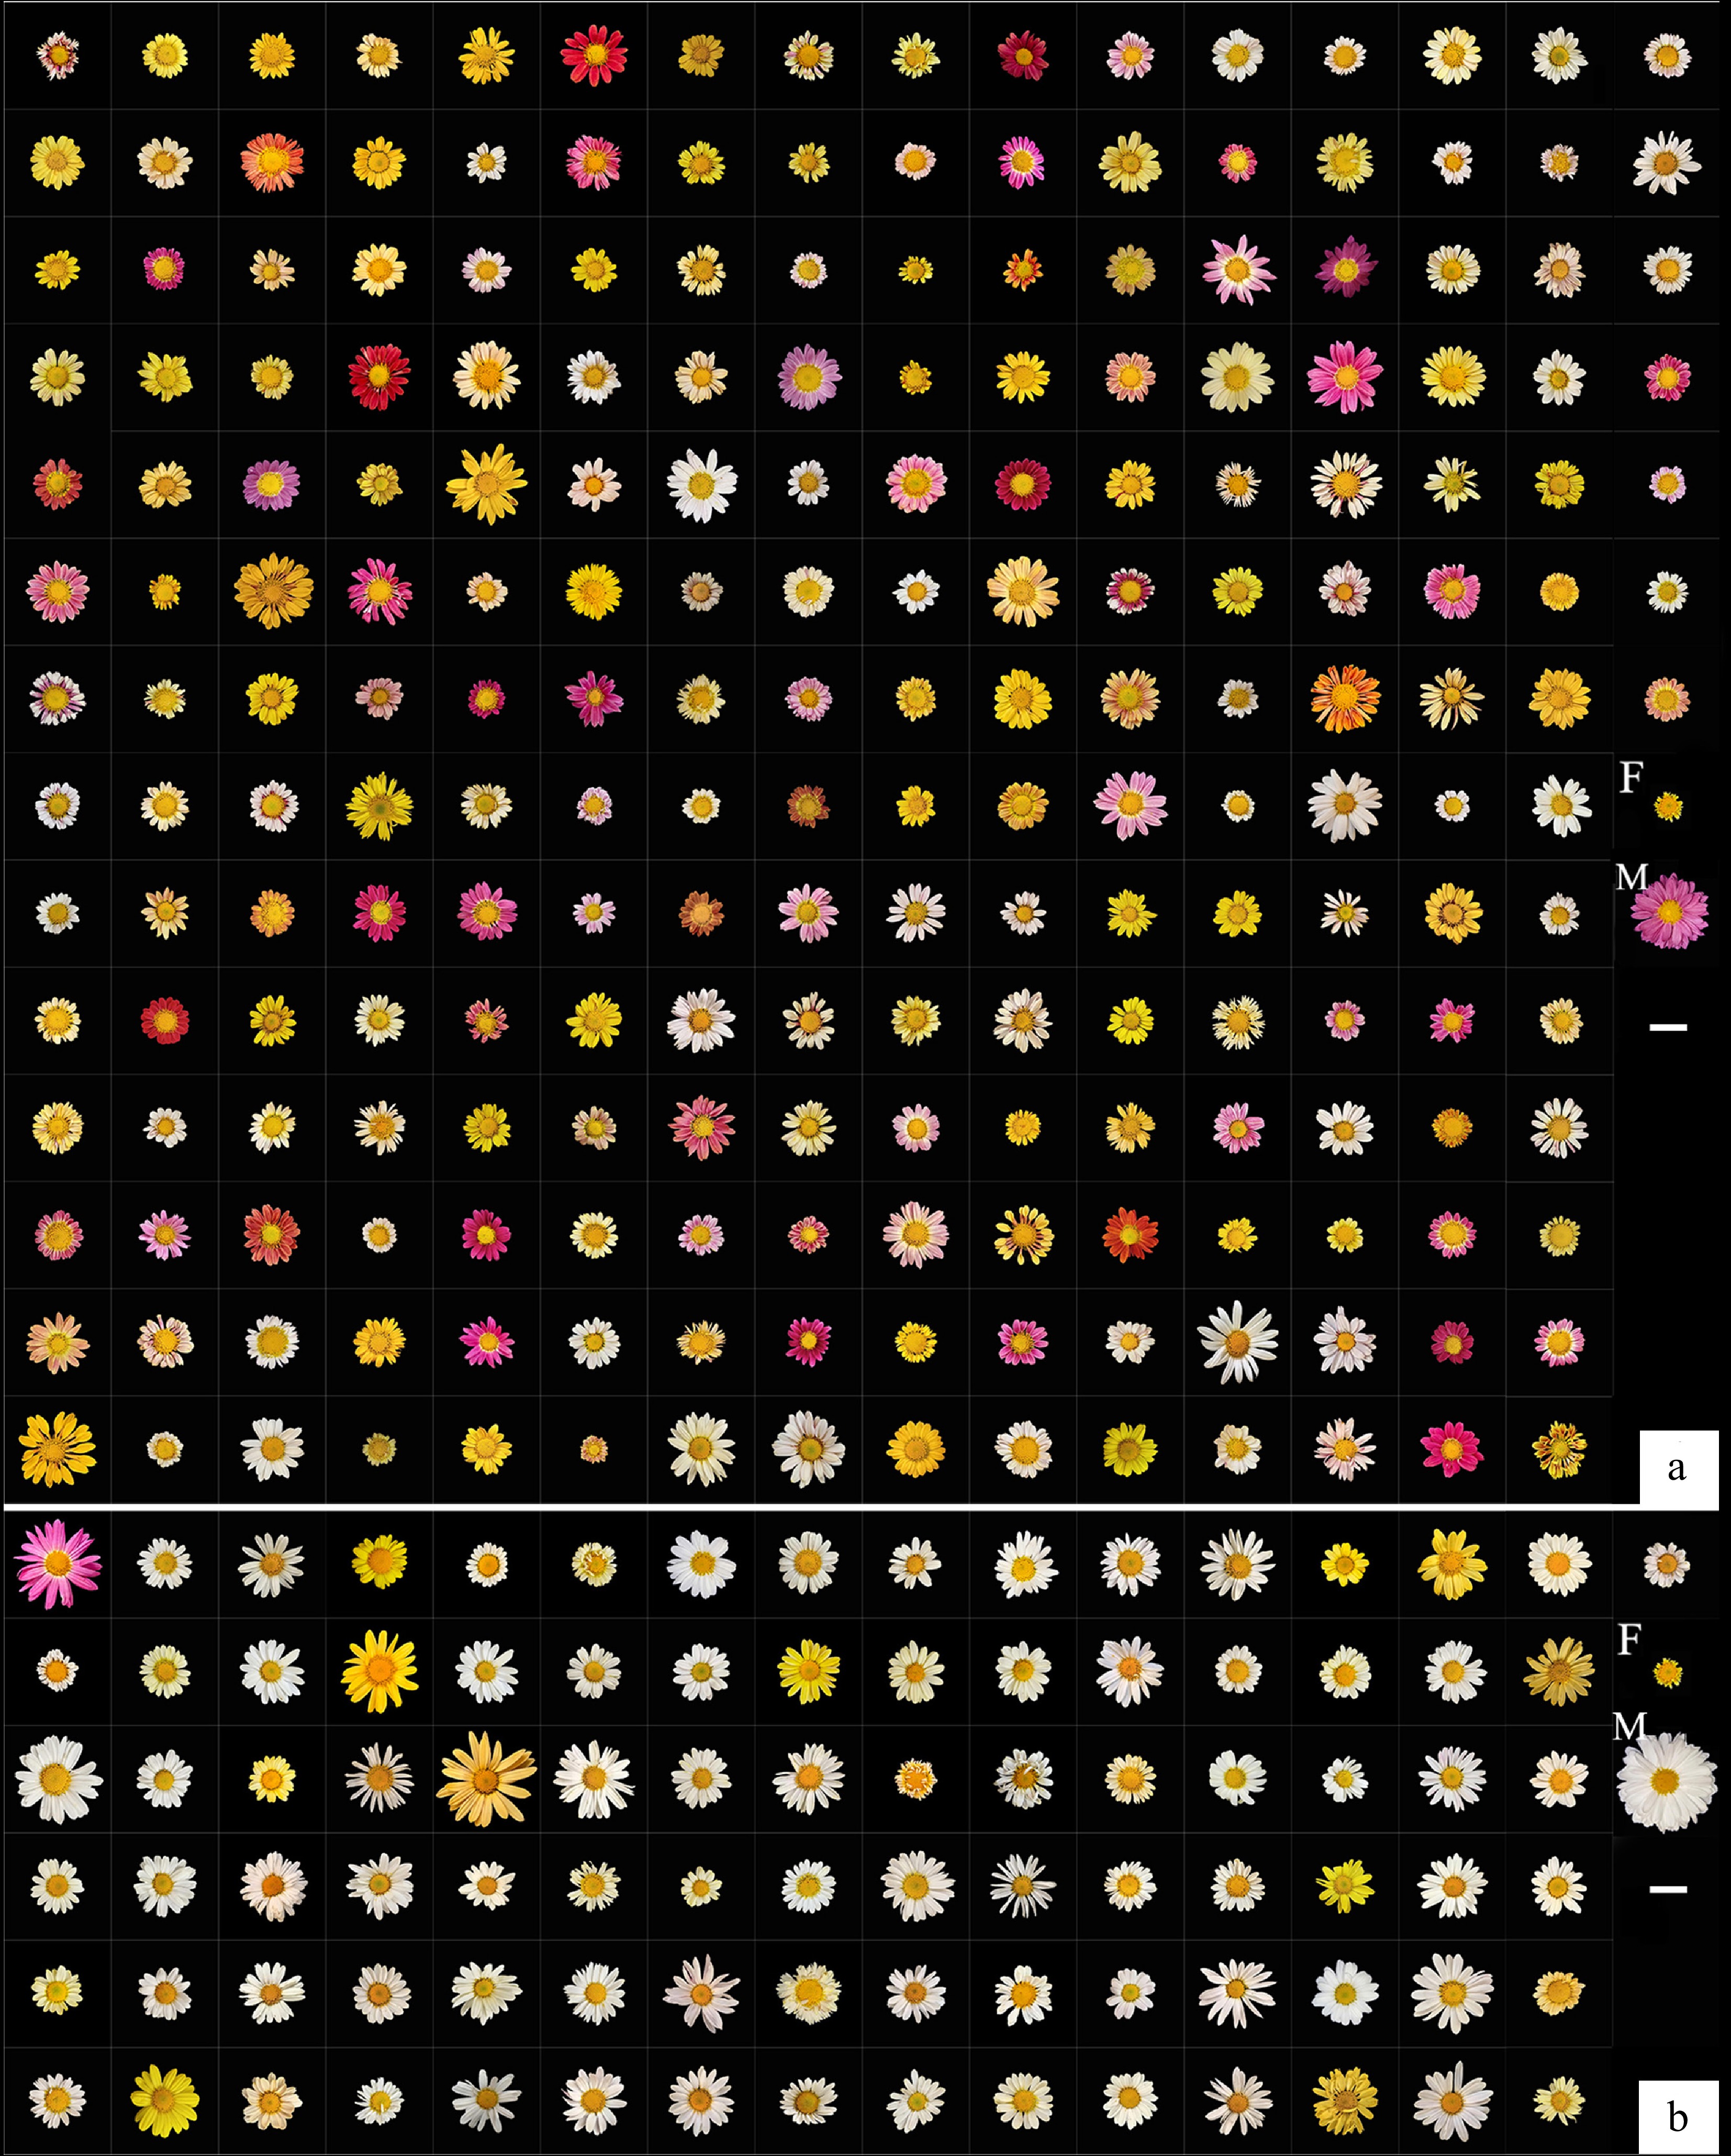
Figure 2.
Capitula phenotype of two Cross populations. (a) The capitula phenotype of Cross I. The letters F and M represent hybrid female parent A. pacifica F1'LP18' and male parent 'Jinglinliuyan' ('JLLY') respectively. (b) The capitula phenotype of Cross II. The letters F and M represent hybrid female parent A. pacifica F1'LP18' and male parent 'Maoxiangyu' ('MXY'). Bar = 2 cm.
-
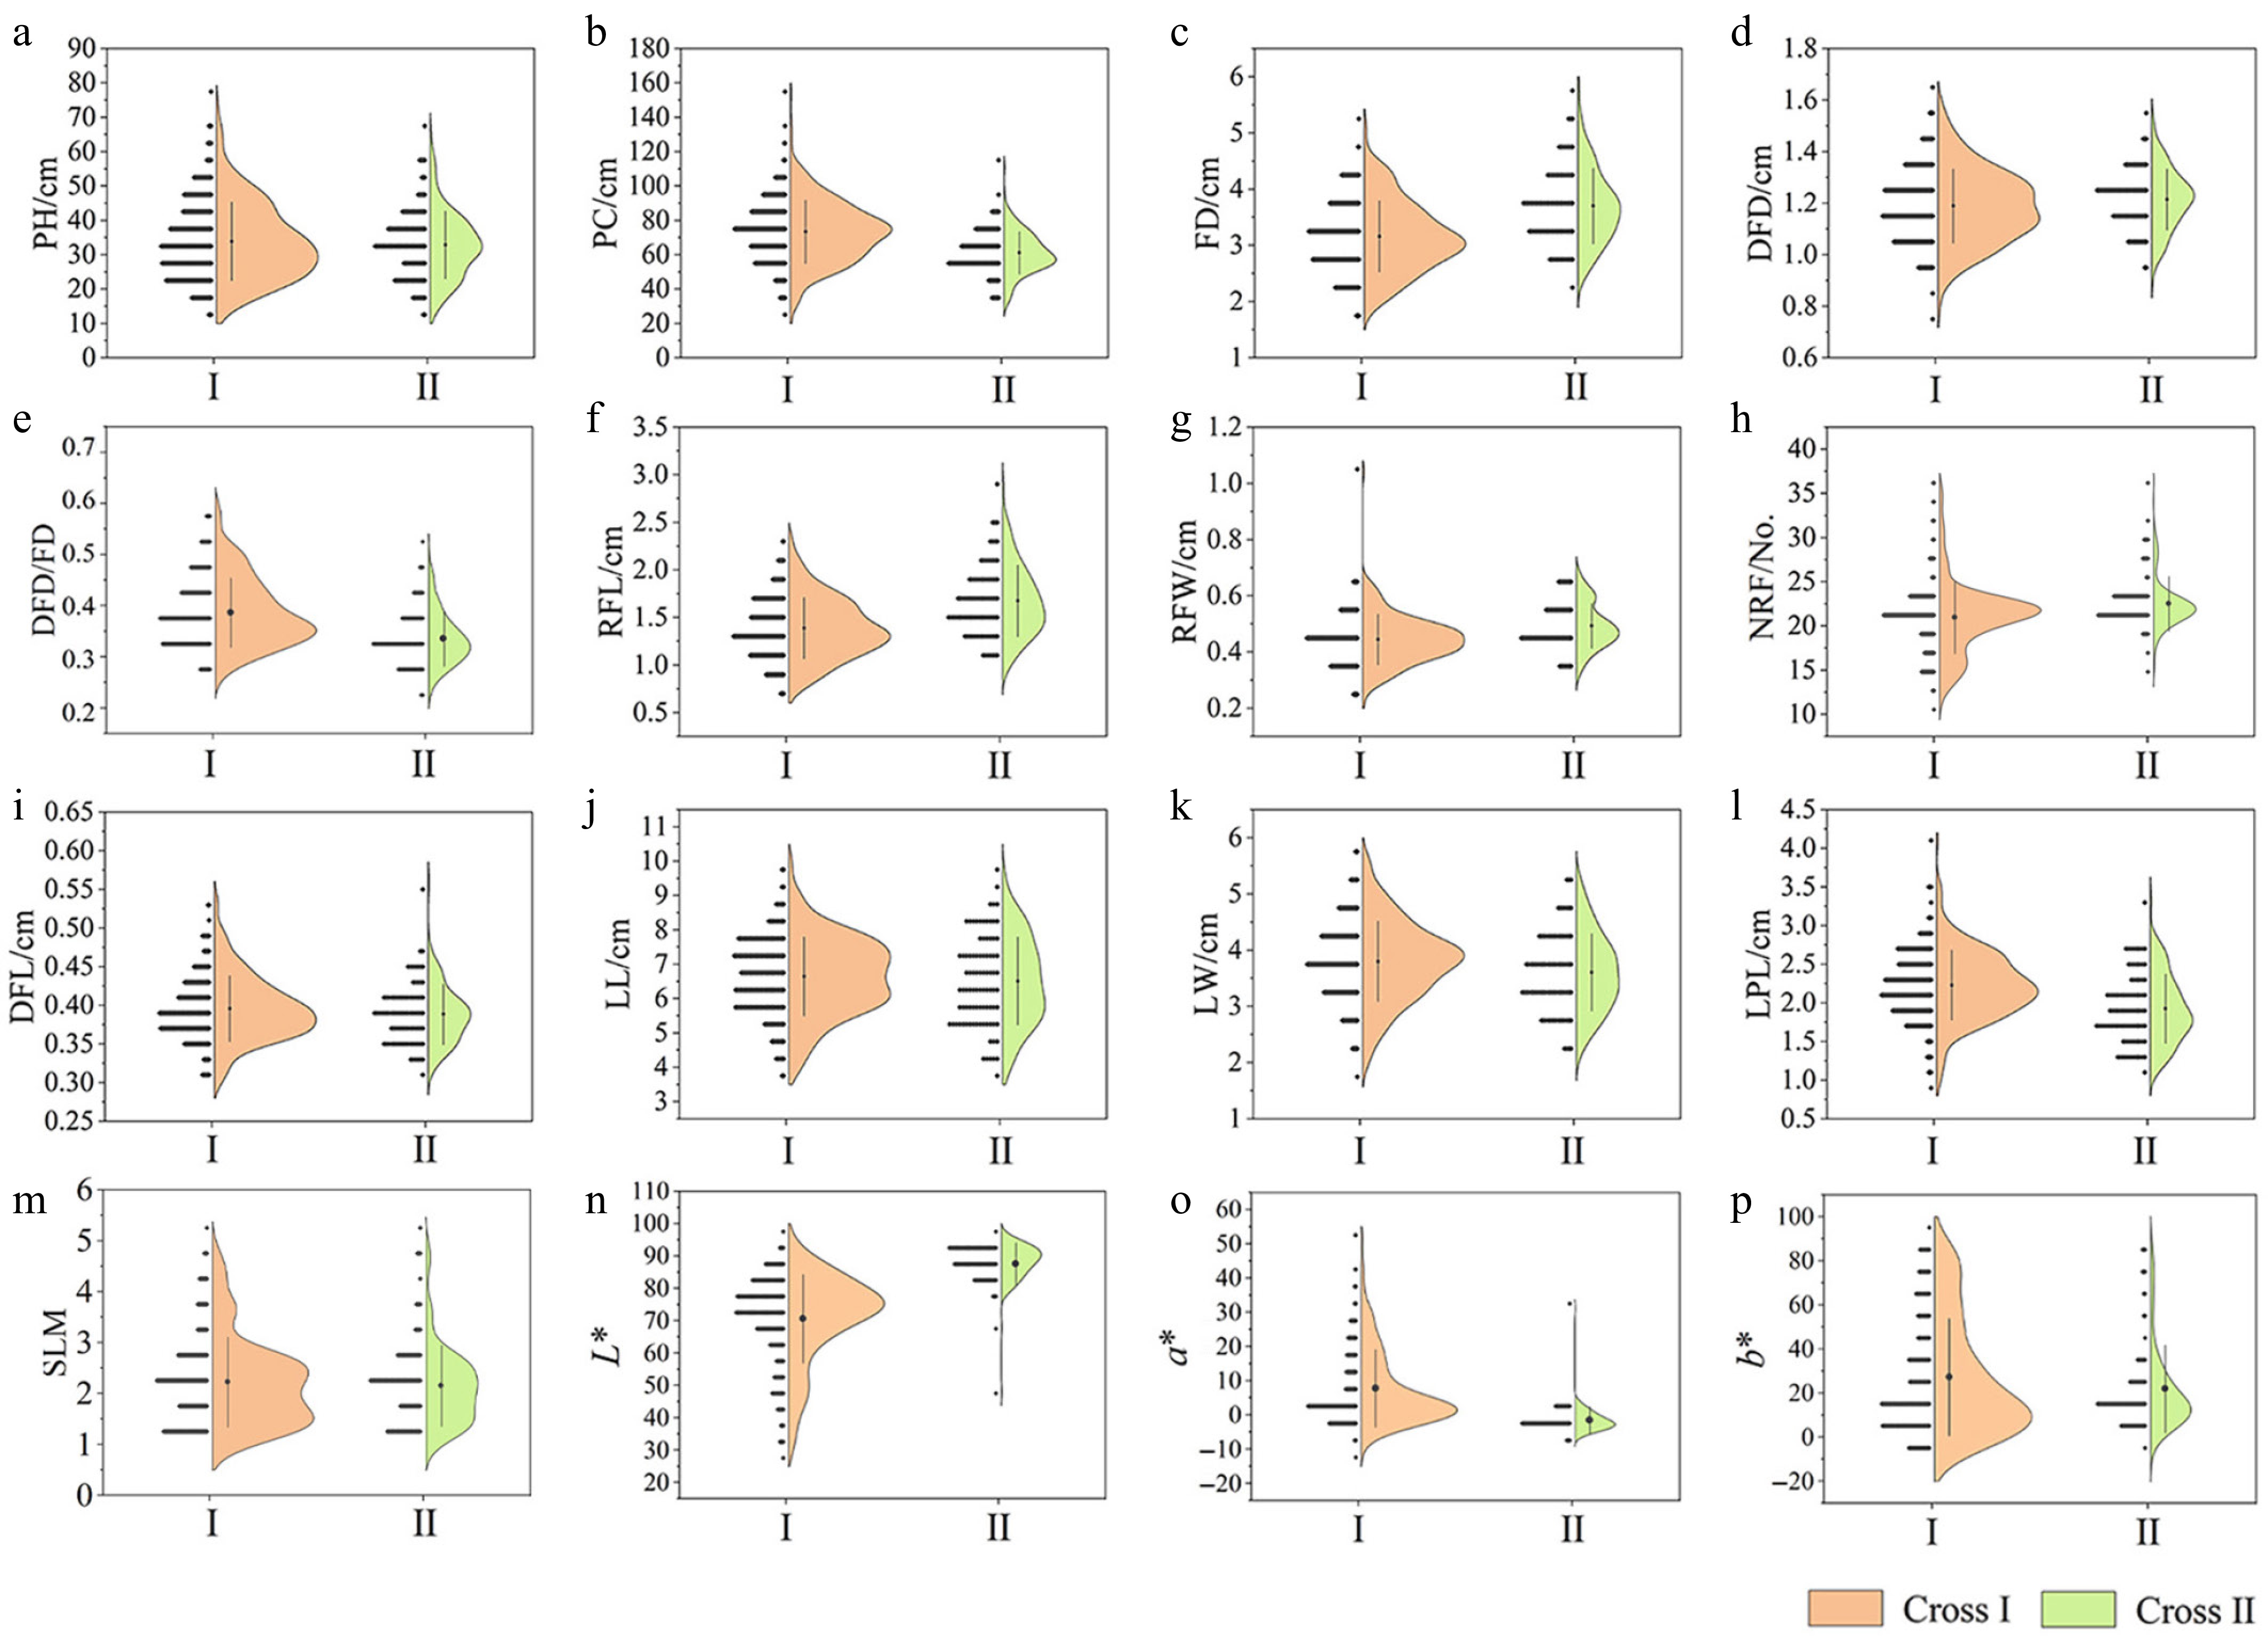
Figure 3.
Semi-violin diagrams of different phenotypic traits in two cross populations. (a) Plant height (PH). (b) Plant crown (PC). (c) Flower diameter (FD). (d) Disc flower diameter (DFD). (e) Disc flower diameter/flower diameter (DFD/FD). (f) Ray floret length (RFL). (g) Ray floret width (RFW). (h) Number of ray florets (NRF). (i) Disc floret length (DFL). (j) Leaf length (LL). (k) Leaf width (LW). (l) Leaf petiole length (LPL). (m) Silver-toned leaf margin (SLM). (n) L* value. (o) a* value. (p) b* value.
-
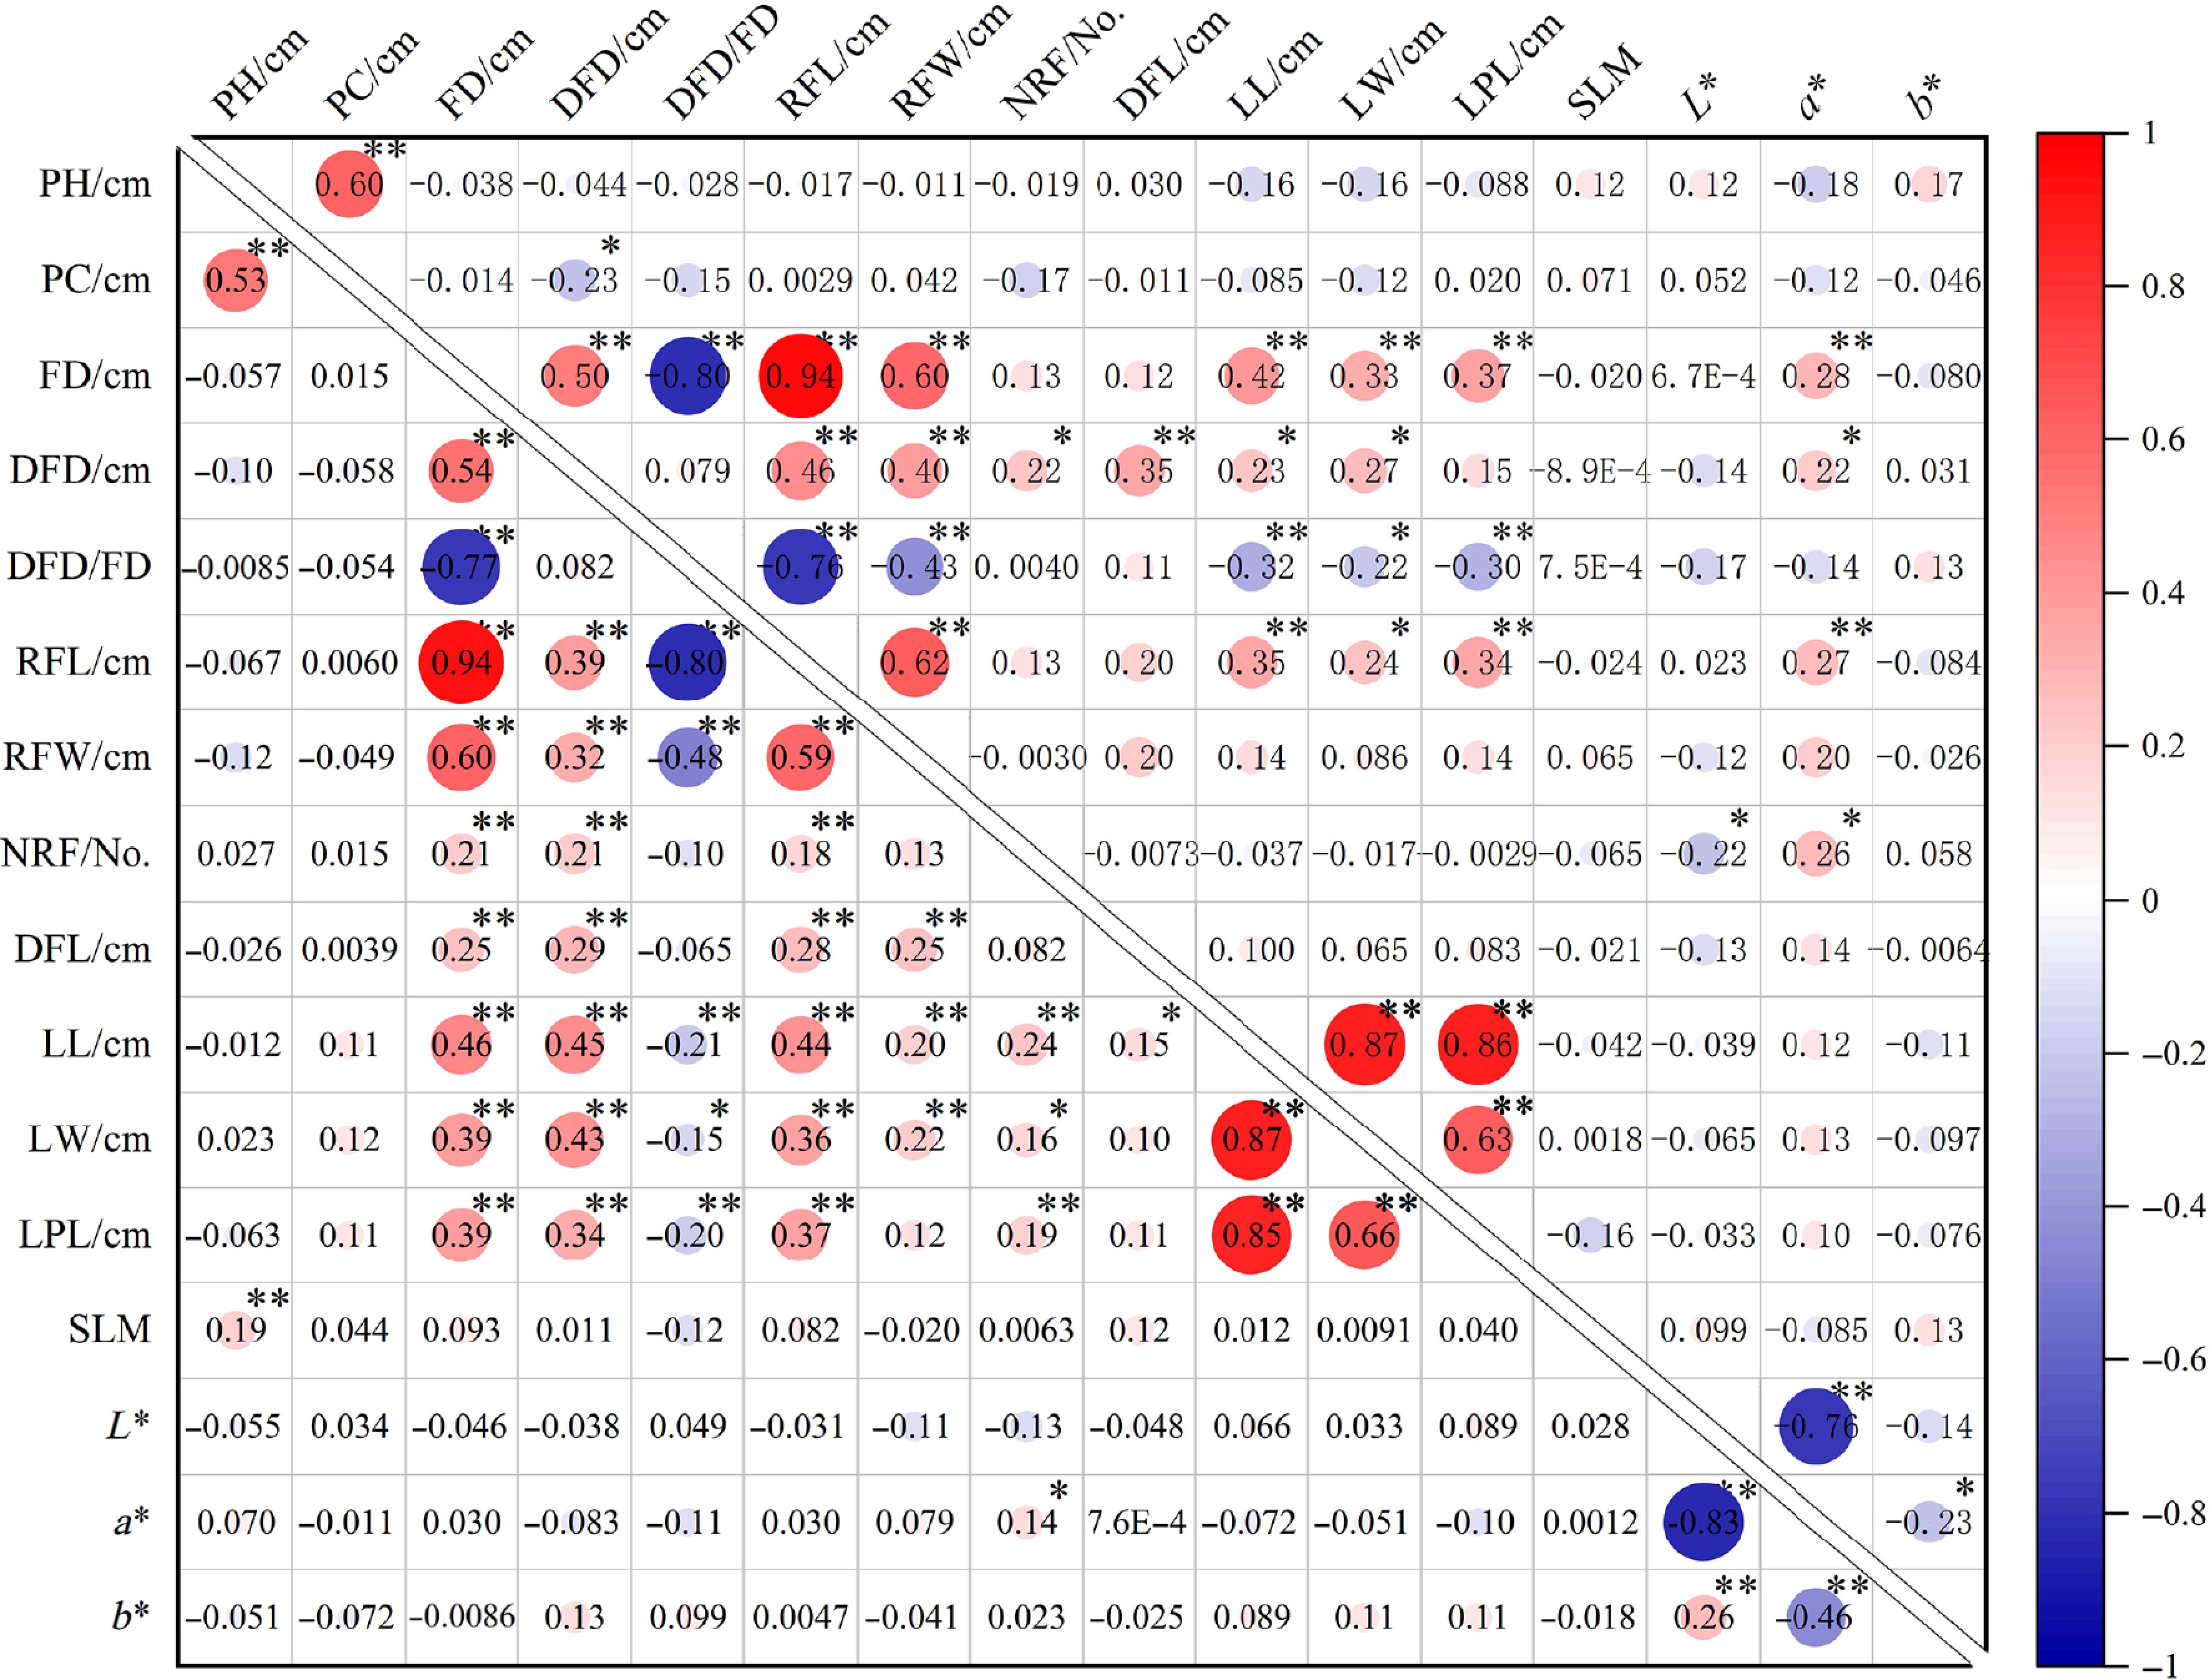
Figure 4.
Pearson correlation of phenotypic traits in two cross populations. The lower-left and upper-right triangle represent the correlations of different phenotypic traits of Cross I and Cross II respectively. PH, Plant height; PC, Plant crown; FD, Flower diameter; DFD, Disc flower diameter; DFD/FD, Disc flower diameter/Flower diameter; RFL, Ray floret length; RFW, Ray floret width; NRF, Number of ray florets; DFL, Disc floret length; LL, Leaf length; LW, Leaf width; LPL, Leaf petiole length, Silver-toned leaf margin (SLM). * and ** indicate significant difference at p ≤ 0.05 and p ≤ 0.01 level, respectively.
-
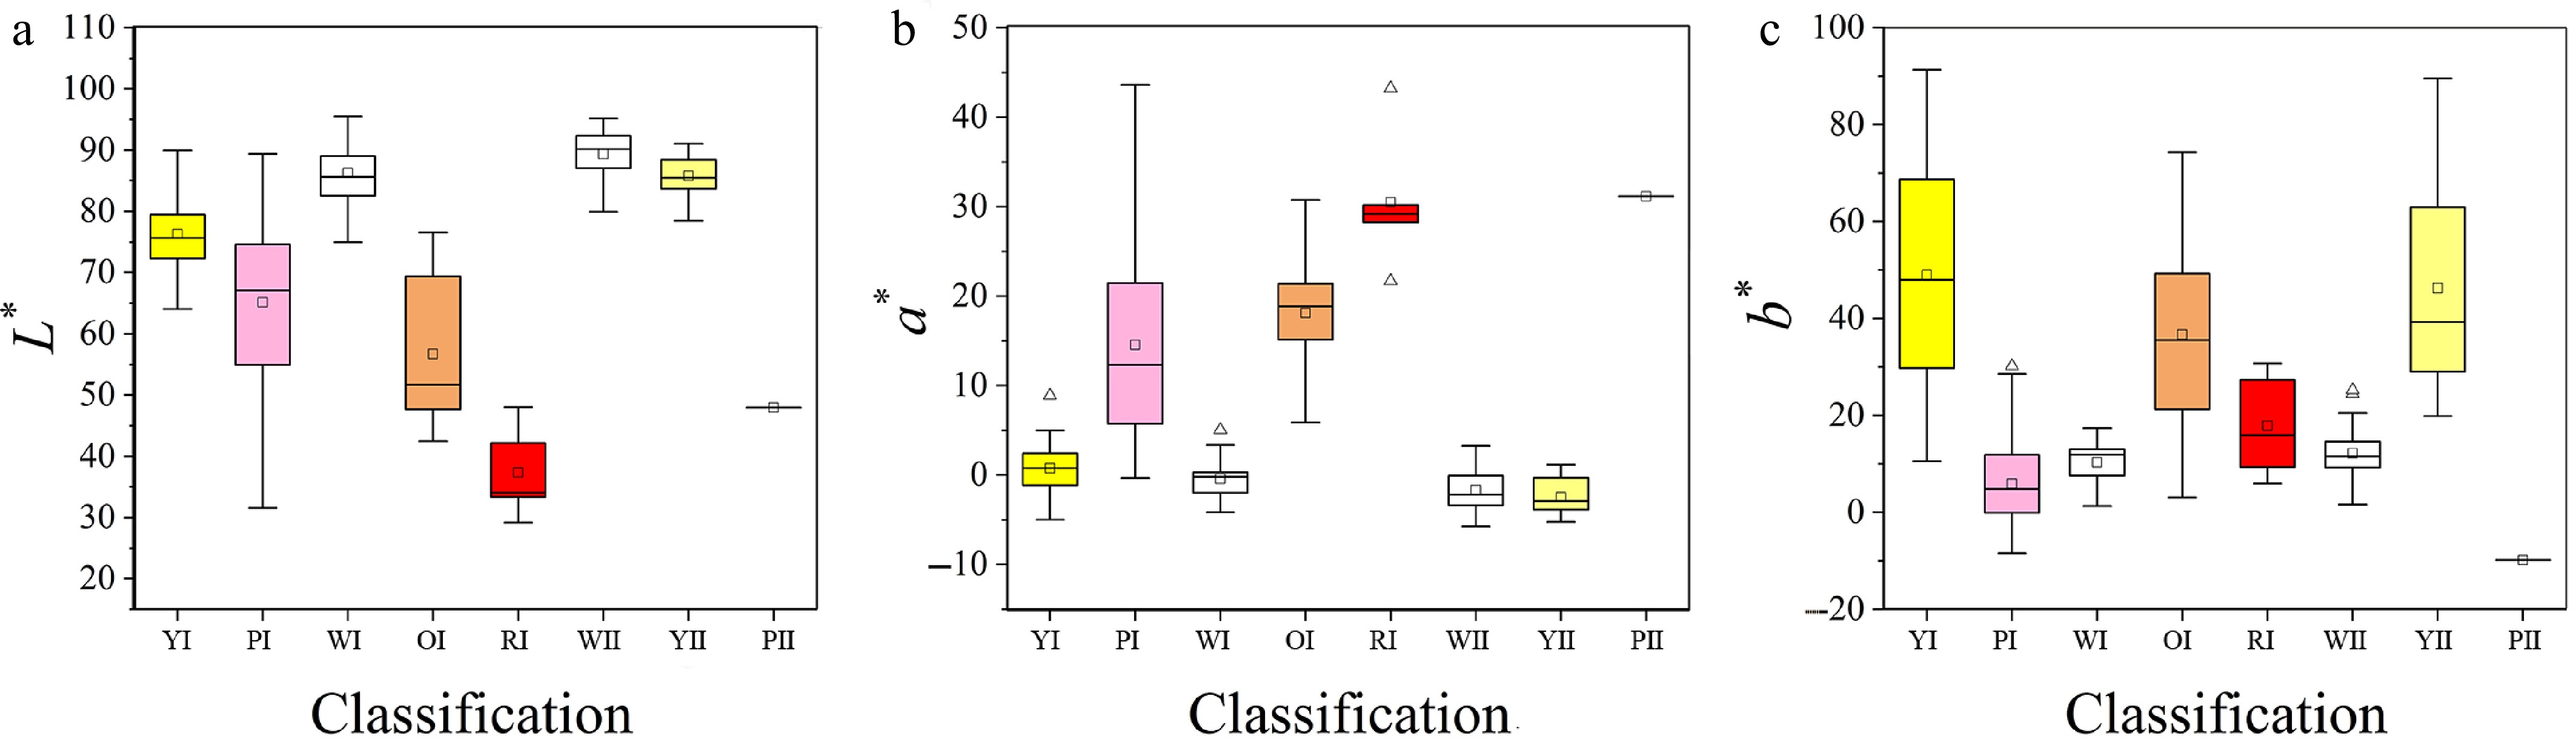
Figure 5.
Distribution of L*, a*, b* values in different color systems. (a)–(e) are the yellow, pink, white, orange, and red color system of Cross I; (f)–(h) are the white, yellow, and pink color system of Cross II. Boxplots show the mean, median, and outliers, box edges represent the 25th and 75th percentiles, and whiskers represent the maximum and minimum data points within 1.5× the interquartile range outside the box edges.
-
Female Male Hybrid capitula No. Seed
No.Seed
set (%)Germination
rate (%)Survival No. Ajania pacifica 'JSQL' 303 400 2.36 6 0 'MXY' 231 633 4.89 20 10 'JLLY' 259 922 6.36 29 55 'LP18' 'JSQL' 116 1,696 16.8 30 51 'MXY' 124 3,057 28.34 38 154 'JLLY' 170 3,823 25.55 33 300 'GHJ10' 'JSQL' 95 315 2.96 56 30 'MXY' 91 286 2.81 44 36 'JLLY' 112 327 2.61 52 18 Total − 1,501 11,459 − − 654 'LP18', A. pacifica F1 'LP18'. 'GHJ10', A. pacifica F1 'GHJ10'. 'JLLY', C. morifolium 'Jinglinliuyan'. 'JSQL', C. morifolium 'Jinseqionglu'. 'MXY', C. morifolium 'Maoxiangyu'. Table 1.
Seed setting and germination rate of different hybrid combinations.
-
Trait Cross Extremum Average SD CV/% Skewness Kurtosis PH/cm I 11.00–75.00 33.88 11.39 33.62 0.67 0.35 II 13.00–66.00 32.84 9.82 29.90 0.55 0.56 PC/cm I 21.50–154.00 73.33 18.42 25.12 0.41 1.17 II 32.00–111.00 61.37 12.37 20.15 0.42 1.26 FD/cm I 1.78–5.13 3.16 0.63 20.07 0.36 −0.14 II 2.44–5.83 3.70 0.67 18.13 0.55 0.28 DFD/cm I 0.79–1.60 1.19 0.14 12.15 0.17 −0.12 II 0.92–1.52 1.21 0.12 9.80 −0.01 −0.11 DFD/FD I 0.26–0.60 0.39 0.07 17.53 0.69 0.03 II 0.22–0.50 0.34 0.05 15.94 0.77 0.68 RFL/cm I 0.73–2.32 1.39 0.32 23.13 0.34 −0.16 II 1.00–2.86 1.67 0.38 22.42 0.61 0.22 RFW/cm I 0.22–1.04 0.44 0.09 20.17 1.42 8.18 II 0.32–0.68 0.49 0.08 16.12 0.32 −0.42 NRF/No. I 11.25~34.25 20.78 3.79 18.23 0.62 1.99 II 15.25–35.25 22.25 2.89 13.01 1.67 5.06 DFL/cm I 0.30–0.54 0.40 0.04 11.23 0.61 0.69 II 0.31–0.56 0.39 0.04 10.09 1.03 2.88 LL/cm I 3.83–10.35 6.81 1.14 16.78 −0.05 0.08 II 3.91–10.04 6.77 1.31 19.37 0.08 −0.37 LW/cm I 1.99–5.61 3.88 0.70 17.96 −0.06 0.02 II 2.27–5.76 3.71 0.75 20.23 0.44 −0.42 LPL/cm I 0.93–4.11 2.29 0.46 19.99 0.35 1.04 II 1.10–4.18 2.04 0.51 24.75 0.8 1.77 SLM I 1–5 2.23 0.88 2.86 0.90 0.43 II 1–5 2.10 0.80 2.76 1.20 1.76 L* I 29.18–95.50 70.70 13.63 19.28 −0.97 0.56 II 47.98–95.18 87.63 6.38 7.28 −3.06 16.22 a* I −11.97–53.36 7.79 11.31 145.23 1.48 2.13 II −5.74–31.13 −1.52 4.12 271.87 5.69 44.09 b* I −8.44–91.31 27.32 26.51 97.05 0.81 −0.48 II −9.80–89.52 22.02 19.90 90.36 1.76 2.65 Note: The significance test of mid-parent heterosis in population was the result of t-test of single sample mean of target traits and mid-parent value per plant. Table 2.
Descriptive statistics of phenotypic traits in two cross populations.
-
Traits Cross MPV Average Hm RHm (%) Comparison between hybrids and parents Less than low parent (%) Between parent (%) Greater than high parent (%) PH (cm) I 44.00 33.88 −10.12** −22.99 31.00 66.33 2.67 II 45.50 32.84 −12.66** −27.83 40.91 58.44 0.65 PC (cm) I 96.25 73.33 −22.92** −23.81 90.67 0.33 9.00 II 88.50 61.37 −27.13** −30.66 94.16 5.19 0.65 FD (cm) I 3.07 3.16 0.09* 2.90 0.46 98.62 0.92 II 3.94 3.70 −0.24** −6.12 0 100 0 DFD (cm) I 1.16 1.19 0.03** 2.50 21.66 41.94 36.41 II 1.24 1.21 −0.03* −2.05 14.29 81.32 4.40 RFL (cm) I 1.36 1.39 0.03 2.02 0.46 94.93 4.61 II 1.60 1.67 0.07 4.66 0 96.70 3.30 DFD/FD I 0.49 0.39 −0.10** −20.35 0.92 99.08 0 II 0.46 0.34 −0.13** −27.14 0 100 0 RFW (cm) I 0.38 0.44 0.06** 17.05 0.46 86.18 13.36 II 0.46 0.49 0.03** 7.14 0 100 0 NRF (No.) I 34.00 20.78 −13.22** −38.88 0.46 99.54 0 II 50.88 22.25 −28.63** −56.26 0 100 0 DFL (cm) I 0.44 0.40 −0.04** −9.09 67.00 25.63 7.37 II 0.44 0.39 −0.05** −11.70 83.52 13.19 3.30 LL (cm) I 5.49 6.81 1.33** 24.20 3.00 35.67 61.33 II 5.59 6.77 1.18** 21.21 5.19 35.06 59.74 LW (cm) I 3.19 3.88 0.69** 21.67 12.67 6.00 81.33 II 3.12 3.71 0.60** 19.15 16.88 14.29 68.83 LPL (cm) I 1.76 2.29 0.54** 30.57 0.67 58.00 41.33 II 1.62 2.04 0.43** 26.48 0 74.68 25.32 SLM I 2.39 2.23 −0.16** −0.07 0 93.67 6.33 II 2.16 2.10 −0.06 −0.06 0 96.10 3.90 L* I 61.53 70.70 14.90** 14.90 6.91 62.21 30.88 II 85.59 87.63 2.38* 2.38 2.20 84.62 13.19 a* I 13.85 7.79 −43.75 −43.75 9.68 84.33 5.99 II −2.41 −1.52 −36.93 −36.93 30.77 32.97 36.26 b* I 22.00 27.32 24.18 24.18 1.38 98.16 0.46 II 29.20 22.02 −24.59** −24.59 10.99 78.02 10.99 * and ** indicate significant difference at p ≤ 0.05 and p ≤ 0.01 level, respectively. Table 3.
Heterosis expression of phenotypic traits.
-
Traits Model Cross m da db ha hb da/ha db/hb σ2 mg h2mg/% PH (cm) 2MG-AD I 37.6459 11.9162 2.5405 −1.0435 −6.6822 −11.42 −0.38 0 0 II 33.6567 9.4599 7.1814 −0.9279 −1.3410 −10.19 −5.36 22.83 23.68 PC (cm) 2MG-EA I 73.1994 11.0174 − − − − − 0 0 II 61.1299 8.0447 − − − − − 0 0 FD (cm) 2MG-AD I 3.1875 0.6412 0.4411 0.0453 −0.0826 14.15 −5.34 0.39 95.88 II 3.6572 0.6926 0.3476 0.0139 0.0836 49.83 4.16 0 0 DFD (cm) 0MG I − − − − − − − − − II − − − − − − − − − DFD/FD 2MG-EA I 0.3880 0.0437 − − − − − 0 27.02 II 0.3357 0.028 − − − − − 0 0 RFL (cm) 2MG-AD I 1.4172 0.3632 0.2216 −0.0414 −0.0315 −8.77 −7.03 0.07 68.44 II 1.6745 0.4181 0.1838 −0.0532 0.0500 −7.86 3.68 0.01 8.23 RFW (cm) 2MG-A I 0.4424 0.0280 0.0650 − − − − 0 0 II 0.5025 0.0178 0.0721 − − − − 0.01 99.69 DFL (cm) 2MG-EA I 0.3960 0.0172 − − − − − 0 0 II 0.3880 0.0185 − − − − − 0 0 NRF (No.) 2MG-AD I 11.4472 9.7741 0.3067 8.0251 0.8146 1.22 0.38 81.061 99.9724 II 22.9855 1.298 0.7072 −2.1376 0.6686 −0.61 −1.06 0 0 LL (cm) 2MG-AD I 6.3416 1.0545 0.9652 0.5661 0.1666 1.86 5.79 0.17 12.69 II 6.5193 1.1675 0.3403 0.6869 −0.1444 1.70 −2.36 1.71 99.71 LW (cm) 2MG-AD I 3.7777 0.6838 0.5884 0.2123 −0.0258 3.22 −22.81 0.42 83.95 II 4.1181 0.7839 0.1719 −0.3606 −0.4636 −2.17 −0.37 0.47 83.89 LPL (cm) 2MG-EA I 2.2714 0.1939 − − − − − 0.21 99.28 II 2.0410 0.3613 − − − − − 0 0 L* 2MG-AD I 66.3118 14.8735 6.9872 7.6392 0.9652 1.95 7.24 168.84 90.83 II 85.7019 5.1061 3.4066 3.1586 0.6905 1.62 4.93 40.48 99.58 a* 2MG-AD I 12.2388 11.1961 3.0678 −6.9861 −1.1399 −1.60 −2.69 0 0 II −0.4909 2.9810 1.5503 −1.0423 −0.5503 −2.86 −2.82 0 0 b* 2MG-AD I 36.4601 32.5026 8.4552 −15.6254 −1.1452 −2.08 −7.38 661.77 94.13 II 28.8595 18.7166 1.1393 −13.7883 1.9313 −1.36 0.59 0 0 Note: m: Population mean value; da: Additive effect of the first major gene; db: Additive effect of the second major genes; ha: Dominant effect of the first major gene; hb: Dominant effect of the second major gene; σ2mg: Major-gene variance; h2mg: Major-gene heritability/%; −: The value is absent. Table 4.
Estimation of genetic parameters for different traits under optimal model.
Figures
(5)
Tables
(4)