-
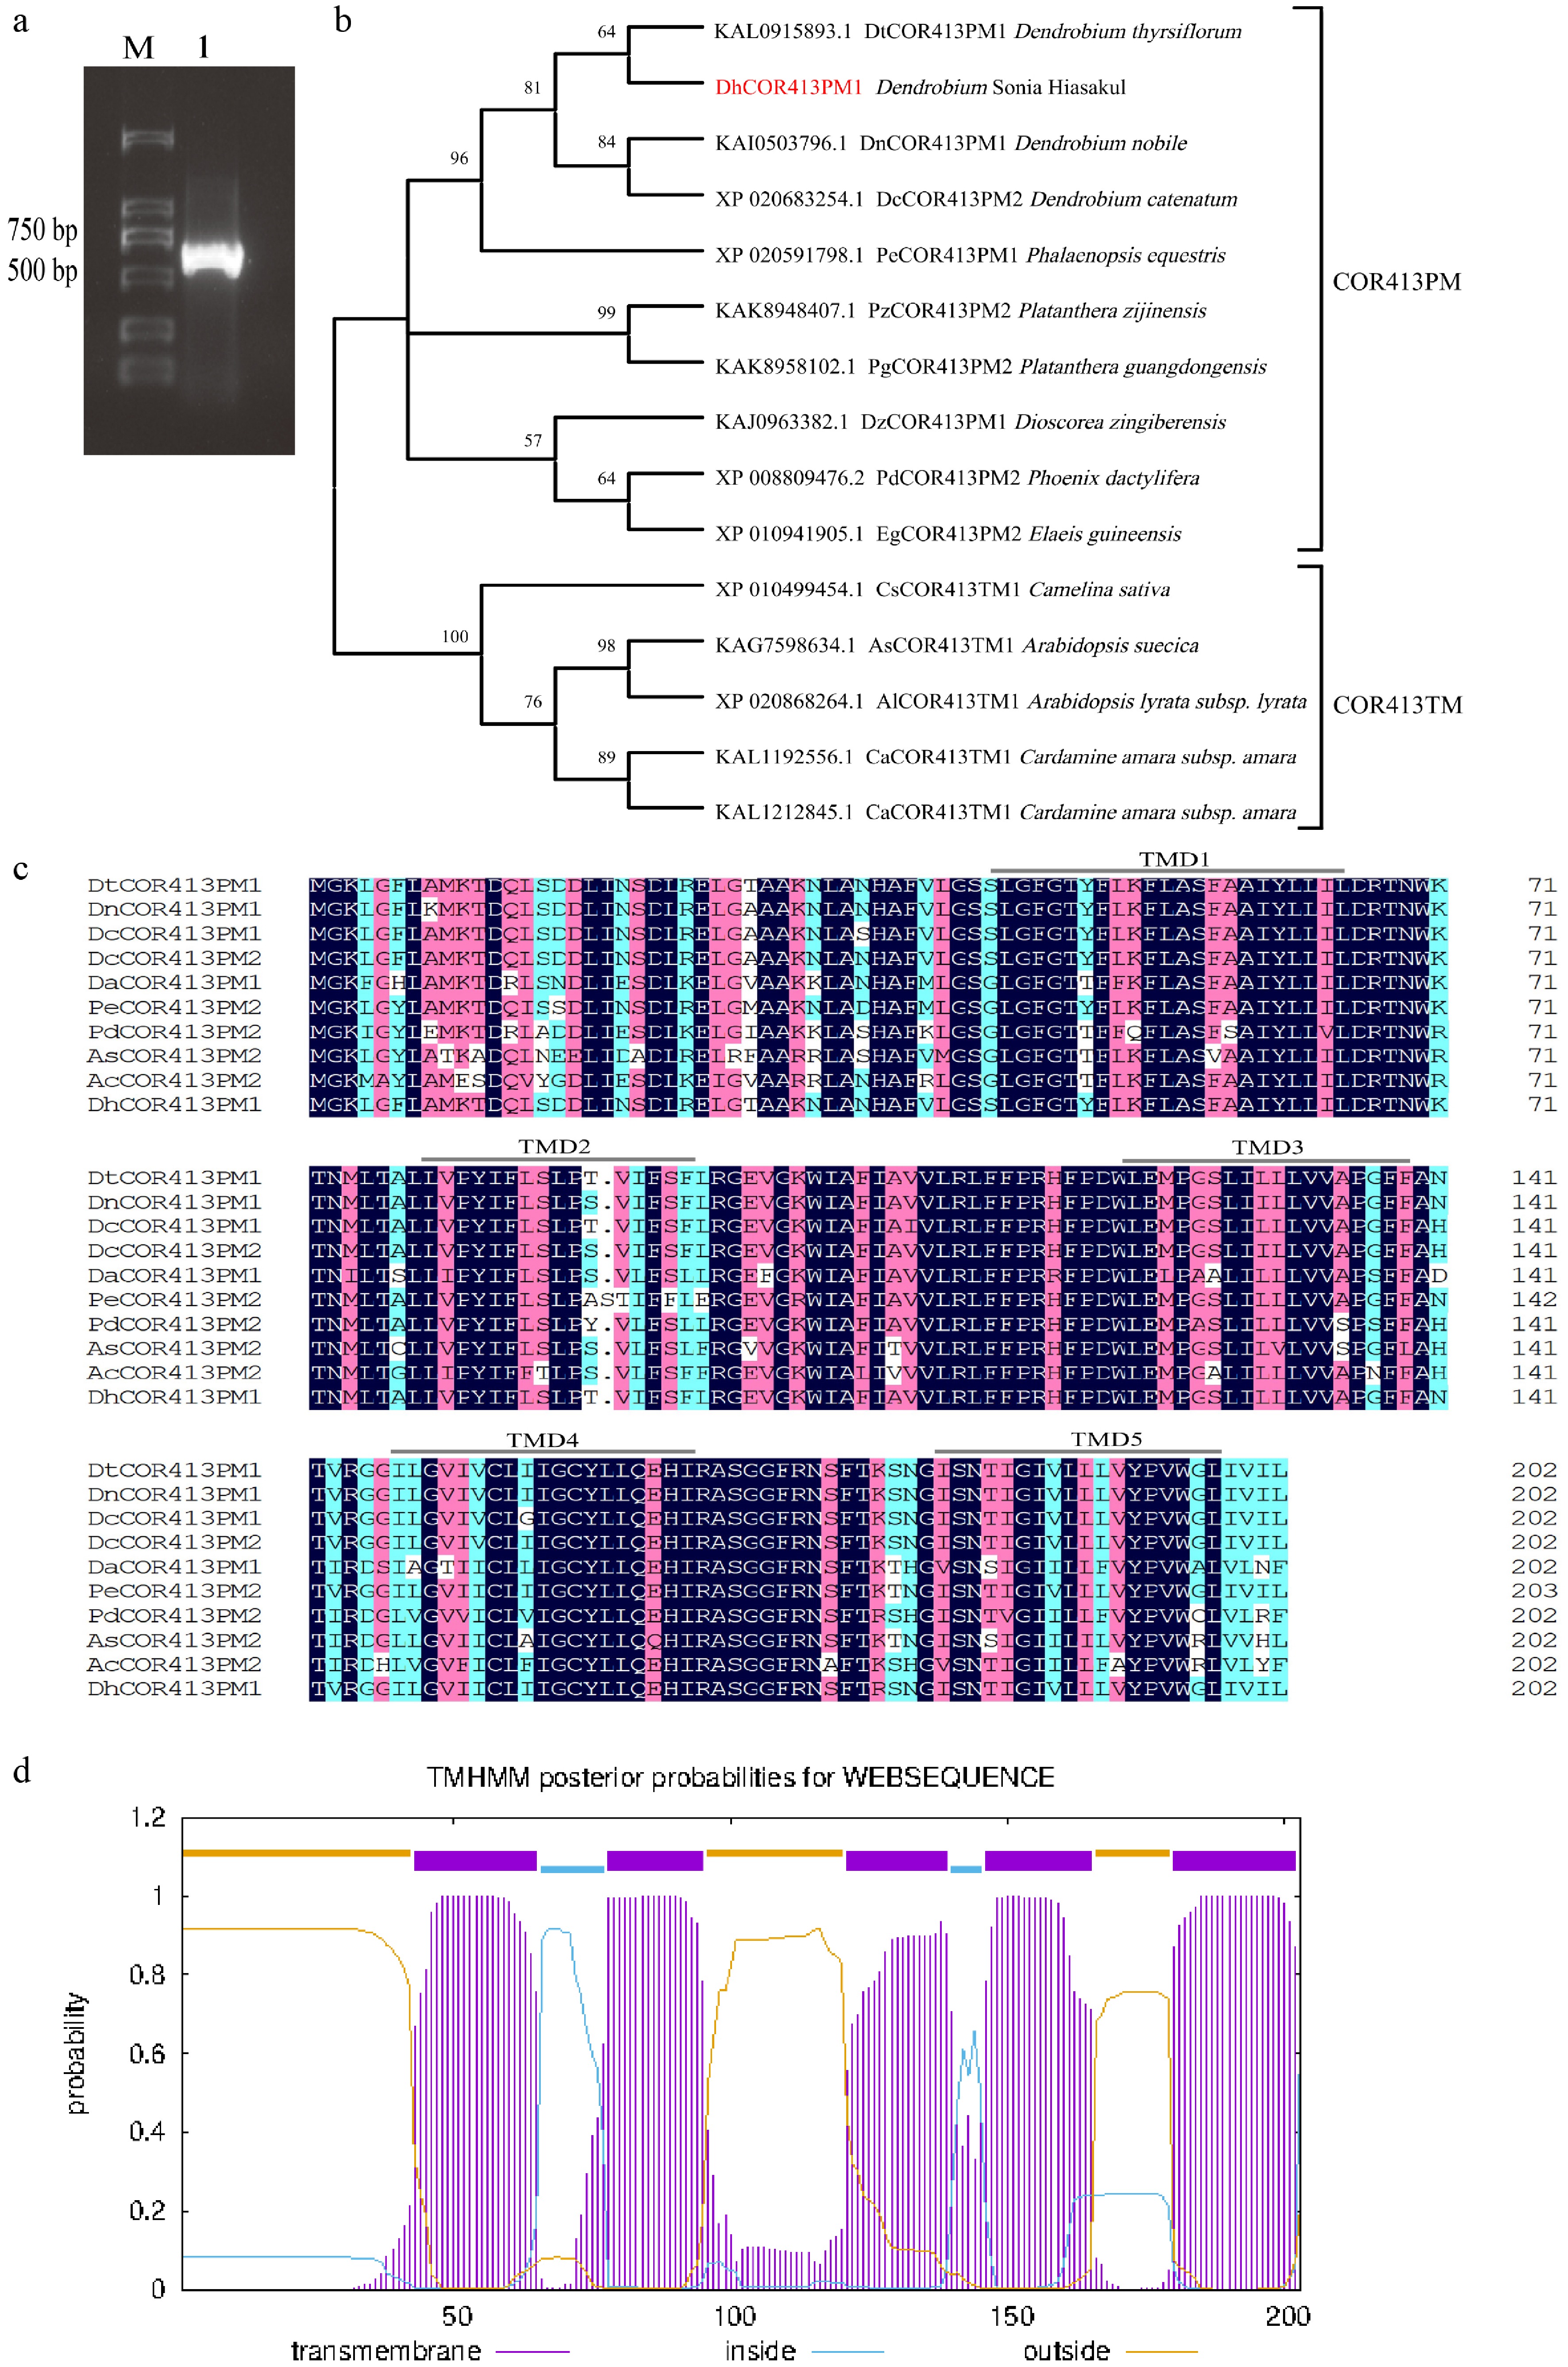
Figure 1.
Amplified CDS product, phylogenetic analysis, and sequence comparison of COR413 in Dendrobium. (a) Amplification of the DhCOR413PM1 CDS from Dendrobium. M, Marker; 1, DhCOR413PM1. (b) Phylogenetic analysis of DhCOR413PM1. (c) Sequence alignment of COR413 proteins across plant lineages. Conserved transmembrane domains (TMD1–5) were presented in lines. (d) The putative transmembrane domains of DhCOR413PM1.
-
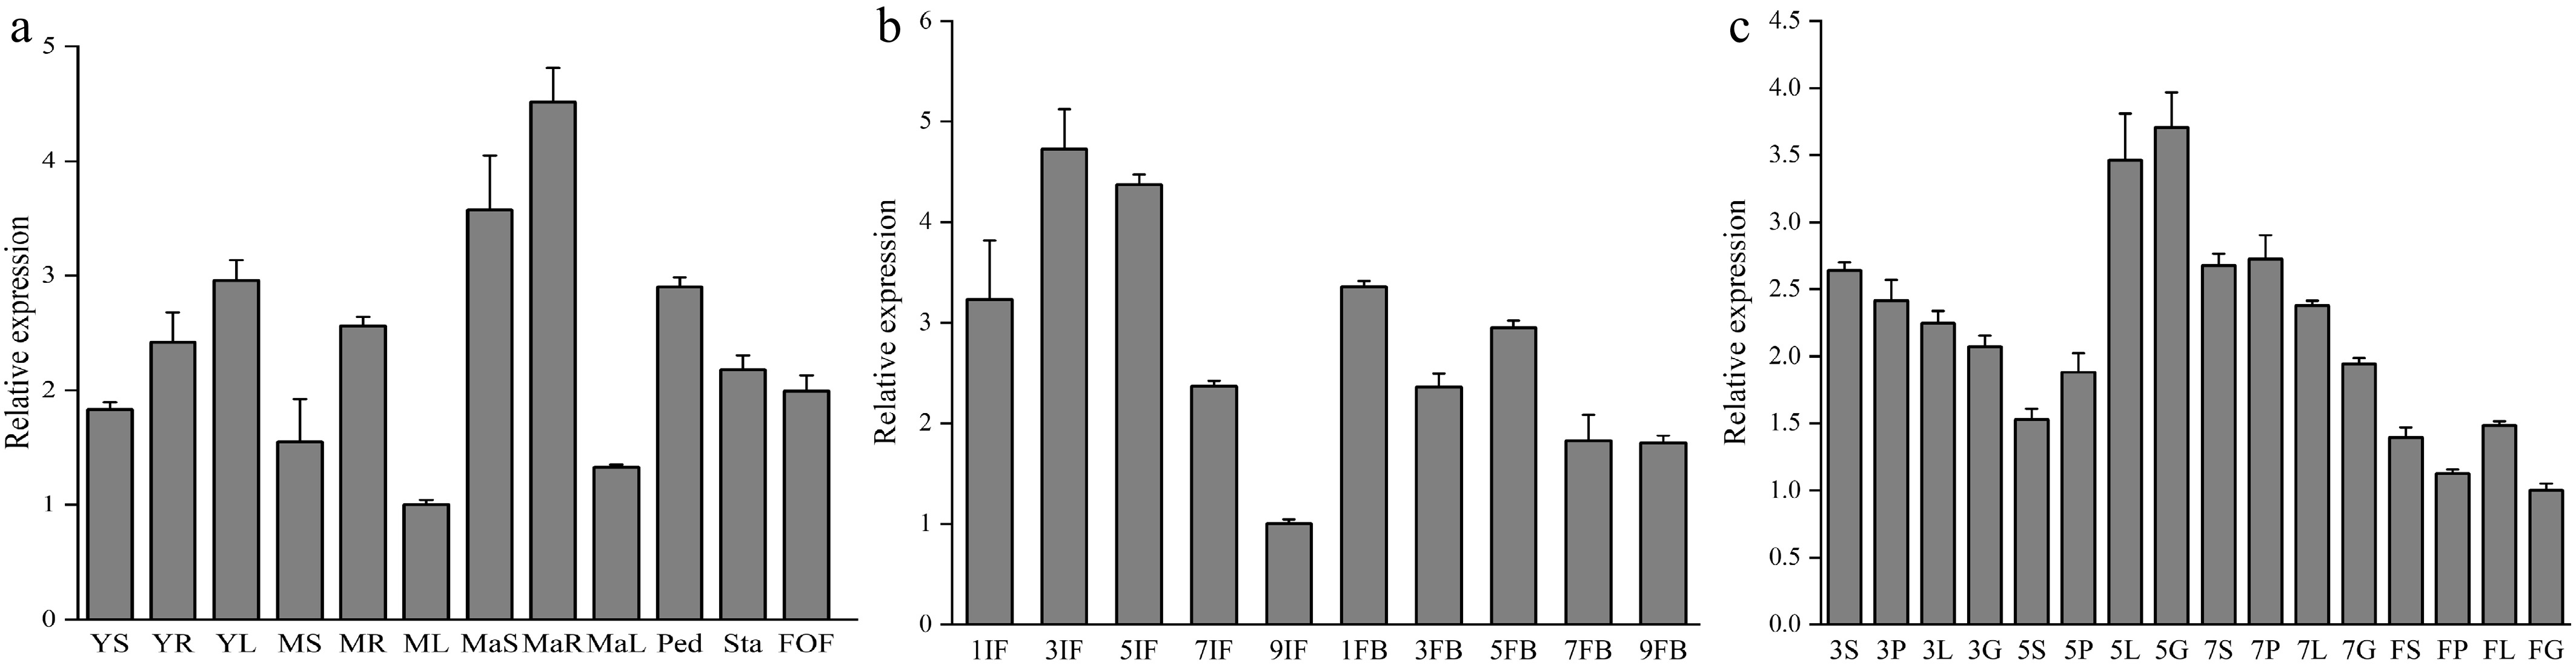
Figure 2.
Expression of DhCOR413PM1 in different tissues and floral organs during development. (a) Expression of DhCOR413PM1 in different tissues at various development stages. YS,YR, and YL are stem, root, and leaf of young seedlings (juvenile stage), respectively; MS, MR, and ML are stem, root, and leaf of middle-age seedling (vegetative stage), respectively; MaS, MaR, and MaL are stem, root, and leaf of mature plant (reproductive stage), respectively; Ped, peduncle; Sta, stalk; FOF, fully open flower. (b) Expression of DhCOR413PM1 in inflorescences and flower buds at different development stages. IF, inflorescence meristem (1–9 cm in length); FB, flower bud (1–9 mm in diameter). (c) Expression of DhCOR413PM1 in floral organs at different development stages (3–7 mm diameter flower bud and fully open flower). S, Sepals; P, Petals; L, Labellum; G, gynandrium. Error bars represent ± SE of the three biological replicates.
-
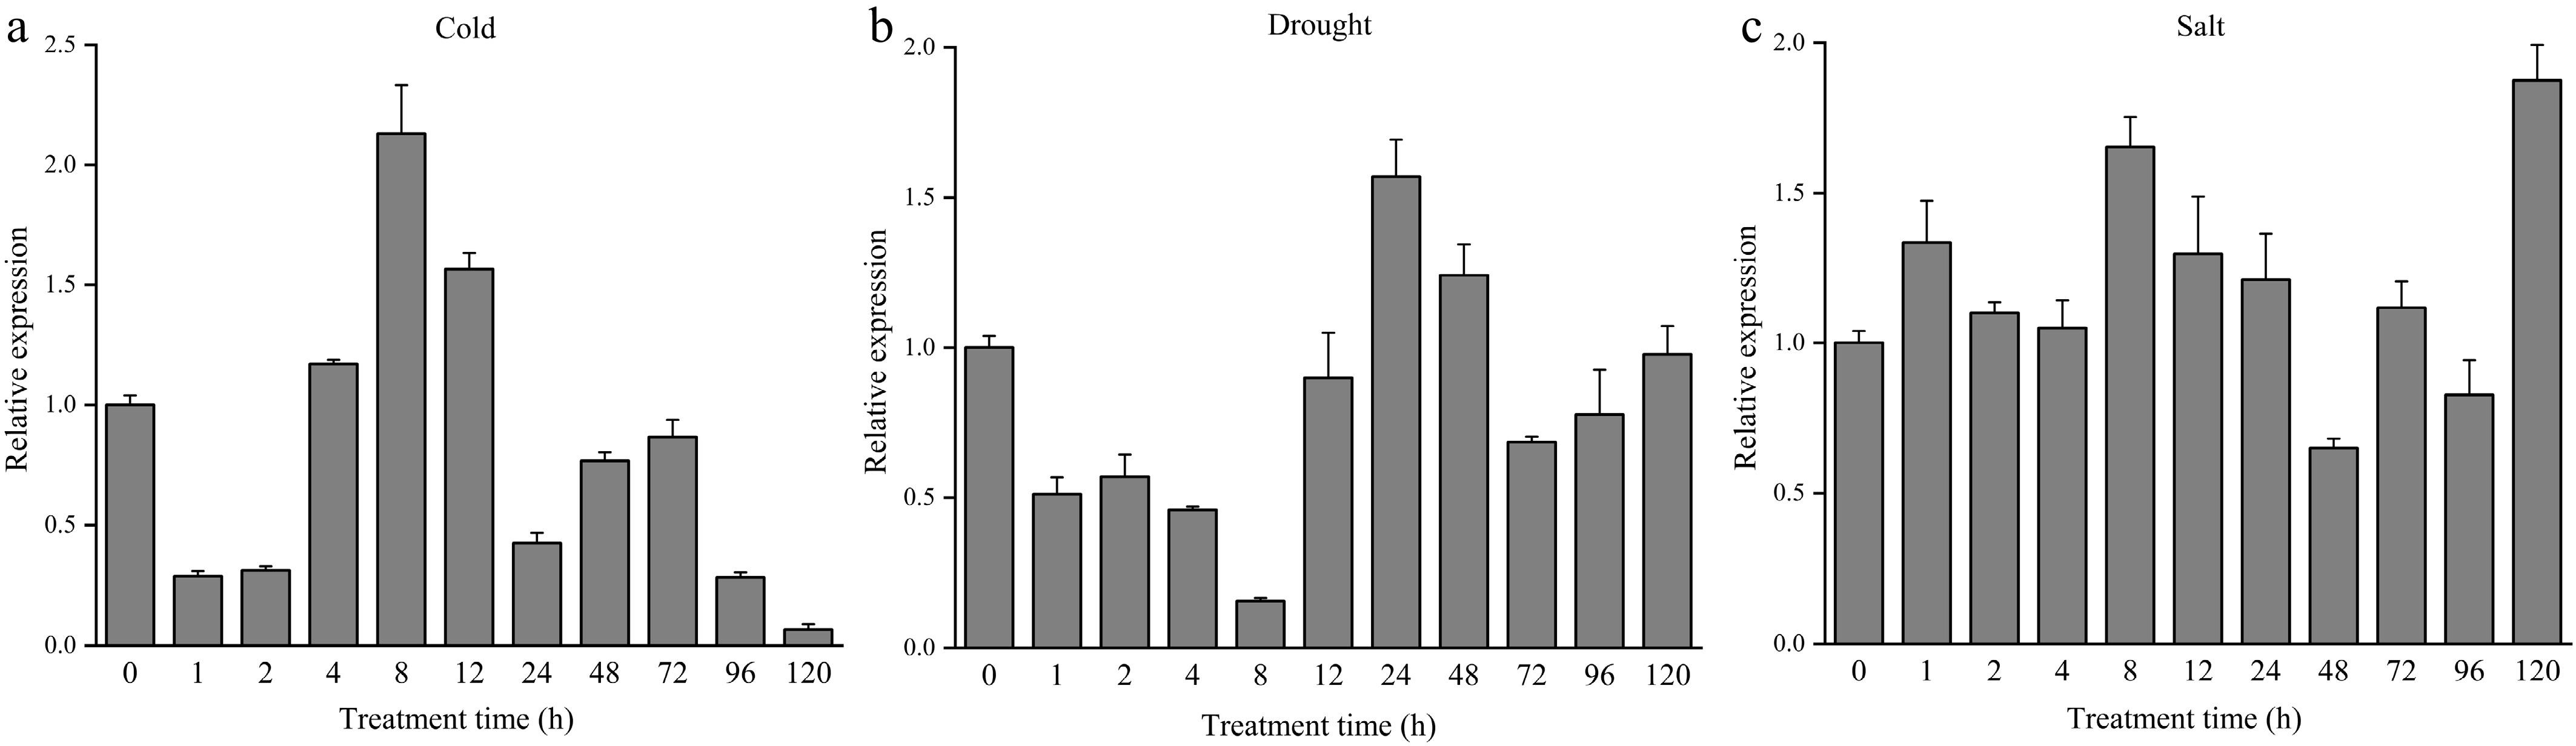
Figure 3.
Expression of DhCOR413PM1 in Dendrobium under abiotic stresses over time. (a) Expression of DhCOR413PM1 under low-temperature treatment (4 °C). (b) Expression of DhCOR413PM1 under drought stress (15% PEG-6000). (c) Expression of DhCOR413PM1 under salt stress (50 mM NaCl). Error bars represent ± SE of the three biological replicates.
-
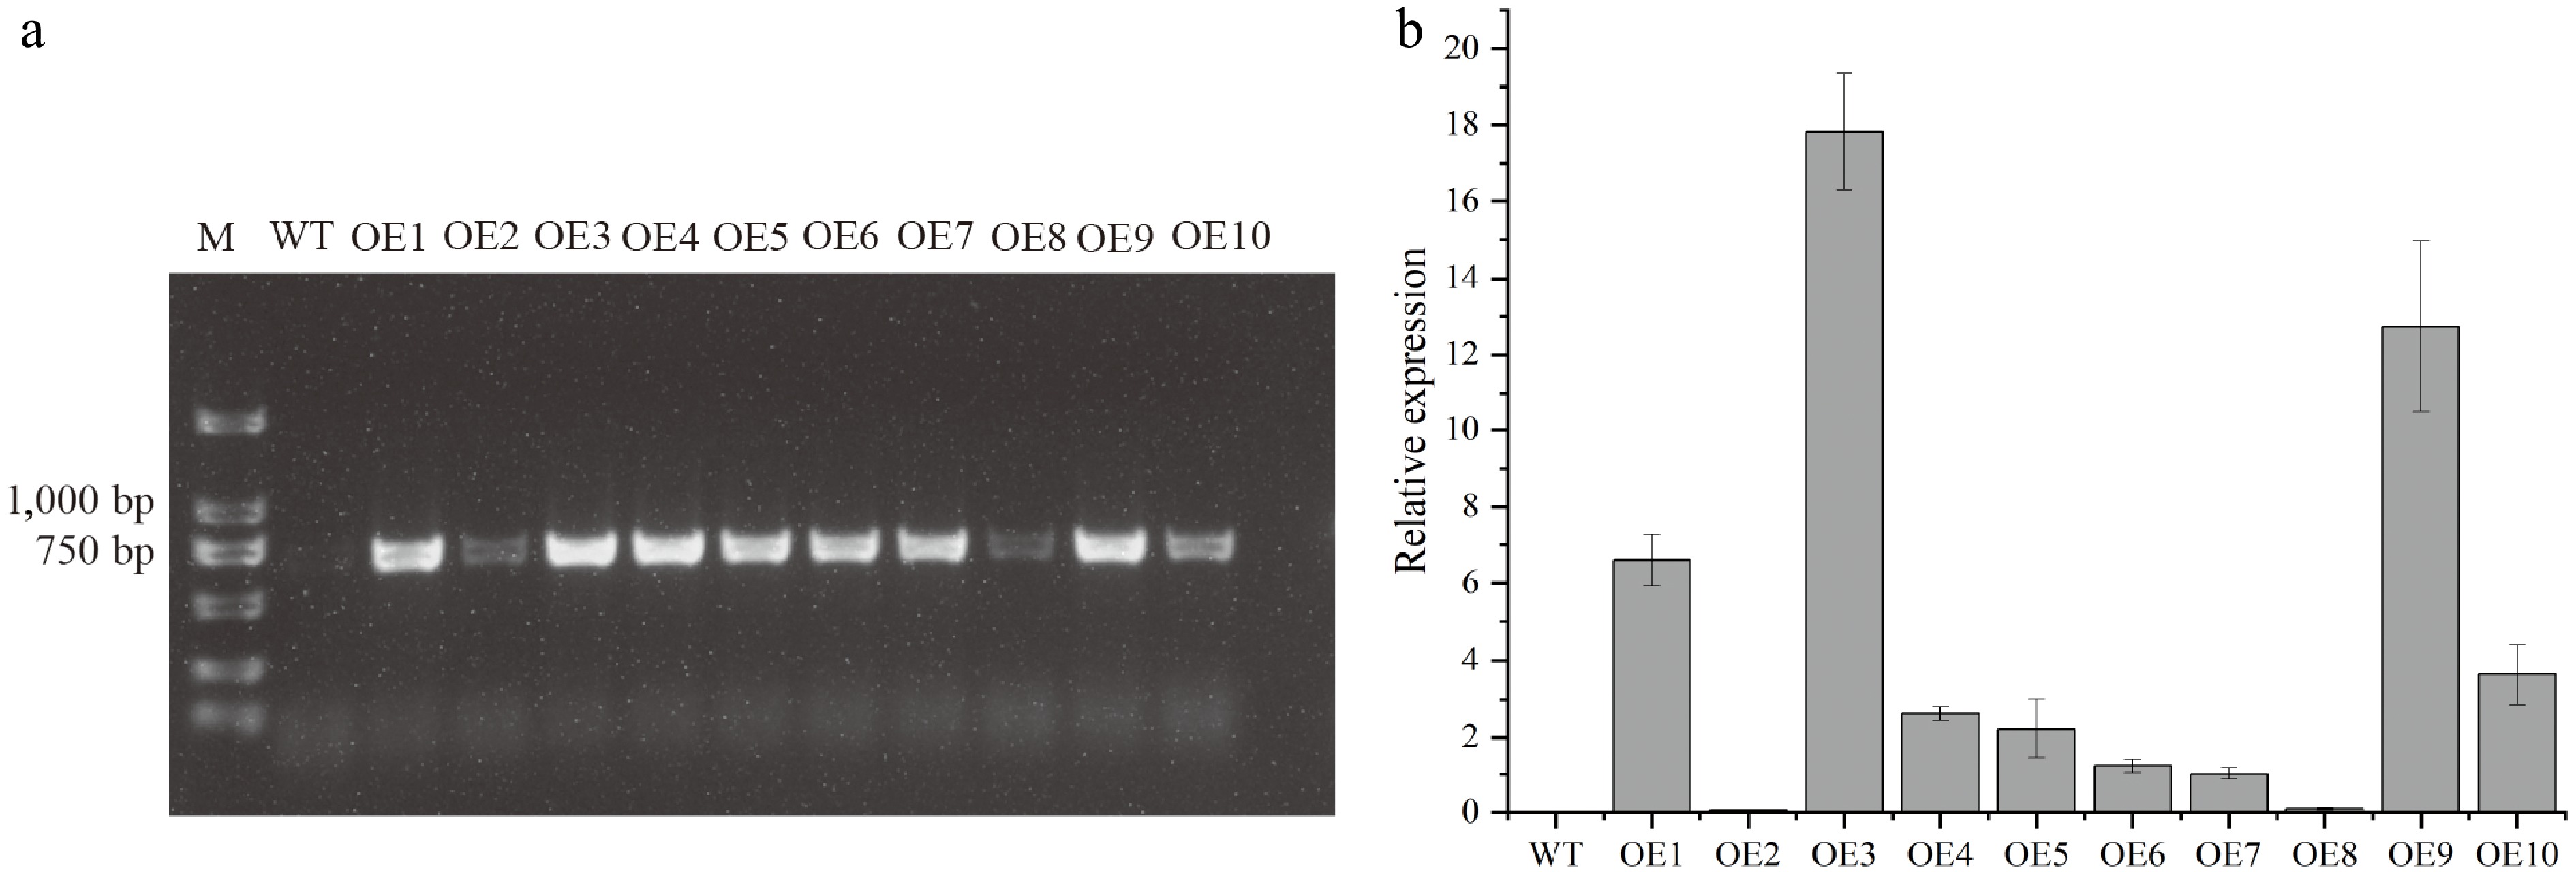
Figure 4.
Transgenic validation and gene expression in Arabidopsis thaliana. (a) PCR verification of DhCOR413PM1 integration using CaMV35S promoter and gene-specific primers. M: Marker; WT: Wild-type; OE1–10: Independent transgenic lines. (b) DhCOR413PM1 transcript levels in T3 homozygous lines as quantified by qRT-PCR. Error bars represent ± SE of the three biological replicates.
-
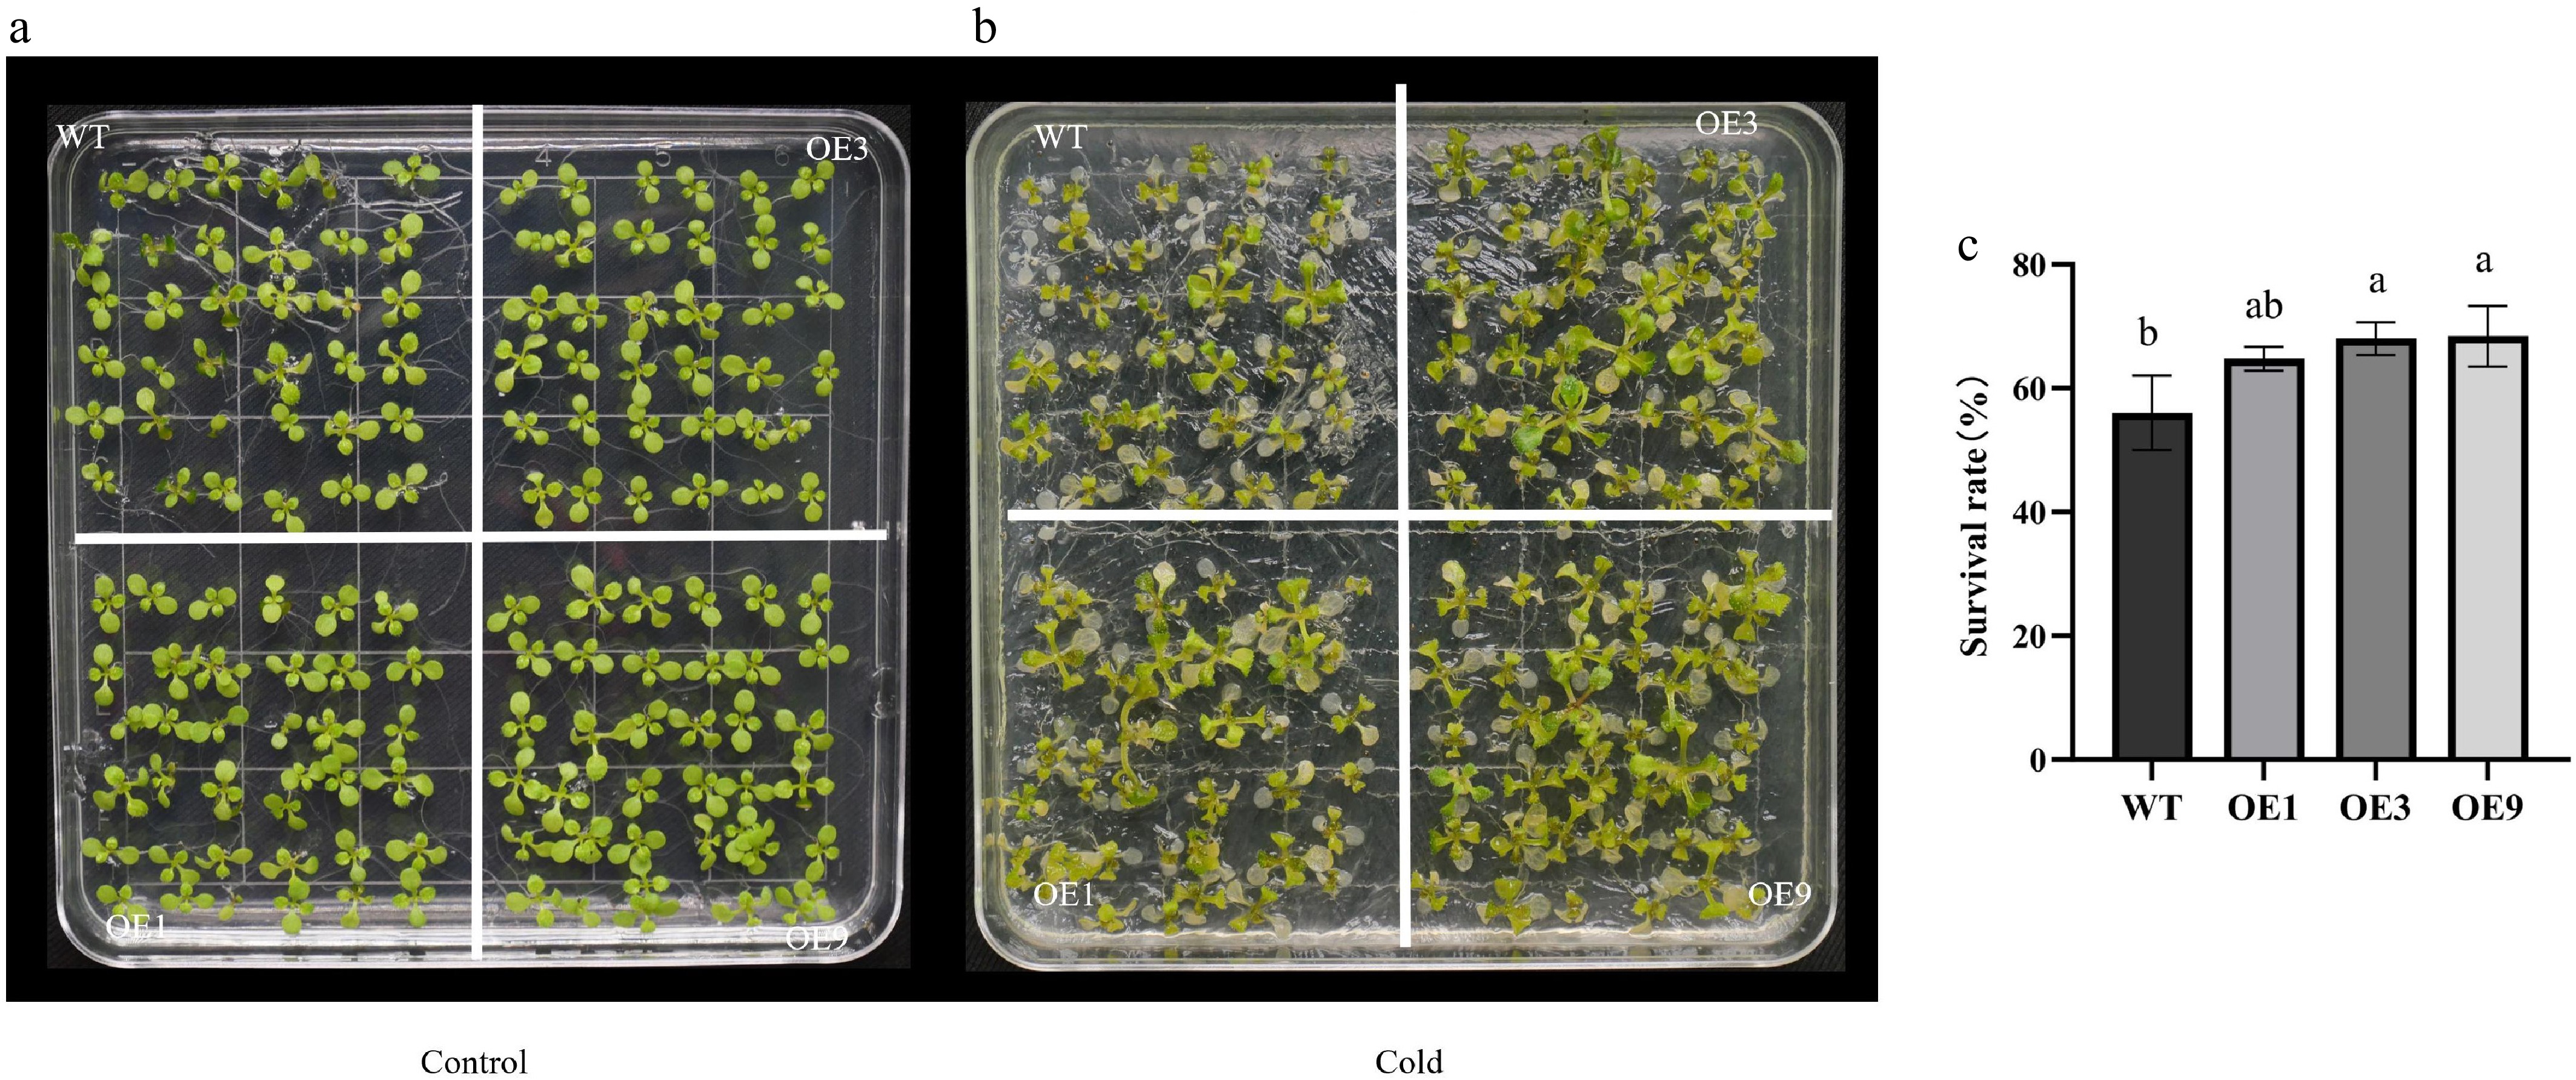
Figure 5.
Freezing tolerance analysis of 35S::DhCOR413PM1 overexpressing Arabidopsis. (a) Phenotypes under non-stress conditions. (b) Phenotypes after freezing stress. (c) Survival rates after freezing stress. WT: wild-type; OE: 35S::DhCOR413PM1 overexpression lines. Error bars represent ± SE of the three biological replicates. Different letters above the bars indicate significant differences (p < 0.01) according to the DNMRT.
-
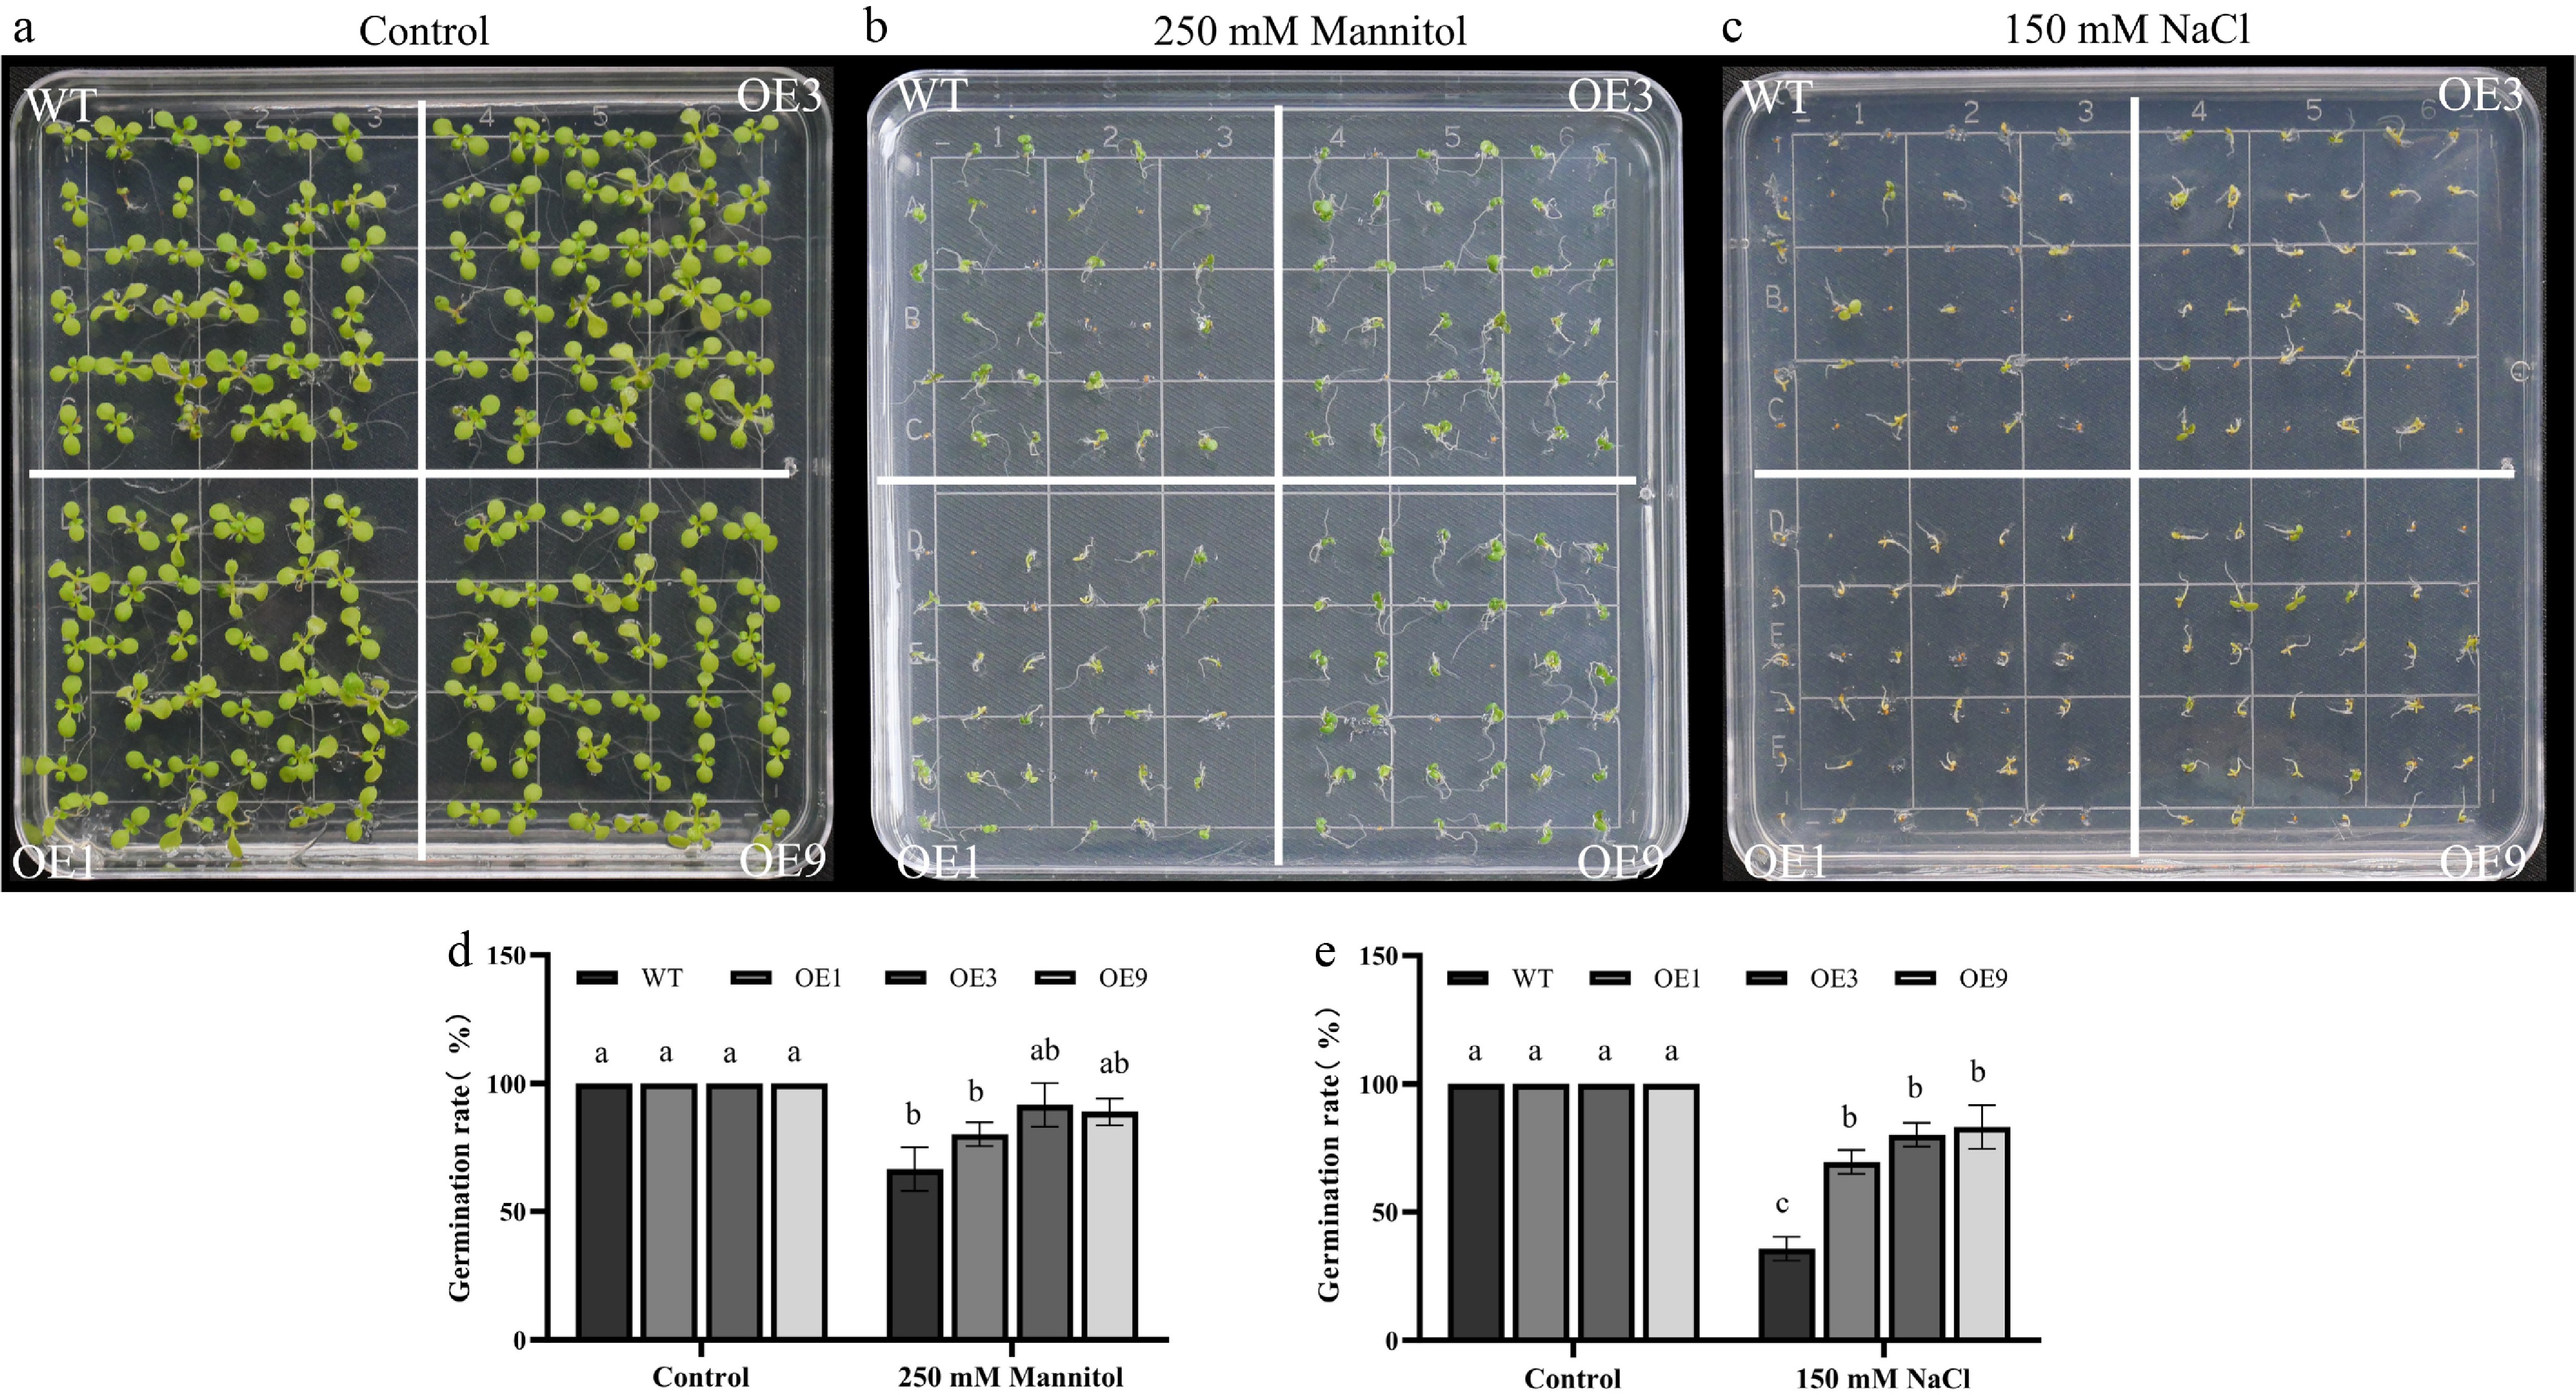
Figure 6.
Drought and salinity tolerance of 35S::DhCOR413PM1 overexpressing Arabidopsis. (a) Phenotypes under control conditions. (b) Response to osmotic stress (250 mM mannitol). (c) Response to salt stress (150 mM NaCl). (d) Germination rates under osmotic stress. (e) Germination rates under salt stress. WT: wild-type; OE: 35S::DhCOR413PM1-overexpression lines. Error bars represent ± SE of the three biological replicates. Different letters above the bars indicate significant differences (p < 0.01) according to the DNMRT.
-
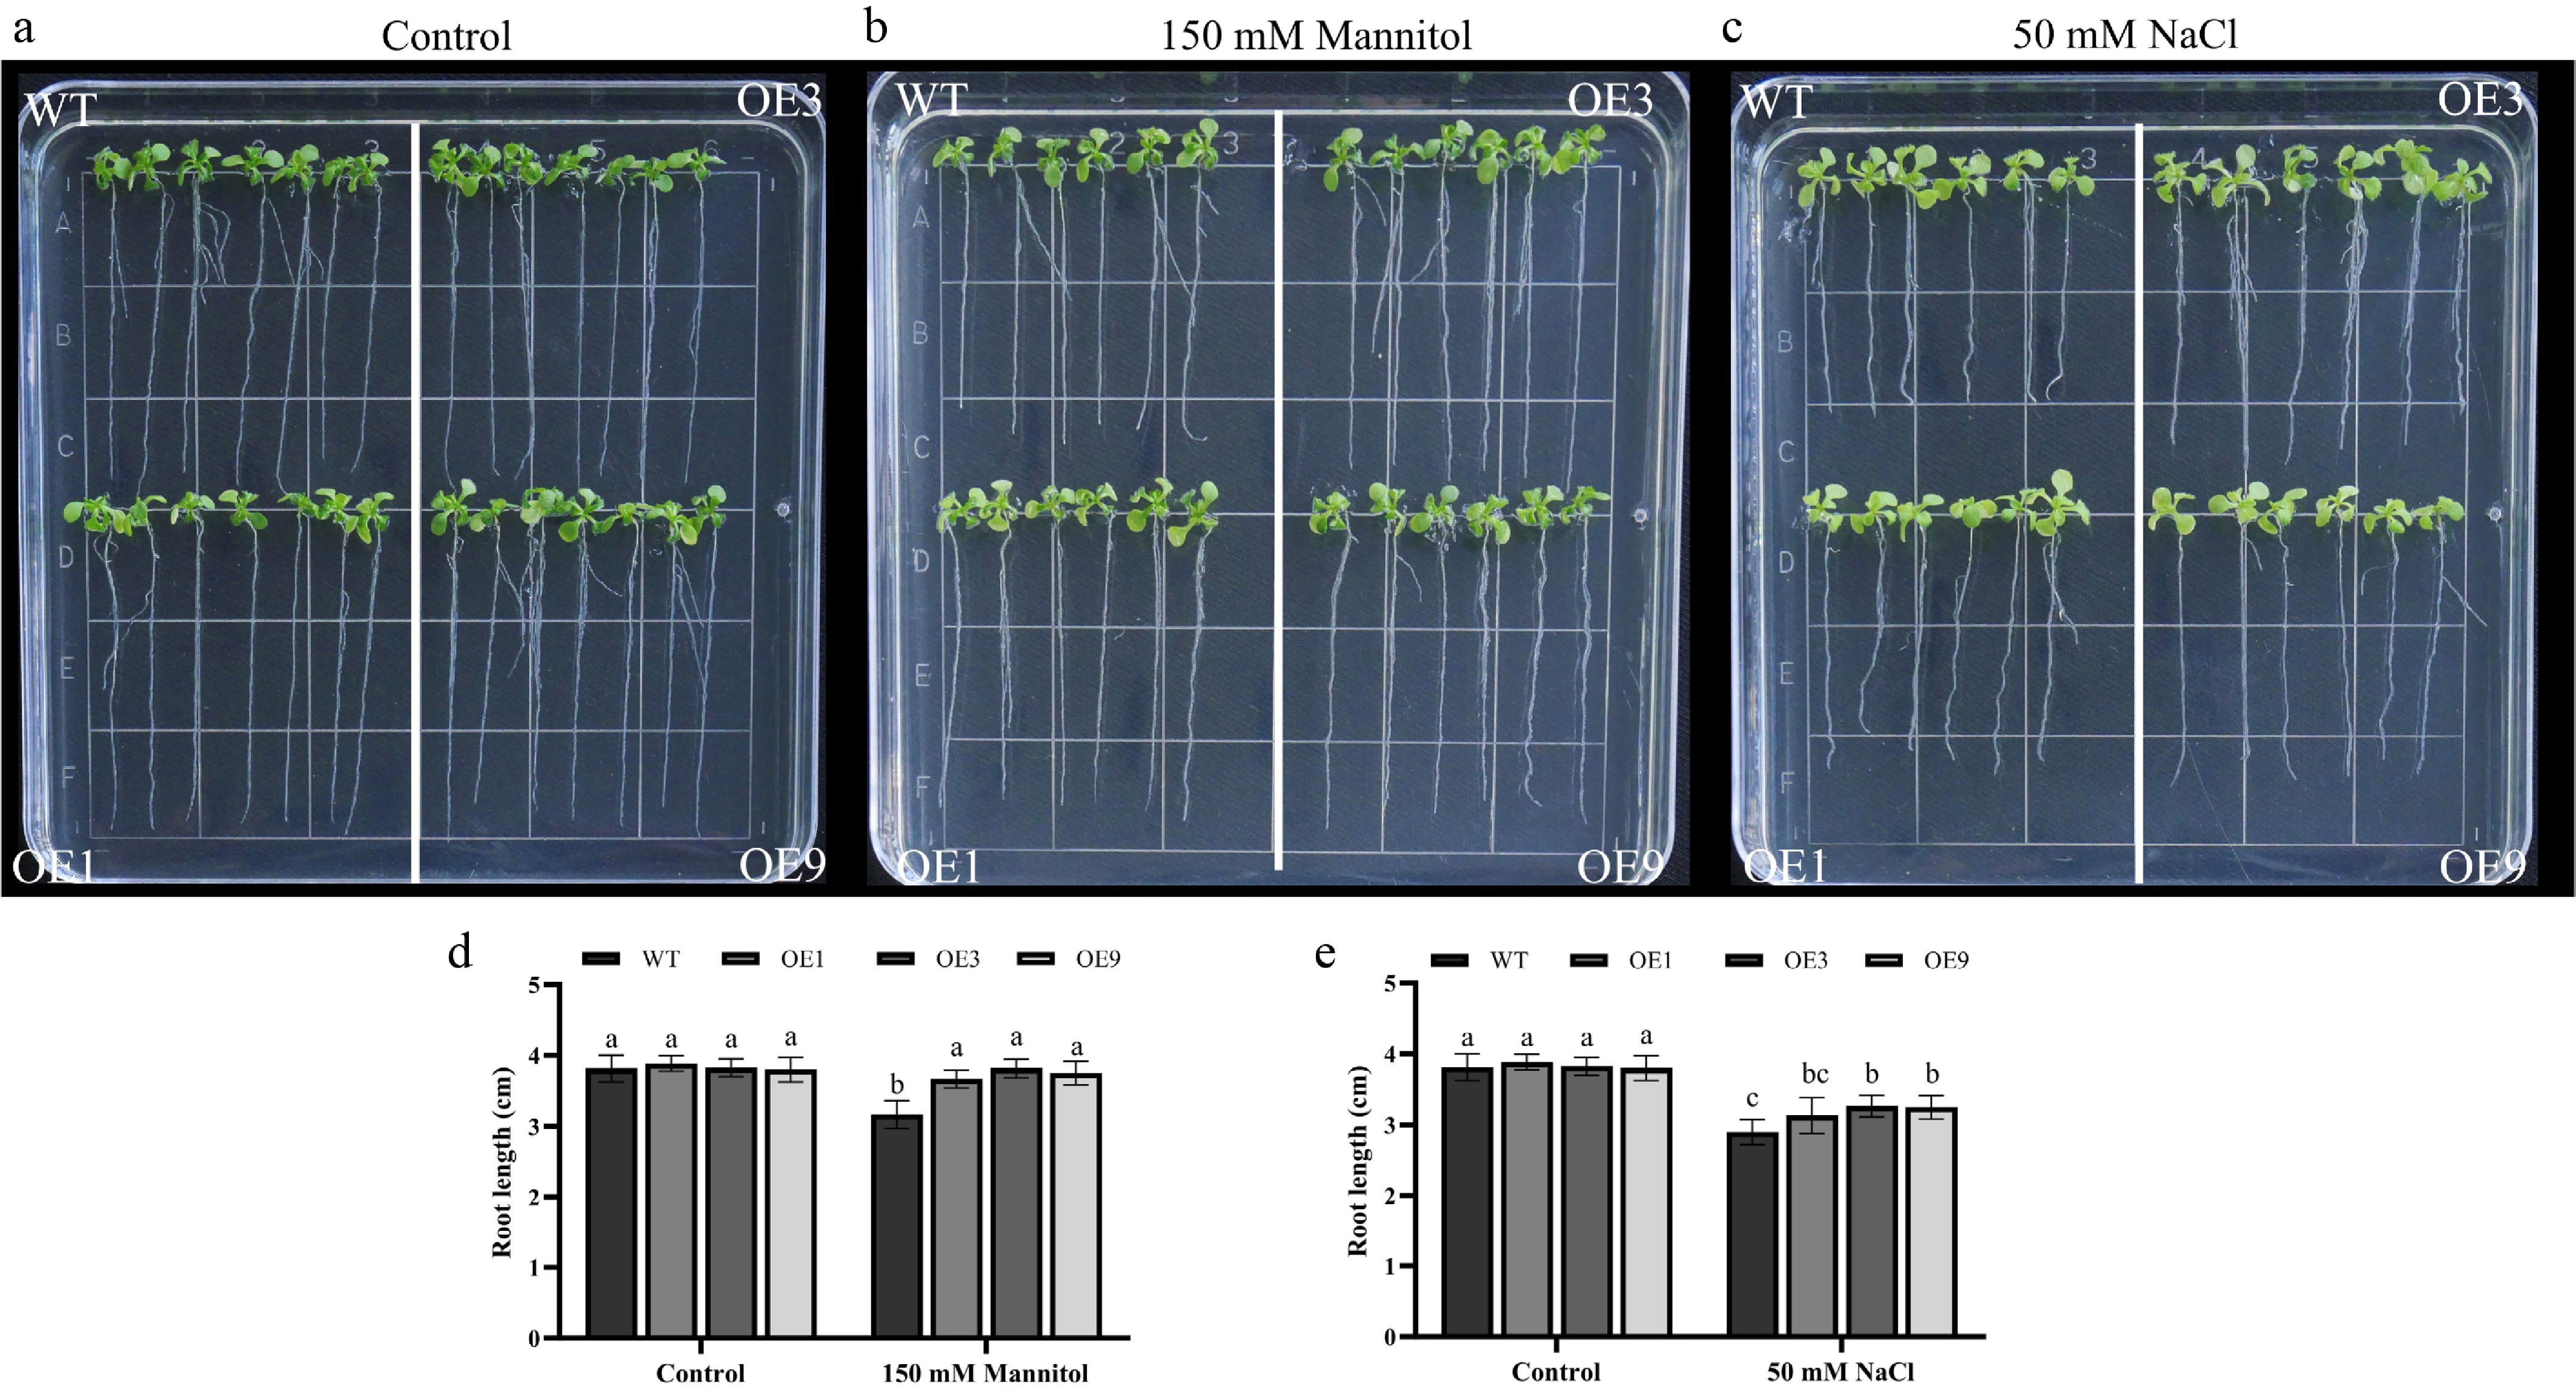
Figure 7.
Root elongation analysis of 35S::DhCOR413PM1 overexpressing Arabidopsis under osmotic and salt stress. (a) Root growth status under normal conditions. (b) Response to osmotic stress (150 mM mannitol). (c) Response to salt stress (50 mM NaCl). (d) Primary root length under osmotic stress. (e) Primary root length under salt stress. WT: wild-type; OE: 35S::DhCOR413PM1 overexpression lines. Error bars represent ± SE of the three biological replicates. Different letters above the bars indicate significant differences (p < 0.01) according to the DNMRT.
Figures
(7)
Tables
(0)