-
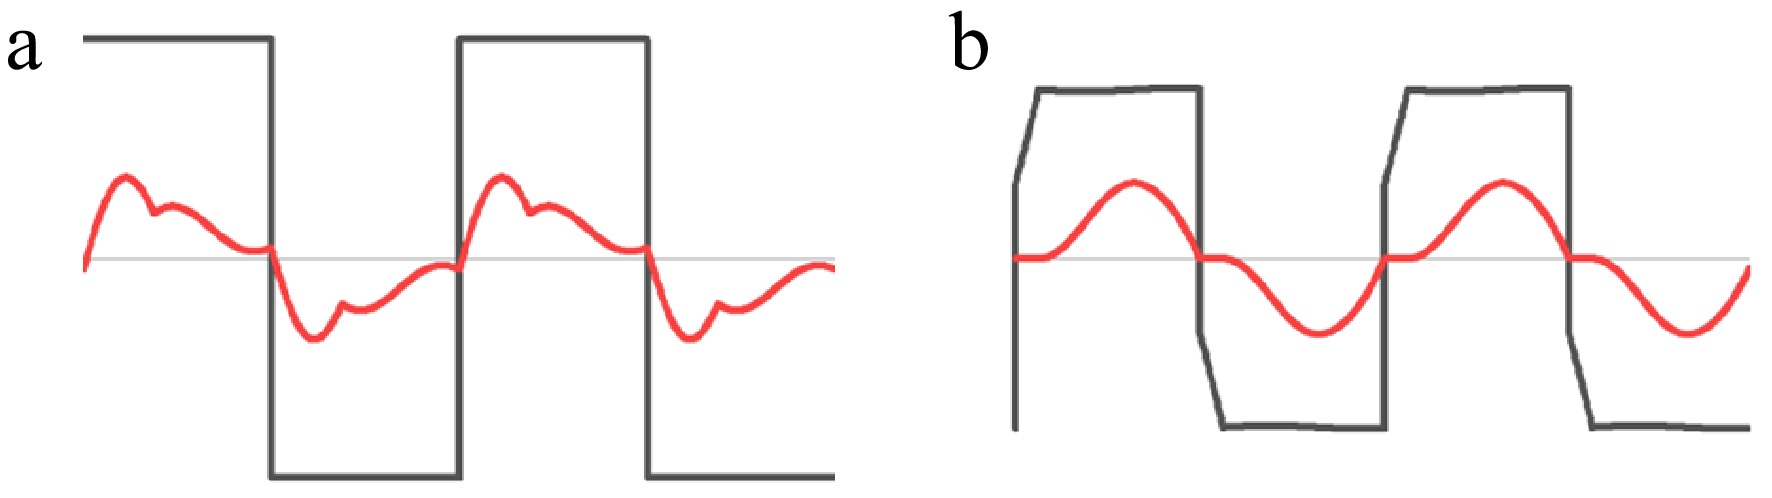
Figure 1.
Effects of strong coupling on system performance. (a) High harmonic content. (b) Discontinuous current mode.
-
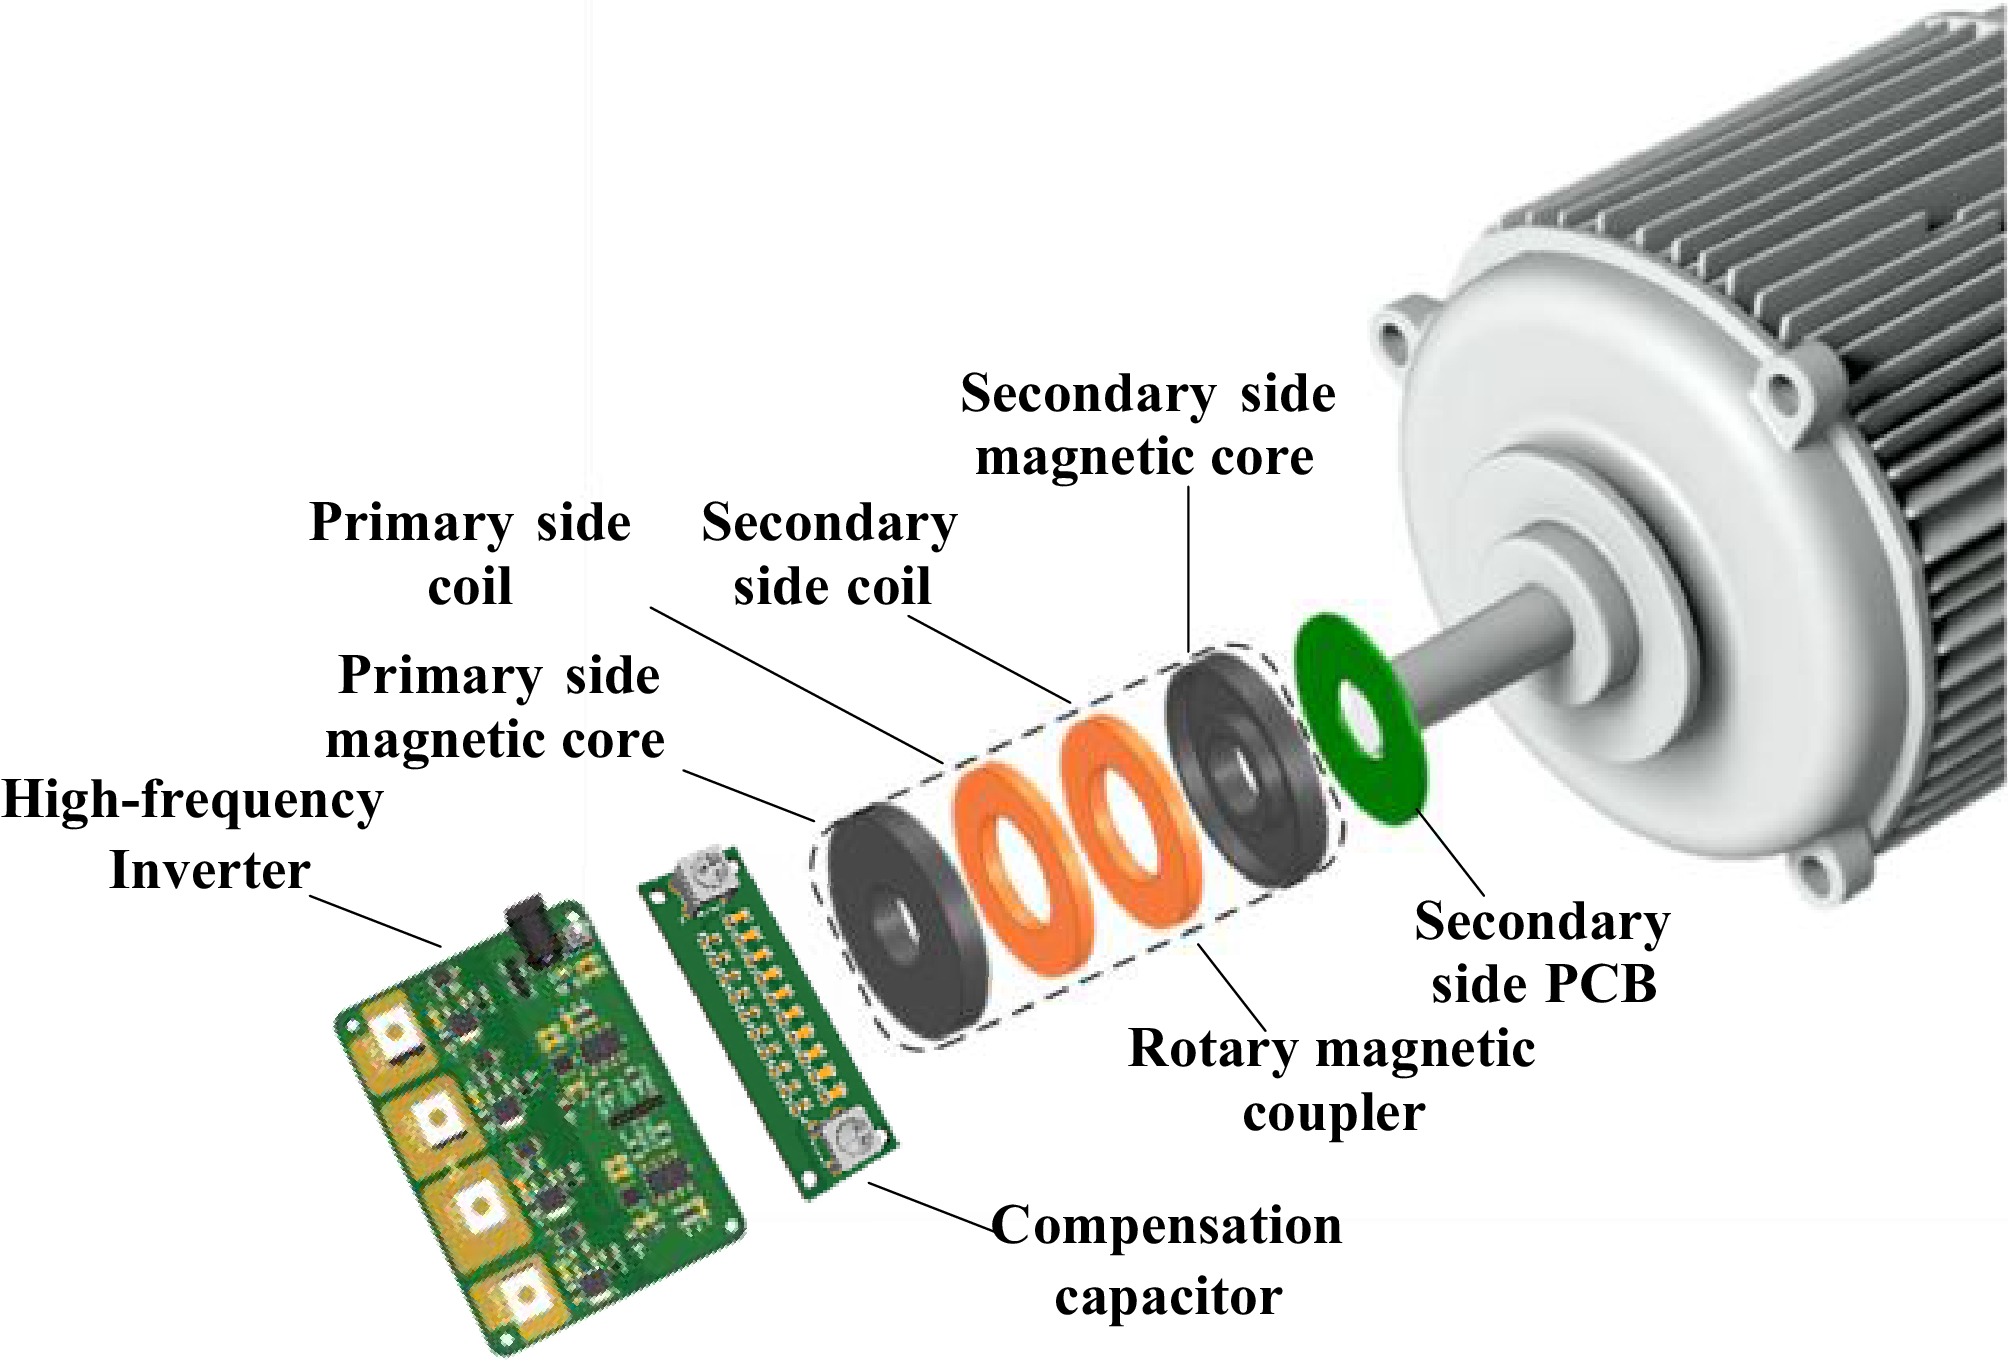
Figure 2.
Exploded diagram of S-N topology wireless excitation system.
-
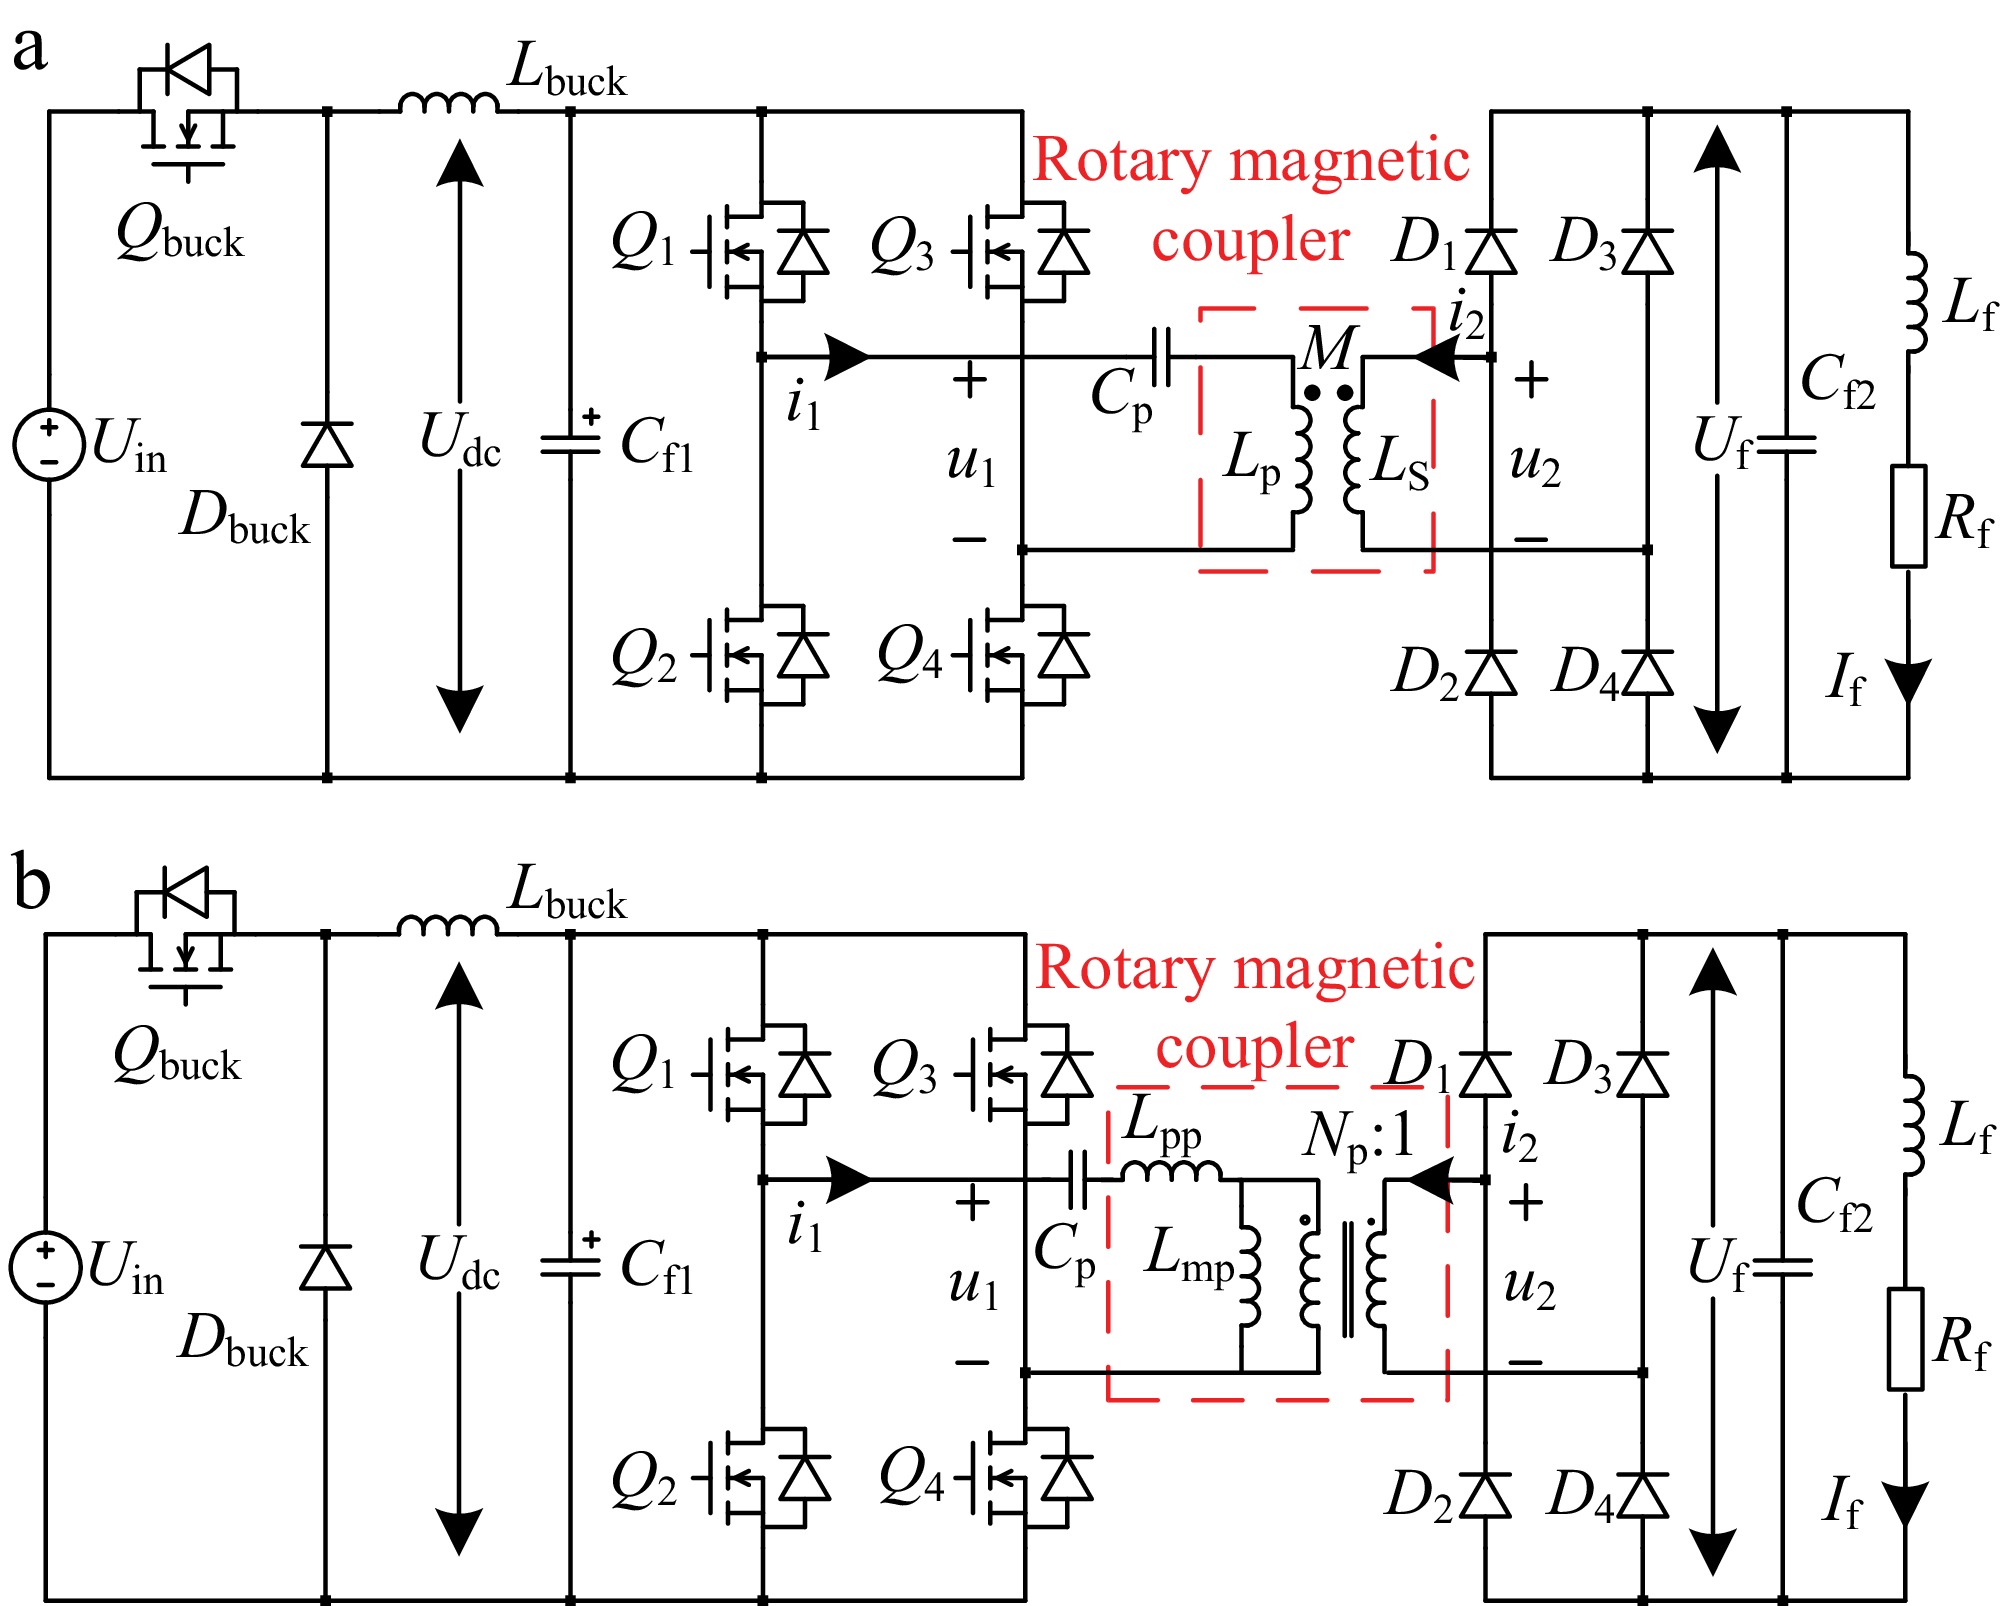
Figure 3.
Wireless excitation systems with S-N topology based on different equivalent models. (a) Based on mutual inductance model. (b) Based on single leakage inductance model.
-
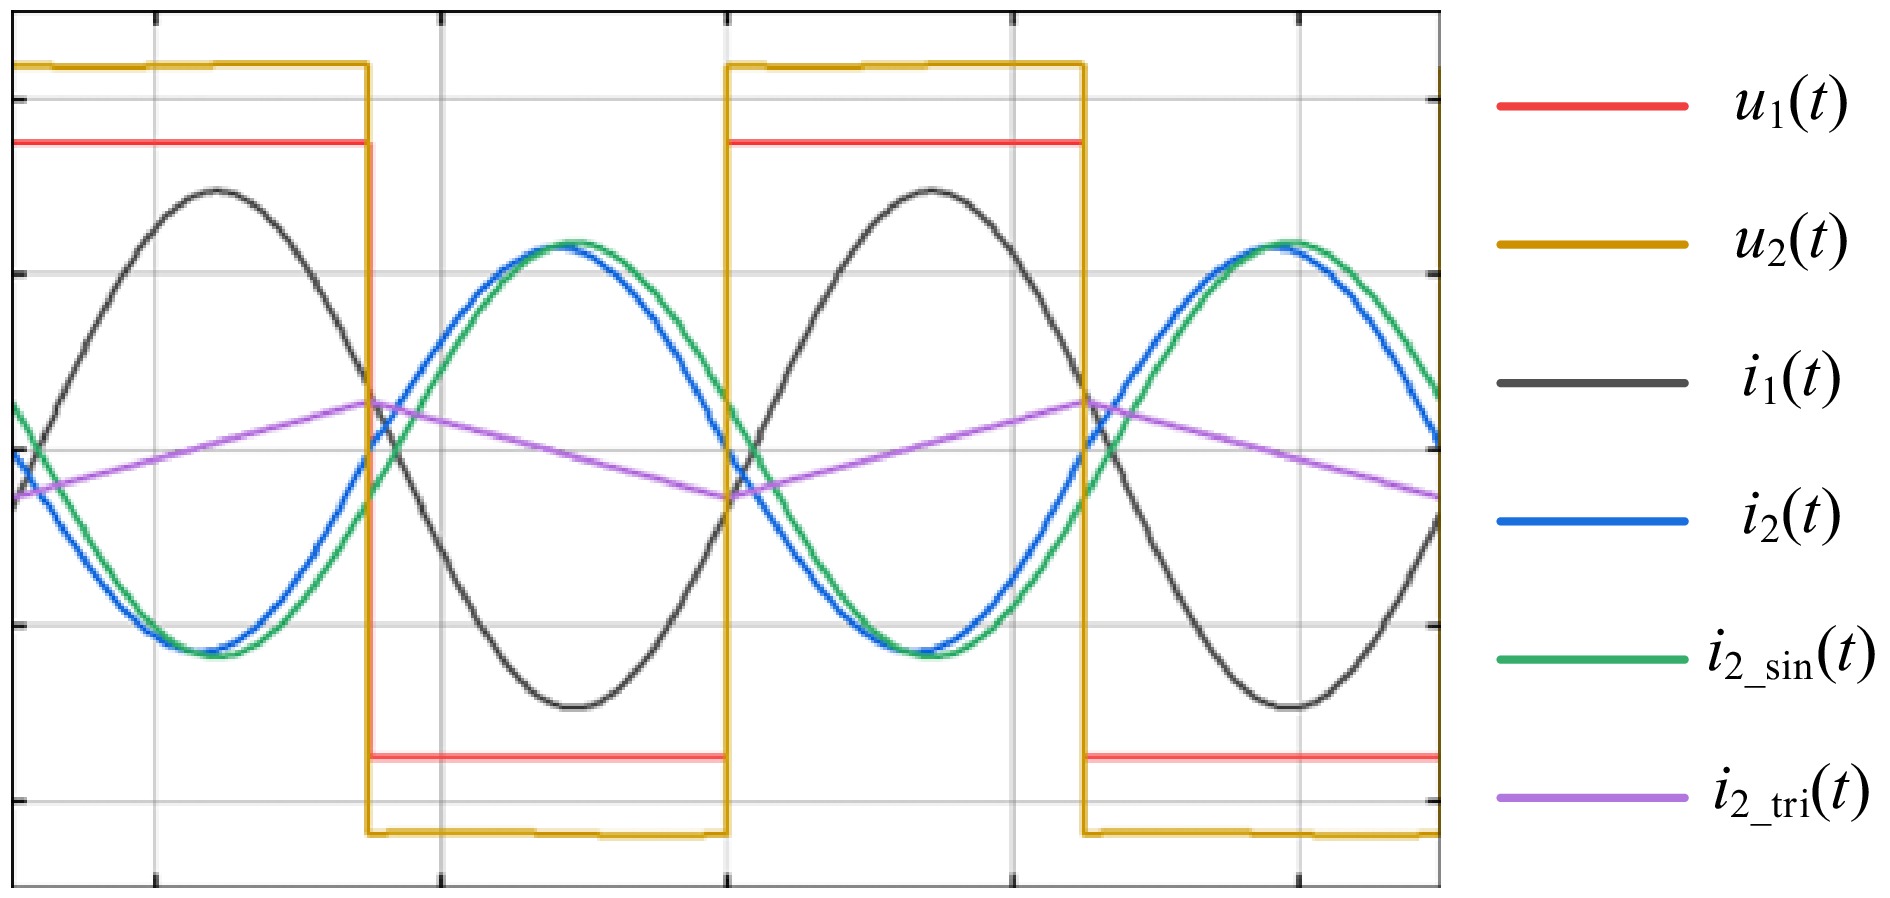
Figure 4.
Voltage and current waveforms of primary and secondary sides.
-
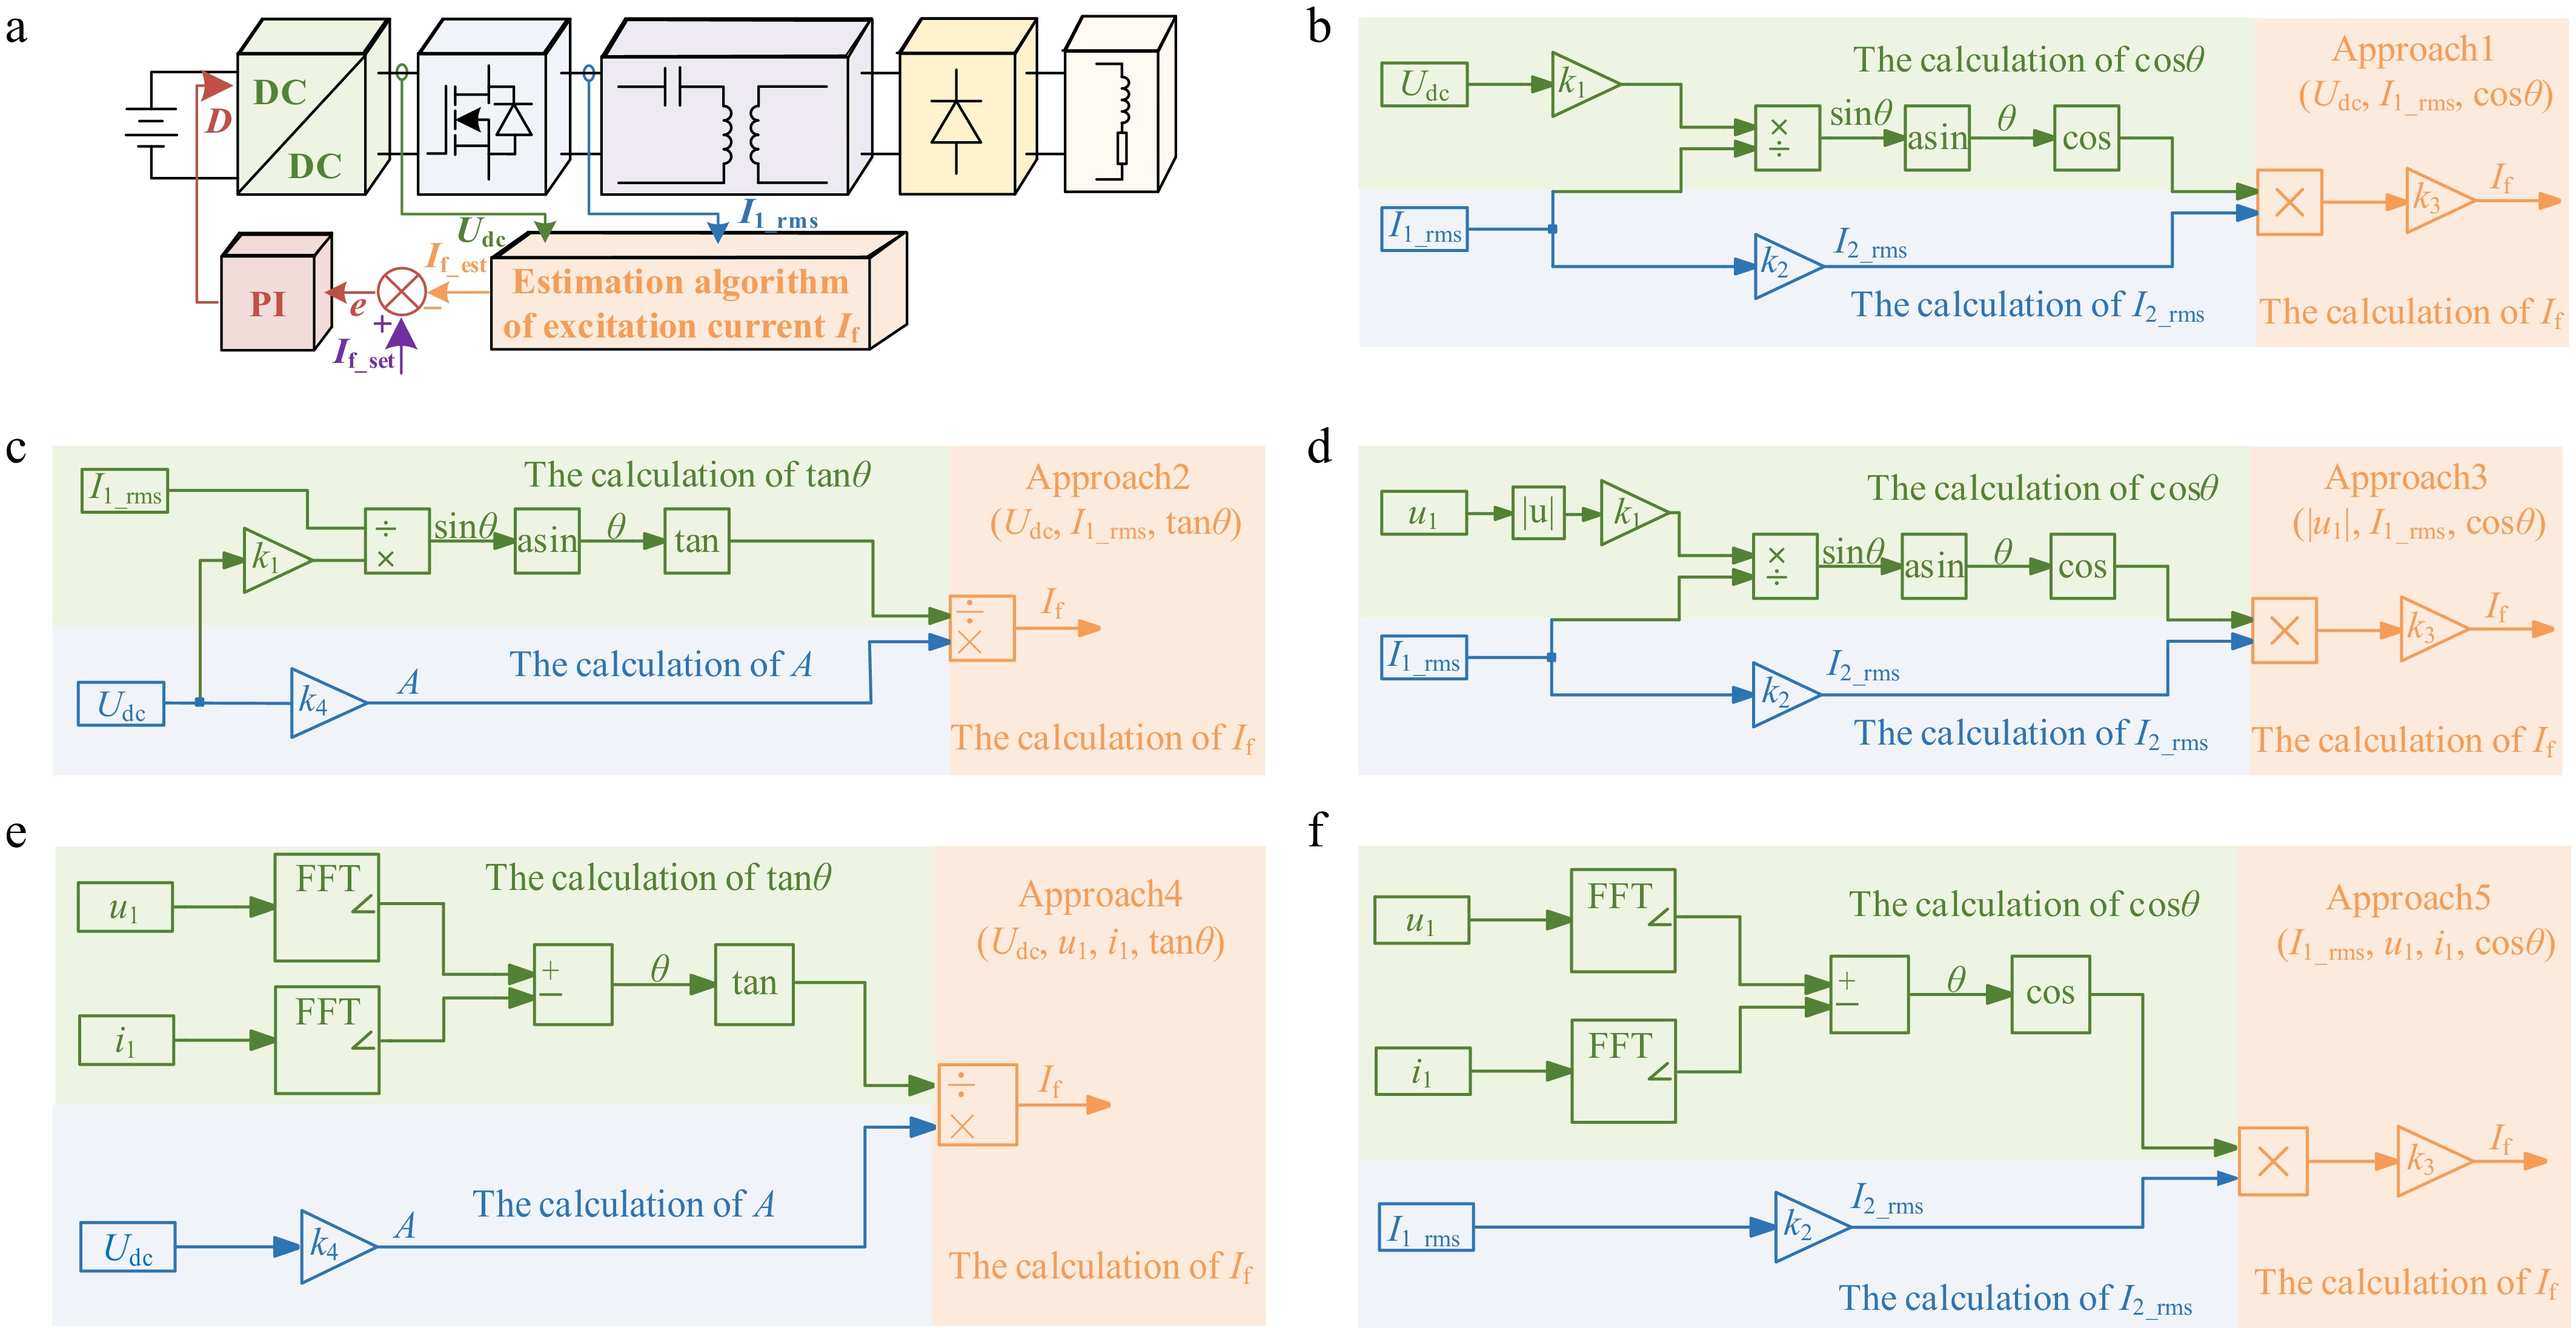
Figure 5.
Control block diagram of wireless excitation system and the principle block diagram of five different estimation approaches. (a) Control block diagram of wireless excitation system. (b) Principle block diagram of approach 1. (c) Principle block diagram of approach 2. (d) Principle block diagram of approach 3. (e) Principle block diagram of approach 4. (f) Principle block diagram of approach 5.
-
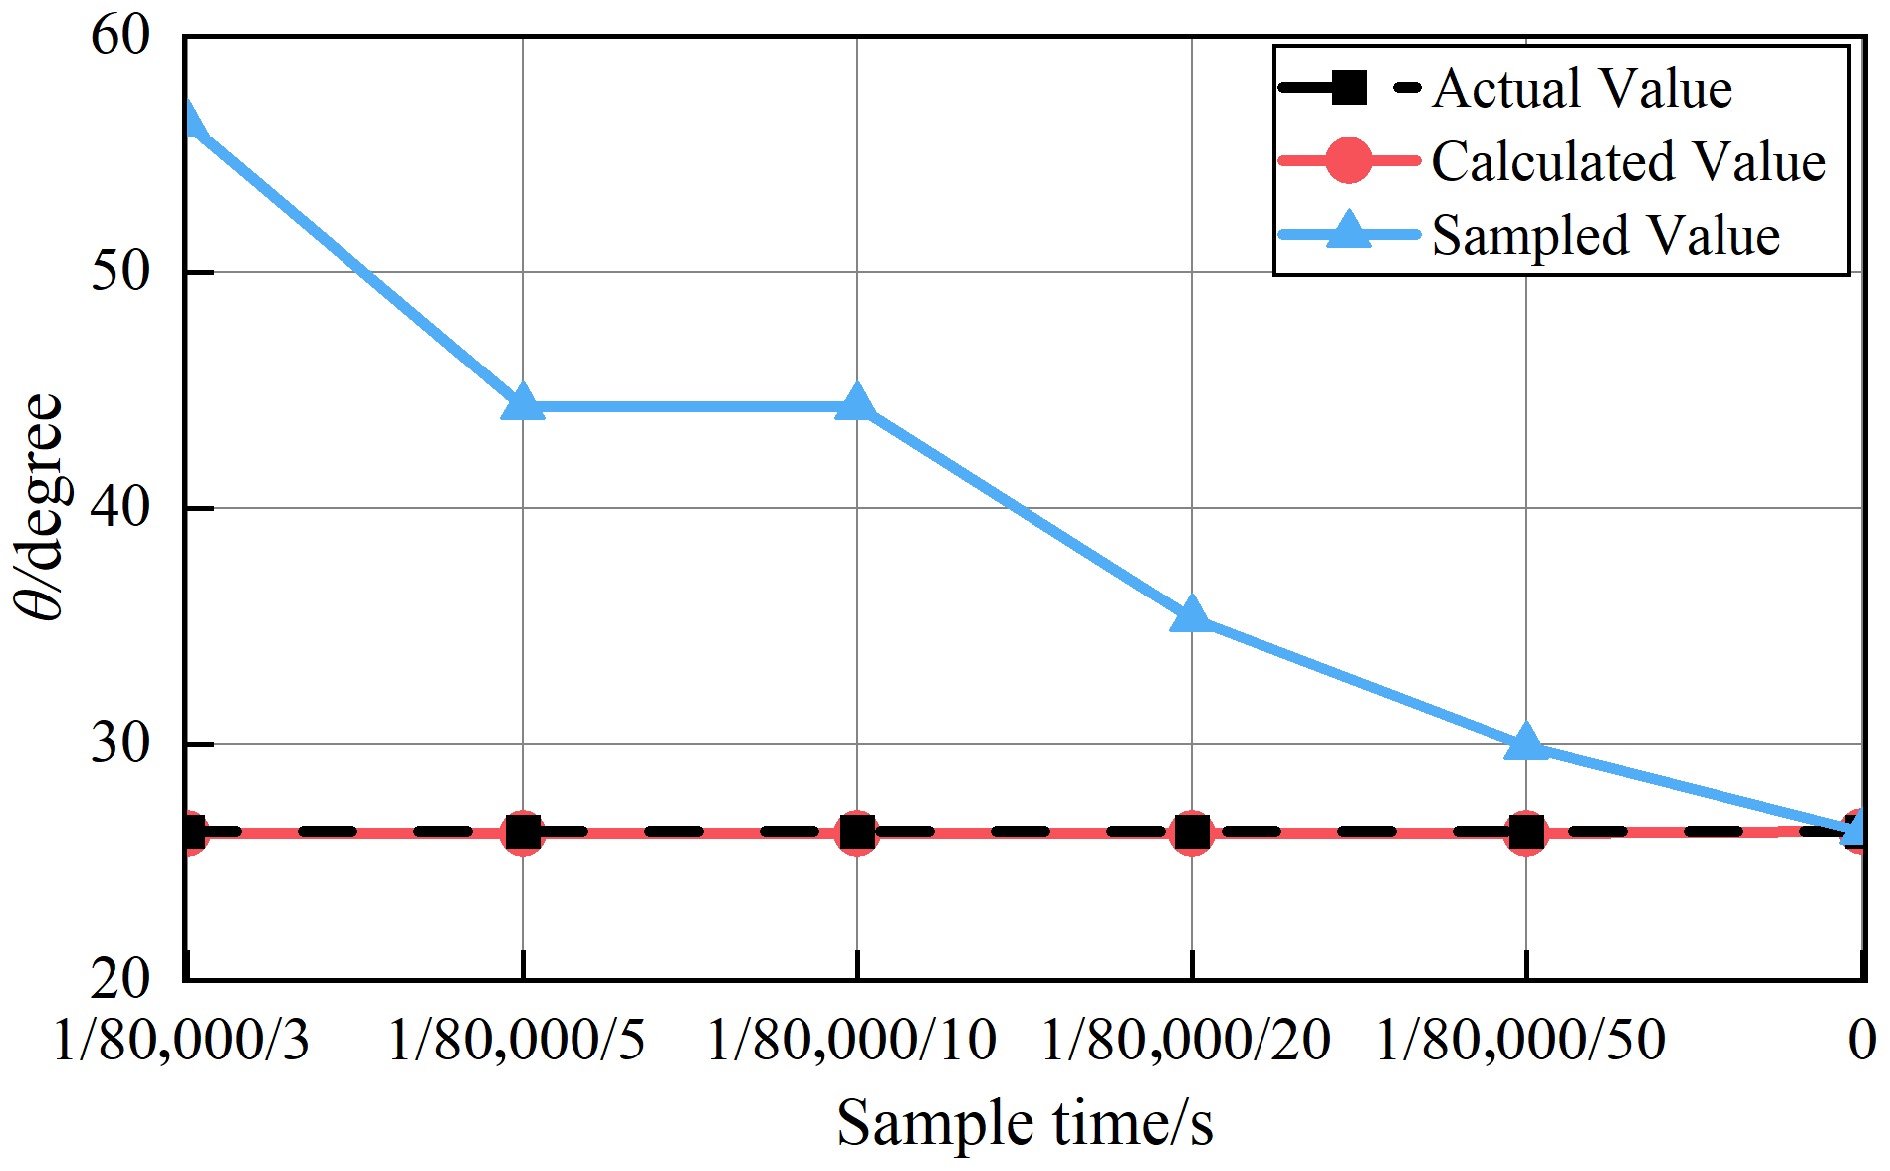
Figure 6.
The value of power angle θ obtained by different methods.
-
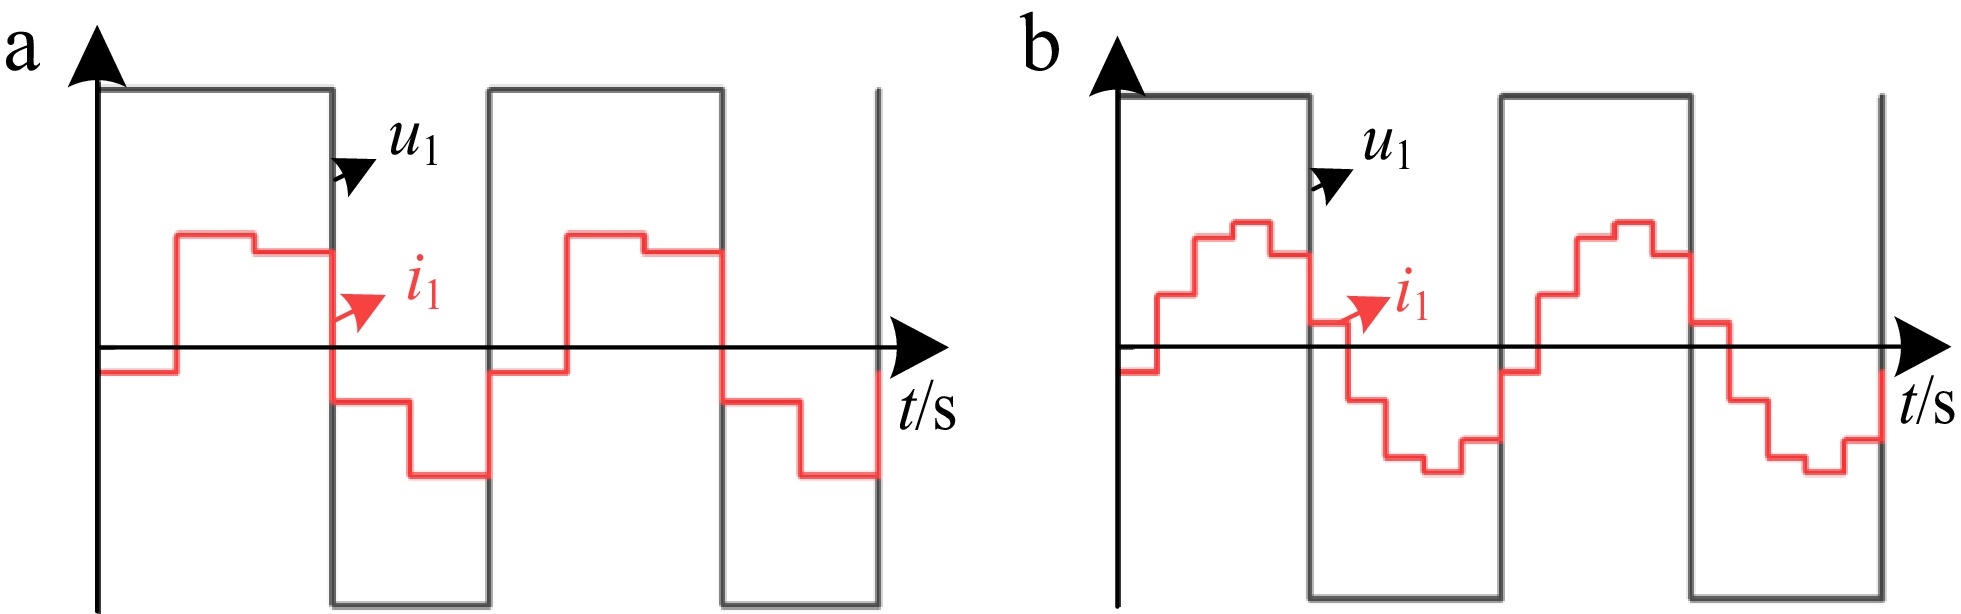
Figure 7.
Sampling waveforms of u1 and i1 at different sampling frequencies. (a) 400 kHz (five times f). (b) 800 kHz (ten times f).
-

Figure 8.
The value of cosθ and tanθ obtained by different method. (a) The value of cosθ obtained by different methods. (b) The value of tanθ obtained by different methods.
-
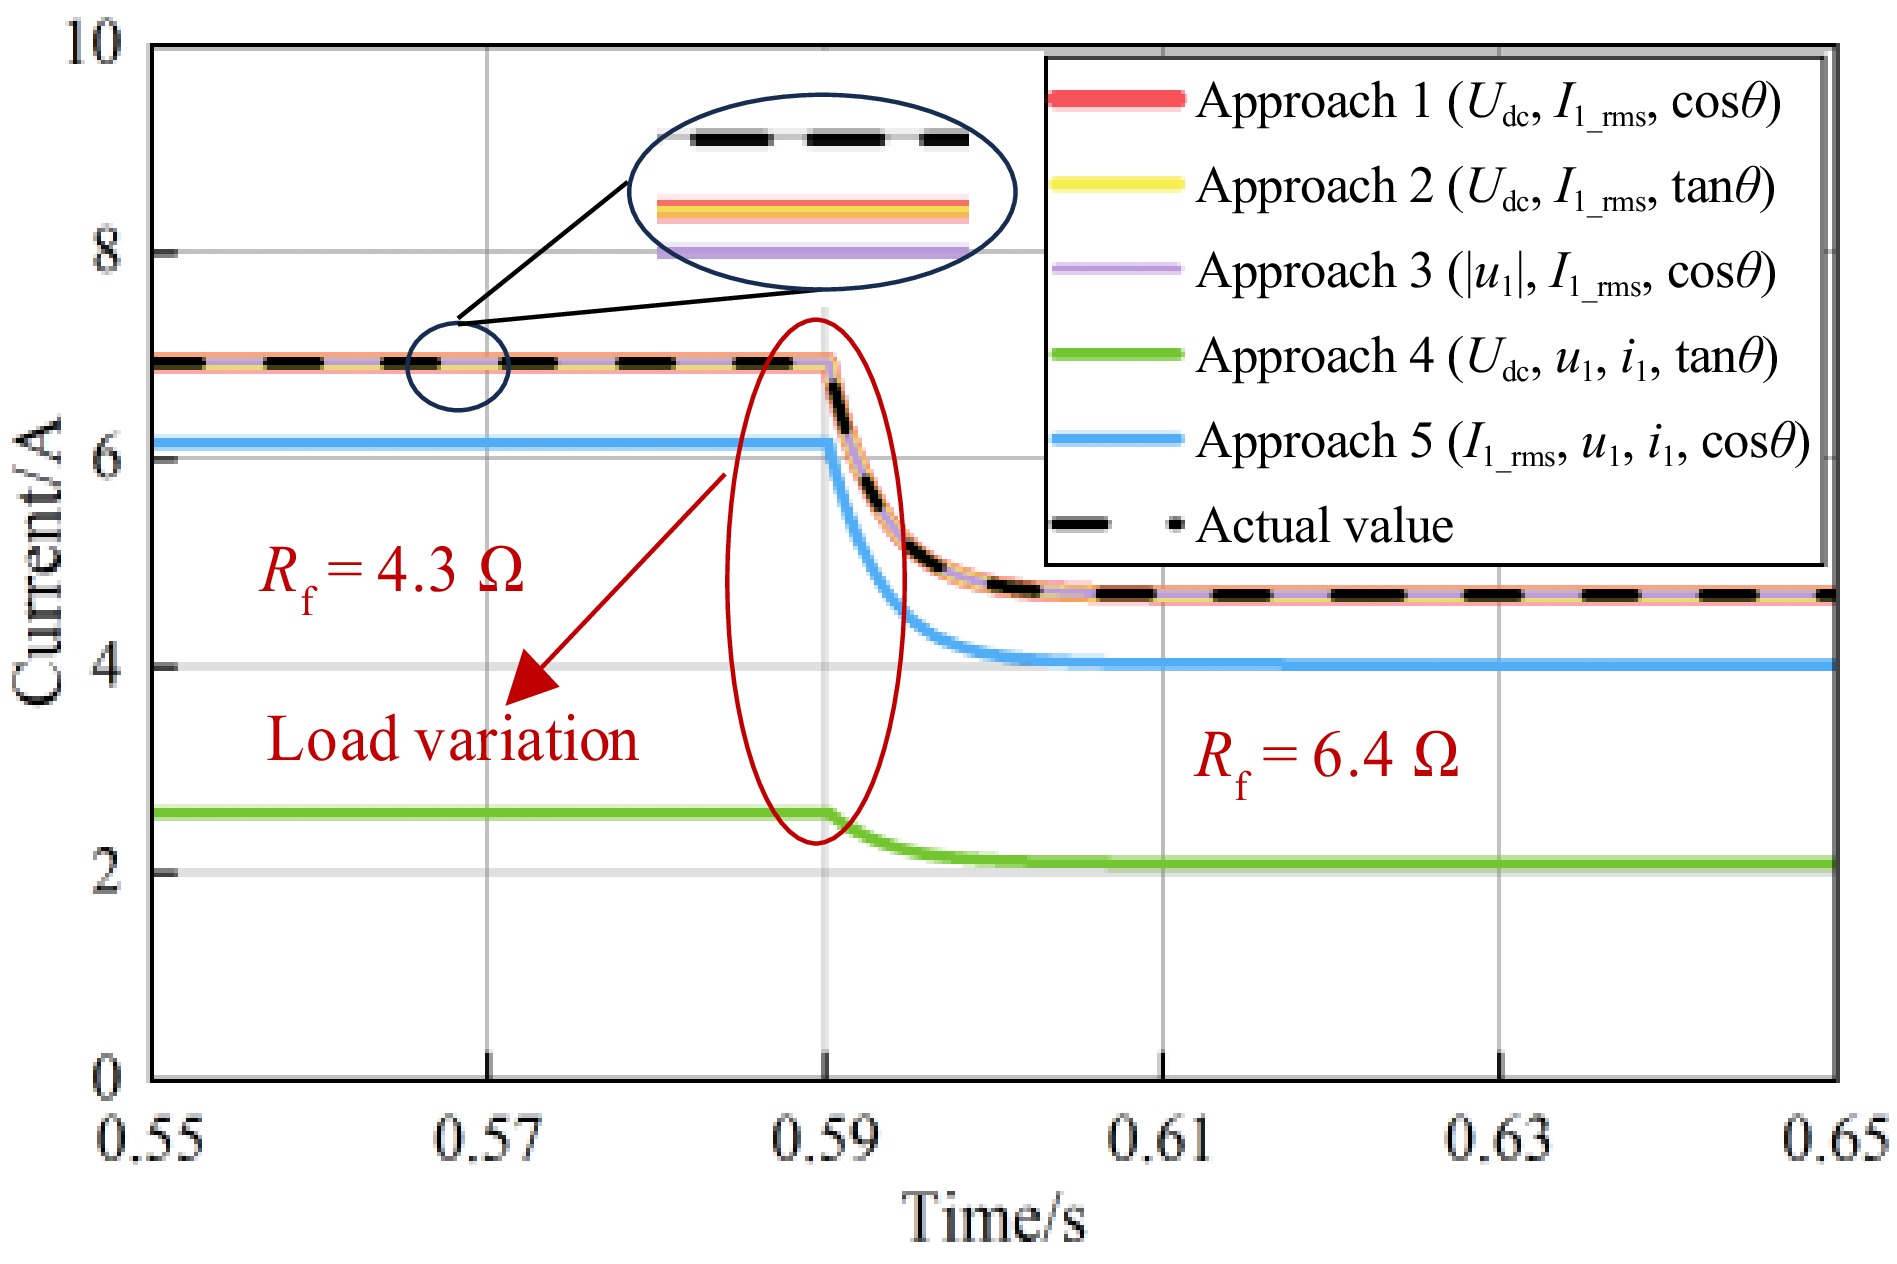
Figure 9.
Estimation results of five different estimation approaches.
-
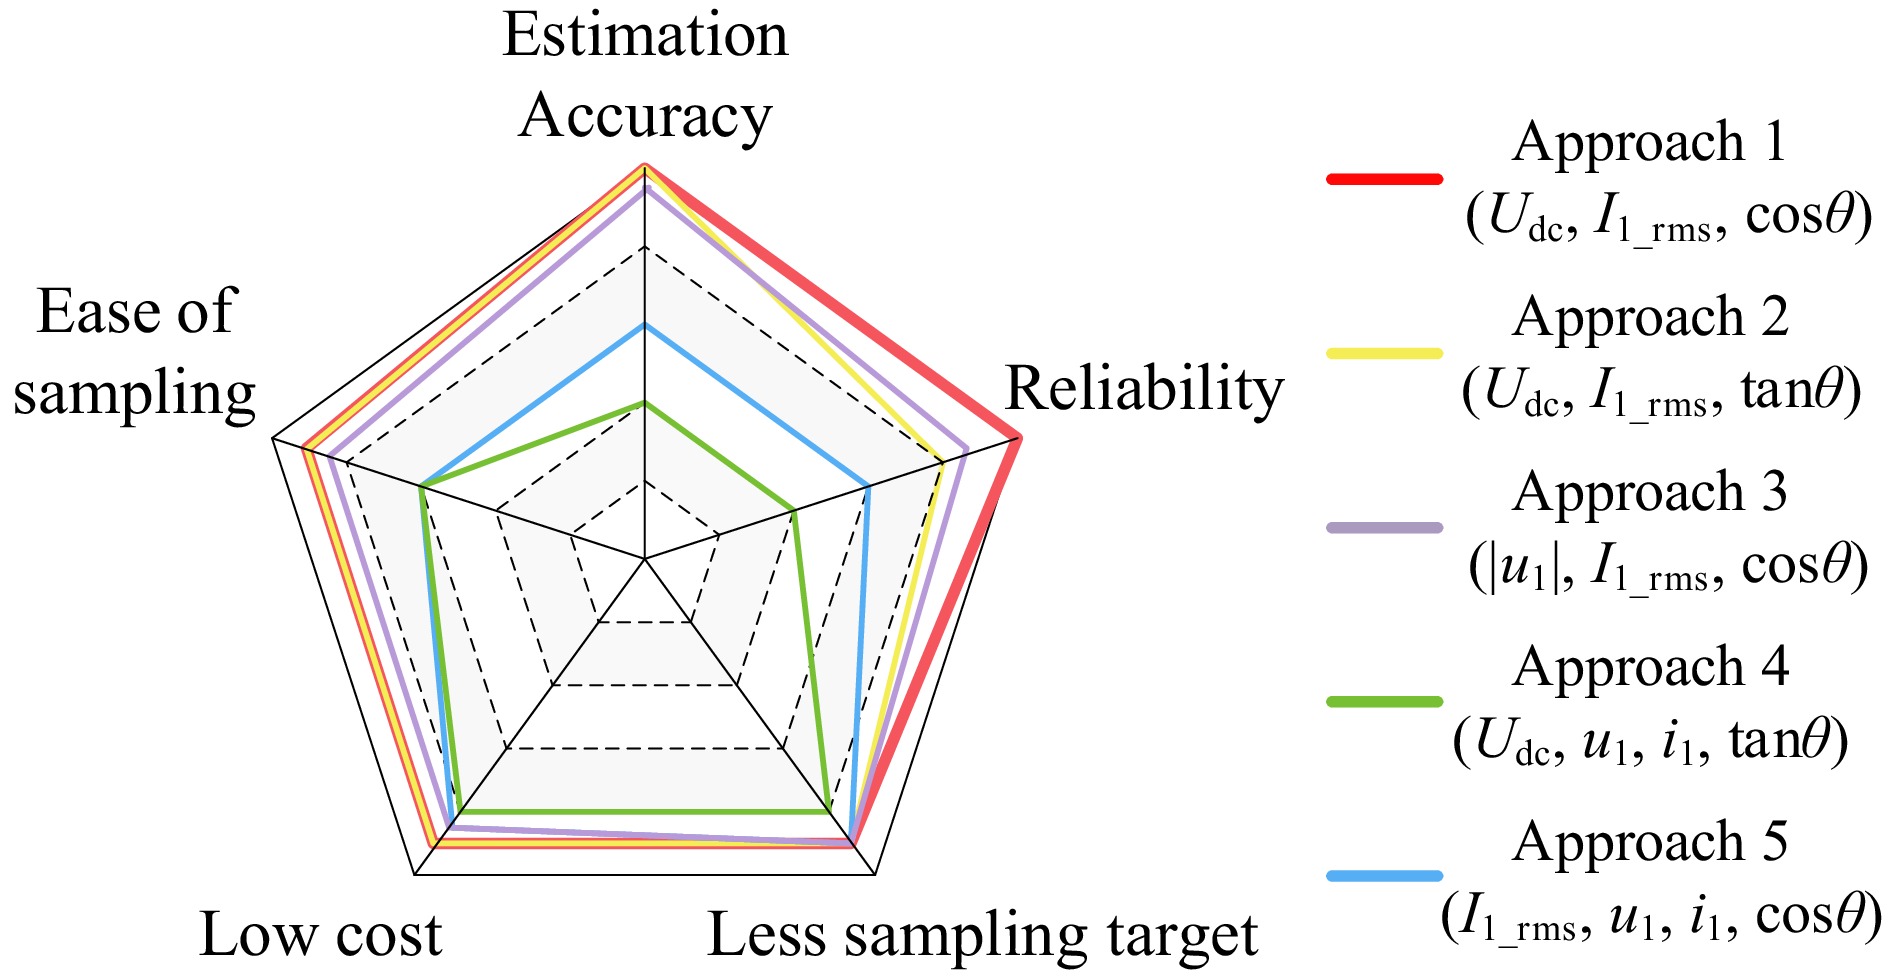
Figure 10.
Comparison radar chart of five different estimation approaches.
-
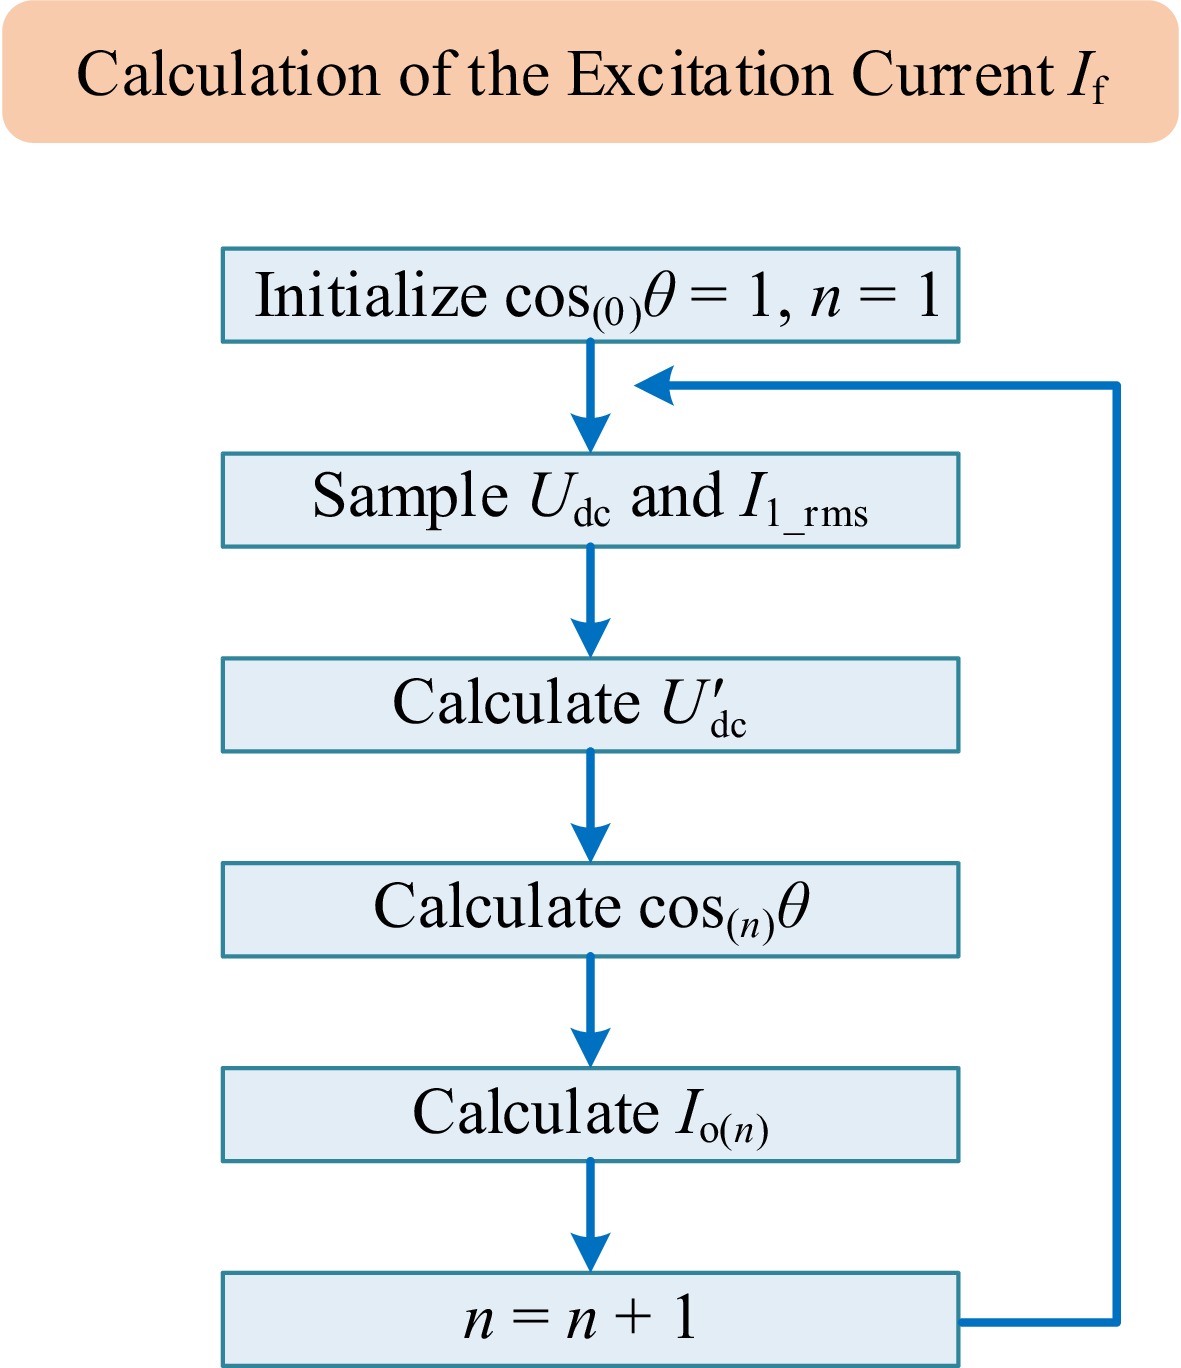
Figure 11.
Block diagram of excitation-current calculation.
-
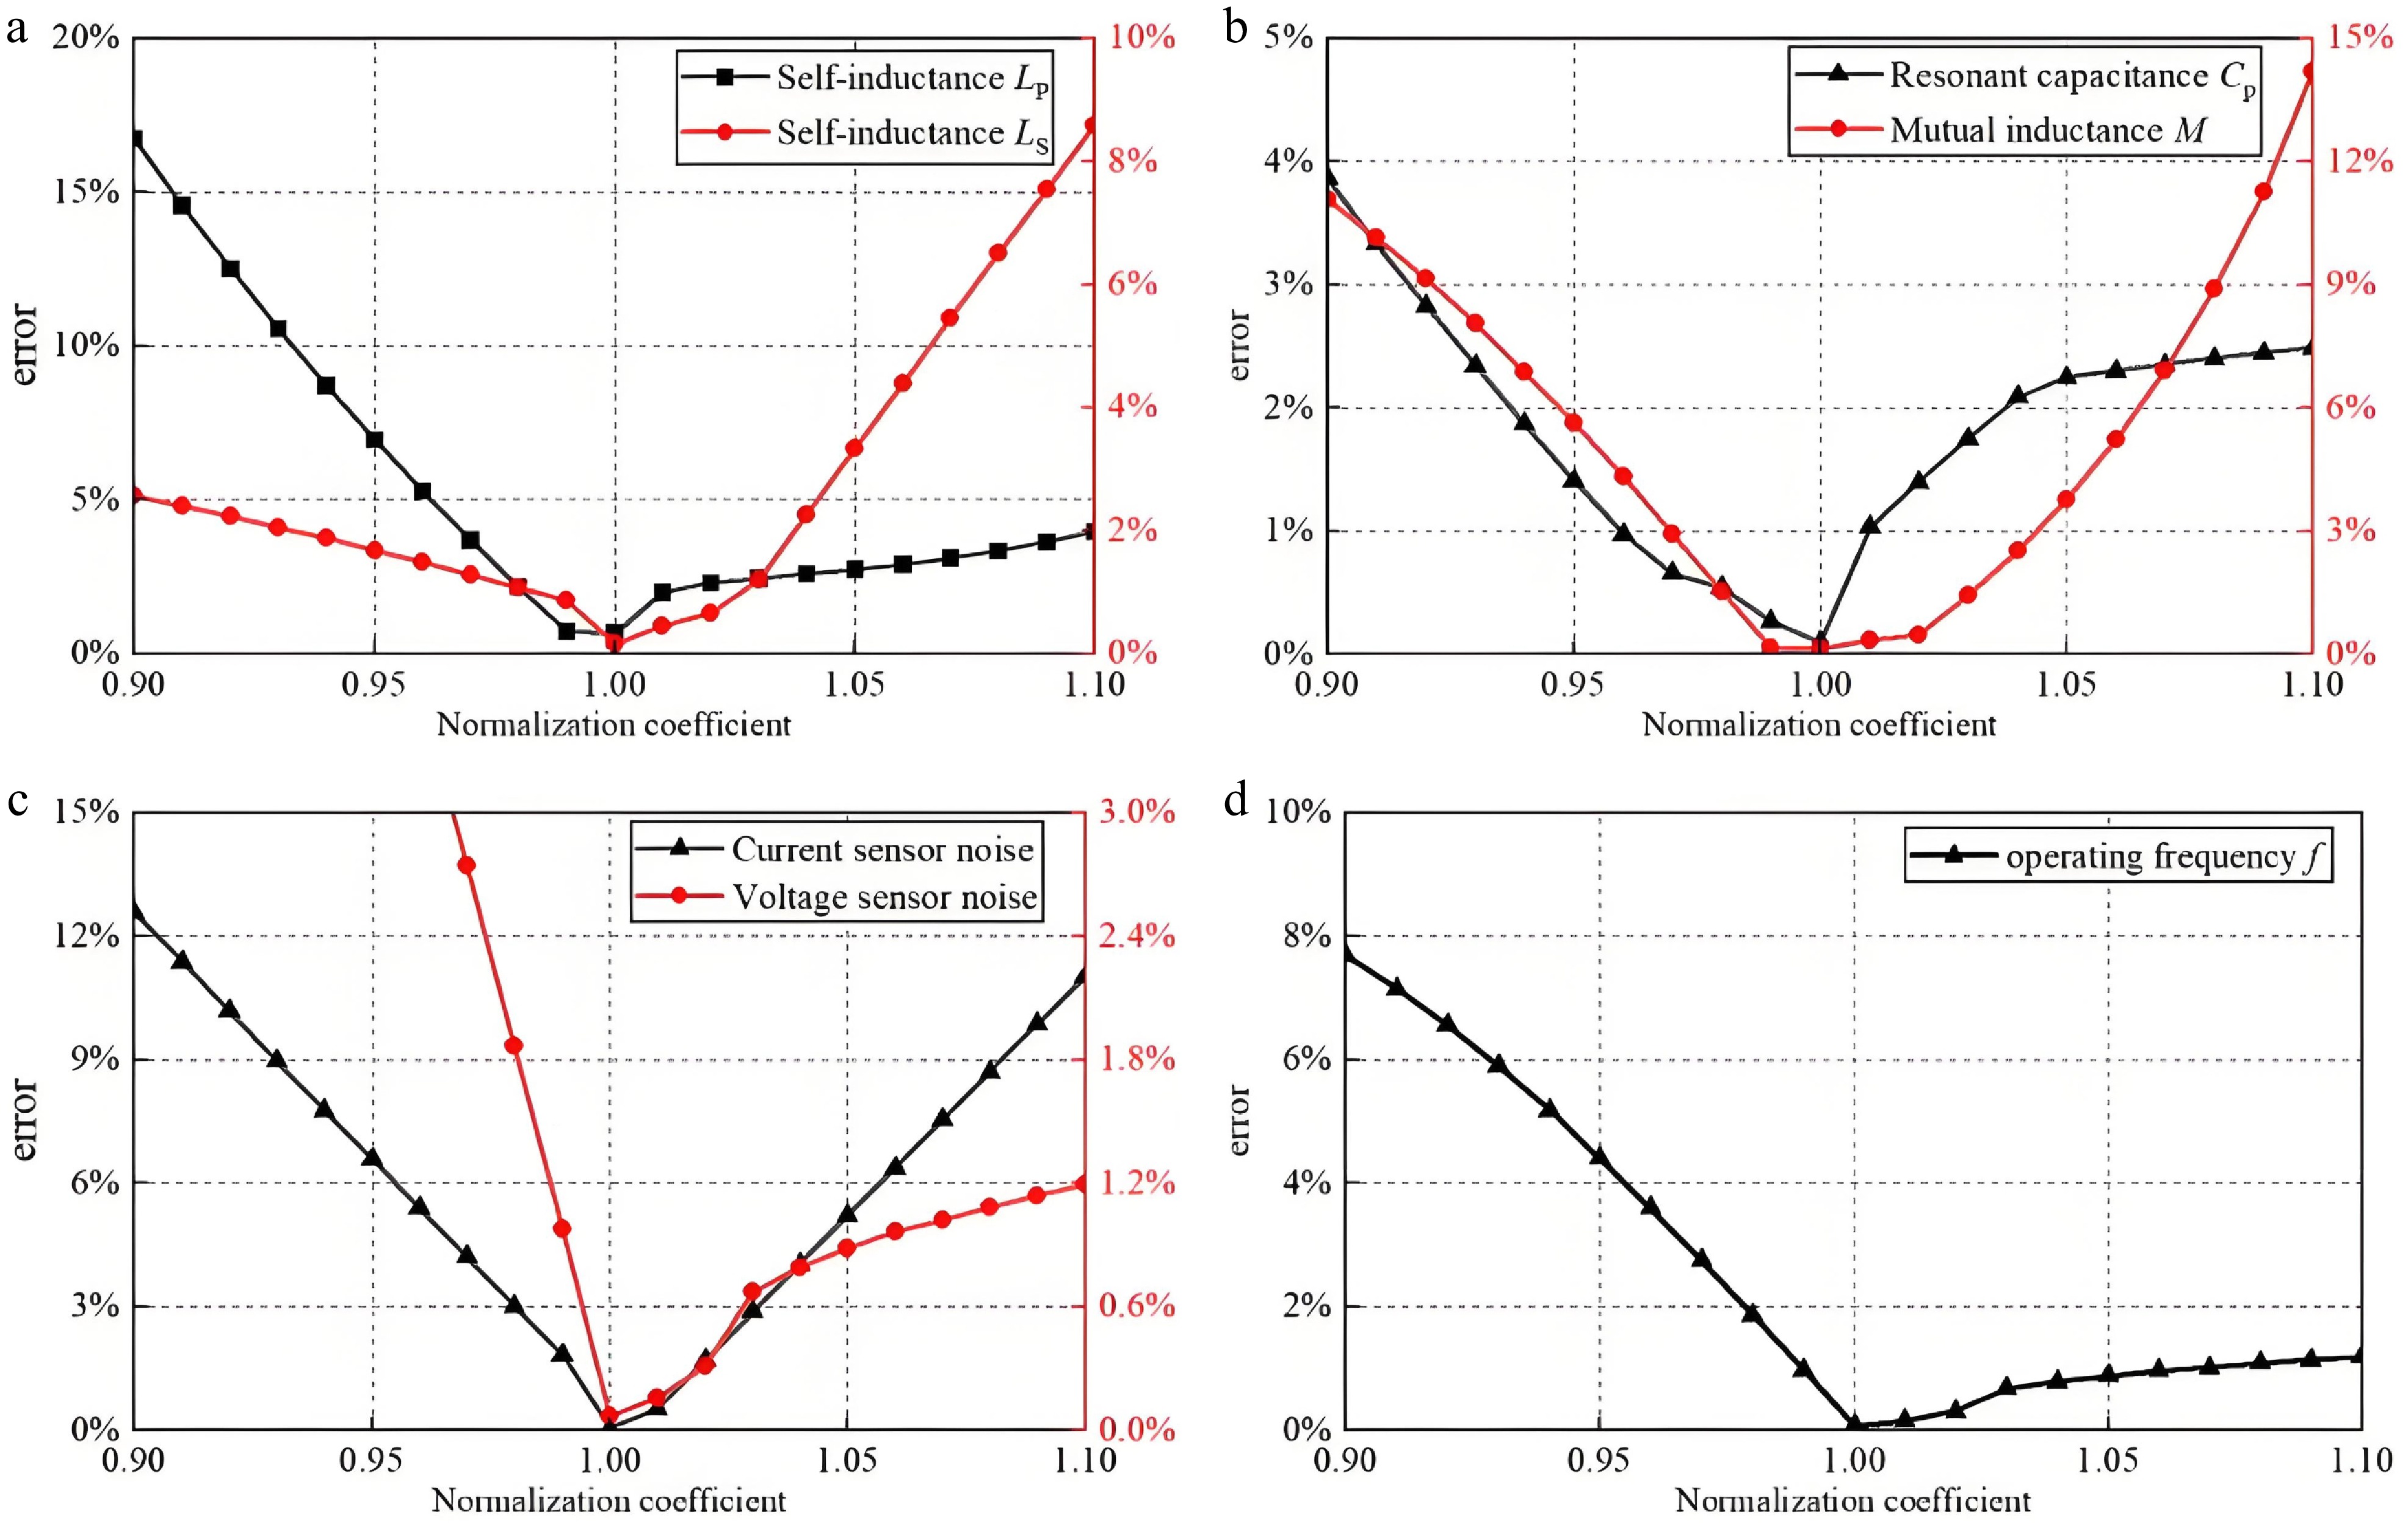
Figure 12.
Estimation error under different parameter-normalization variations (0.90–1.10). (a) Self-inductance LP and LS. (b) Resonant capacitance CP and mutual inductance M. (c) Current and voltage sensor noise. (d) Operating frequency f.
-
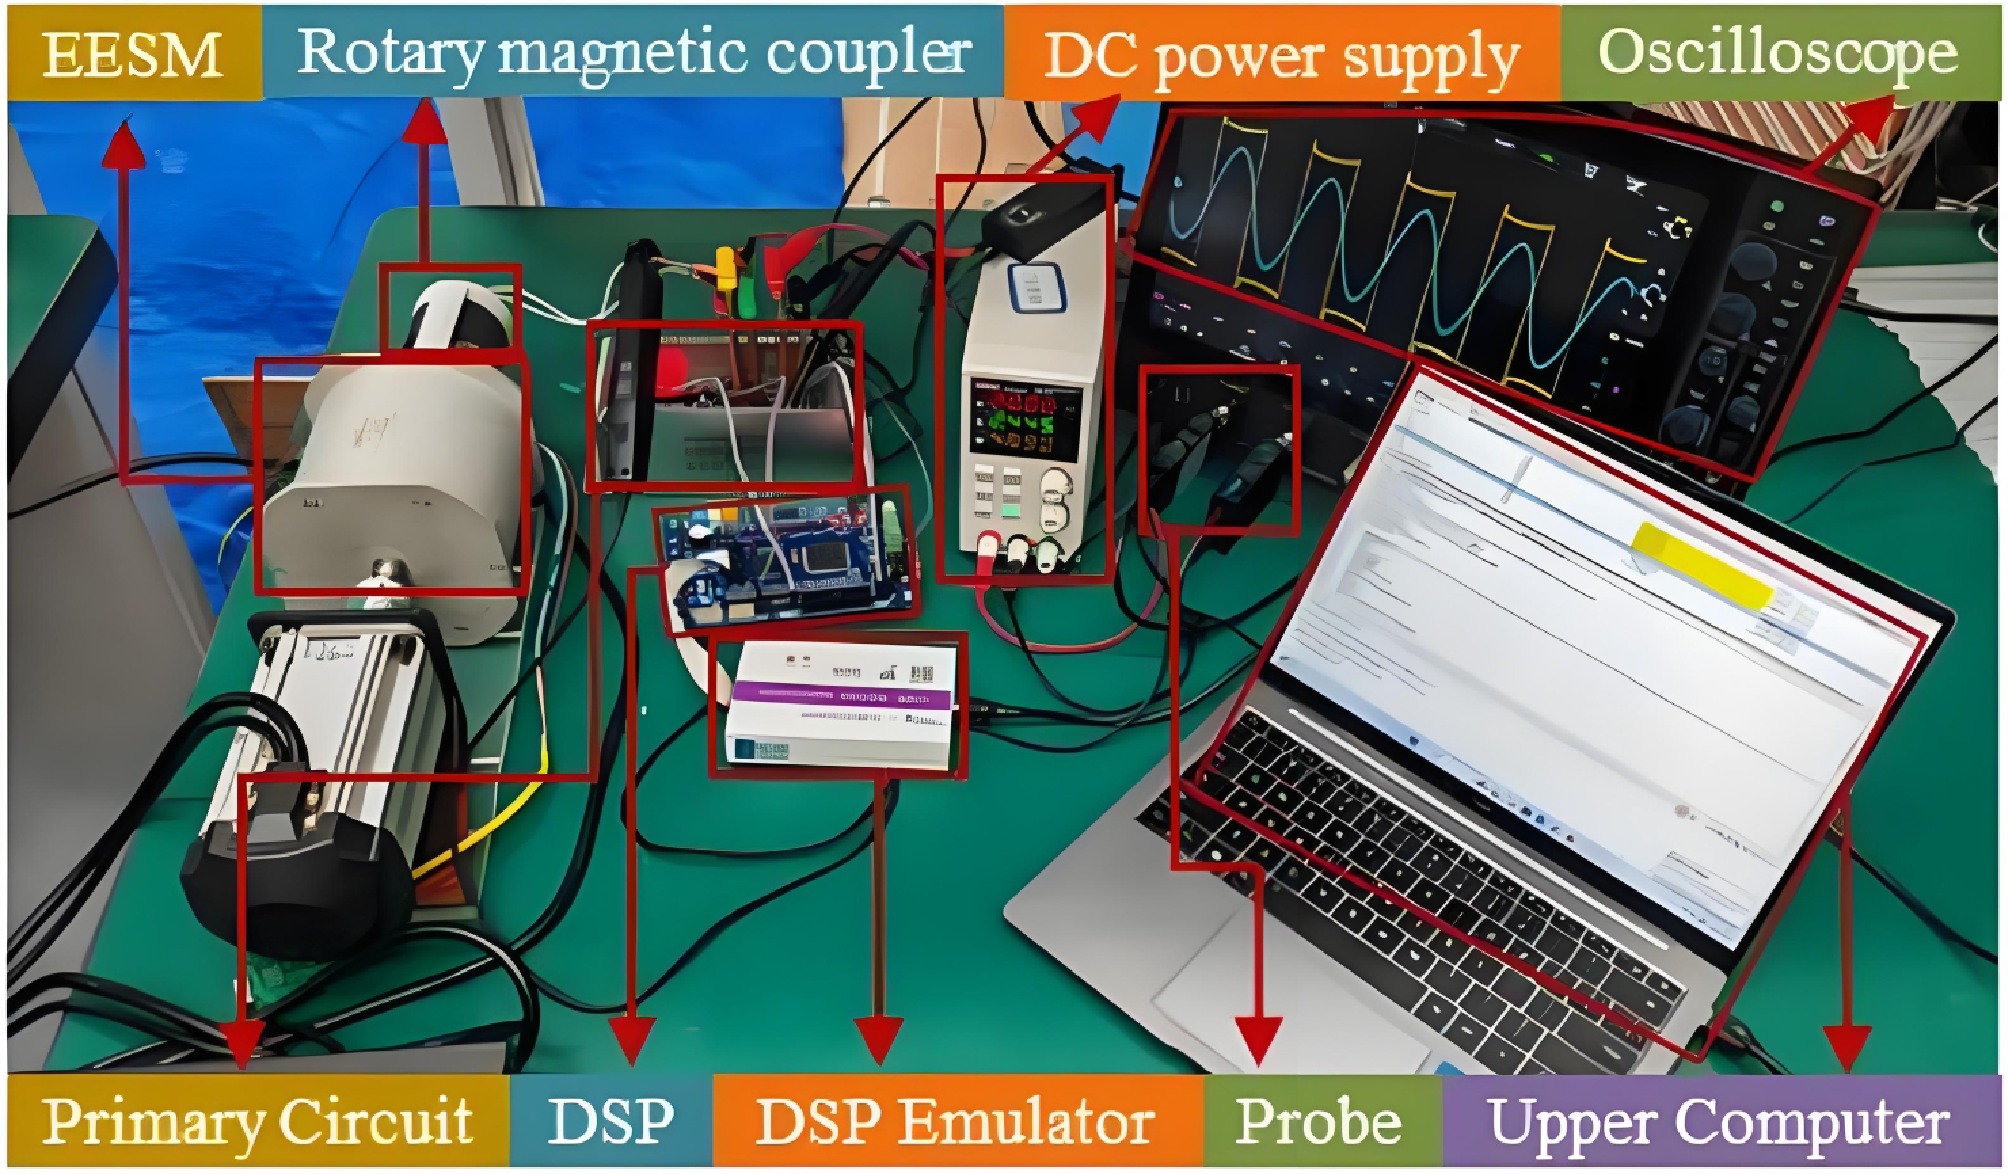
Figure 13.
Experimental platform for the S-N compensated wireless excitation system.
-
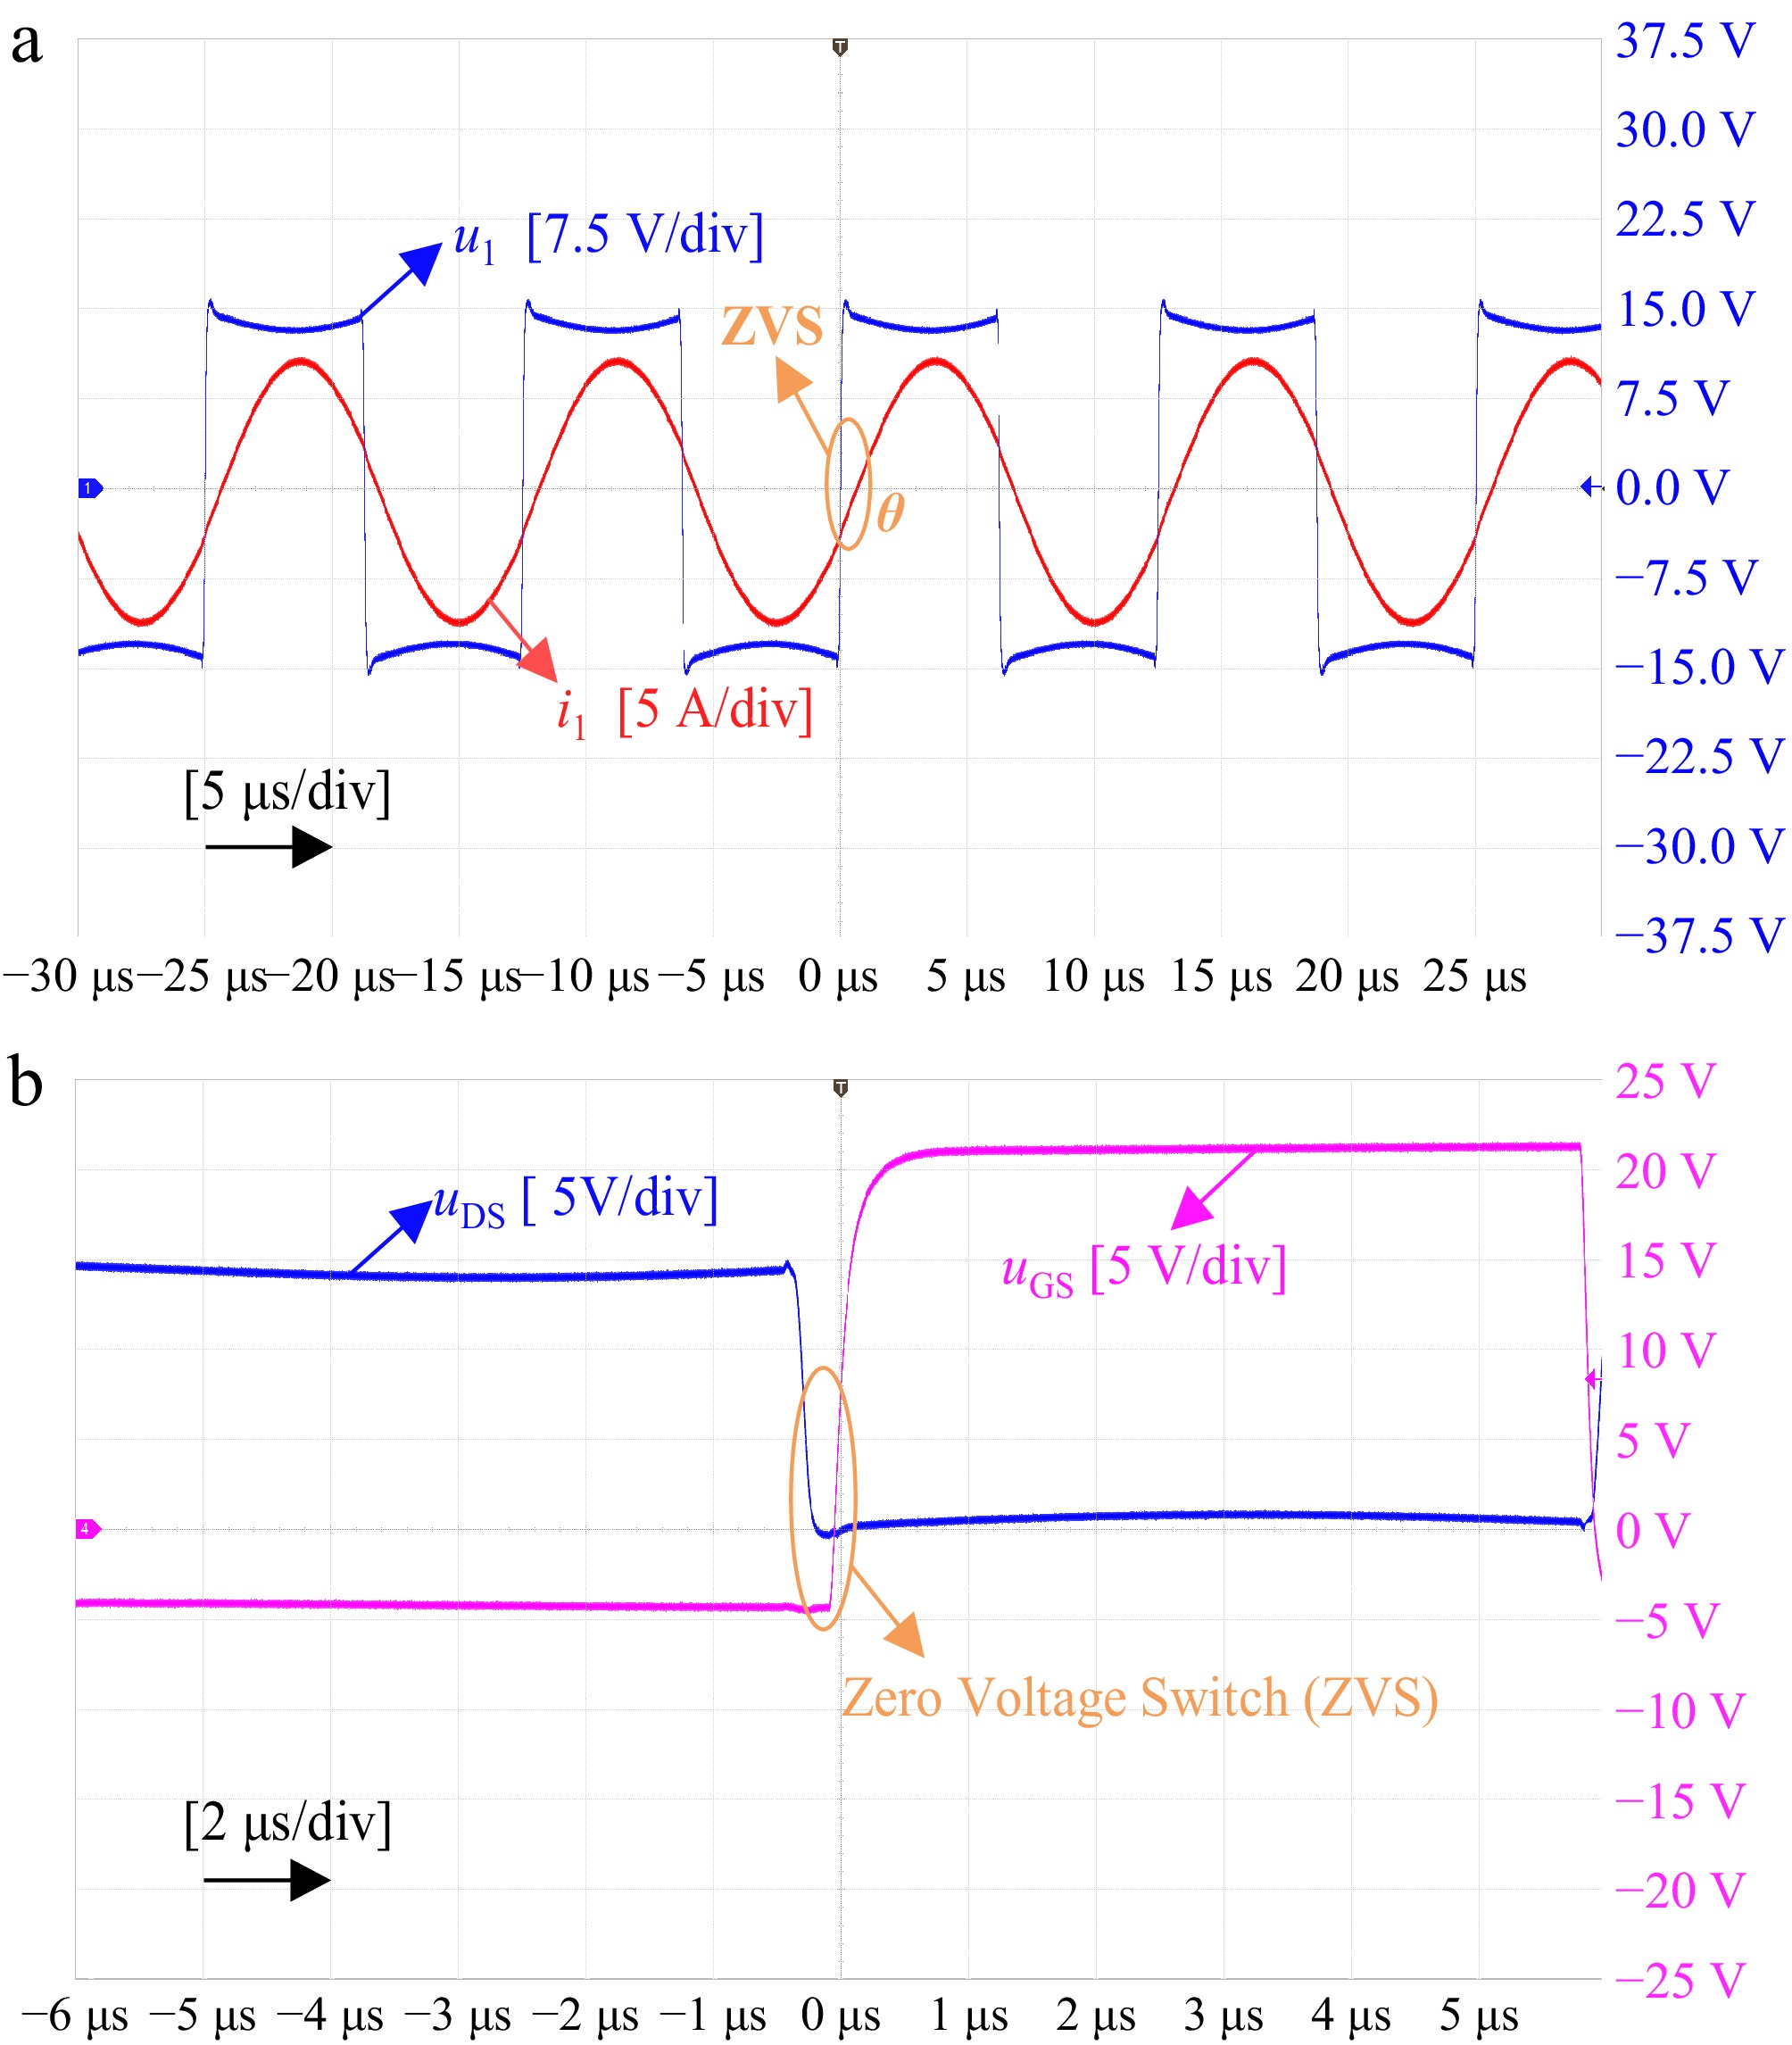
Figure 14.
Waveform diagrams of voltage u1, current i1 and the MOSFET ZVS soft switching. (a) Waveform diagrams of voltage u1 and current i1. (b) Waveform of MOSFET ZVS soft switching.
-
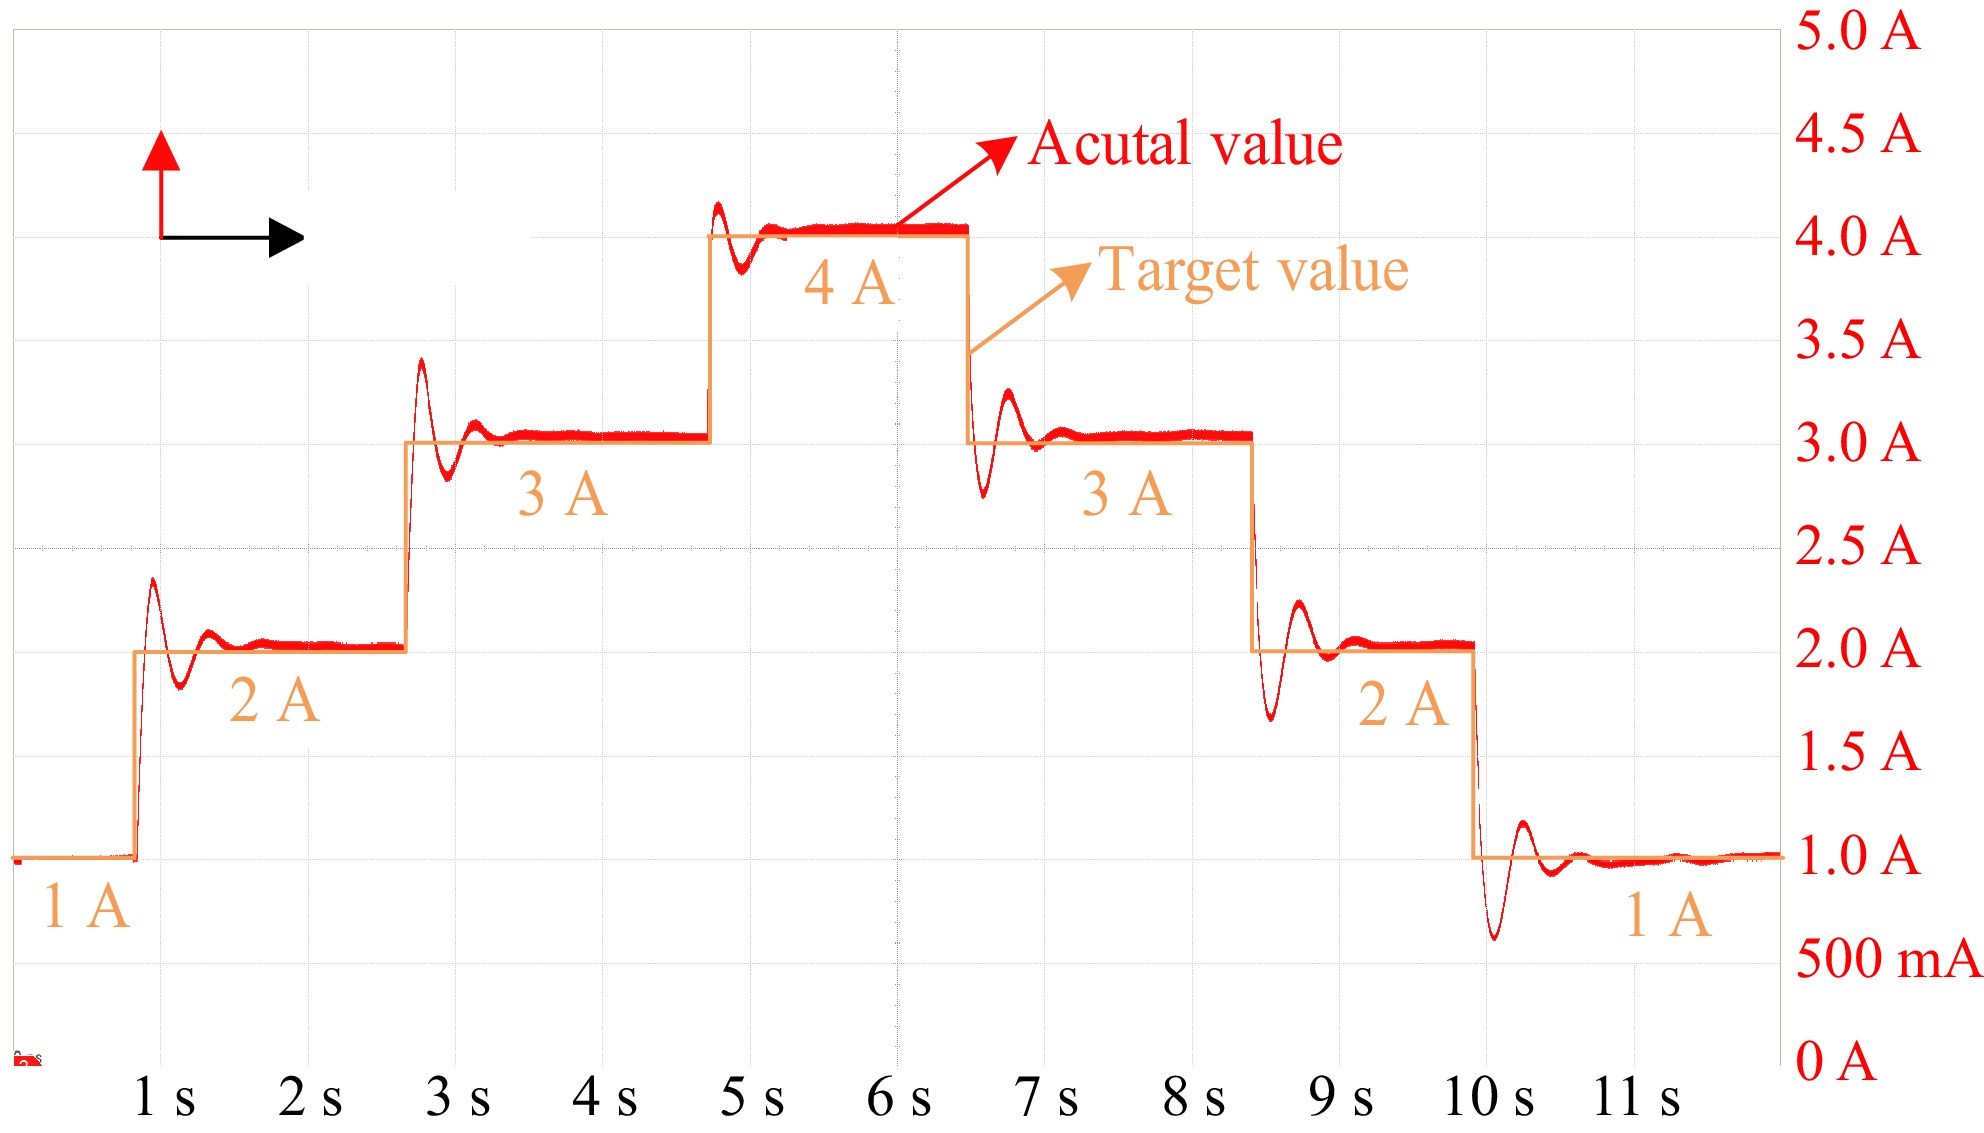
Figure 15.
The waveform of actual excitation current vs target value variation.
-
Approach Methods to obtain θ Equation Sampling targets Approach 1 Calculation method Eq. (13) Udc I1_rms Approach 2 Calculation method Eq. (12) Udc I1_rms Approach 3 Calculation method Eq. (13) |u1| I1_rms Approach 4 Sampling method Eq. (12) Udc u1 i1 Approach 5 Sampling method Eq. (13) I1_rms u1 i1 Table 1.
Description of five estimation approaches.
-
Components Parameters Components Parameters Udc 24 V M 32.266 μH f 80 kHz CP 438.74 nF LP 33.756 μH Rf 4.3 Ω LS 42.09 μH Lf 180 mH Table 2.
Parameters of S-N wireless excitation system.
-
Target value Steady-state mean value Error 1 A 0.976 A 2.4% 2 A 2.008 A 0.4% 3 A 3.004 A 0.13% 4 A 4.006 A 0.15% Table 3.
Error analysis of the current estimation algorithm.
Figures
(15)
Tables
(3)