-
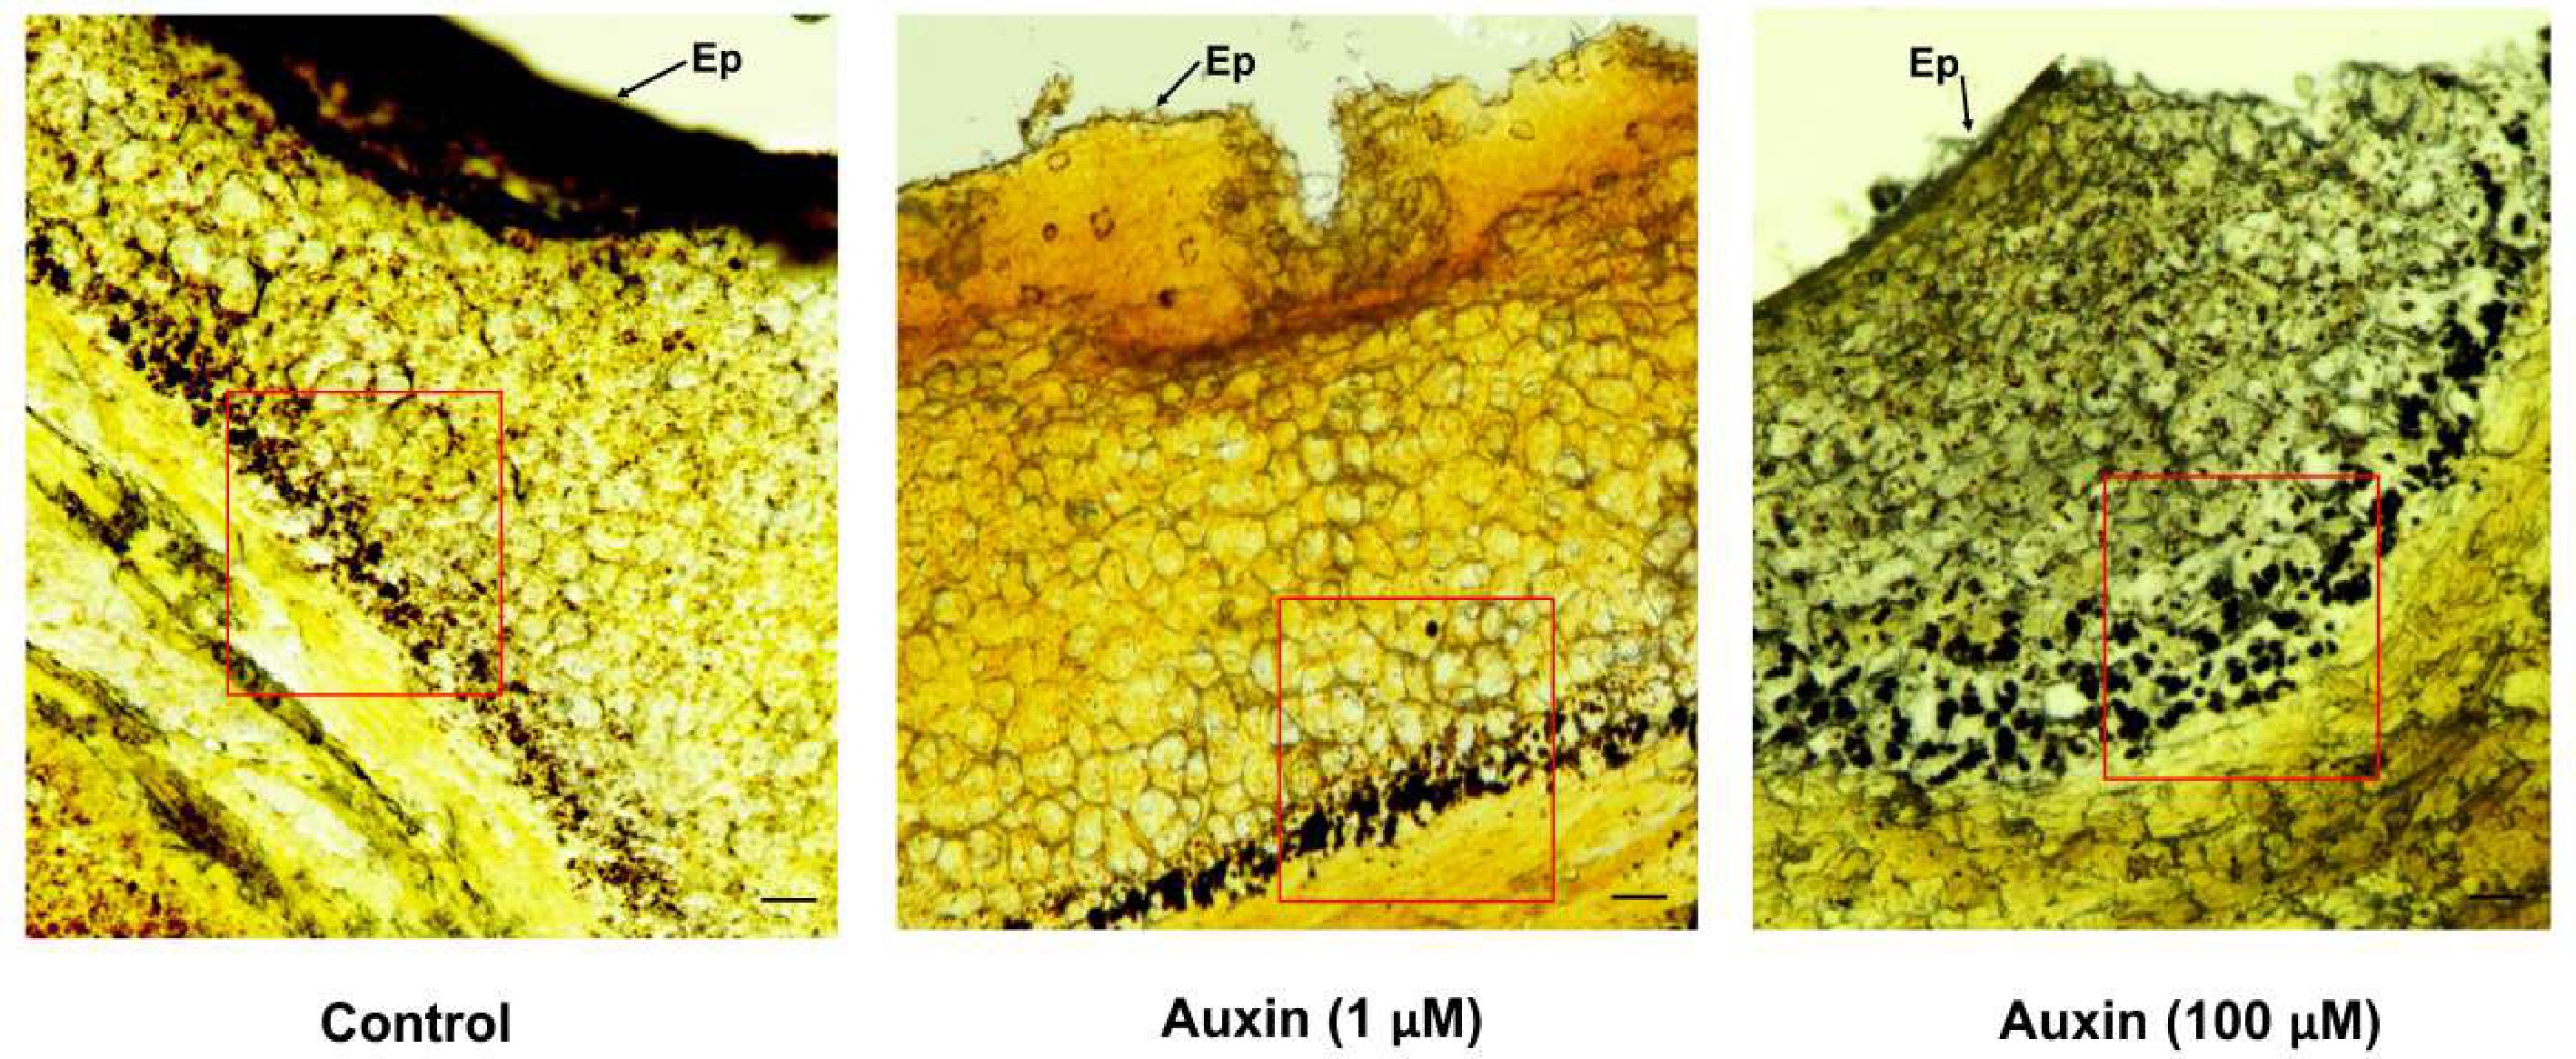
Figure 1.
Light microscopic images of 1 μm thick sections of P. grandiflorus nectaries stained with lugol reagent. Starch granules are shown in the control, and auxin treatments in pre-secretory parenchymal cells. Ep-Epidermal layer; Bar = 100 μm.
-
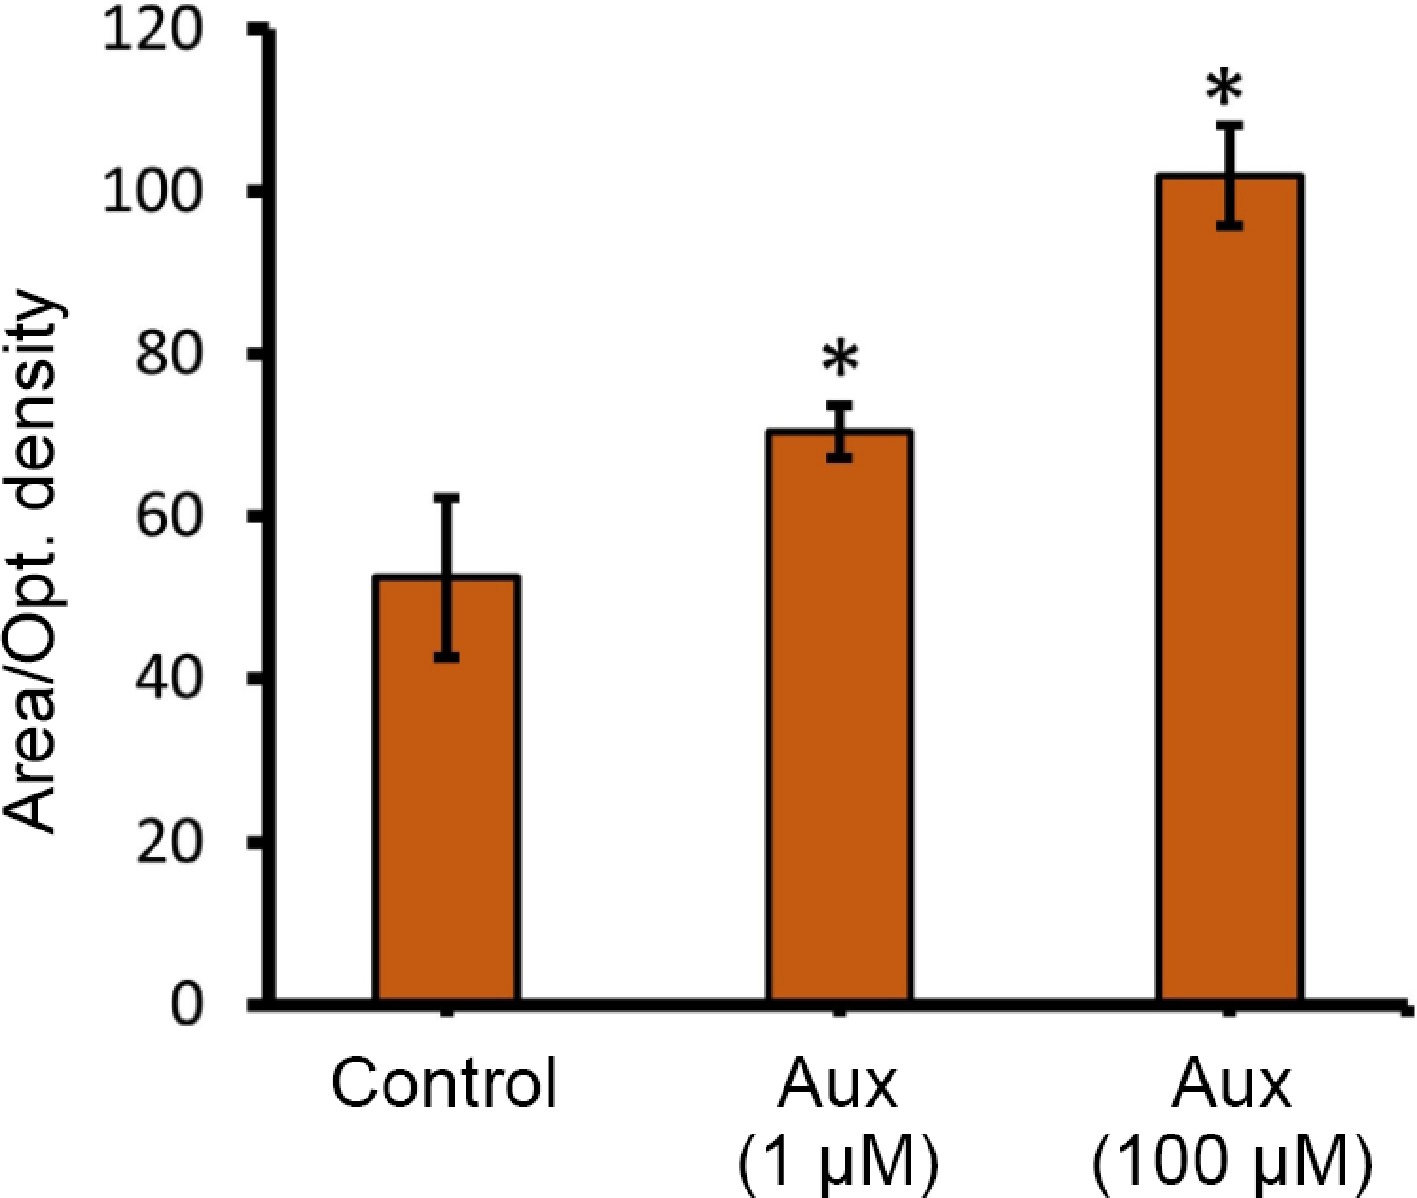
Figure 2.
Quantification of starch accumulation differences among control, and auxin treatments via ImageJ software (area/optical density). The Image J online browser was used. Image > Type (8-bit) > Adjust > Threshold (set 70 for iodine stain) > select rectangle tool to select the region > Measure. Use the tracing tool to select similar regions in treatment groups and measure. Quantification was carried out in three different spots unanimously, and the readings were taken. * Represents statistical significance between the treatments.
-
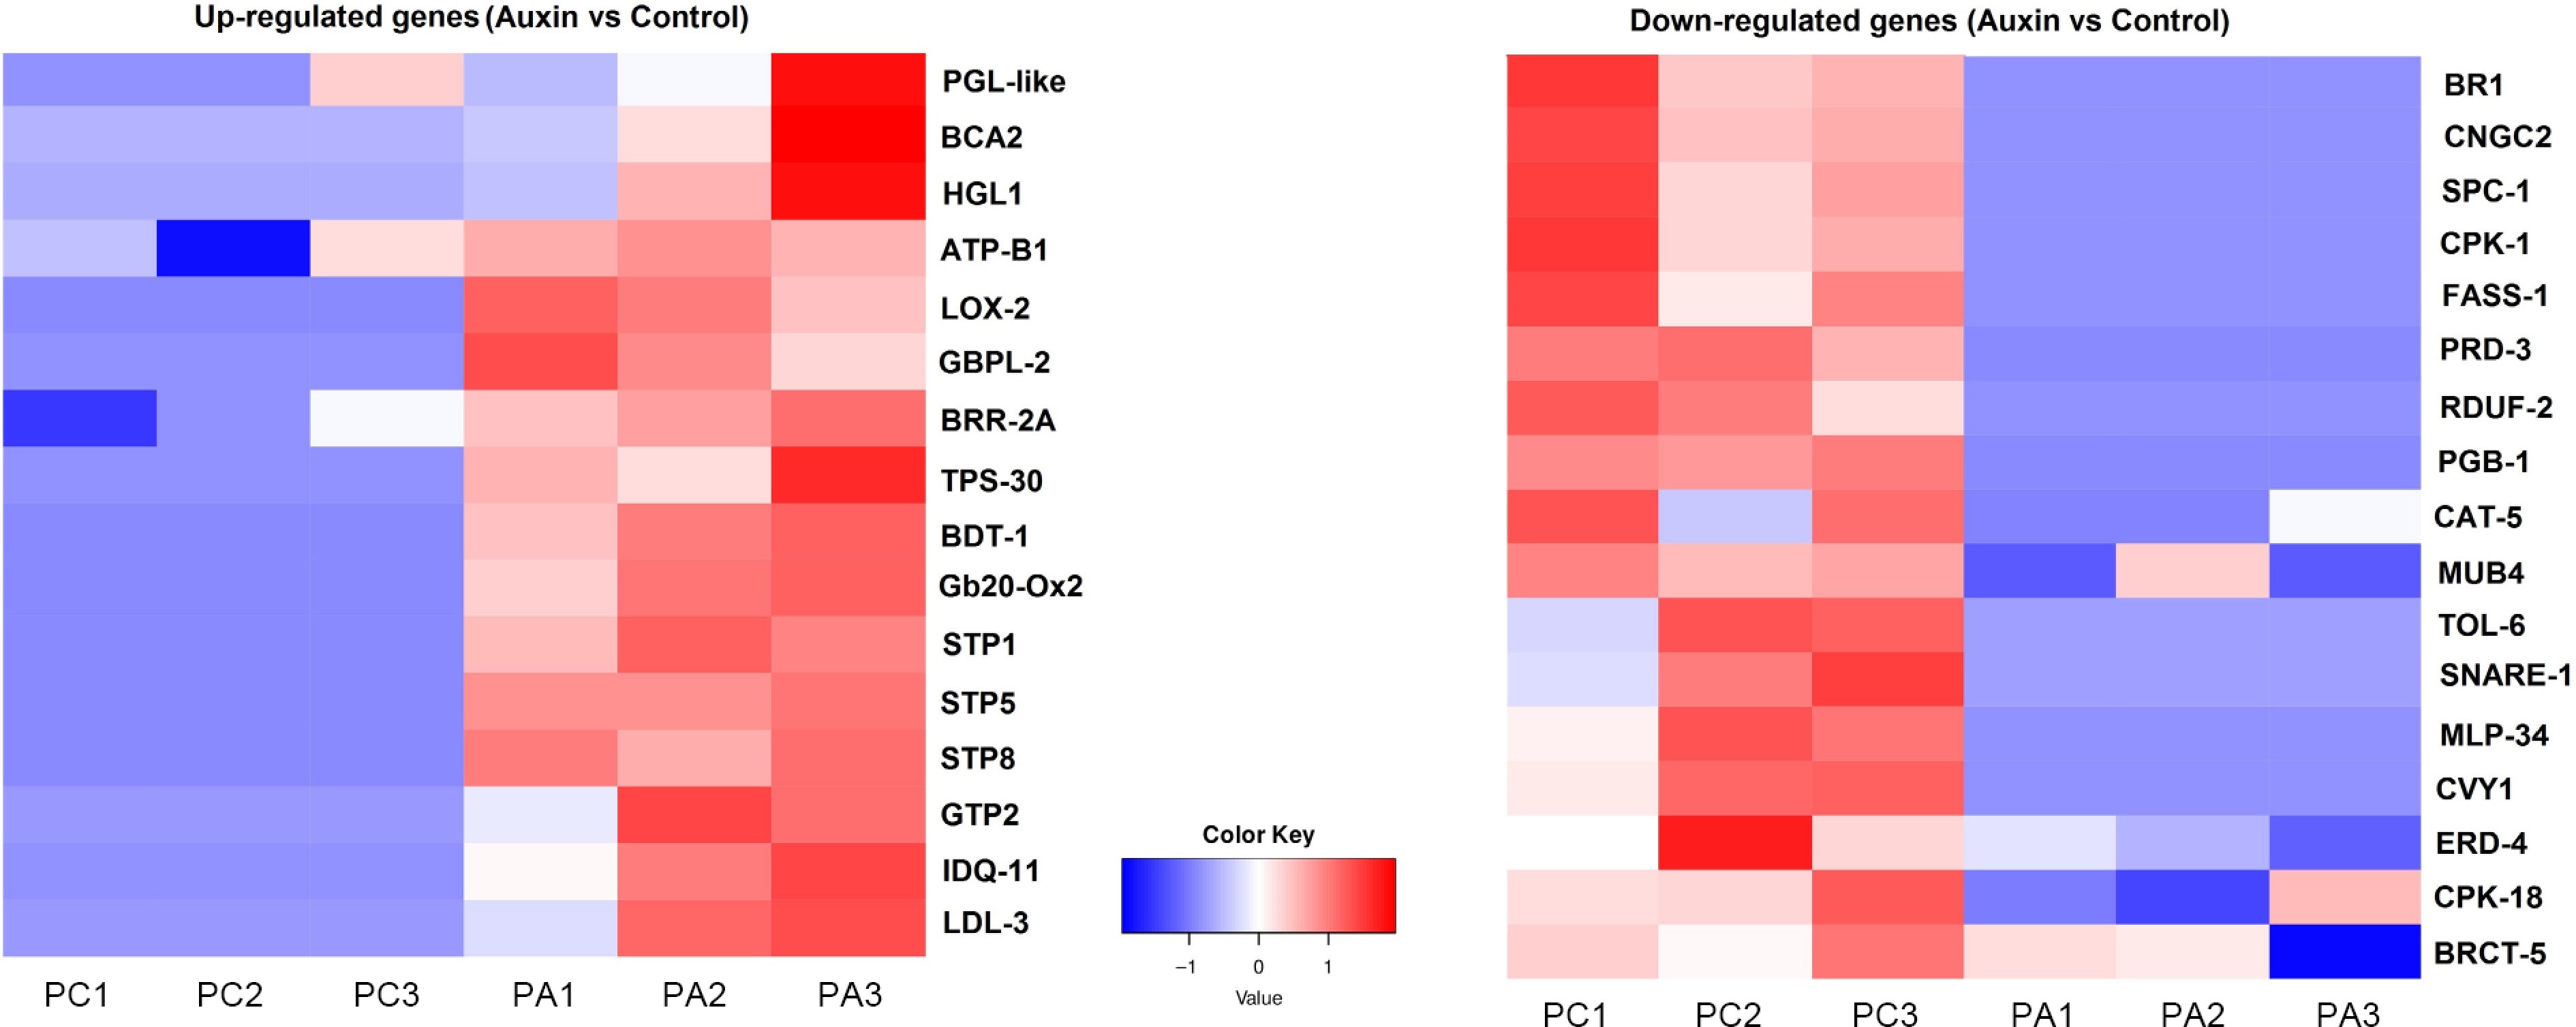
Figure 3.
Heat map showing highly upregulated and downregulated genes (auxin vs control). Sucrose transported genes STP1 and STP2 are found to be highly upregulated under auxin treatment.
-
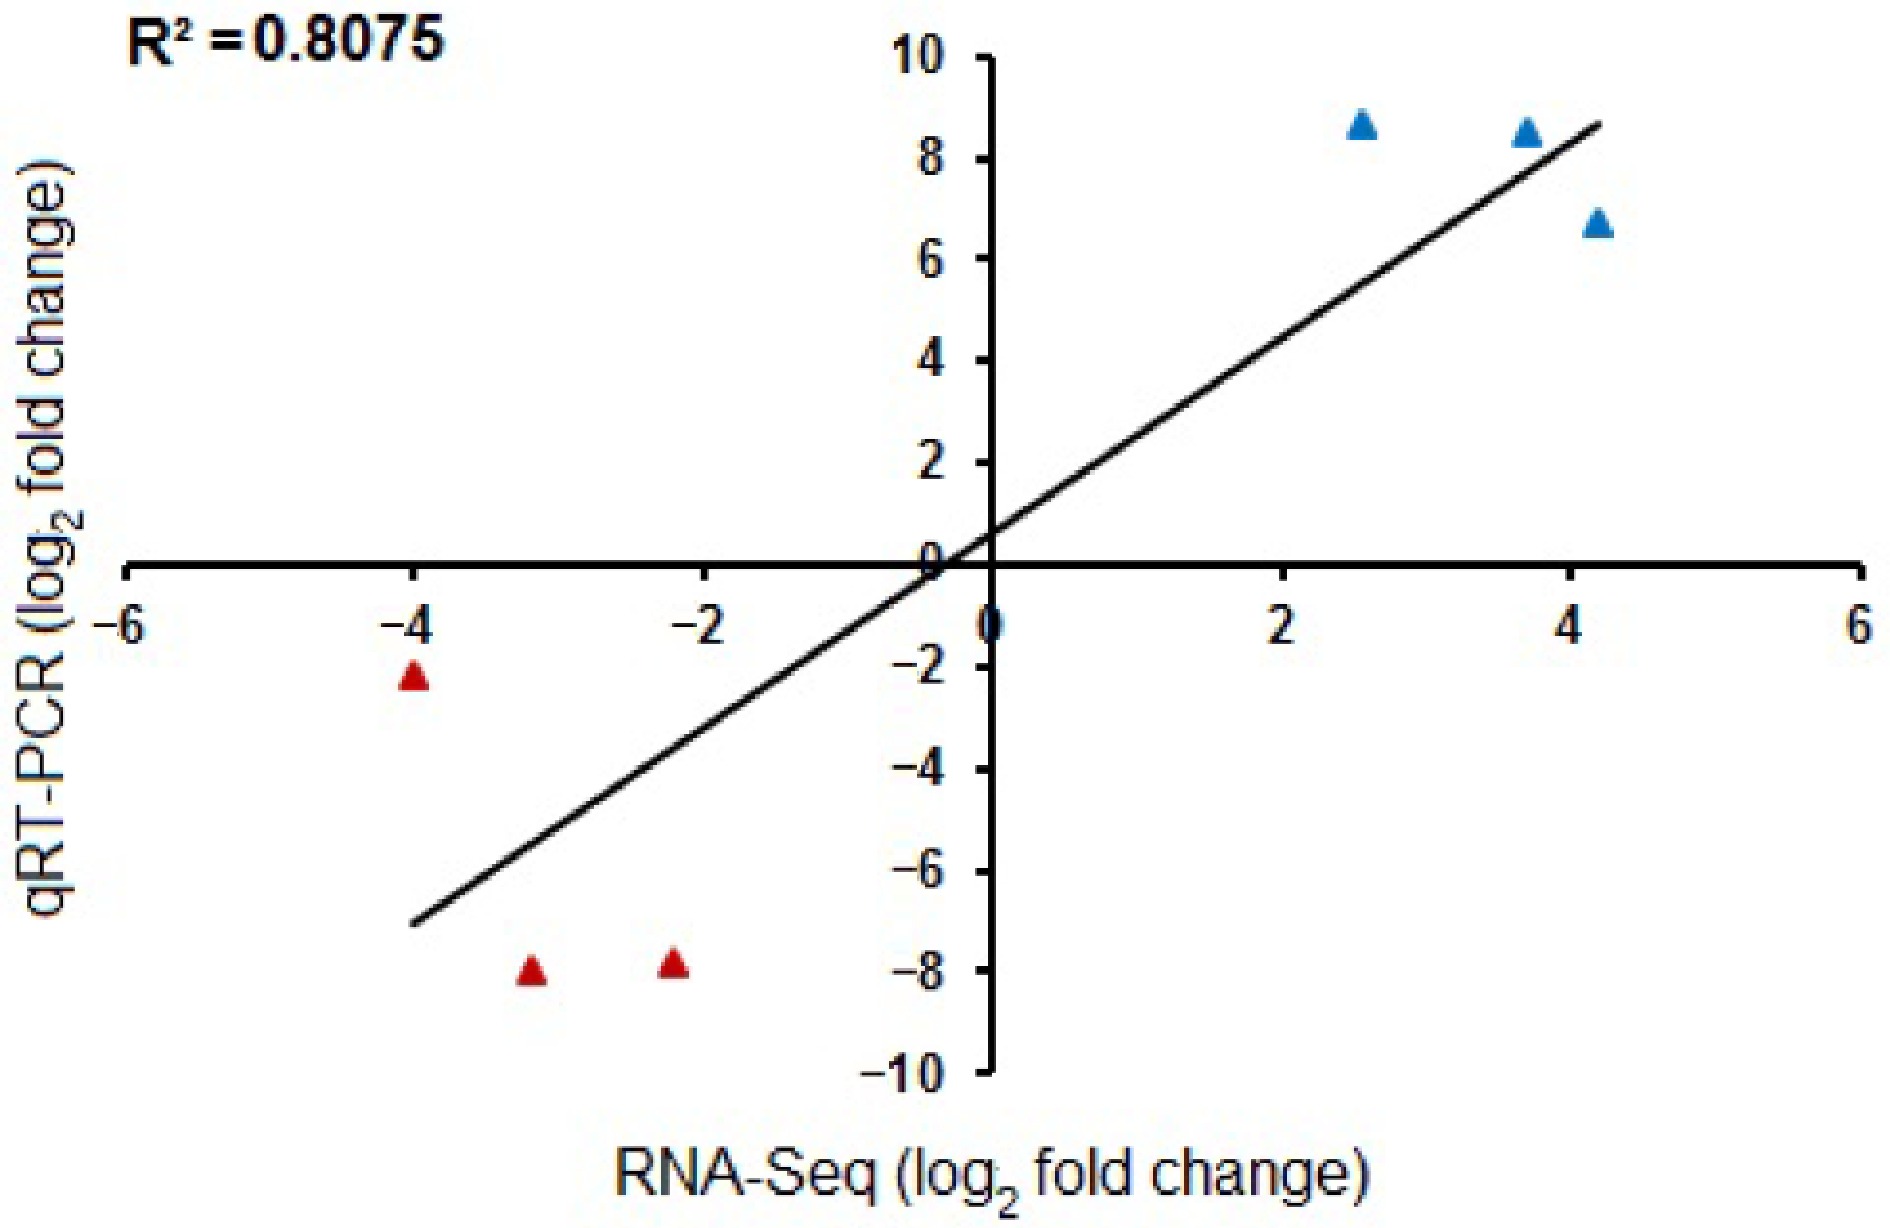
Figure 4.
Validation of −log2FC RNA-Seq values with the −log2FC qRT-PCR gene expression values. The qRT-PCR results (both upregulated and downregulated genes) show high correlation with RNA-Seq data, as denoted by an R2 value of 0.8075. Genes used for qRT-PCR include, upregulation-STP1, STP2, and ABCG1; downregulation-SPC1, CNGC2, and BKK1.
-
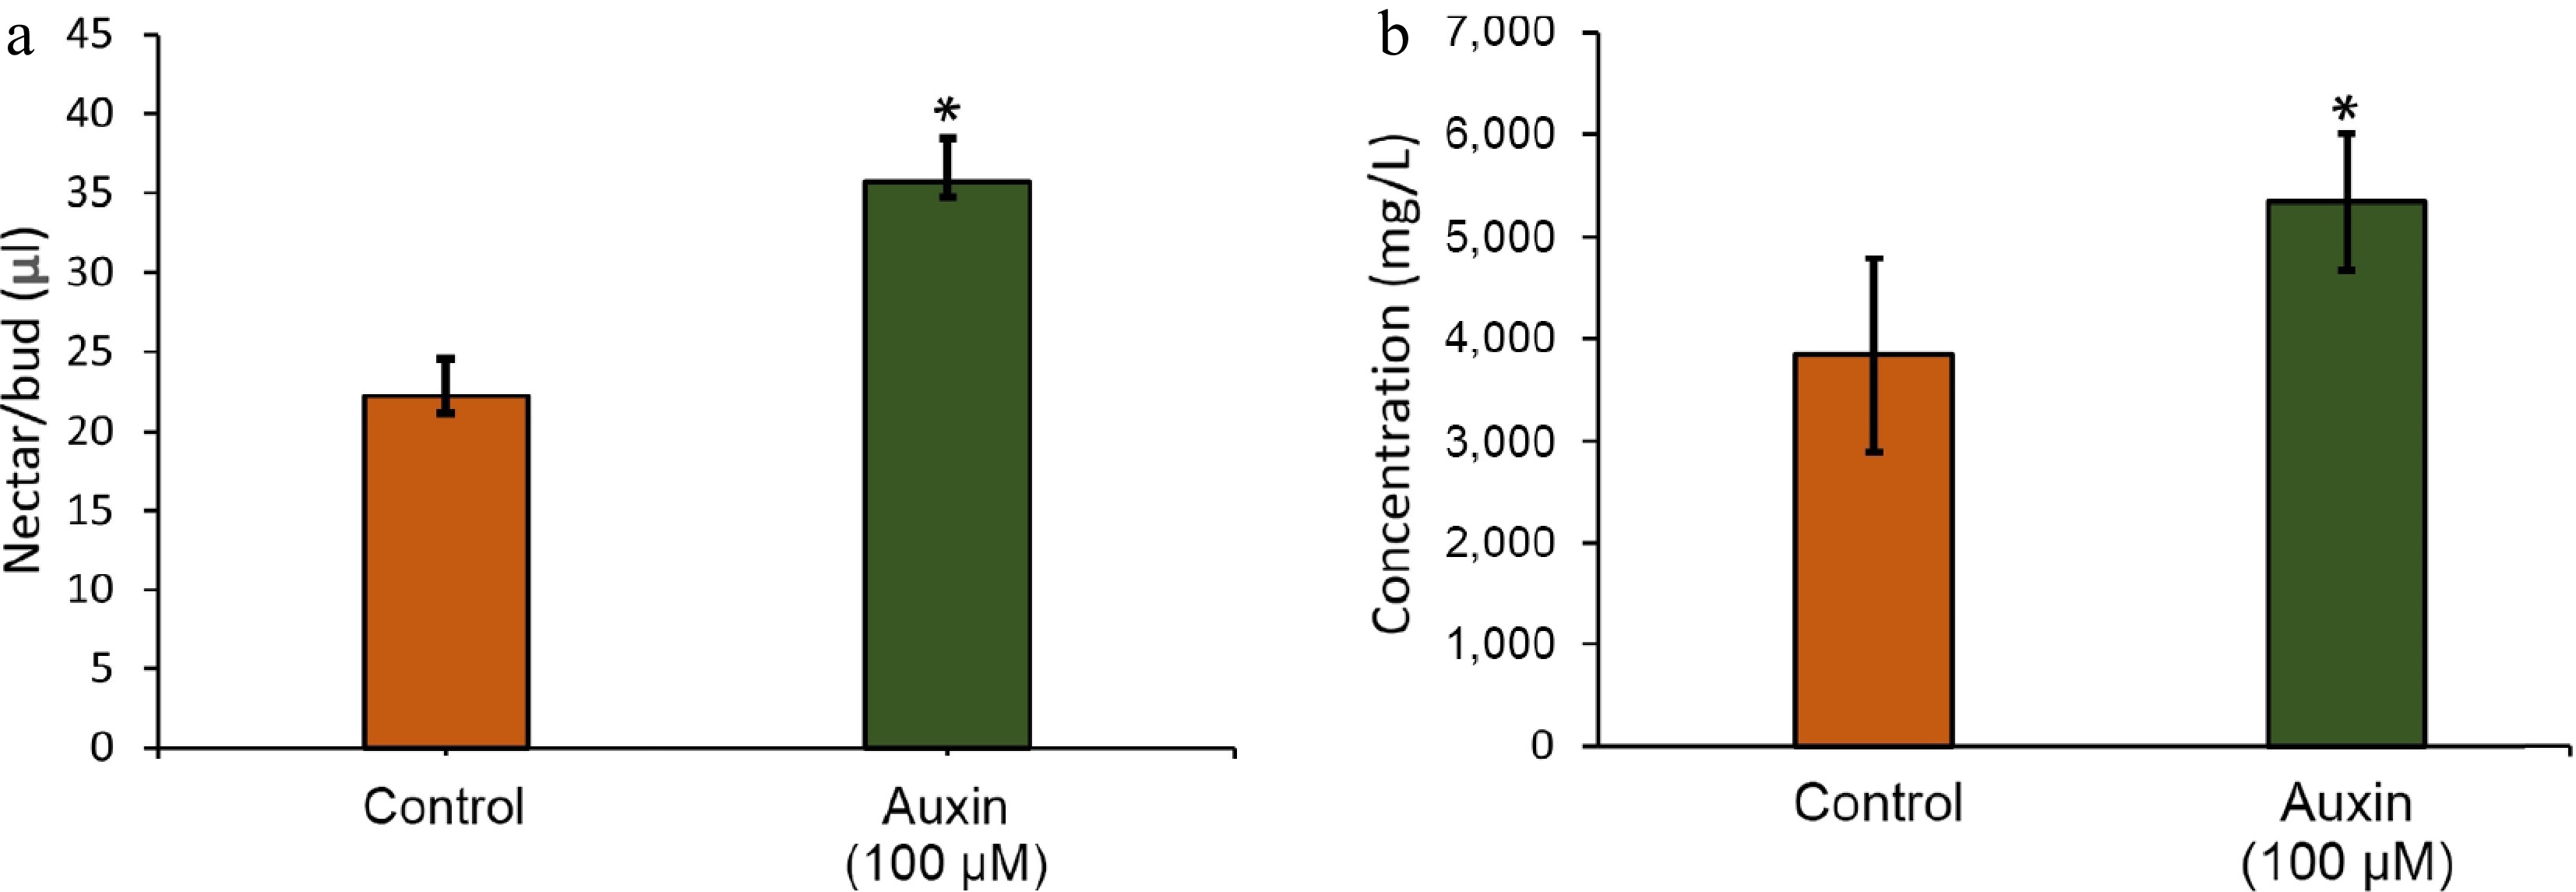
Figure 5.
(a) Volume of nectar as physically measured using a micropipette. (b) Total sugar concentration in the nectaries treated with control and auxin treatment.
-
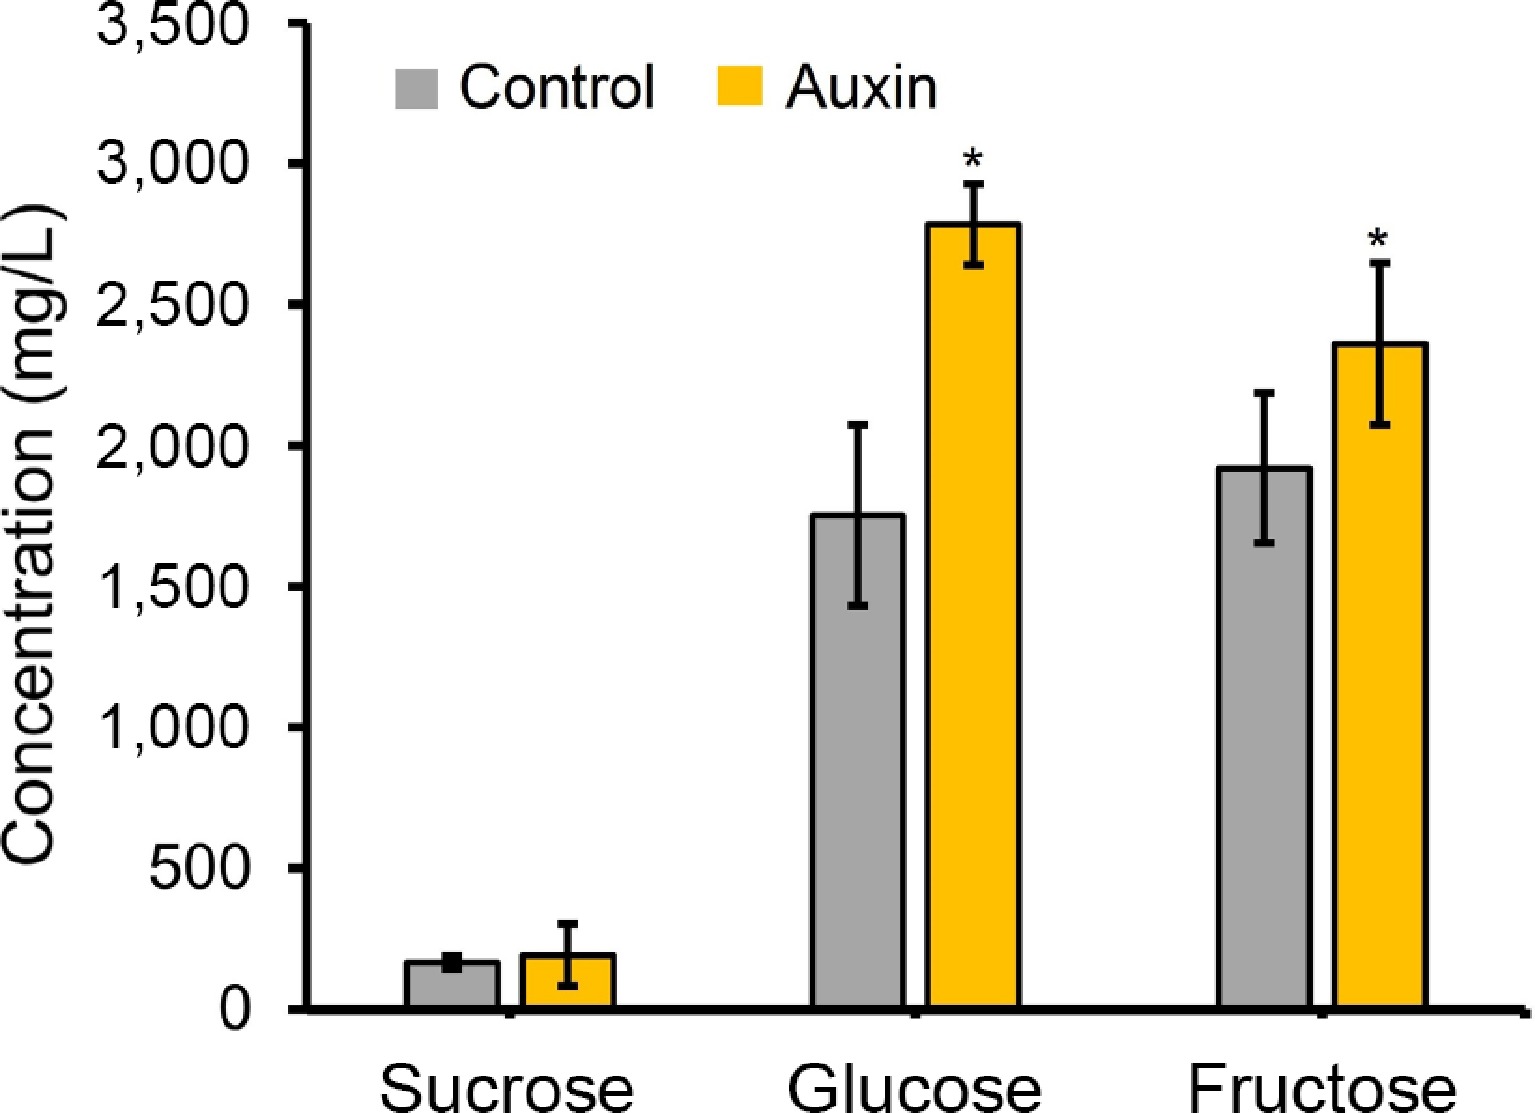
Figure 6.
Sugar component analysis from the nectar obtained (control and auxin [100 uM] treatments). Sugar components were detected using the HPLC method. * Represents statistical significance between the treatments.
-
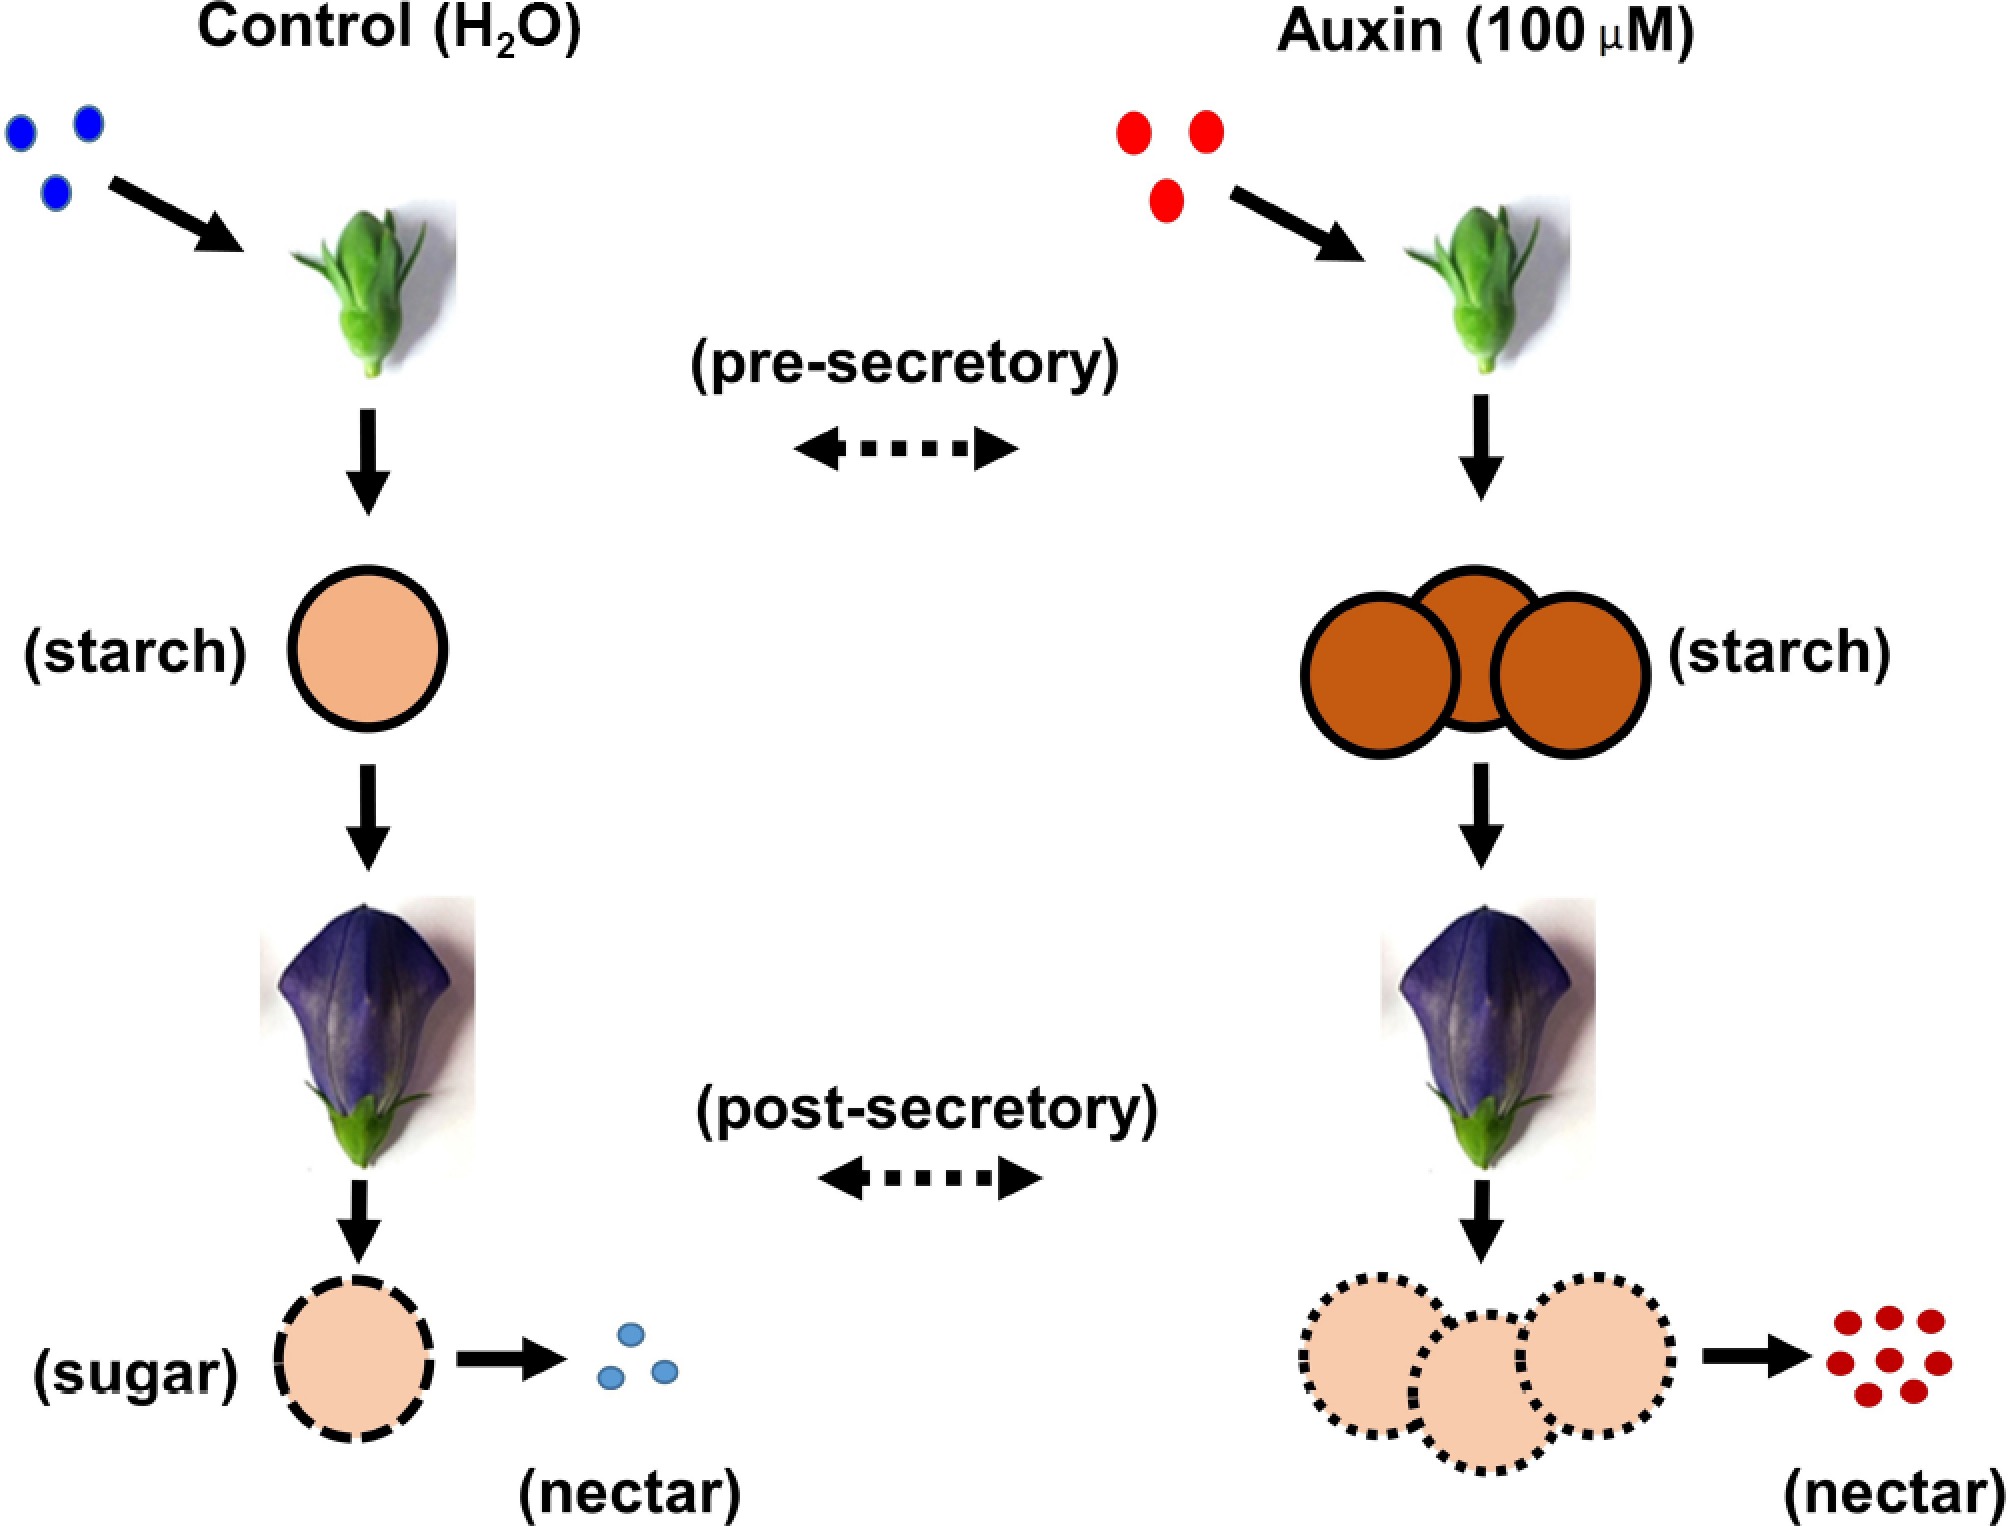
Figure 7.
Graphical illustration of the auxin treatment in the nectaries of P. grandiflorus.
Figures
(7)
Tables
(0)