-
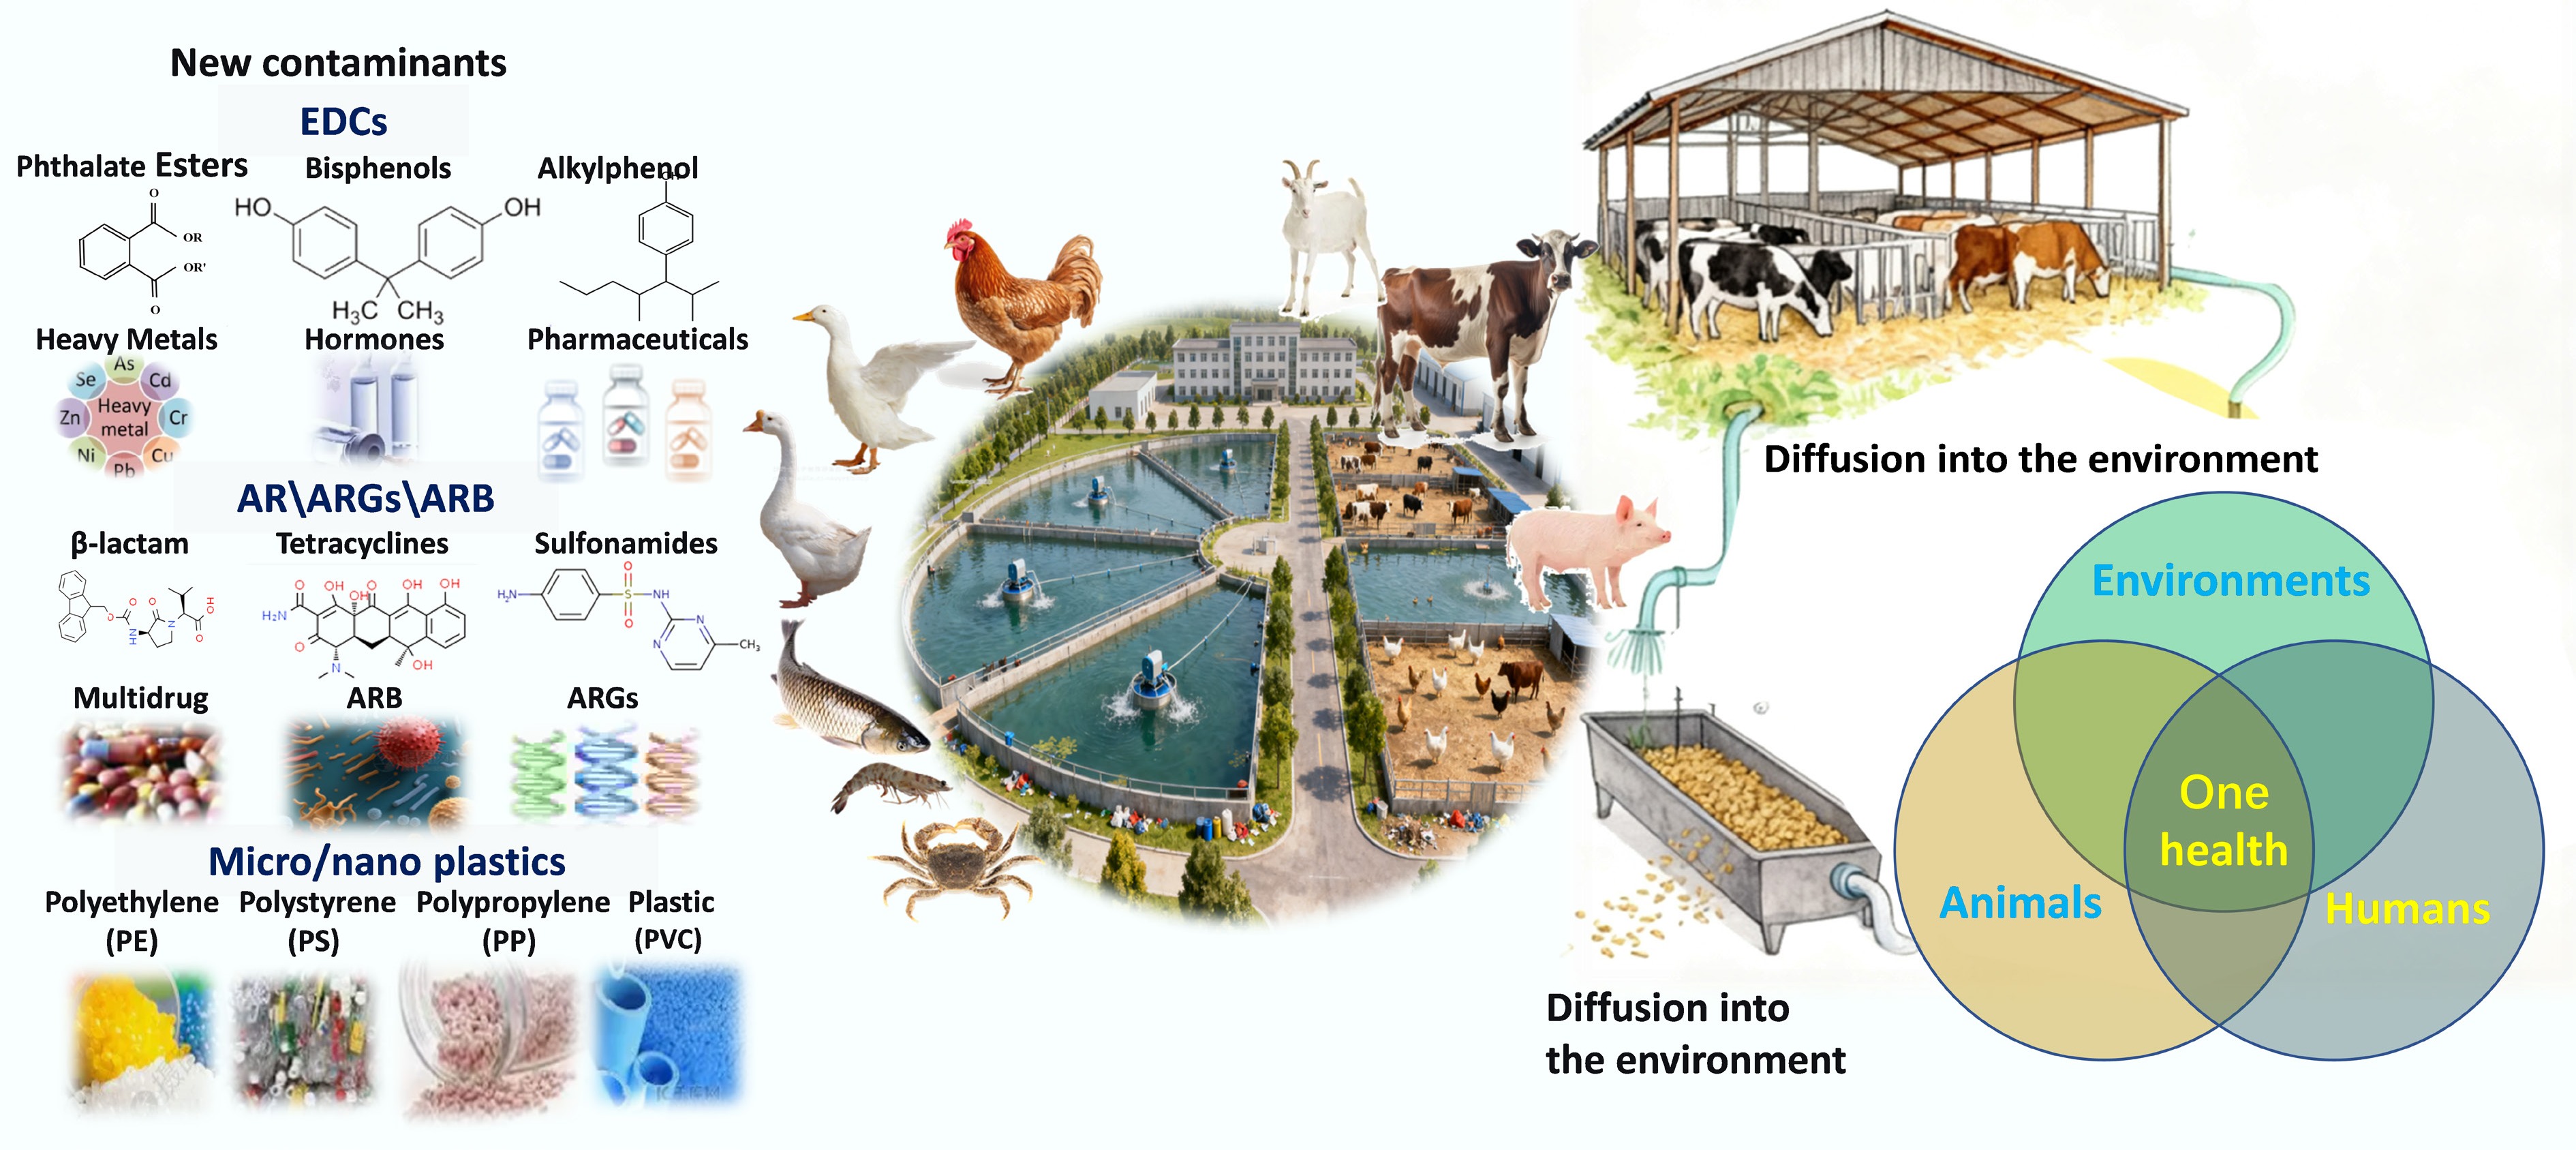
Figure 1.
New contaminants in aquaculture and livestock waste.
-
-
-
Category Antibiotic class/ARB type Main associated ARGs Main detected strains/genera Typical abundance and variation trends
in the environmentAntibiotics and ARGs Tetracyclines tetA, tetB, tetM, tetO, tetW, etc. Widely present in gut microbiota (Escherichia coli, Enterococcus spp.)
and the environmentHigh initial abundance in manure; reduced after aerobic composting, but genes may persist Sulfonamides sul1, sul2 Widely present in gut microbiota and the environment High environmental persistence; marker for fecal pollution; may remain after treatment β-lactam blaTEM, blaCTX-M, blaSHV, blaKPC, blaOXA-48, mecA, etc. Carbapenem-resistant Enterobacterales (CR-E), ESBL-producing E. coli/Klebsiella pneumoniae, and ampicillin-resistant
E. coliHigh abundance in hospitals and breeding wastewater; many strains and genes remain detectable in treated effluents, posing high risks MLSB ermB, ermC, lnuE, strA, etc. Gram-positive bacteria (such as Enterococcus spp.) Composting reduces viable bacterial counts, but genes may persist Aminoglycoside aac, aadA, aadB, etc. Enterobacterales, Enterococcus spp., etc. Common in multidrug-resistant strains FCA qnrS, aac(6')-Ib-cr, floR, cat, etc. E. coli, Salmonella spp., etc. Prevalent in breeding environment, selection pressure from florfenicol and quinolones Colistin mcr-1, mcr-2, etc. E. coli, Salmonella spp., etc. A concerning resistance to the last-resort antibiotic Vancomycin vanA, vanB, etc. Enterococcus spp. Important hospital-acquired resistant bacteria; potential detection risk in wastewater Multidrug acrA, acrB, mexB, oqxA, etc. Multidrug-resistant (MDR) E. coli, MDR Enterococcus spp. These efflux pump genes promote bacterial multidrug resistance, making them difficult to eliminate ARB Enterobacterales blaKPC, blaOXA-48, etc. E. coli, Klebsiella pneumoniae Extremely high risk; detectable after treatment ESBL-producing
E. coli/Klebsiella pneumoniaeblaCTX-M-15, blaCTX-M-14,
etc.E. coli, Klebsiella pneumoniae Common in medical and breeding environments; remains detectable in treated effluents Ampicillin-resistant E. coli blaTEM-1, etc. E. coli High initial count (~108 CFU/g); significantly reduced after aerobic composting Multidrug-resistant (MDR) E. coli/
Enterococcus spp.A combination of multiple genes mentioned above E. coli, Enterococcus spp. High proportion in hospital wastewater; remain detectable in treated effluents ARB in aquaculture environments Genes associated with
β-lactams, macrolides, tetracyclines, sulfonamides, etc.Enterococcus spp., Morganella spp., Klebsiella pneumoniae, Serratia spp.,
etc.Widely distributed across all sites in the breeding environment; may cause cross-contamination during processing Table 1.
Distribution and characteristics of AR, ARB, and ARGs
-
Species category Types Medium Main types Concentration (ww) Detection rate Ref. Chicken Antibiotic residues Manure, breeding wastewater Tetracyclines, fluoroquinolones, sulfonamides, cephalosporins Tetracyclines: highest (9.7 × 10³–3.2 × 10⁴ μg/kg); Fluoroquinolones: 430.7 μg/kg Core antibiotics: 100%; Sulfonamides: 35% [41,42] ARGs Manure, breeding wastewater tet family (tetO/tetW), sul family (sul1/sul2), bla family Total ARG abundance: 106–1011 copies/g; tet family: 106–108 copies/g; 100% [41,45] ECDs Manure E1, 17β-E2, E3 E1: 28.72 μg/kg; 17β-E2: 3.95 μg/kg; E3: 7.4 μg/kg Overall detection rate: 71.42% [25] MPs Manure, chicken farm environment PE, PS, PET, Nylon Fibers, PP 6.67 × 10² ± 9.90 × 10² particles/kg 50%−100% [50] Swine Antibiotic residues Manure, swine farm wastewater Tetracyclines, fluoroquinolones, sulfonamides Tetracyclines: 8.9 × 10³–3.0 × 10⁴ μg/kg; Fluoroquinolones: 1,670.58–7,832 μg/kg; Sulfonamides: 148.3 μg/kg Tetracyclines: 90%; Sulfonamides: 33% [41−43] ARGs Manure, swine farm wastewater tet family, sul family, ermB Total ARG abundance: 107–109 copies/g; tet family: 106–108 copies/g; Swine farm wastewater:
106–1012 copies/mL100% [40,45] ARB Manure ESBL-producing Escherichia coli (E. coli), LA-MRSA ESBL-producing Escherichia coli: 1.8 × 10³–5.2 ×
103 CFU/g; LA-MRSA: 1.2 × 10²–3.5 × 10² CFU/g42%–60%; 25%–38% [40,45] EDCs Breeding wastewater, manure Breeding wastewater: natural estrogens: 17α-E2, 17β-E2, E1 Manure: E1 Breeding wastewater: 17α-E2: 10.9 ng/L, 17β-E2:
8.0 ng/L, E1: 27.3 ng/L, Total estrogens: 46.2 ng/L; Manure: E1: ND ~21 μg/kgBreeding Wastewater: 17α-E2, 17β-E2, E1: 100%; [25,54] MPs Manure, intestinal tract, lung tissue PP, PE, PR, PES, PA, PET Manure: 9.02 × 10² ± 1.29 × 10³ particles/kg
(17.6% < 0.5 mm); Intestinal tract: 9.6 × 10³ particles/kg; Lung tissue: 1.8 × 10⁵ particles/kgManure: 100%; Tissues: 90% [50,55,56] Cow Antibiotic residues Manure, rumen contents, cow farm wastewater Tetracyclines, fluoroquinolones, sulfonamides, macrolides Tetracyclines: 30.07–51.36 μg/kg;
Fluoroquinolones: 77.19 μg/kg;
Sulfonamides: 9.26 μg/kgCore antibiotics: 75%–90% [41−43] ARGs Manure, rumen contents tet family, ermB, sul1, ermB, blaCTX-M Total ARG abundance: 105–108 copies/g;
ermB: 105−106 copies/g95% [45−47] EDCs Breeding Wastewater, manure Natural estrogens: 17α-E2, Breeding wastewater:17β-E2, E1 Manure: E3, 17β-E2, BPA Breeding Wastewater:17α-E2: 19–1,028 ng/L, 17β-E2: 29–289 ng/L, E1: 41–3,057 ng/L, Total estrogens:
60 – over 4,000 ng/L; Manure: E3: ND–240.9 µg/kg,
17β-E2: ND–88.3 µg/kg, BPA: ND–33.3 µg/kg17α-E2, 17β-E2, E1: 85.7%; E3: 20%, 17β-E2: 80%, BPA:50% [26,54,57] MPs Manure PE, PP, PET, PVC 7.40 × 101 ± 1.29 × 10² particles/kg; Manure: 75%−100%; Rumen: 80% [55,58,59] Sheep ARGs Manure, rumen contents tet family (tetO/tetQ/tetW), ermF Total ARG abundance: 105–107 copies/g; tet family: 104−106 copies/g 100% [45,60,61] ARB Manure Enterococcus spp. 1.2 × 10³–3.6 × 10³ CFU/g 95% EDCs Breeding wastewater Natural estrogens: 17α-E2, 17β-E2, E1 17α-E2: 172 ng/L, 17β-E2: 47.1 ng/L, E1: 157 ng/L, Total estrogens: 376.1 ng/L; 17α-E2, 17β-E2, E1: 100%; [54] MPs Manure, intestinal tract PE (Low-Density), PP, PET, PA Manure: 997±971 particles/kg; Intestinal tract: 102–103 particles/kg Manure: 92%; Intestinal tract: 100% [55,58] PR: Polyester; ARGs: Antibiotic Resistance Genes; ARB: Antibiotic-Resistant Bacteria; EDCs: Endocrine-Disrupting Compounds; MPs/NPs: Microplastics/Nanoplastics; PE: Polyethylene; PS: Polystyrene; PET: Polyethylene Terephthalate; PP: Polypropylene; PVC: Polyvinyl Chloride; PA: Polyamide; PES: Polyethersulfone; LDPE: Low-Density Polyethylene; ESBL: Extended-Spectrum β-Lactamase; LA-MRSA: Livestock-Associated Methicillin-Resistant Staphylococcus aureus; 17α-E2: 17α-estradiol; 17β-E2: 17β-estradiol; E1: Estrone. Table 2.
Comparison of concentrations of NCs across different livestock and poultry farming systems
-
Species category Pollutant type Sample type Main types Concentration Ref. Tilapia Antibiotics Pond water TMP, CFX, etc. 94.30 ± 11.56 ng/L [68] Organism tissues SDZ, SDM, SQX, CFX, TC, ETM, CTM, RTM 17.20 ± 1.51 ng/g ww Olive flounder Antibiotics Aquaculture effluent AMX, FLO, OXO, OTC AMX: 39–1,145 ng/L [67] FLO: 22–1,448 ng/L OXO: 31–992 ng/L OTC: 33–9,935 ng/L Grass carp Antibiotics Pond water ETM-H2O, SMX, LIN, etc. 222–1,792 ng/L [69] Pacific white shrimp Antibiotics Aquaculture tailwater FLO, ENR, SMX, TMP, etc. 8,600–29,000 ng/L [70] Organism tissues TMP, ENR, SMX, CIP, FLO, TPL 0.072–11.8 μg/kg ww Salmon EDCs Aquaculture effluent Estrone, testosterone, androstenedione About 1–2 ng/L [73] Eel EDCs Organism tissues PFAS 3.3–67 ng/g ww [72] Mussel, oyster, abalone, lobster EDCs Organism tissues (abalone) PFAS 0.12–0.49 ng/g ww [71] Organism tissues (mussel) PFAS 4.83–6.43 ng/g ww Organism tissues (oyster) PFAS 0.64–0.66 ng/g ww Organism tissues (lobster) PFAS 0.22 ng/g ww Grass carp MPs Aquaculture water Predominantly PP, PE 10.3–87.5 particulars/L [74] Multiple fish species MPs Lagoon water PP, PE, HDPE, PS, etc. 0.00–0.30 particulars/L [78] Organism tissues PE, PP, nylon-12, polyacetylene 1–1.5 microplastics per fish Oyster MPs Seawater PU, PA 144.27 ± 42.48 particulars/L [75] Eel and crayfish MPs Rice-fish culture station water PE, PP, PVC 0.4 ± 0.1 particulars/L [77] Organism tissues (fish) PE, PP, PVC 3.3 ± 0.5 particulars/L Organism tissues (shrimp) PE, PP, PVC 2.5 ± 0.6 particulars/L Fish, crayfish, crab MPs Fish pond PE, PP, PET, PVC 83–550 particulars/m3 [76] Shrimp pond PE, PP, PET, PA 233–733 particulars/m3 Crab pond PE, PP, PET, PS, PA 500–750 particulars/m3 TMP: Trimethoprim; CFX: Ciprofloxacin; SDZ: Sulfadiazine; SDM: Sulfadimethoxine; SQX: Sulfaquinoxaline; TC: Tetracycline; ETM: Erythromycin; CTM: Clarithromycin; RTM: Roxithromycin; AMX: Amoxicillin; FLO: Florfenicol; OXO: Oxolinic Acid; OTC: Oxytetracycline; SMX: Sulfamethoxazole; LIN: Lincomycin; ENR: Enrofloxacin; CIP: Ciprofloxacin; TPL: Thiamphenicol; PP: Polypropylene; PE: Polyethylene; HDPE: High-Density Polyethylene; PS: Polystyrene; PU: Polyurethane; PA: Polyamide; PVC: Polyvinyl Chloride; PET: Polyethylene Terephthalate; EDCs: Endocrine-Disrupting Compounds; PFAS: Per- and Polyfluoroalkyl Substances; MPs: Microplastics. Table 3.
Comparison of concentrations of new contaminants across different aquaculture types
-
Sample Treatment ARGs Abundance after treatment Removal efficiency Ref. Swine manure Anaerobic digestion tet, erm 1.0 × 10⁻¹–4×10⁻² copies/16S rRNA 0.30 log decrease [129] sul, fca, aac 9.07× 10⁻¹ copies/16S rRNA 1.4–52 times increase [129] tet, sul, erm, fca 104–109 copies/g 1.45 times increase [130] tet, erm, sul ~3 × 10⁻² copies/16S rRNA 1.03–4.23 log decrease [131] Cattle manure fca 1.69 × 10⁸ copies/g 1.77 times decrease [132] Swine manure Composting tet, aac, mdr, sul, bla 5 × 10⁻⁵ (percentage of iTags) 0.74–1.9 log decrease [133] Cattle manure tet, sul, aac, erm, bla, mdr, fca, van 3 × 10⁻² copies/16S rRNA 0.70 log decrease [46] sul, erm aac, bla 4.6 × 10⁶–5.01 × 10⁹ copies/g 1.0–2.0 log decrease [138] Poultry manure aac, bla, fca, erm, mdr, sul, tet, other aac, bla, fca, erm, mdr, sul, tet, other 8 × 10⁻²–4 × 10⁻¹ copies/16S rRNA 0.92–1.4 log decrease [40] Swine wastewater Biological treatment process tet, sul, bla 10–105 copies/mL 0.09–2.7 (tet), 0.17–1.7 (sul) 0.11–2.0 (bla) log decrease [139] tet, sul, erm, fca, mcr 3.1 × 10–7.1 × 105 copies/mL 0.3–3.1 log decrease [140] tet, sul 2.6 × 10⁸–1.1 × 10 copies/mL 0.57–0.94 log decrease [141] tet, sul 1.0 × 10⁵–1.5 × 10¹⁰ copies/mL 0.1–3.3 log decrease [142] Swine wastewater Constructed wetlands tet 10−3–10−1 copies/16S rRNA 0.26–3.0 log decrease [143] tet 3 × 10⁻³–1 × 10⁻² copies/16S rRNA 0.18–2.0 log decrease [144] Aquaculture wastewater Advanced oxidation technology sul1, tetX, intl1, qnrS − 1.02 (sul1), 1.09 (tetX), 0.33 (intl1) 0.33 (qnrS) log decrease [114] Table 4.
ARGs removal efficiency under different treatment strategies
-
Technology category Specific technology Target pollutants Removal efficiency Cost level Technical complexity Secondary pollution risk Application scenarios Core advantages Limitations Ref. Source reduction technologies Antibiotic substitutes (such as essential oils/
antimicrobial peptides)Pathogens, antibiotic-dependent needs Antibiotic usage reduced by 30%–50% Medium Low No Feed additives, disease prevention Reduces antibiotic input at the source, aligns with green aquaculture High cost of some substitutes; efficacy varies by aquaculture species [98] [102] [108] Precision medication + regulatory control Excessive antibiotics, antibiotic residues Antibiotic usage reduced by 30%–50% Low Medium No Large-scale livestock farms Simple operation, easy to implement Relies on farmers' cooperation; high regulatory costs [108] Enzyme preparations/probiotic addition ARB, harmful intestinal microorganisms Significantly reduces ARB abundance Medium Low No Feed additive in livestock farming Improves intestinal environment; synergistically enhances aquaculture benefits Probiotic survival affected by feed processing technologies [106] [109] Advanced oxidation processes (AOPs) Persulfate-based advanced oxidation Refractory antibiotics, ARGs Enrofloxacin (ENR) removal: 98%; ARGs reduced by 1.02–1.09 log units Medium-High Medium-High Potential formation of small amounts of oxidation byproducts End-of-pipe treatment of aquaculture wastewater Wide pH adaptability; long half-life Requires catalyst addition or energy input; high cost [110] [111] Ozonation Antibiotics, pathogens Highly efficient antibiotic removal Medium-High Medium Formation of harmful disinfection byproducts in seawater End-of-pipe treatment of freshwater aquaculture wastewater High oxidation efficiency; fast reaction rate Not suitable for mariculture; byproduct risks [114] Adsorption and Flocculation technologies Biochar adsorption Antibiotics, microplastics, ARG carriers Antibiotic adsorption rate: 99%; microplastic removal rate: > 95% Low-Medium Low Incineration required after adsorption saturation Pretreatment/
advanced end-of-pipe treatment of various aquaculture wastewatersWide raw material sources; resource recycling potential Regeneration or safe disposal required after saturation [116] [118] Biofloc technology (BFT) ARB, nitrogen and phosphorus pollutants ARB inhibition rate: > 80%; Total Nitrogen (TN) removal: 60%–70% Low Medium Dissolved oxygen (DO) < 2 mg/L due to excessive flocs Zero-exchange aquaculture systems Zero water exchange; dual functions of pollution control and feed substitution Precise regulation of water quality parameters (such as C/N ratio) required [117] Biological and Ecological technologies Anaerobic digestion Organic pollutants, partial ARGs tet/erm genes reduced by 0.30 log units; partial ARGs reduced by 1.03–
4.23 log unitsLow-Medium Medium ARG residues in biogas slurry Treatment of aquaculture solid wastes Biogas resource recovery; low energy consumption Enrichment of partial ARGs (sul/fca/aac) likely [131] Constructed wetland Antibiotics, nitrogen and phosphorus, ARGs Antibiotic removal rate: up to 98% Low Low No End-of-pipe treatment of small-to-medium scale aquaculture wastewater Low cost; eco-friendly; synergistic landscape benefits Large land occupation; affected by environmental factors [135] [137] Recirculating aquaculture
system (RAS)Pollutants, pathogens, antibiotic residues Closed-loop water reuse; efficient pollution control High High No High-end aquaculture Water-saving and emission reduction; controllable aquaculture environment High investment
and operation costs; high technical requirements for maintenance[125] [127] Table 5.
Core governance technologies comparison
Figures
(3)
Tables
(5)