-
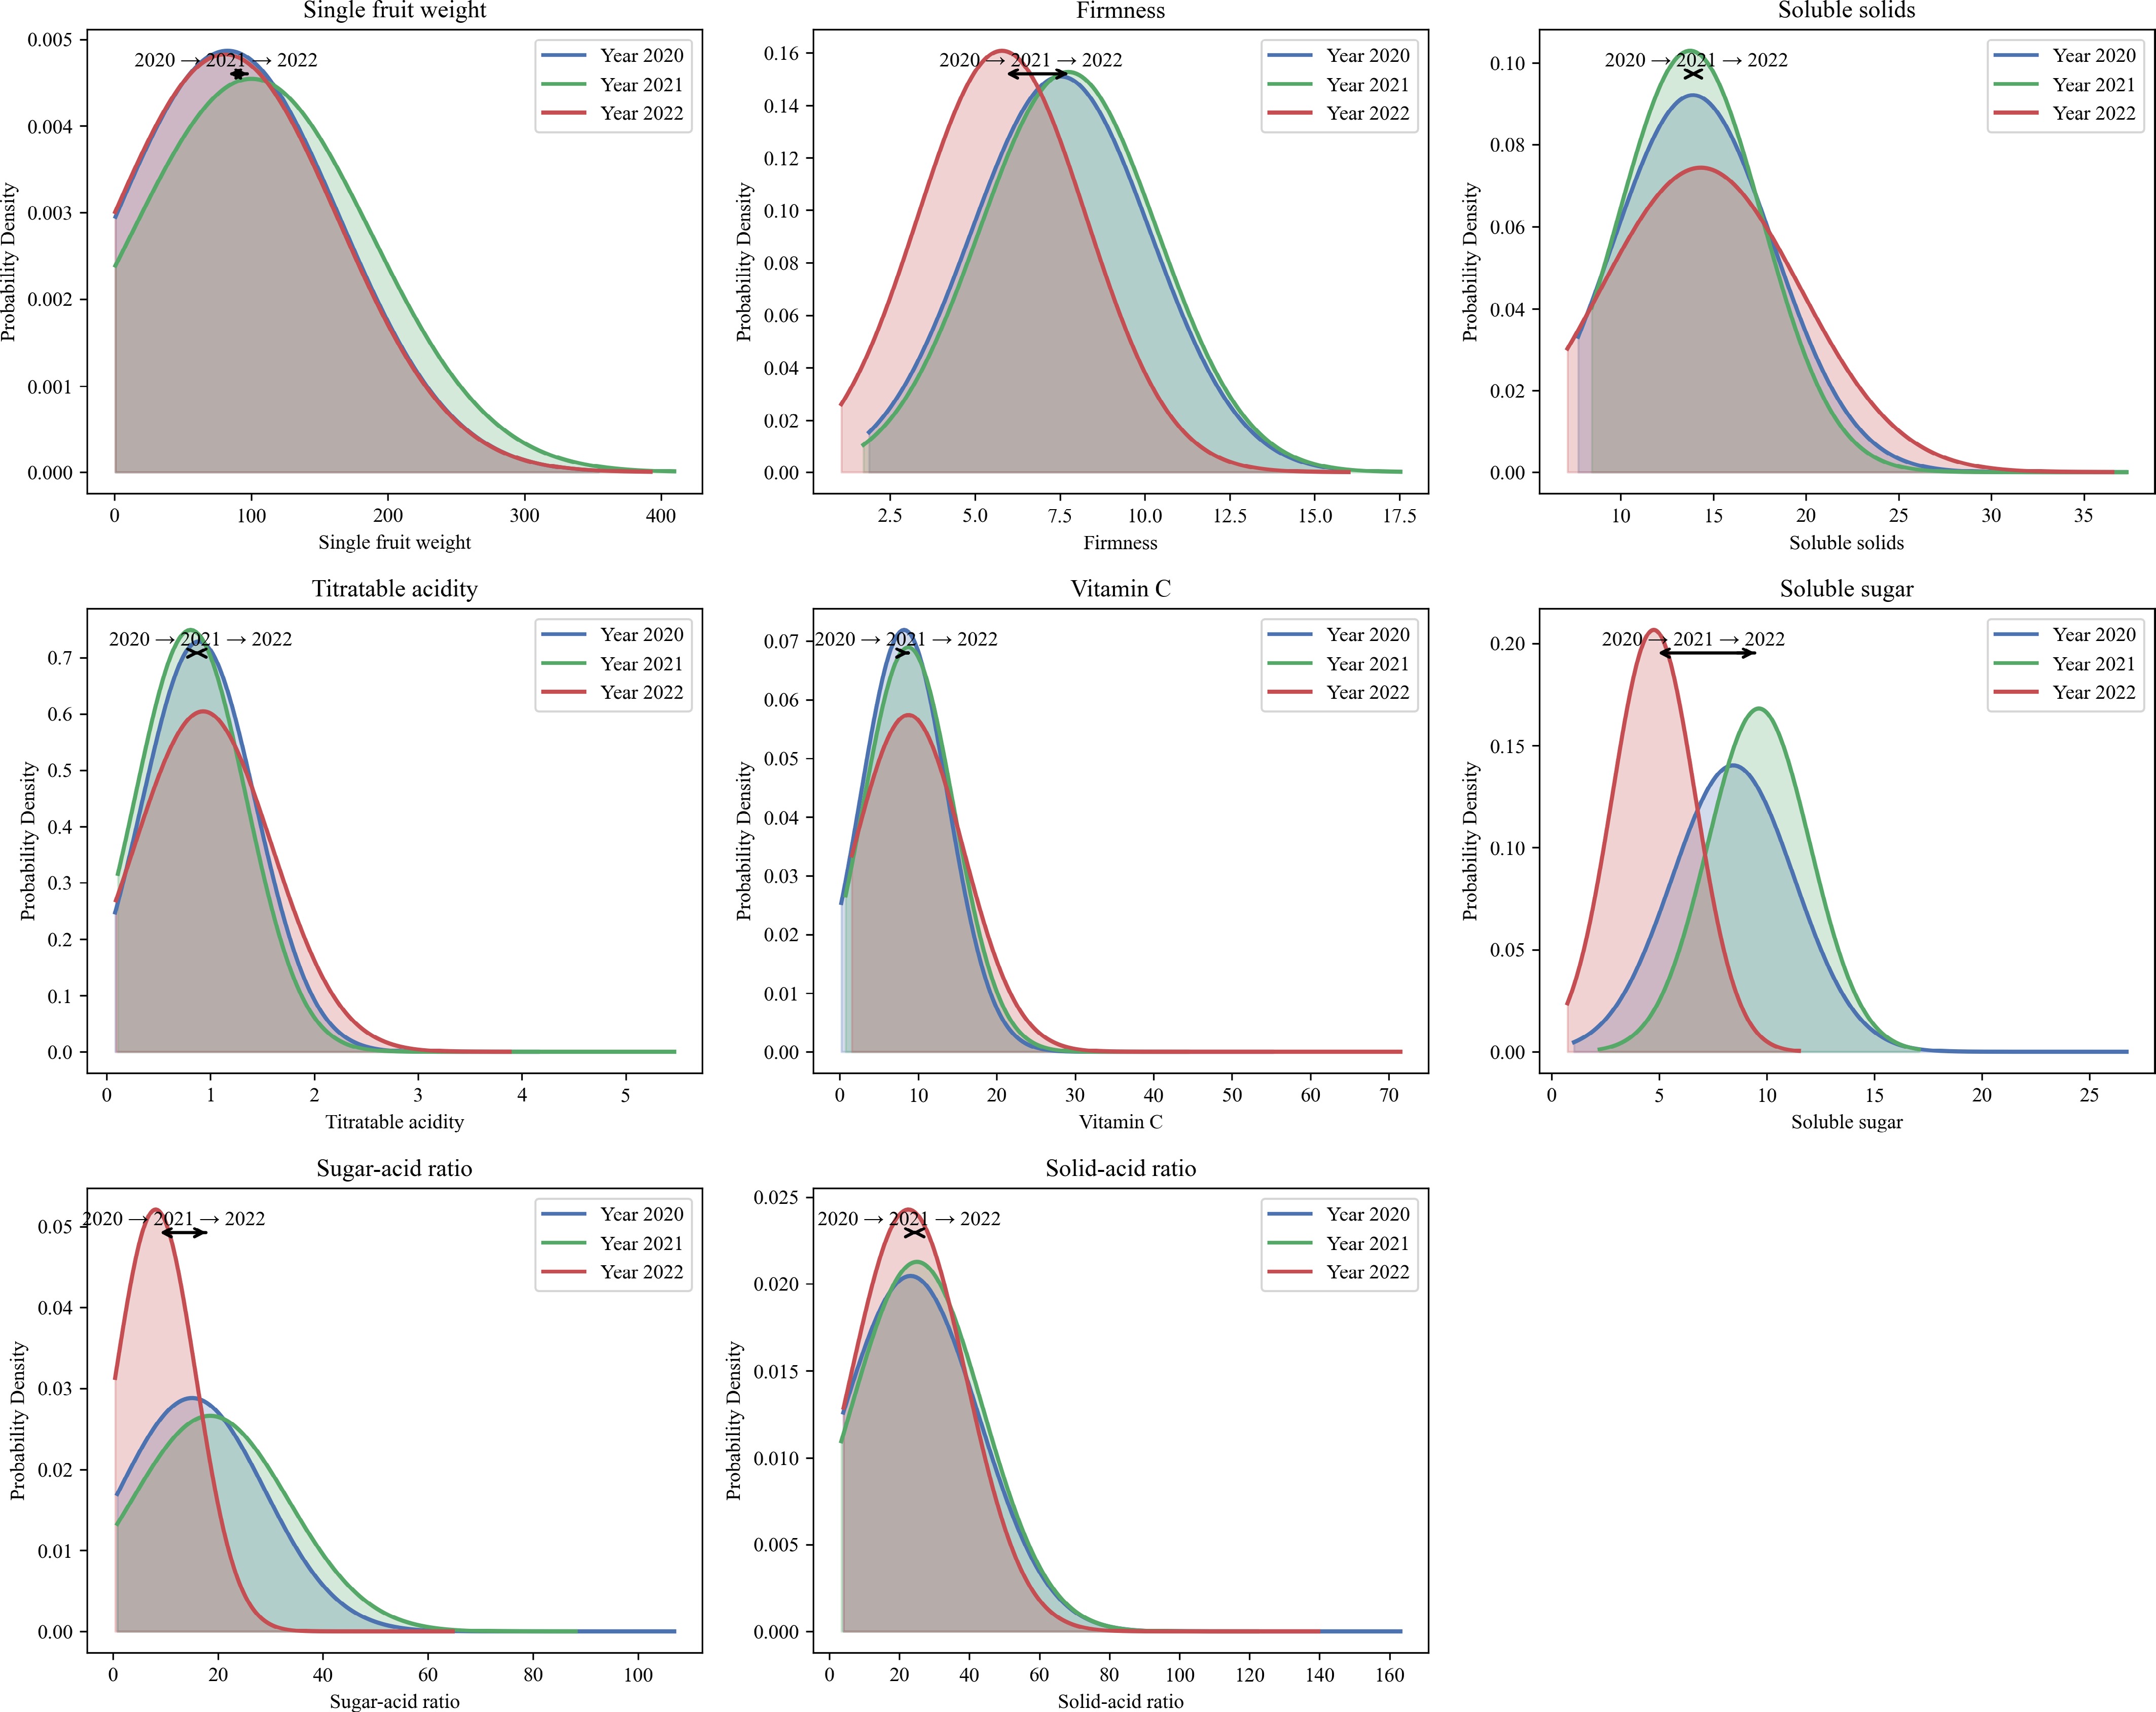
Figure 1.
Probability density curves for eight apple fruit phenotypic traits across three years (2020–2022). Note: Each subplot shows the fitted normal distribution of the trait for each year (2020: blue, 2021: green, 2022: red). Curves are shaded to visualize the distribution range. Arrow annotations mark the mean value shift among years, indicating trends in trait changes over time.
-
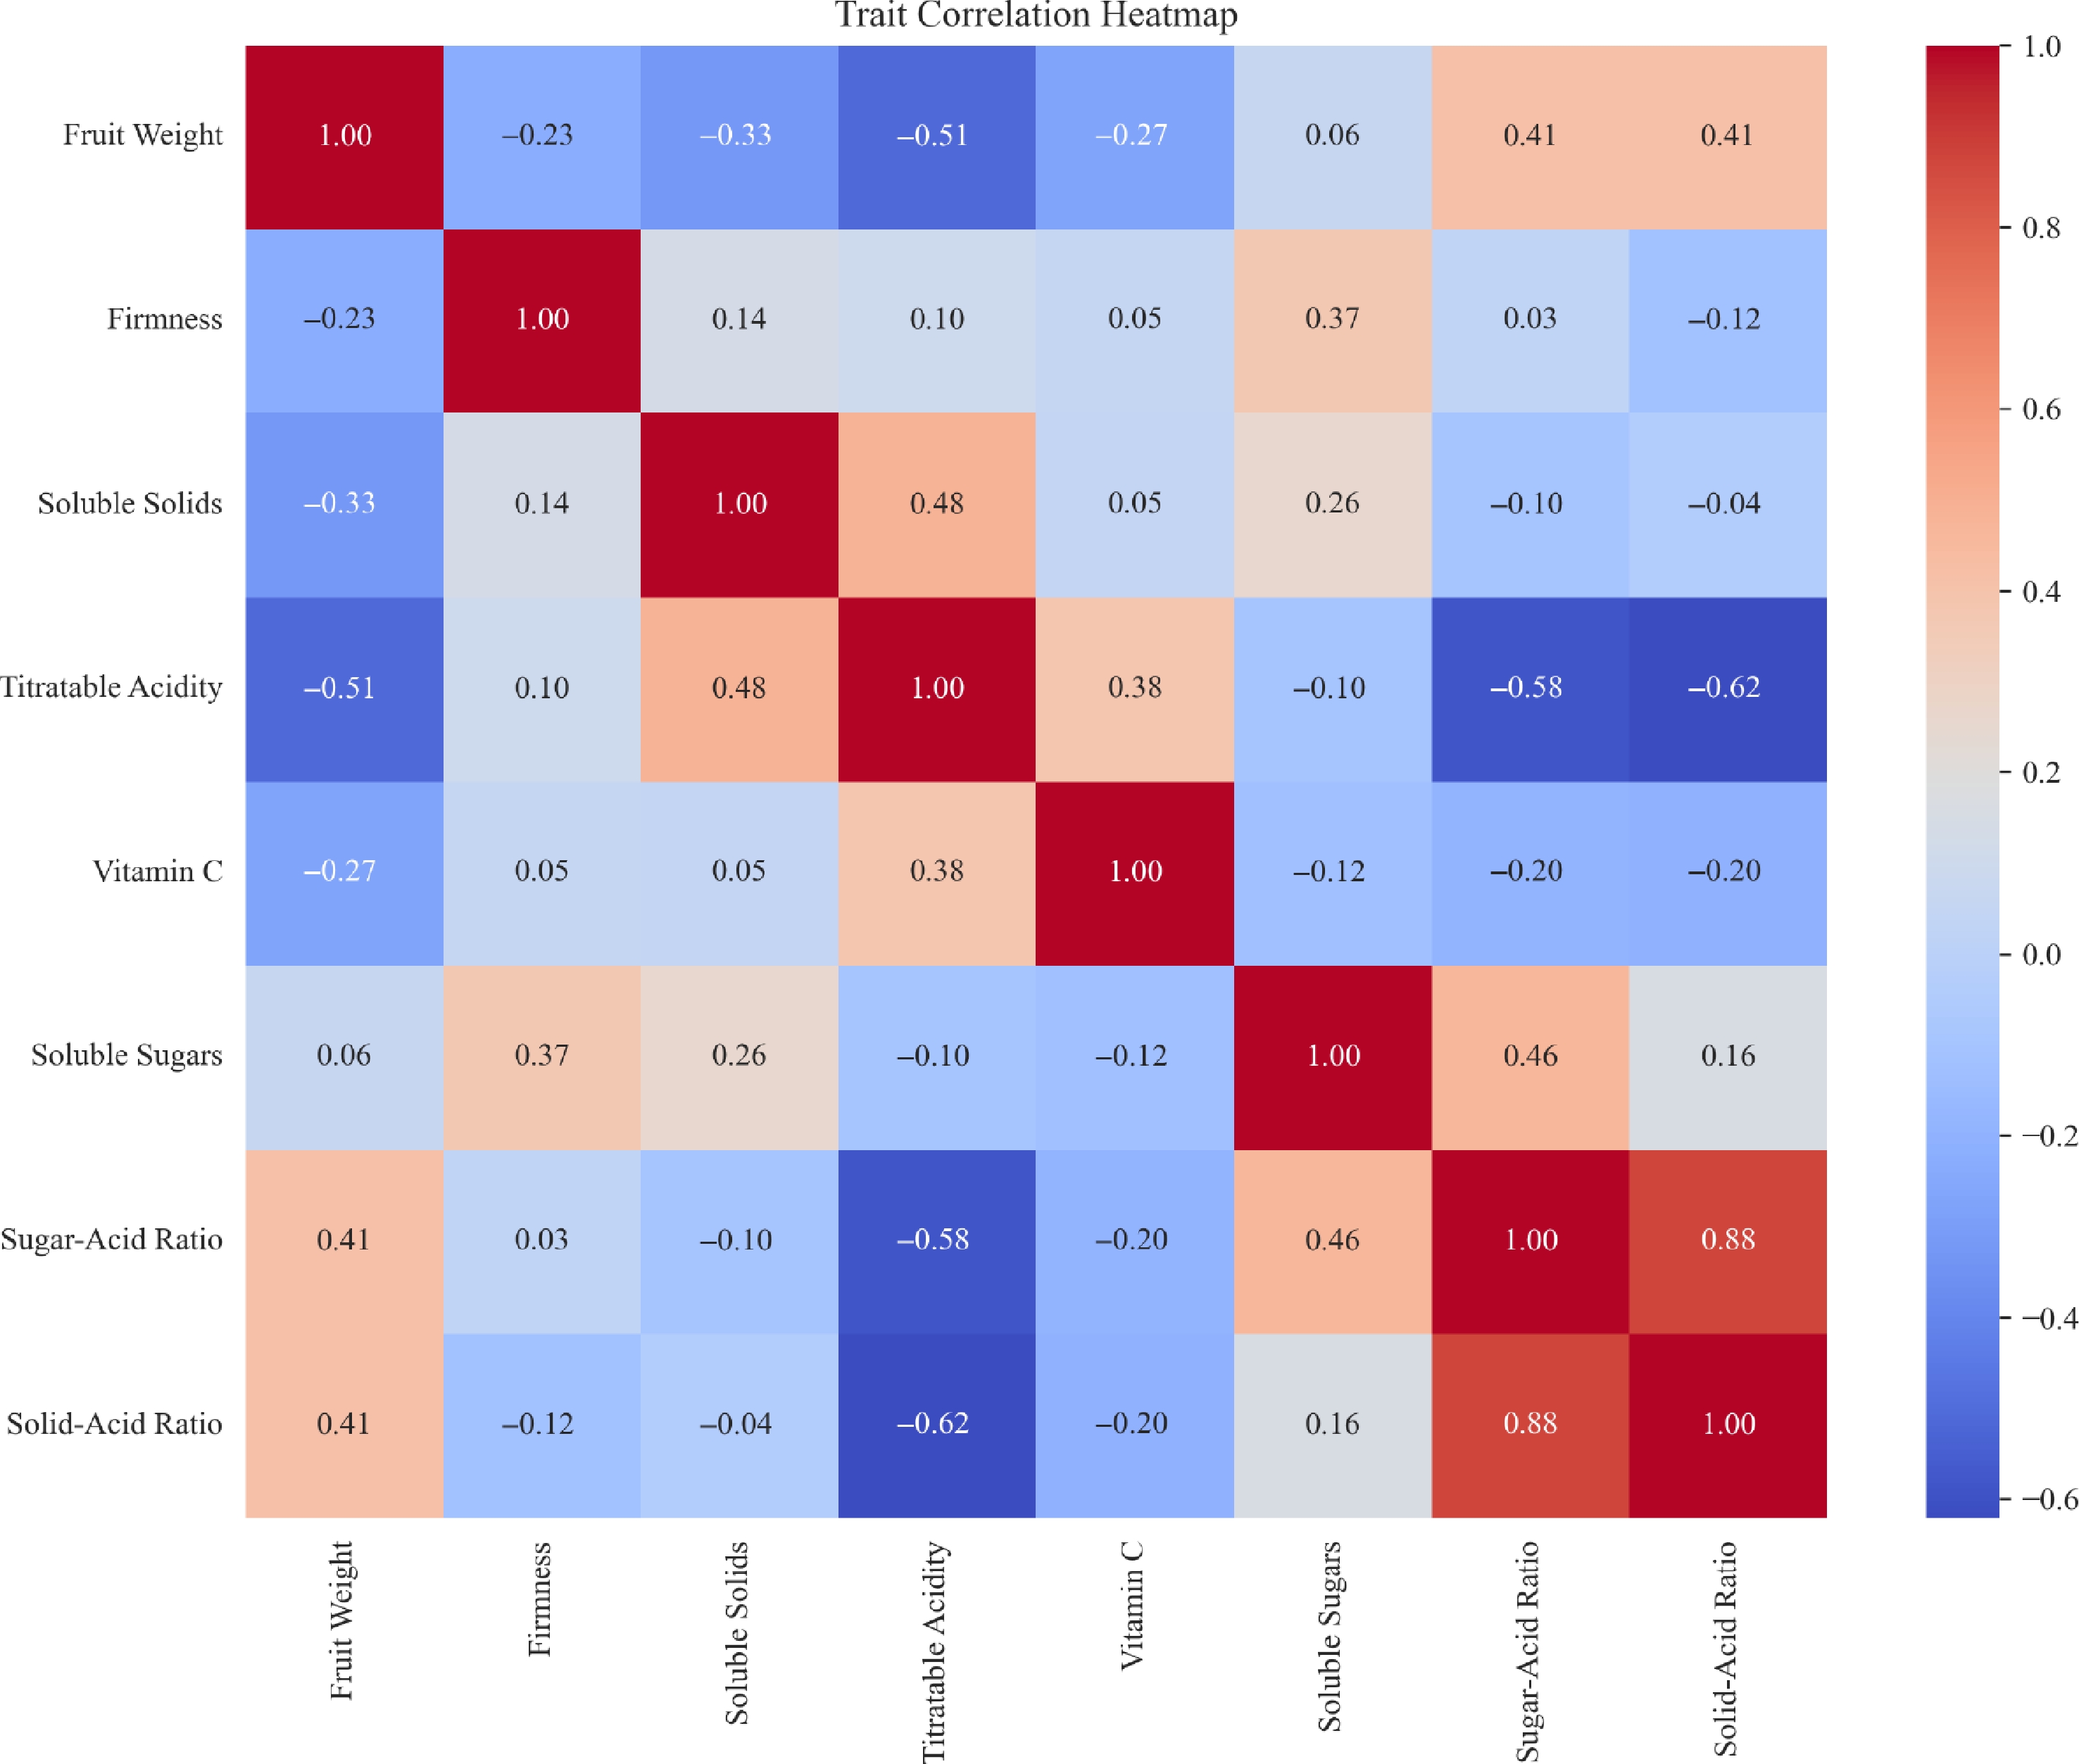
Figure 2.
Correlation heatmap of eight apple fruit phenotypic traits.
-
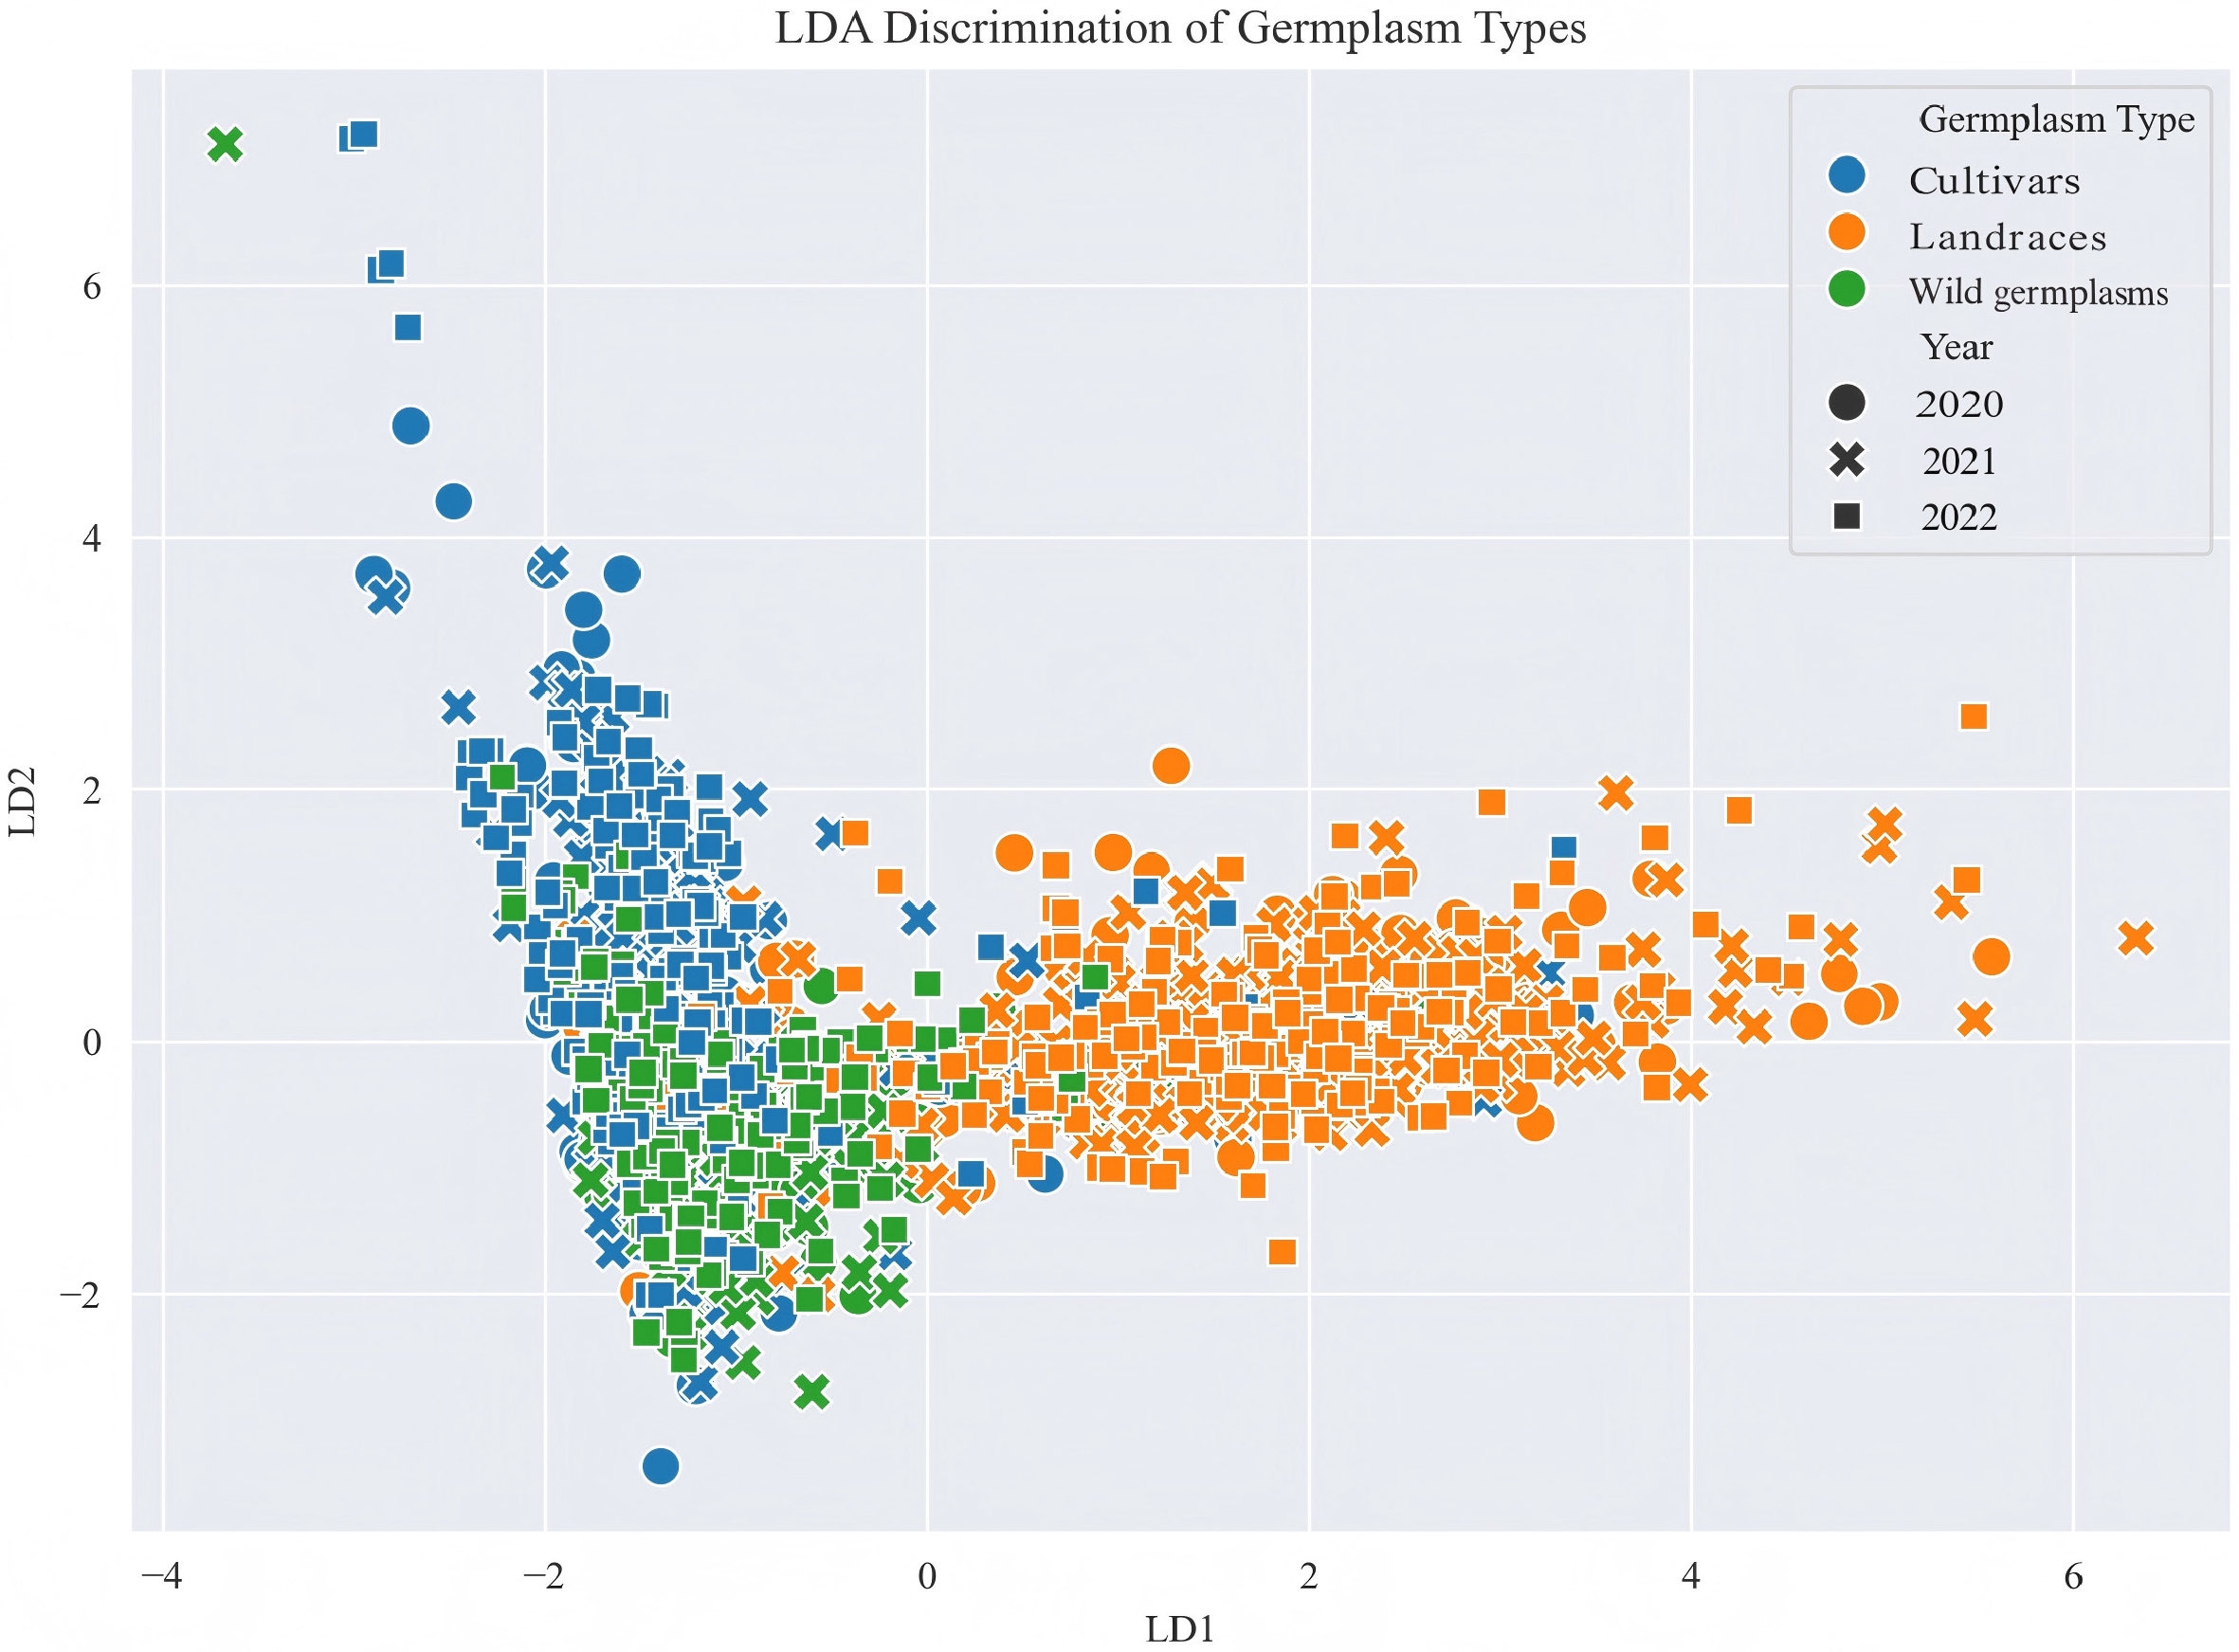
Figure 3.
Results of a LDA of the phenotypic traits of apple germplasm resources in three years.
-
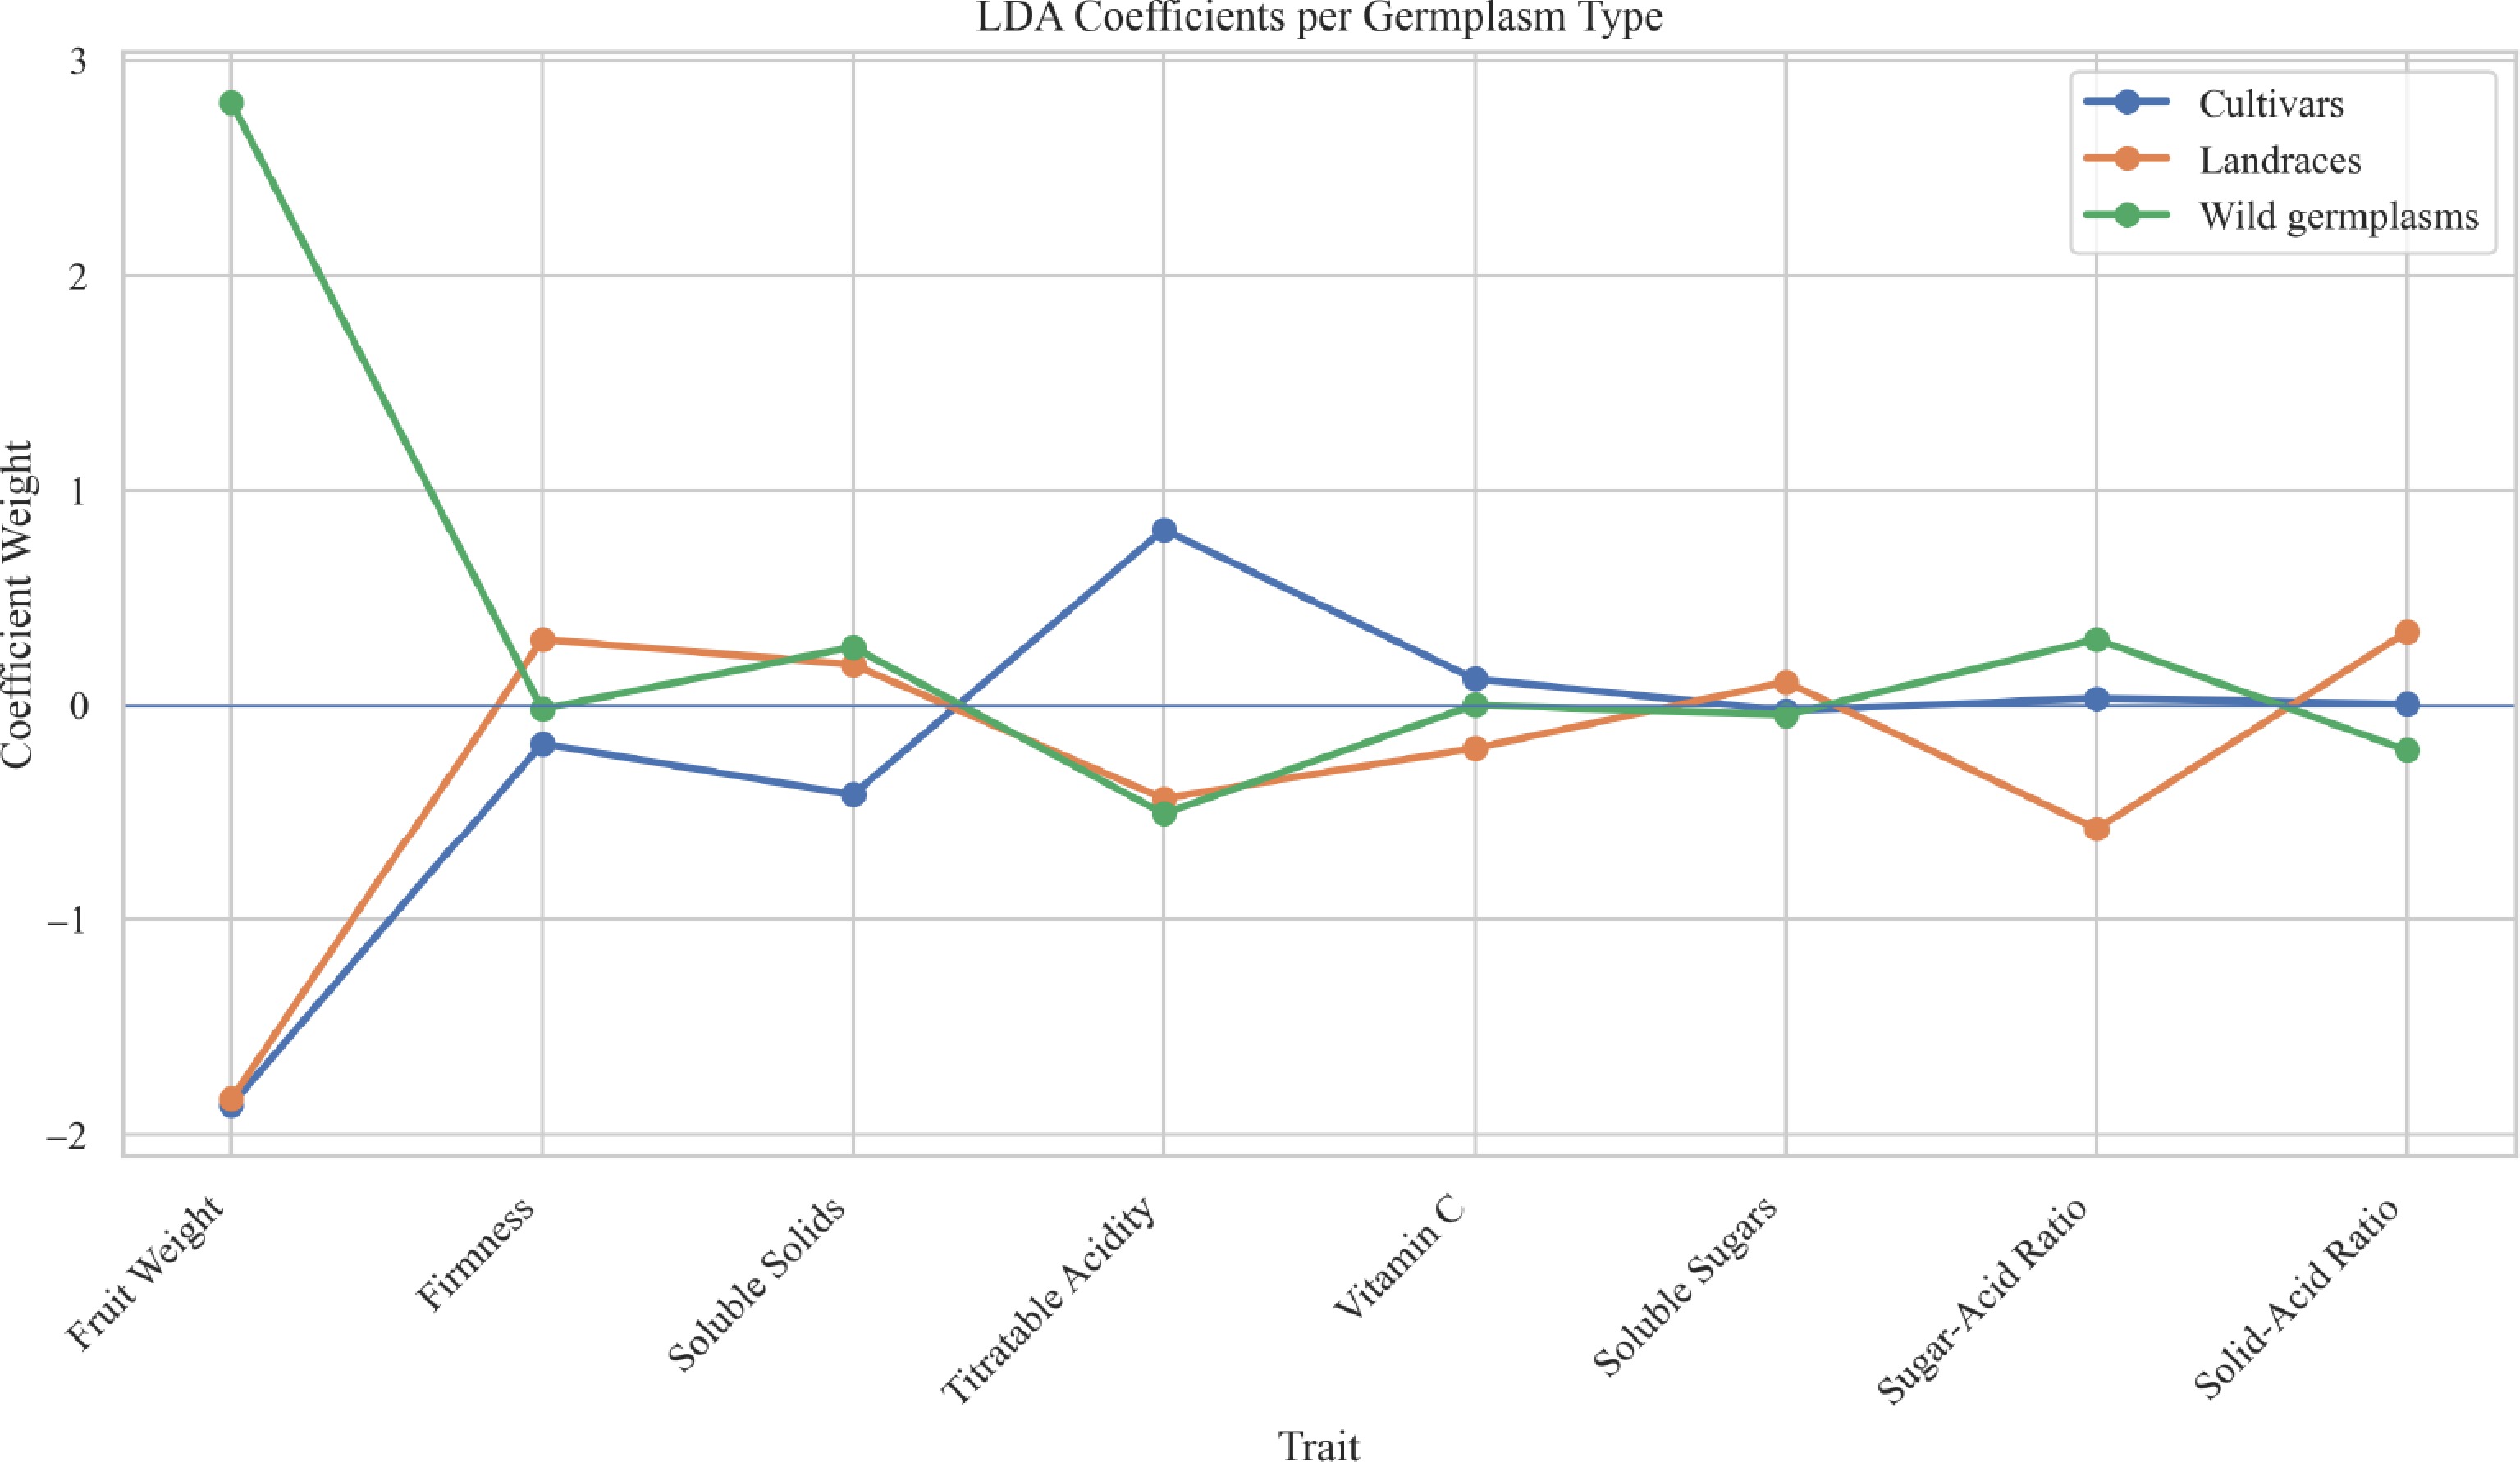
Figure 4.
LDA coefficients per germplasm type.
-
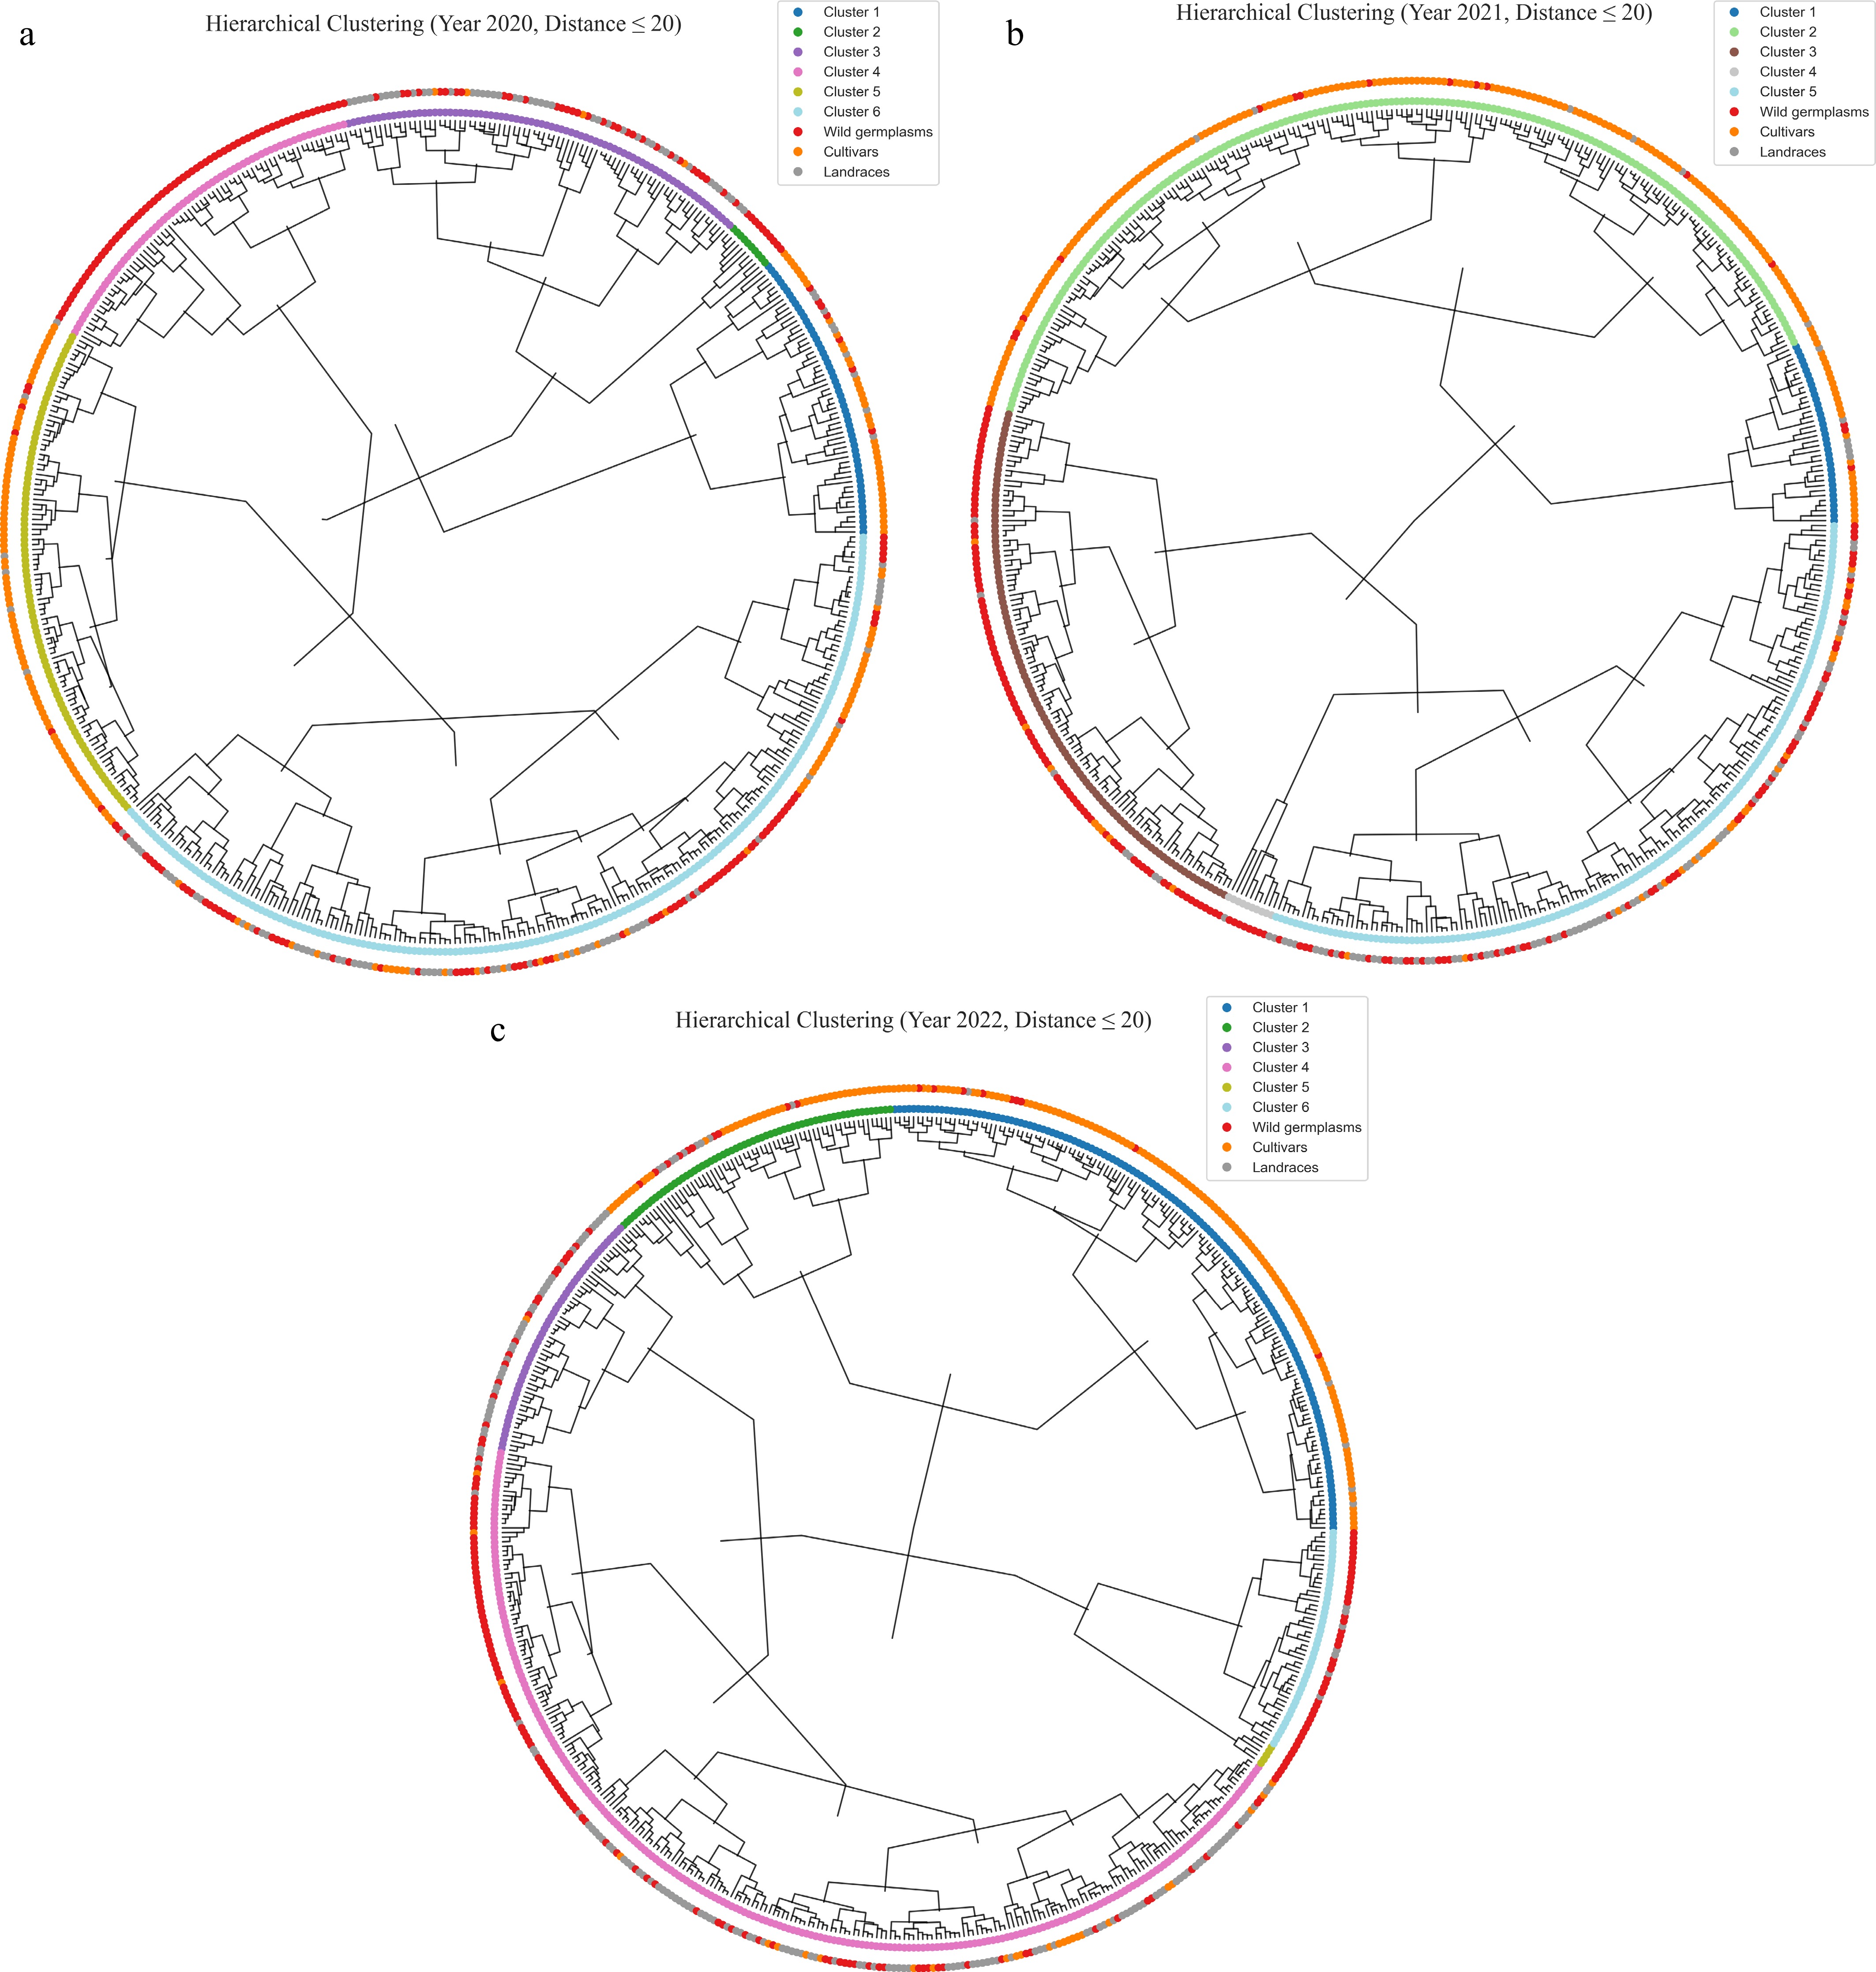
Figure 5.
Circular hierarchical clustering tree based on phenotypic traits. (a) 2020; (b) 2021; (c) 2022.
-
Year Trait Mean Std SE Min Max CV H′ ANOVA p-value 2020 Fruit weight (g) 82.63 82.05 3.62 0.71 354.00 0.99 1.68 0.001 2021 100.20 87.88 3.88 0.62 409.60 0.88 1.71 2022 80.84 82.79 3.50 0.42 392.29 1.02 1.61 2020 Firmness (kg/cm2) 7.52 2.65 0.12 1.88 15.78 0.35 1.99 0.950 2021 7.75 2.62 0.12 1.71 17.53 0.34 1.89 2022 5.79 2.48 0.11 1.06 16.00 0.43 1.77 2020 Soluble solids (%) 13.90 4.34 0.19 7.71 37.24 0.31 1.51 0.100 2021 13.75 3.88 0.17 8.44 37.30 0.28 1.40 2022 14.33 5.37 0.23 7.13 36.53 0.38 1.64 2020 Titratable acidity (%) 0.89 0.55 0.02 0.08 4.15 0.62 1.54 0.003 2021 0.81 0.53 0.02 0.11 5.47 0.66 1.19 2022 0.93 0.66 0.03 0.09 3.88 0.71 1.74 2020 Vitamin C (mg/100g) 8.21 5.55 0.25 0.20 55.08 0.68 1.28 0.261 2021 8.73 5.79 0.26 0.75 44.34 0.66 1.49 2022 8.76 6.95 0.29 1.54 71.47 0.79 0.93 2020 Soluble sugar (%) 8.44 2.85 0.13 1.04 26.73 0.34 1.49 0.010 2021 9.63 2.38 0.11 2.23 17.07 0.25 1.84 2022 4.75 1.93 0.08 0.74 11.50 0.41 1.97 2020 Sugar-acid ratio 15.08 13.86 0.61 0.83 106.89 0.92 1.27 0.010 2021 18.51 15.00 0.66 0.84 88.12 0.81 1.65 2022 8.15 7.67 0.32 0.43 64.72 0.94 1.15 2020 Solid-acid ratio 23.19 19.52 0.86 3.98 163.11 0.84 1.15 0.074 2021 25.03 18.78 0.83 3.42 122.22 0.75 1.54 2022 22.57 16.44 0.70 4.05 139.68 0.73 1.27 Std: Standard deviation; SE: Standard error; Min: Minimum; Max: Maximum; CV: Coefficient of variation; H′: Shannon-Wiener diversity index. Table 1.
Variations in fruit traits among germplasm resources in 2020, 2021, and 2022.
-
Trait Eigenvector of the principal component PC1 PC2 PC3 PC4 PC5 PC6 PC7 PC8 Fruit weight (g) 0.394 −0.208 −0.046 −0.070 0.714 −0.534 0.003 0.002 Firmness (kg/cm2) −0.079 0.498 −0.583 0.291 −0.212 −0.524 0.039 0.005 Soluble solids (%) −0.201 0.476 0.498 −0.419 −0.006 −0.332 −0.403 −0.191 Titratable acidity (%) −0.488 0.138 0.219 −0.075 0.228 −0.114 0.776 0.147 Vitamin C (mg/100g) −0.252 0.008 0.368 0.826 0.233 −0.019 −0.252 −0.014 Soluble sugar (%) 0.158 0.613 −0.154 −0.030 0.468 0.520 −0.083 0.280 Sugar-acid ratio 0.491 0.270 0.215 0.183 −0.084 0.102 0.383 −0.665 Solid-acid ratio 0.480 0.119 0.396 0.110 −0.337 −0.188 0.128 0.649 Eigenvalue 3.059 1.693 0.965 0.917 0.614 0.465 0.249 0.042 Contributive percentage (%) 38.216 21.143 12.053 11.459 7.673 5.814 3.114 0.527 Total cumulative (%) 38.216 59.359 71.412 82.871 90.544 96.358 99.473 100.000 Table 2.
Principal component analysis of eight apple fruit phenotypic traits.
-
Germplasm type Year Fruit weight Firmness Soluble solids Titratable acidity Vitamin C Soluble sugars Sugar-acid
ratioSolid-acid
ratioMean Wild germplasms 2020 97.67 37.12 40.88 50.46 68.81 44.86 90.45 78.99 63.66 2021 114.03 38.38 39.58 47.33 62.01 32.74 88.77 76.00 62.36 2022 131.92 42.22 47.22 55.00 88.17 39.28 109.53 79.55 74.11 Landraces 2020 91.80 35.76 25.78 44.75 61.19 30.46 77.49 70.51 54.72 2021 98.65 29.31 22.07 71.22 58.15 20.76 65.63 63.67 53.68 2022 87.31 41.53 26.52 50.60 55.86 36.19 73.96 57.96 53.74 Cultivars 2020 40.36 28.86 14.64 55.60 56.38 20.89 72.15 73.29 45.27 2021 38.69 28.62 12.18 51.39 44.08 14.78 63.36 62.62 39.46 2022 37.55 28.14 12.35 55.44 47.07 40.61 81.63 58.52 45.16 Table 3.
Coefficient of variation (%) of eight fruit traits of three apple germplasm types.
-
Germplasm type Year Fruit weight
(g)Firmness
(kg/cm2)Soluble solids
(%)Titratable acidity
(%)Vitamin C
(mg/100g)Soluble sugars
(%)Sugar-acid
ratioSolid-acid
ratioWild germplasms 2020 29.87± 29.17 7.46 ± 2.77 13.96 ± 5.71 1.21 ± 0.61 9.94 ± 6.84 7.57 ± 3.4 8.58 ± 7.76 14.84 ± 11.72 2021 35.64 ± 40.64 7.60 ± 2.92 13.79 ± 5.46 1.15 ± 0.54 12.0 ± 7.44 8.42 ± 2.76 9.79 ± 8.69 15.12 ± 11.49 2022 27.13 ± 35.79 5.79 ± 2.45 16.05 ± 7.58 1.39 ± 0.77 11.38 ± 10.04 4.76 ± 1.87 5.19 ± 5.69 14.89 ± 11.84 Landraces 2020 35.96 ± 33.01 8.47 ± 3.03 15.38 ± 3.97 0.85 ± 0.38 7.38 ± 4.52 8.75 ± 2.67 13.59 ± 10.53 22.90 ± 16.14 2021 34.71 ± 34.24 9.27 ± 2.72 15.86 ± 3.5 0.86 ± 0.61 7.75 ± 4.51 11.10 ± 2.30 17.29 ± 11.35 24.23 ± 15.43 2022 31.81 ± 27.77 7.12 ± 2.96 15.30 ± 4.06 0.93 ± 0.47 8.12 ± 4.53 5.57 ± 2.02 7.59 ± 5.62 19.80 ± 11.47 Cultivars 2020 169.91 ± 68.57 6.98 ± 2.01 12.87 ± 1.88 0.56 ± 0.31 6.85 ± 3.86 9.18 ± 1.92 23.09 ± 16.66 32.42 ± 23.77 2021 174.24 ± 67.42 7.31 ± 2.09 12.94 ± 1.58 0.53 ± 0.27 6.56 ± 2.89 10.04 ± 1.48 25.72 ± 16.29 33.01 ± 20.67 2022 171.53 ± 64.41 4.72 ± 1.33 11.89 ± 1.47 0.49 ± 0.27 6.78 ± 3.19 4.08 ± 1.66 11.42 ± 9.33 32.14 ± 18.81 Table 4.
Multiple comparison results for eight apple fruit traits in different years.
-
Trait Index sum_sq df F PR (> F) Fruit weight Year 5,259.154 2 1.089 0.337 Population 76,809,08.927 2 1,591.183 0.000 Year × population 2,054.331 4 0.213 0.931 Firmness Year 1,439.233 2 117.838 0.000 Population 886.503 2 72.583 0.000 Year × population 56.664 4 2.320 0.055 Soluble solids Year 37.591 2 0.710 0.492 Population 3,538.400 2 66.813 0.000 Year × population 266.875 4 2.520 0.040 Titratable acidity Year 1.274 2 2.127 0.120 Population 201.086 2 335.626 0.000 Year × population 1.944 4 1.622 0.166 Vitamin C Year 275.571 2 3.892 0.021 Population 5,781.692 2 81.648 0.000 Year × population 397.030 4 2.803 0.025 Soluble sugar Year 7,394.789 2 700.748 0.000 Population 524.423 2 49.696 0.000 Year × population 428.014 4 20.280 0.000 Sugar acid ratio Year 25,811.178 2 106.270 0.000 Population 50,140.245 2 206.437 0.000 Year × population 6,321.958 4 13.014 0.000 Solid acid ratio Year 454.807 2 0.844 0.430 Population 99,950.577 2 185.583 0.000 Year × population 924.909 4 0.859 0.488 Index: Source of variation year, population, and their interaction (year × population); sum_sq: Sum of squares, indicating the contribution of each factor to total variation; df: Degrees of freedom; F: F-statistic used for significance testing; PR (> F): p-value, with values less than 0.05 considered statistically significant. Table 5.
Two-way ANOVA results for eight fruit traits across different germplasm types and three years.
Figures
(5)
Tables
(5)