-
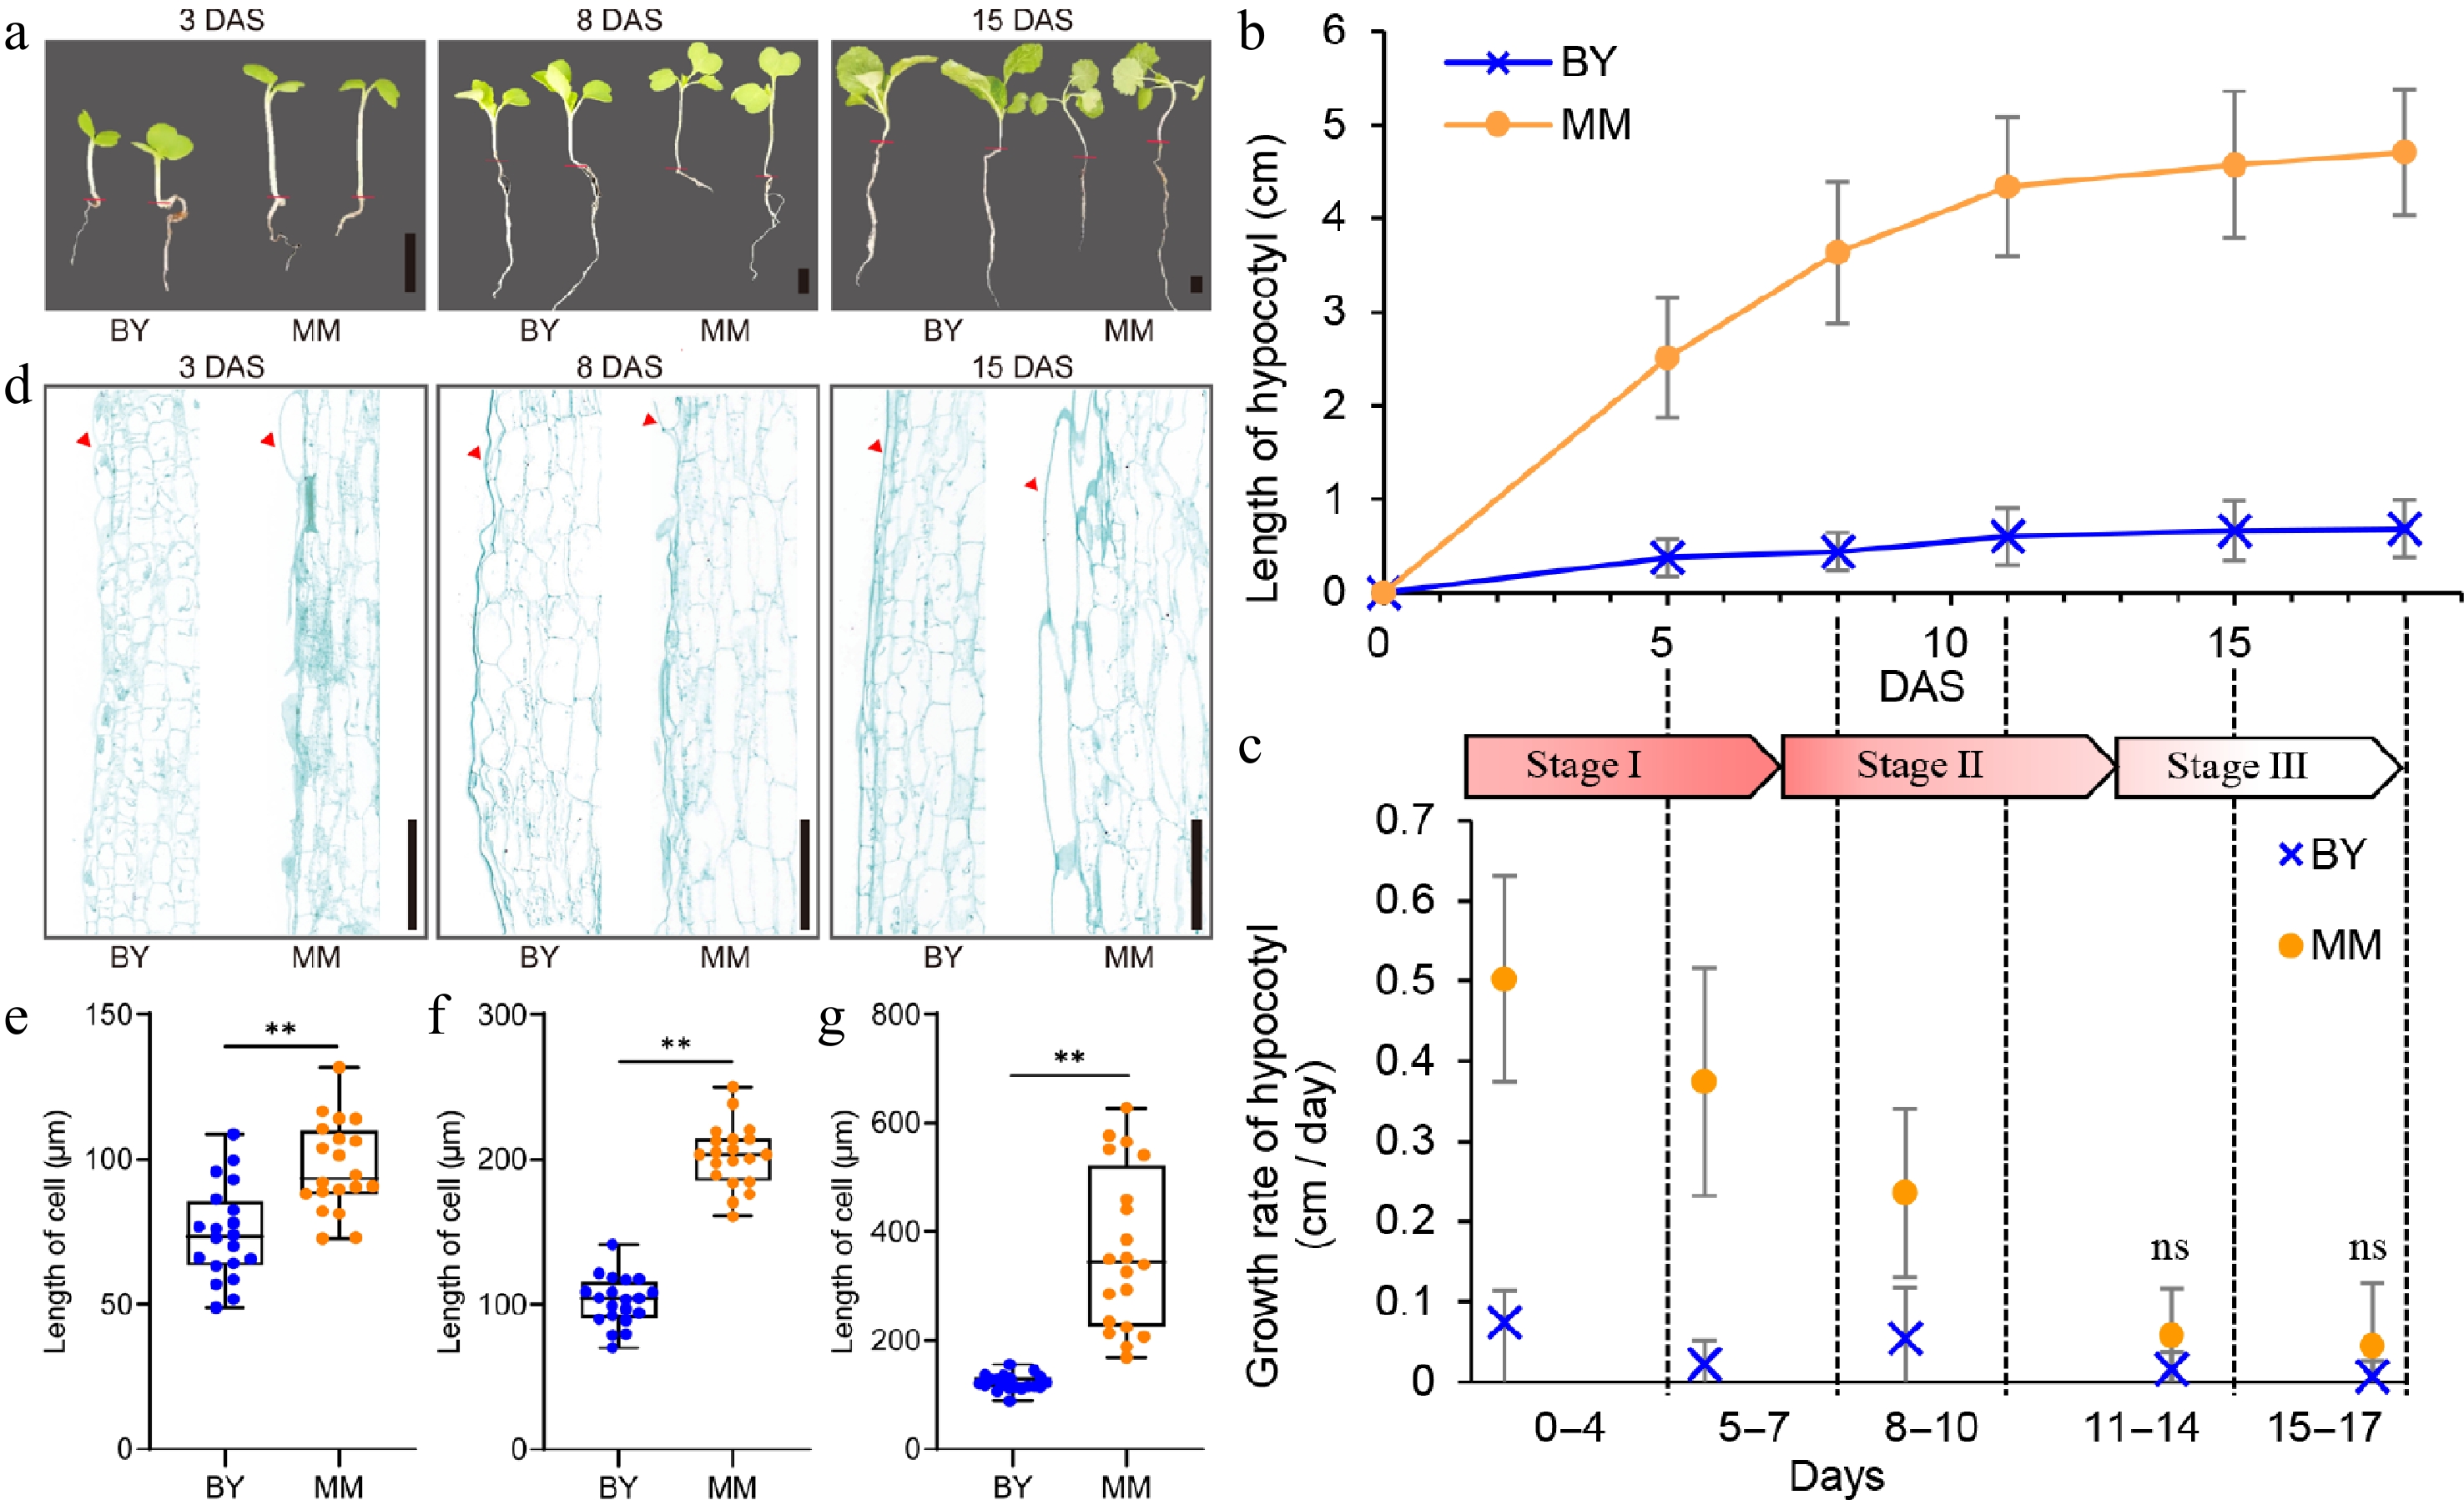
Figure 1.
Phenotypic differences between turnip (MM) and Chinese cabbage (BY). (a) Images of MM and BY seedlings at 3, 8, and 15 DAS. Scale bars = 1 cm. The red lines indicate the boundary between root and hypocotyl. (b) Dynamic comparison of hypocotyl length between MM and BY. Seeds were germinated overnight at 25 °C and then planted in the greenhouse under LD (16 h light/8 h dark) conditions. The error bars indicate the SDs; at least 15 plants of each inbred line were used. (c) Stage-specific growth rate of the hypocotyl. Stages I, II, and III represent the fast elongation stage (0–7 d), elongation stage (8–13 d), and ending stage (14–18 d), respectively. The arrow indicates the deadline on the timeline of each stage. (d) Longitudinal sections of hypocotyl cells from MM and BY. A partial image of cells from the middle section of the hypocotyl is shown. The red arrows indicate the epidermis. Scale bars = 500 µm. (e)–(g) Length of hypocotyl cells at (c) 3, (d) 8, and (e) 15 DAS. Significance level: ** p < 0.01.
-
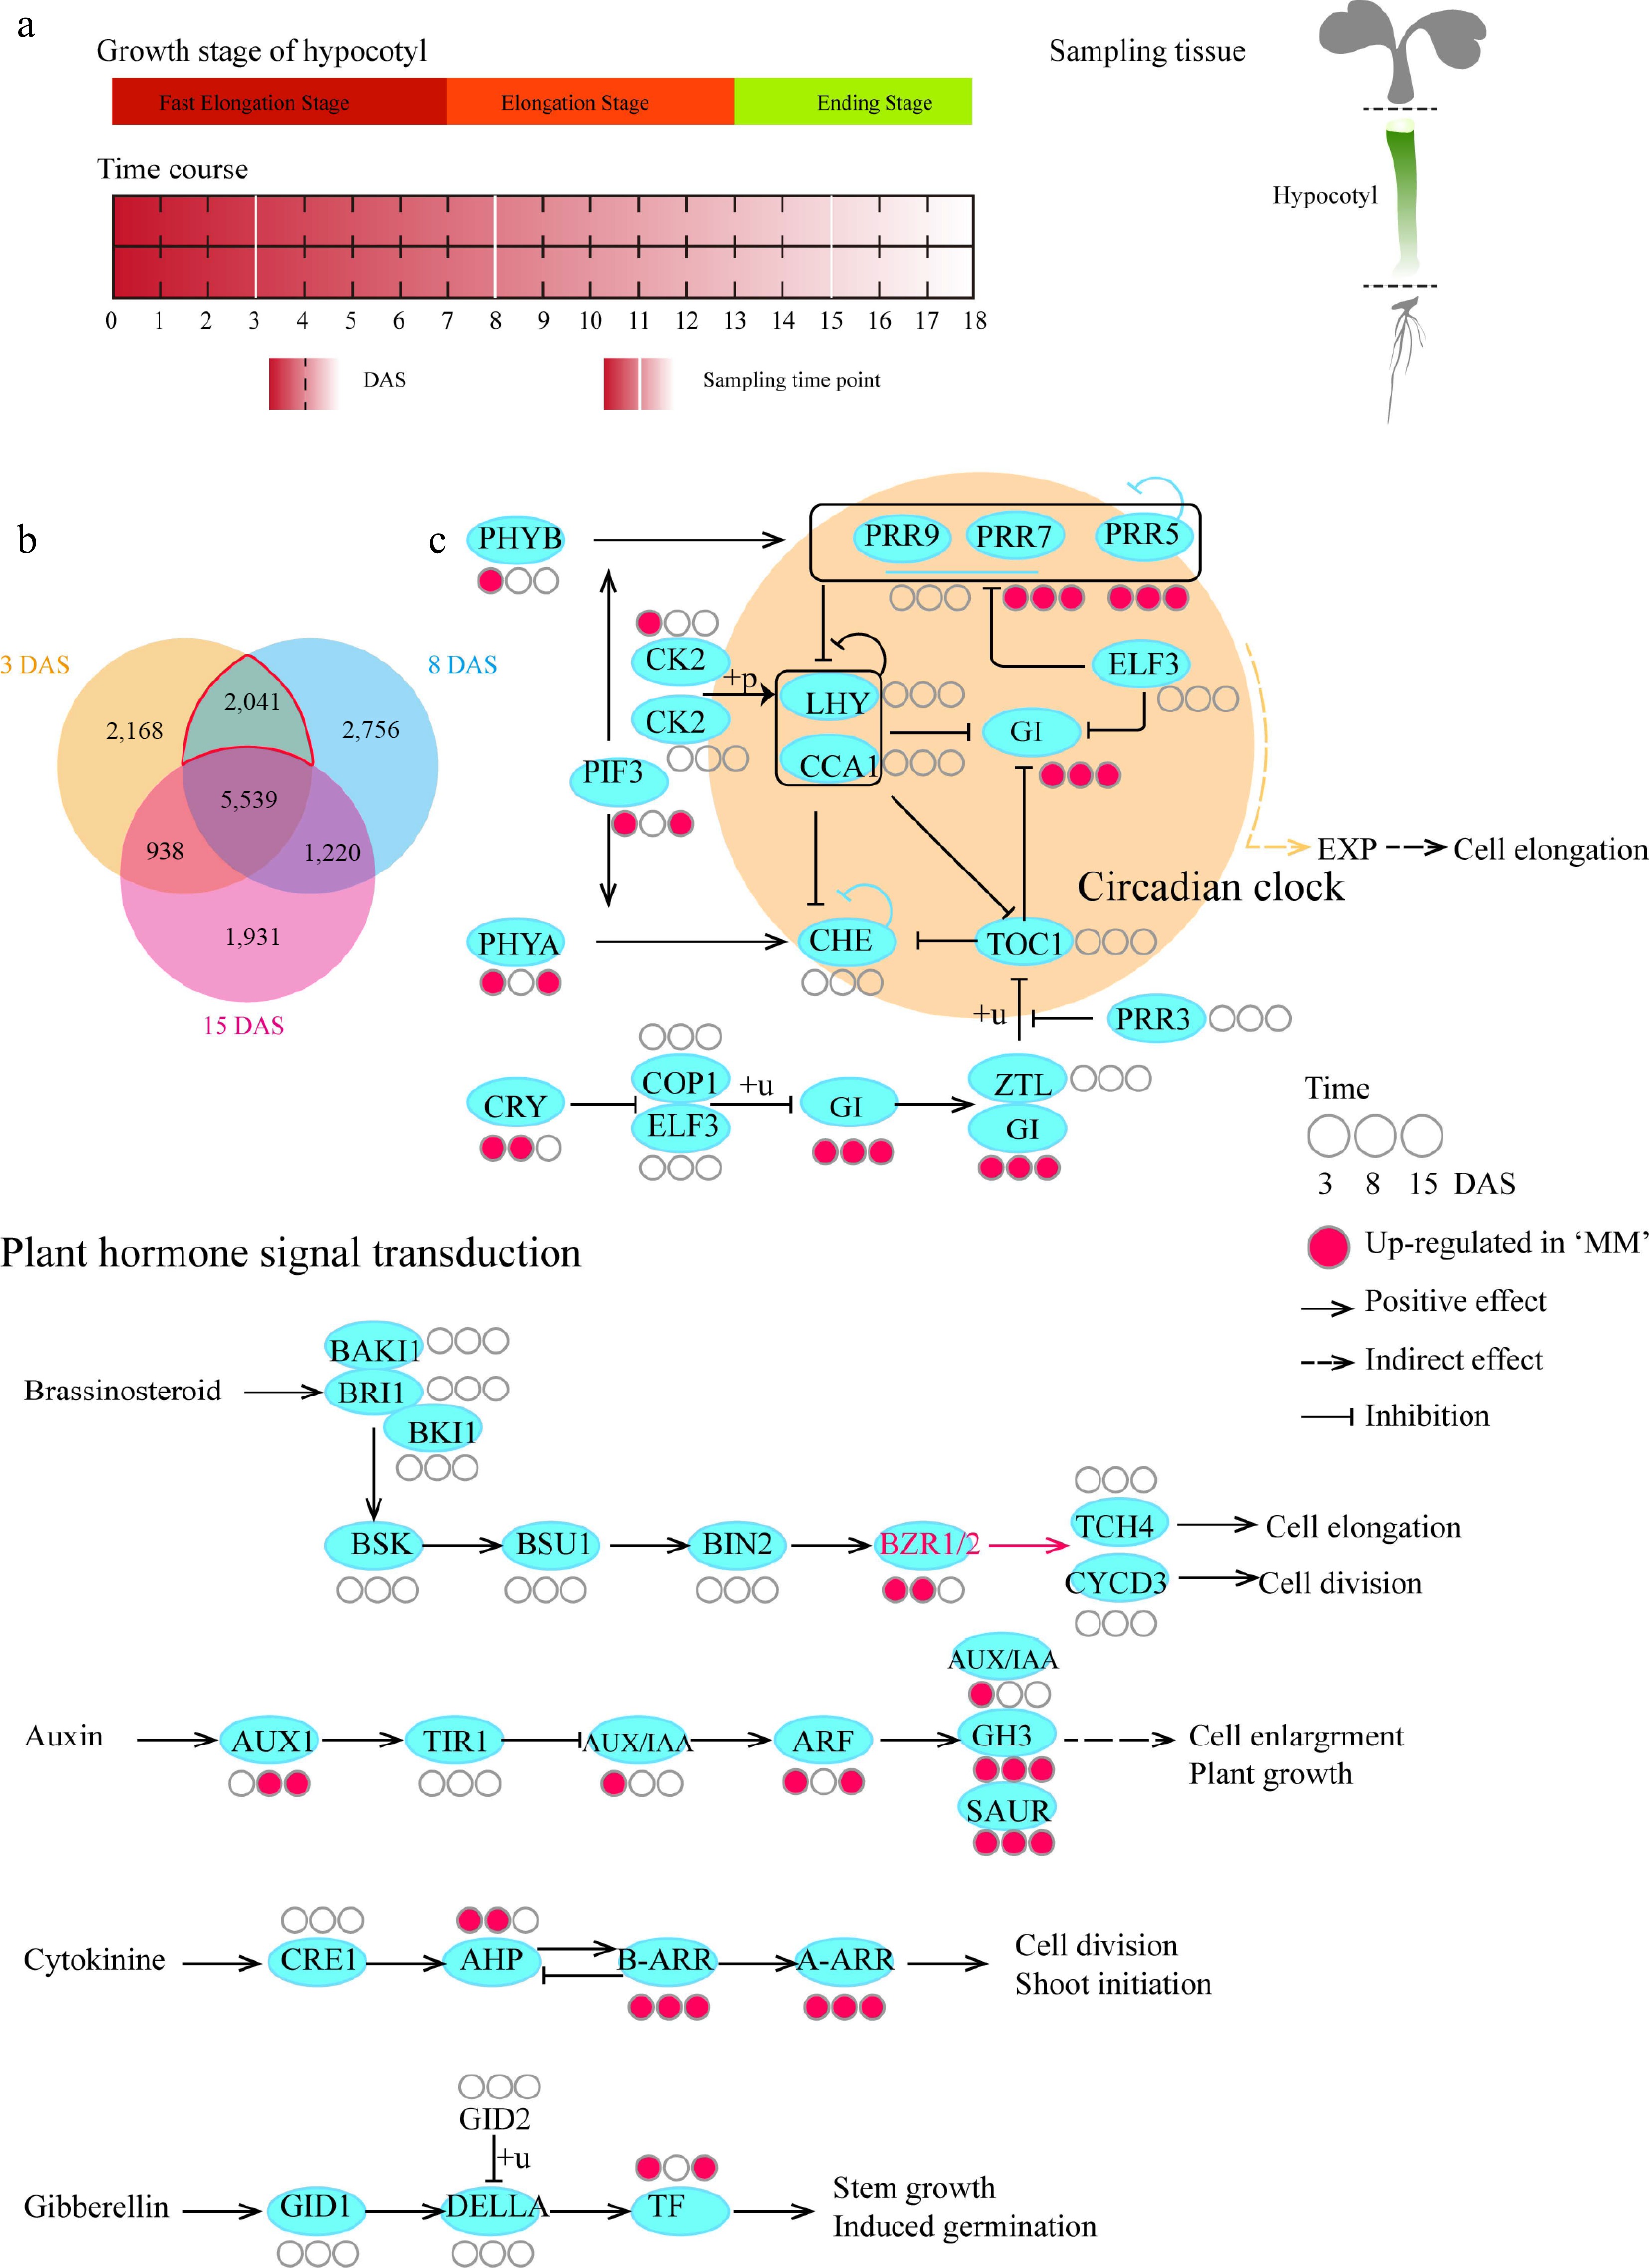
Figure 2.
Comparative temporal transcriptome analysis of hypocotyls between MM and BY. (a) Design of the transcriptome analysis. Seeds (MM and BY) were germinated overnight at 25 °C and planted in the greenhouse under LD conditions. Sampling was conducted for each line at 3, 8, and 15 DAS, covering the abovementioned three stages of hypocotyl growth. Tissue was sampled from the whole hypocotyl. For each line, three biological replicates at each time point were used. Each replicate contained material from at least 15 plants. (b) Venn diagram of DEGs. DEGs between MM and BY at 3, 8, and 15 DAS are shown in specific colors. The red line encircles the DEGs during the hypocotyl elongation stages. The upregulated and downregulated genes are not displayed separately. (c) KEGG enrichment analysis of the upregulated genes in the circadian rhythm and BR signaling pathways in turnip. The original maps showing the results of KEGG enrichment analysis are shown in Supplementary Table S1.
-
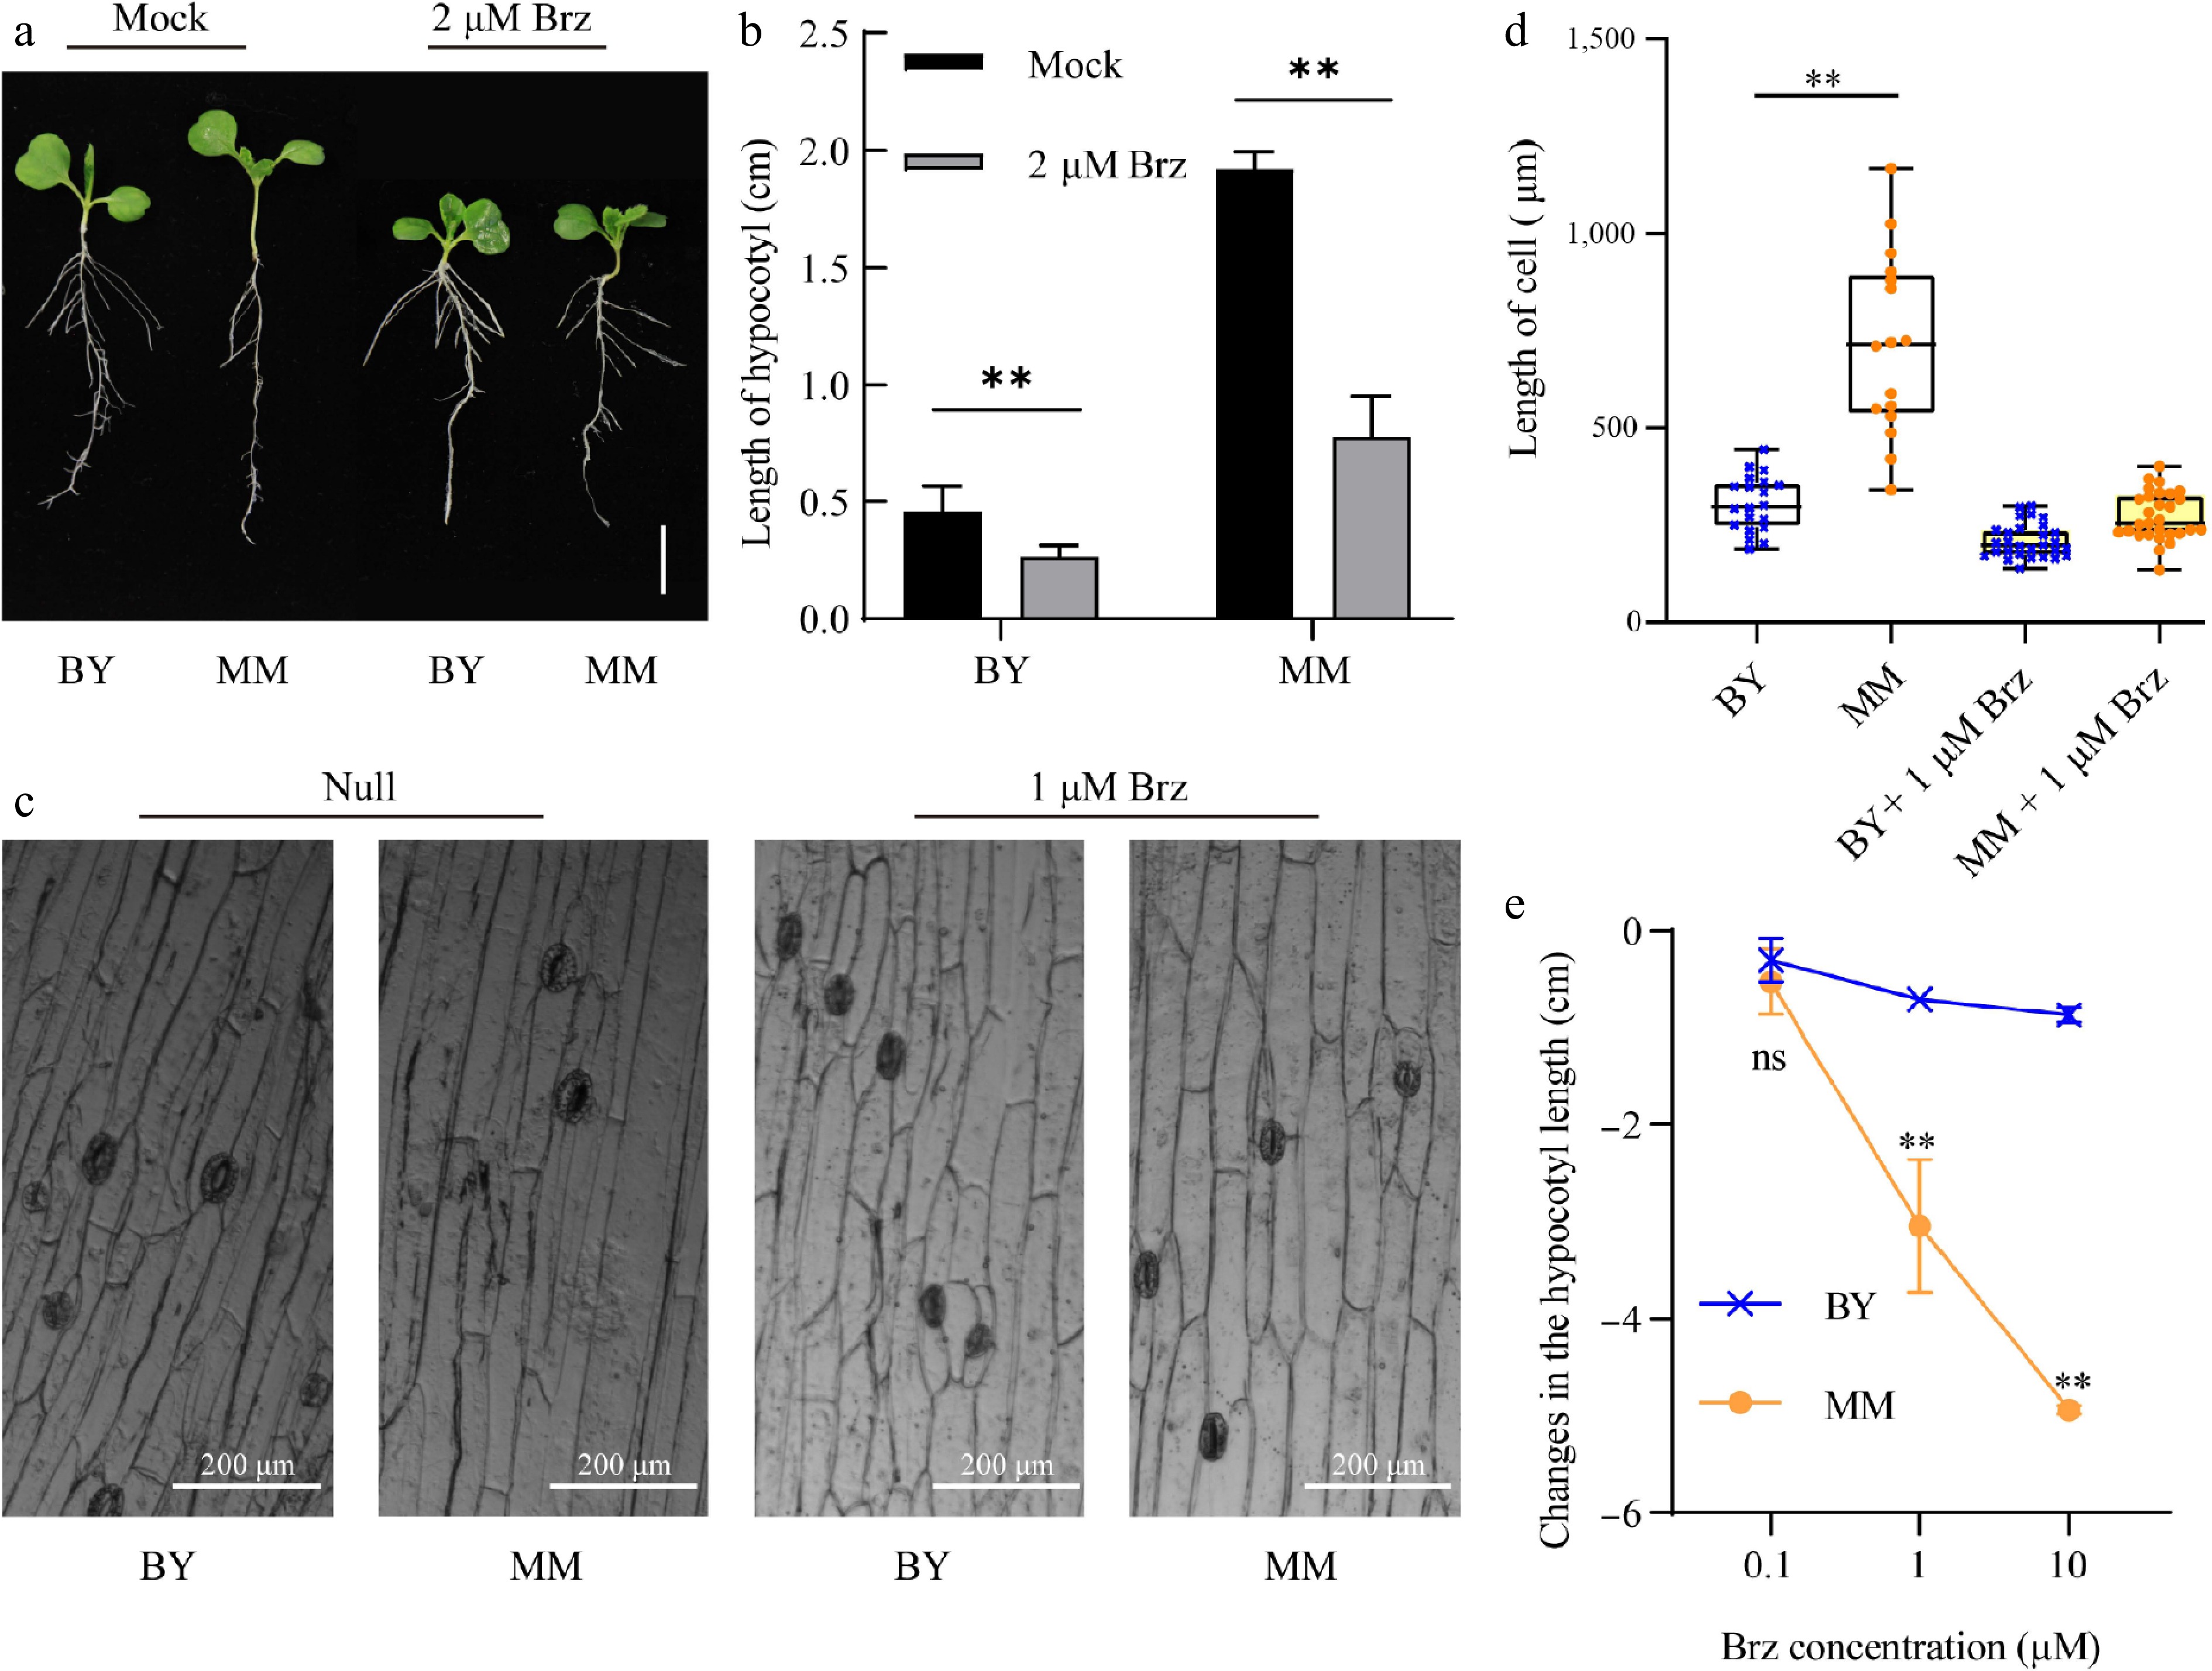
Figure 3.
Brz represses hypocotyl growth and hypocotyl cell elongation in MM and BY. (a) Morphological changes in MM and BY in response to Brz. Seeds were germinated on ½ MS culture medium supplemented with 2 µM Brz or control (mock) for 10 d under LD conditions. Bar = 1.9 cm. (b) Changes in the hypocotyl length of MM and BY in response to Brz. Seeds were germinated on ½ MS culture medium supplemented with 2 µM Brz or control medium (mock) for 10 d under LD conditions. The error bars indicate the SDs; n = 6. Significance level: ** p < 0.01. (c) Visualization of epidermal cells in the hypocotyls of MM and BY treated with Brz. (d) Changes in the epidermal cell length in the hypocotyls of MM and BY in response to Brz. Significance level: ** p < 0.01. (e) Changes in the hypocotyl lengths of MM and BY under treatment with gradient concentrations (0.1, 1, and 10 µM). The error bars indicate the SDs; n = 6.
-
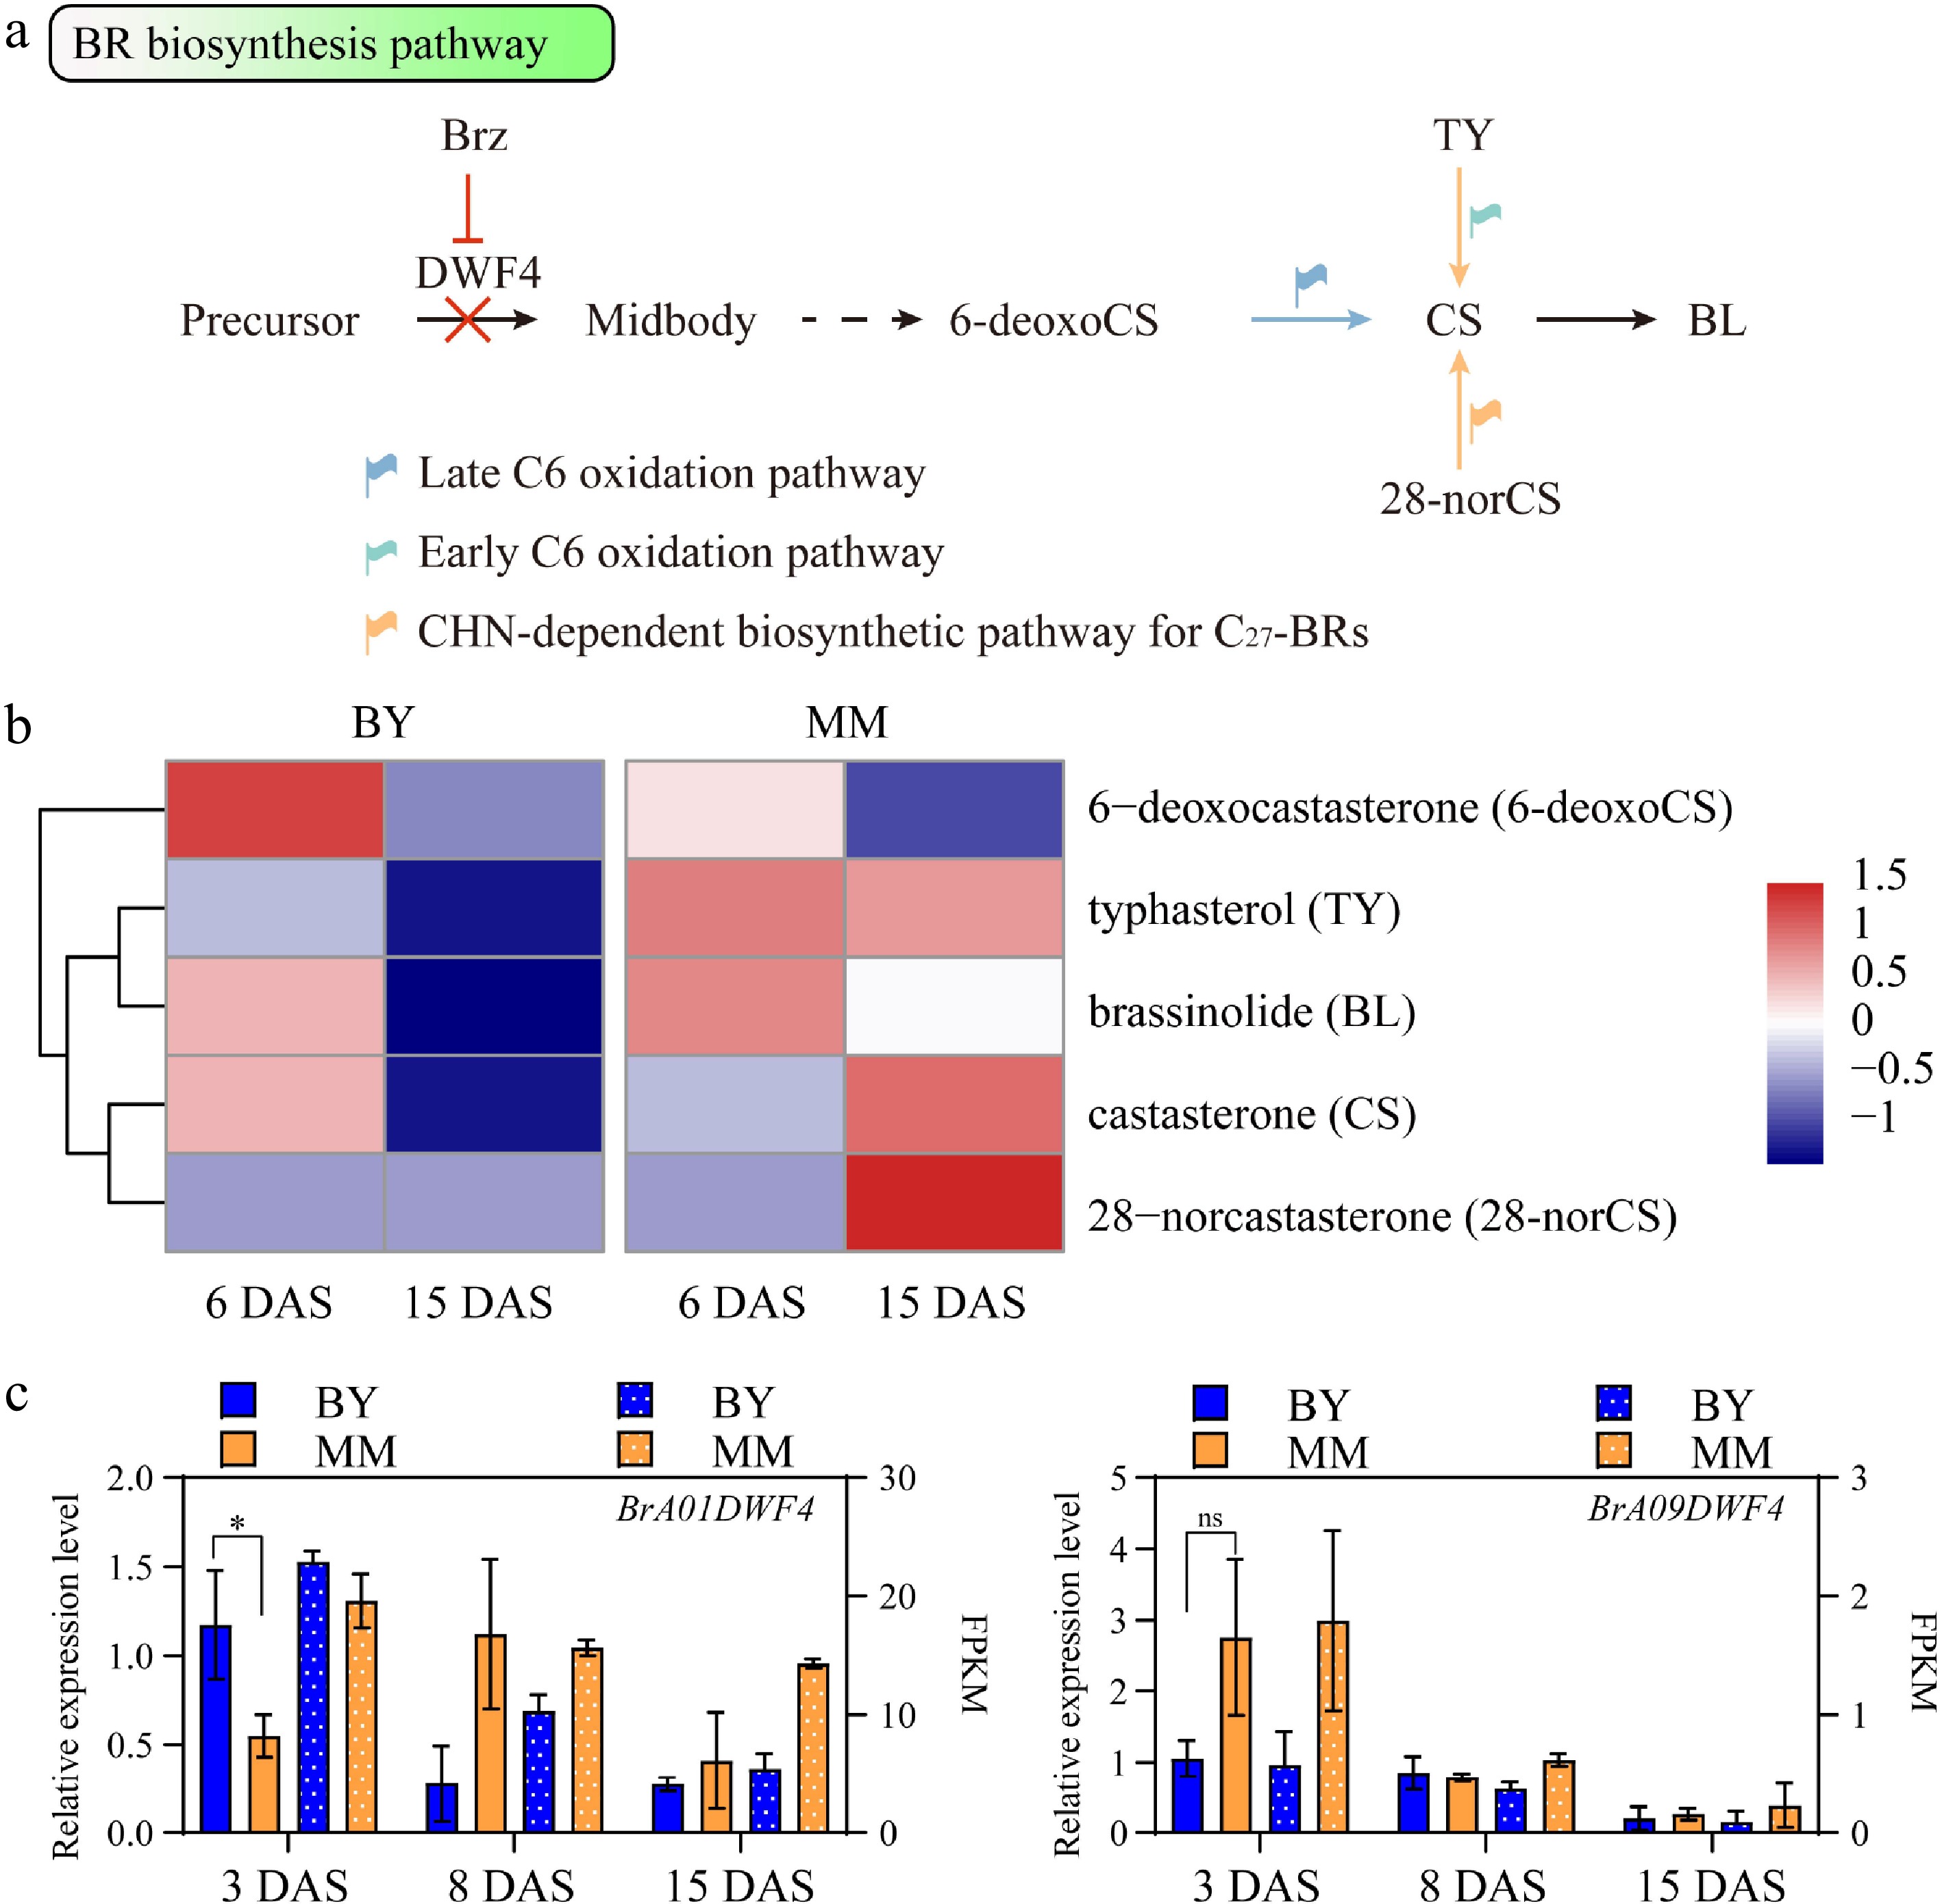
Figure 4.
Comparison of the BR biosynthesis pathway between MM and BY. (a) BR biosynthesis pathway in plants. The likely preferential pathways in MM and BY are indicated by orange and blue arrows, respectively. The dashed arrow indicates more than one step. (b) Heatmap of the BR concentrations in the hypocotyls of MM and BY at 6 and 15 DAS. (c) Expression levels of BrA01DWF4 and BrA09DWF4 determined via qRT‒PCR and RNA-seq in the hypocotyl of B. rapa at 3, 8, and 15 DAS. Significance level: * p < 0.05 by an unpaired t test; ns p value > 0.05 by an unpaired t test.
-
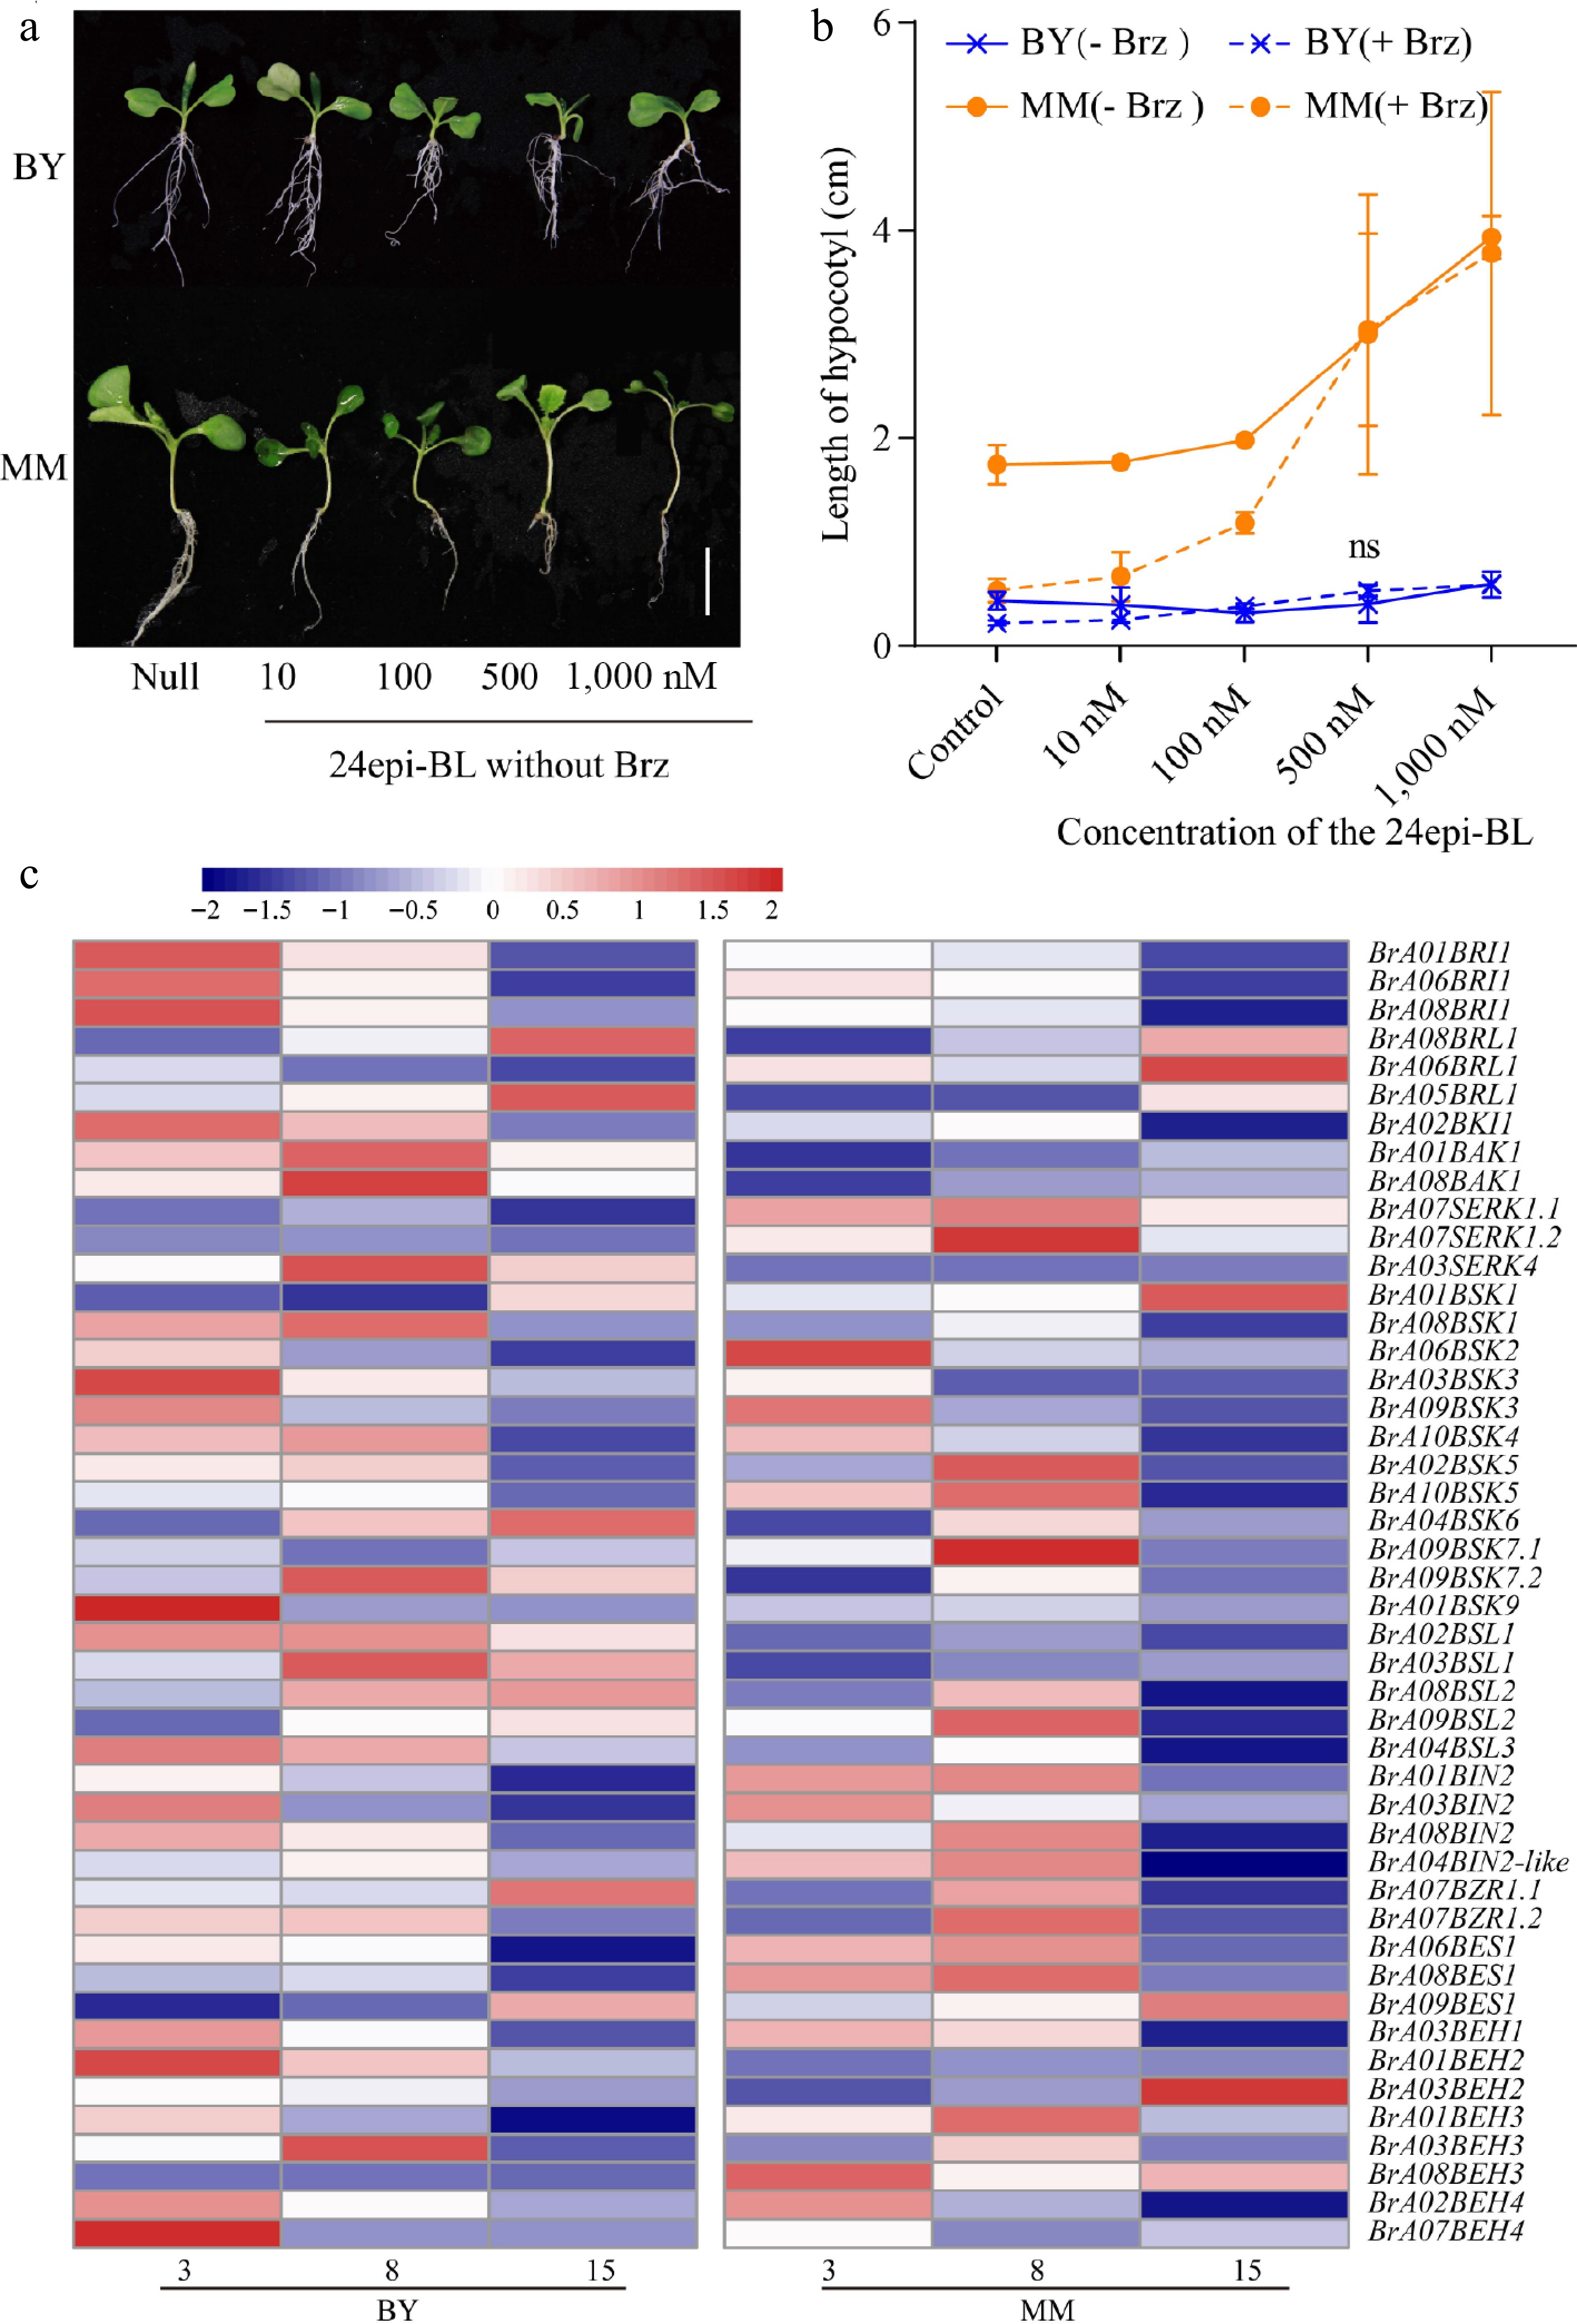
Figure 5.
The response of MM to BR signaling is stronger than that of BY. (a) Morphological changes in MM and BY in response to 24epi-BL. Seeds were germinated on ½ MS culture medium supplemented with gradient concentrations of 24epi-BL (10, 100, 500, and 1,000 nM) and untreated medium (blank application) under LD conditions for 10 d. Bar = 1.9 cm. (b) Measurement of hypocotyl elongation in MM and BY seedlings under treatment with BL with or without Brz. Seeds were germinated on ½ MS culture medium (containing 0 or 1 µM Brz) supplemented with gradient concentrations of 24Epi-BL (10, 100, 500, and 1,000 nM) under LD conditions, and the hypocotyl length was measured at 10 DAS. At least five seedlings were used per replicate. The error bars indicate the SDs; n = 3. (c) Heatmap of the transcript levels of BR signaling pathway genes in the hypocotyls of MM and BY at 3, 8, and 15 DAS.
-
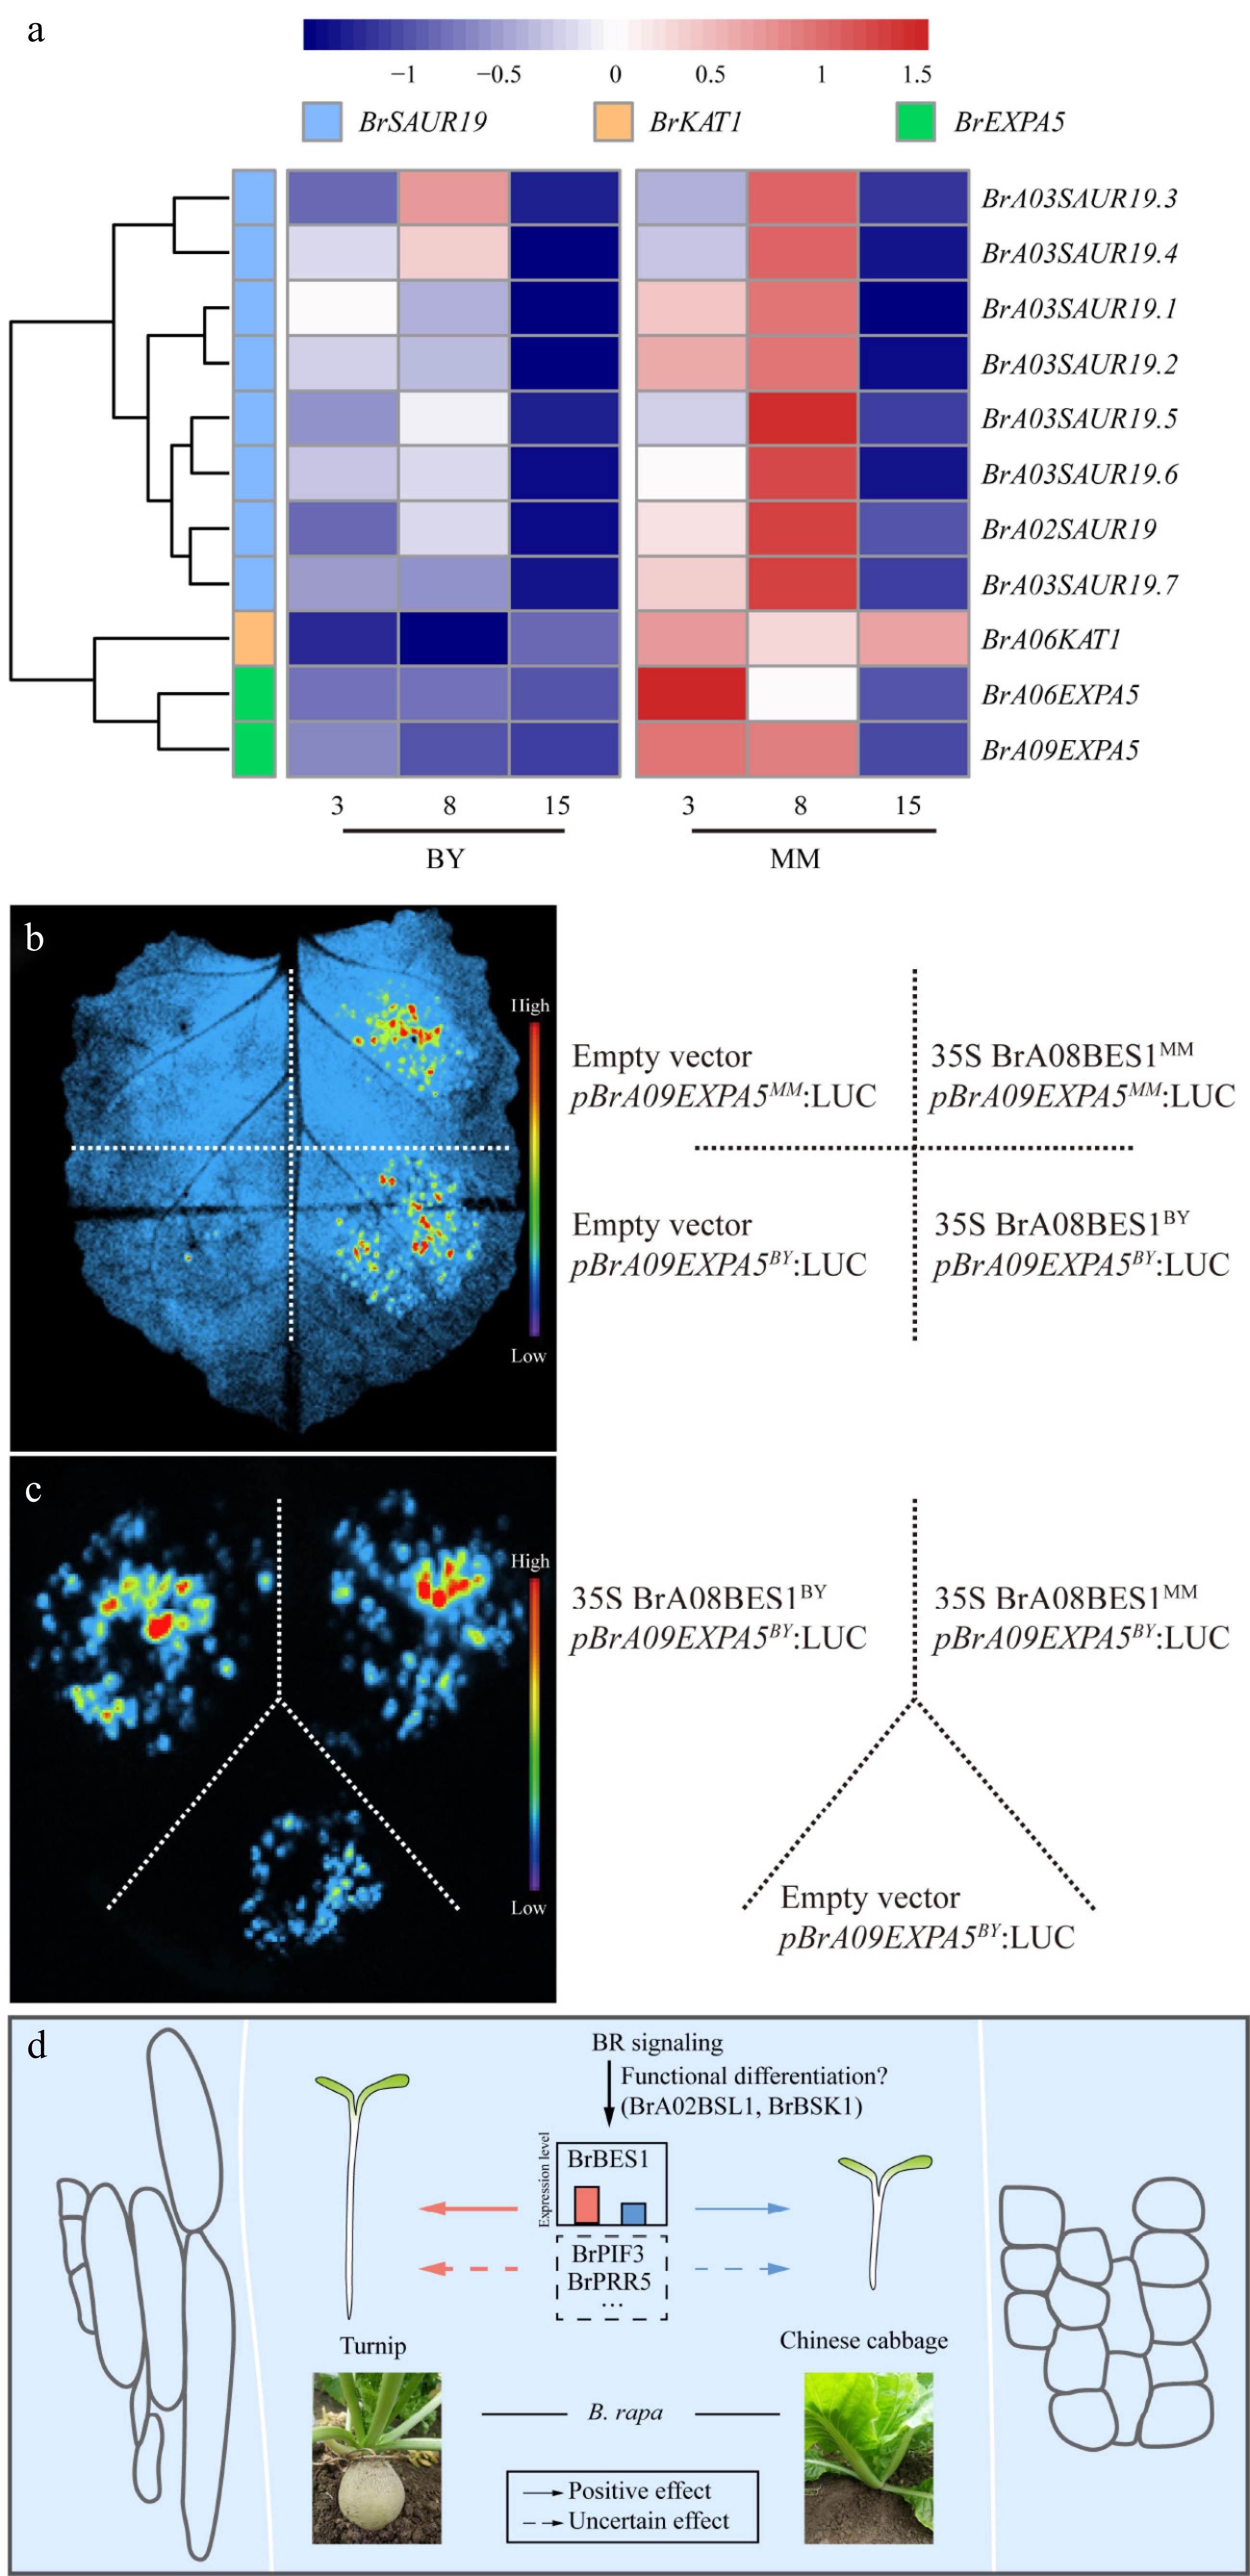
Figure 6.
BR signaling transcription factors activate the transcription of cell expansion genes, which are specifically expressed during hypocotyl elongation in MM and BY. (a) Heatmap of the transcript levels of the cell expansion genes in the hypocotyls of MM and BY at 3, 8, and 15 DAS. (b) BrA08BES1 activates the transcription of the gene BrA09EXPA5 in N. benthamiana epidermal cells, as shown by an effector–reporter-based transactivation assay. The empty vector and pBrA09EXPA5 were injected as negative controls. (c) BrA08BES1BY and BrA08BES1MM activate the transcription of the gene BrA09EXPA5BY. The empty vector and pBrA09EXPA5BY were injected as negative controls. (d) BR signaling pathway differences contribute to the variation in hypocotyl elongation between turnip and Chinese cabbage.
Figures
(6)
Tables
(0)