-
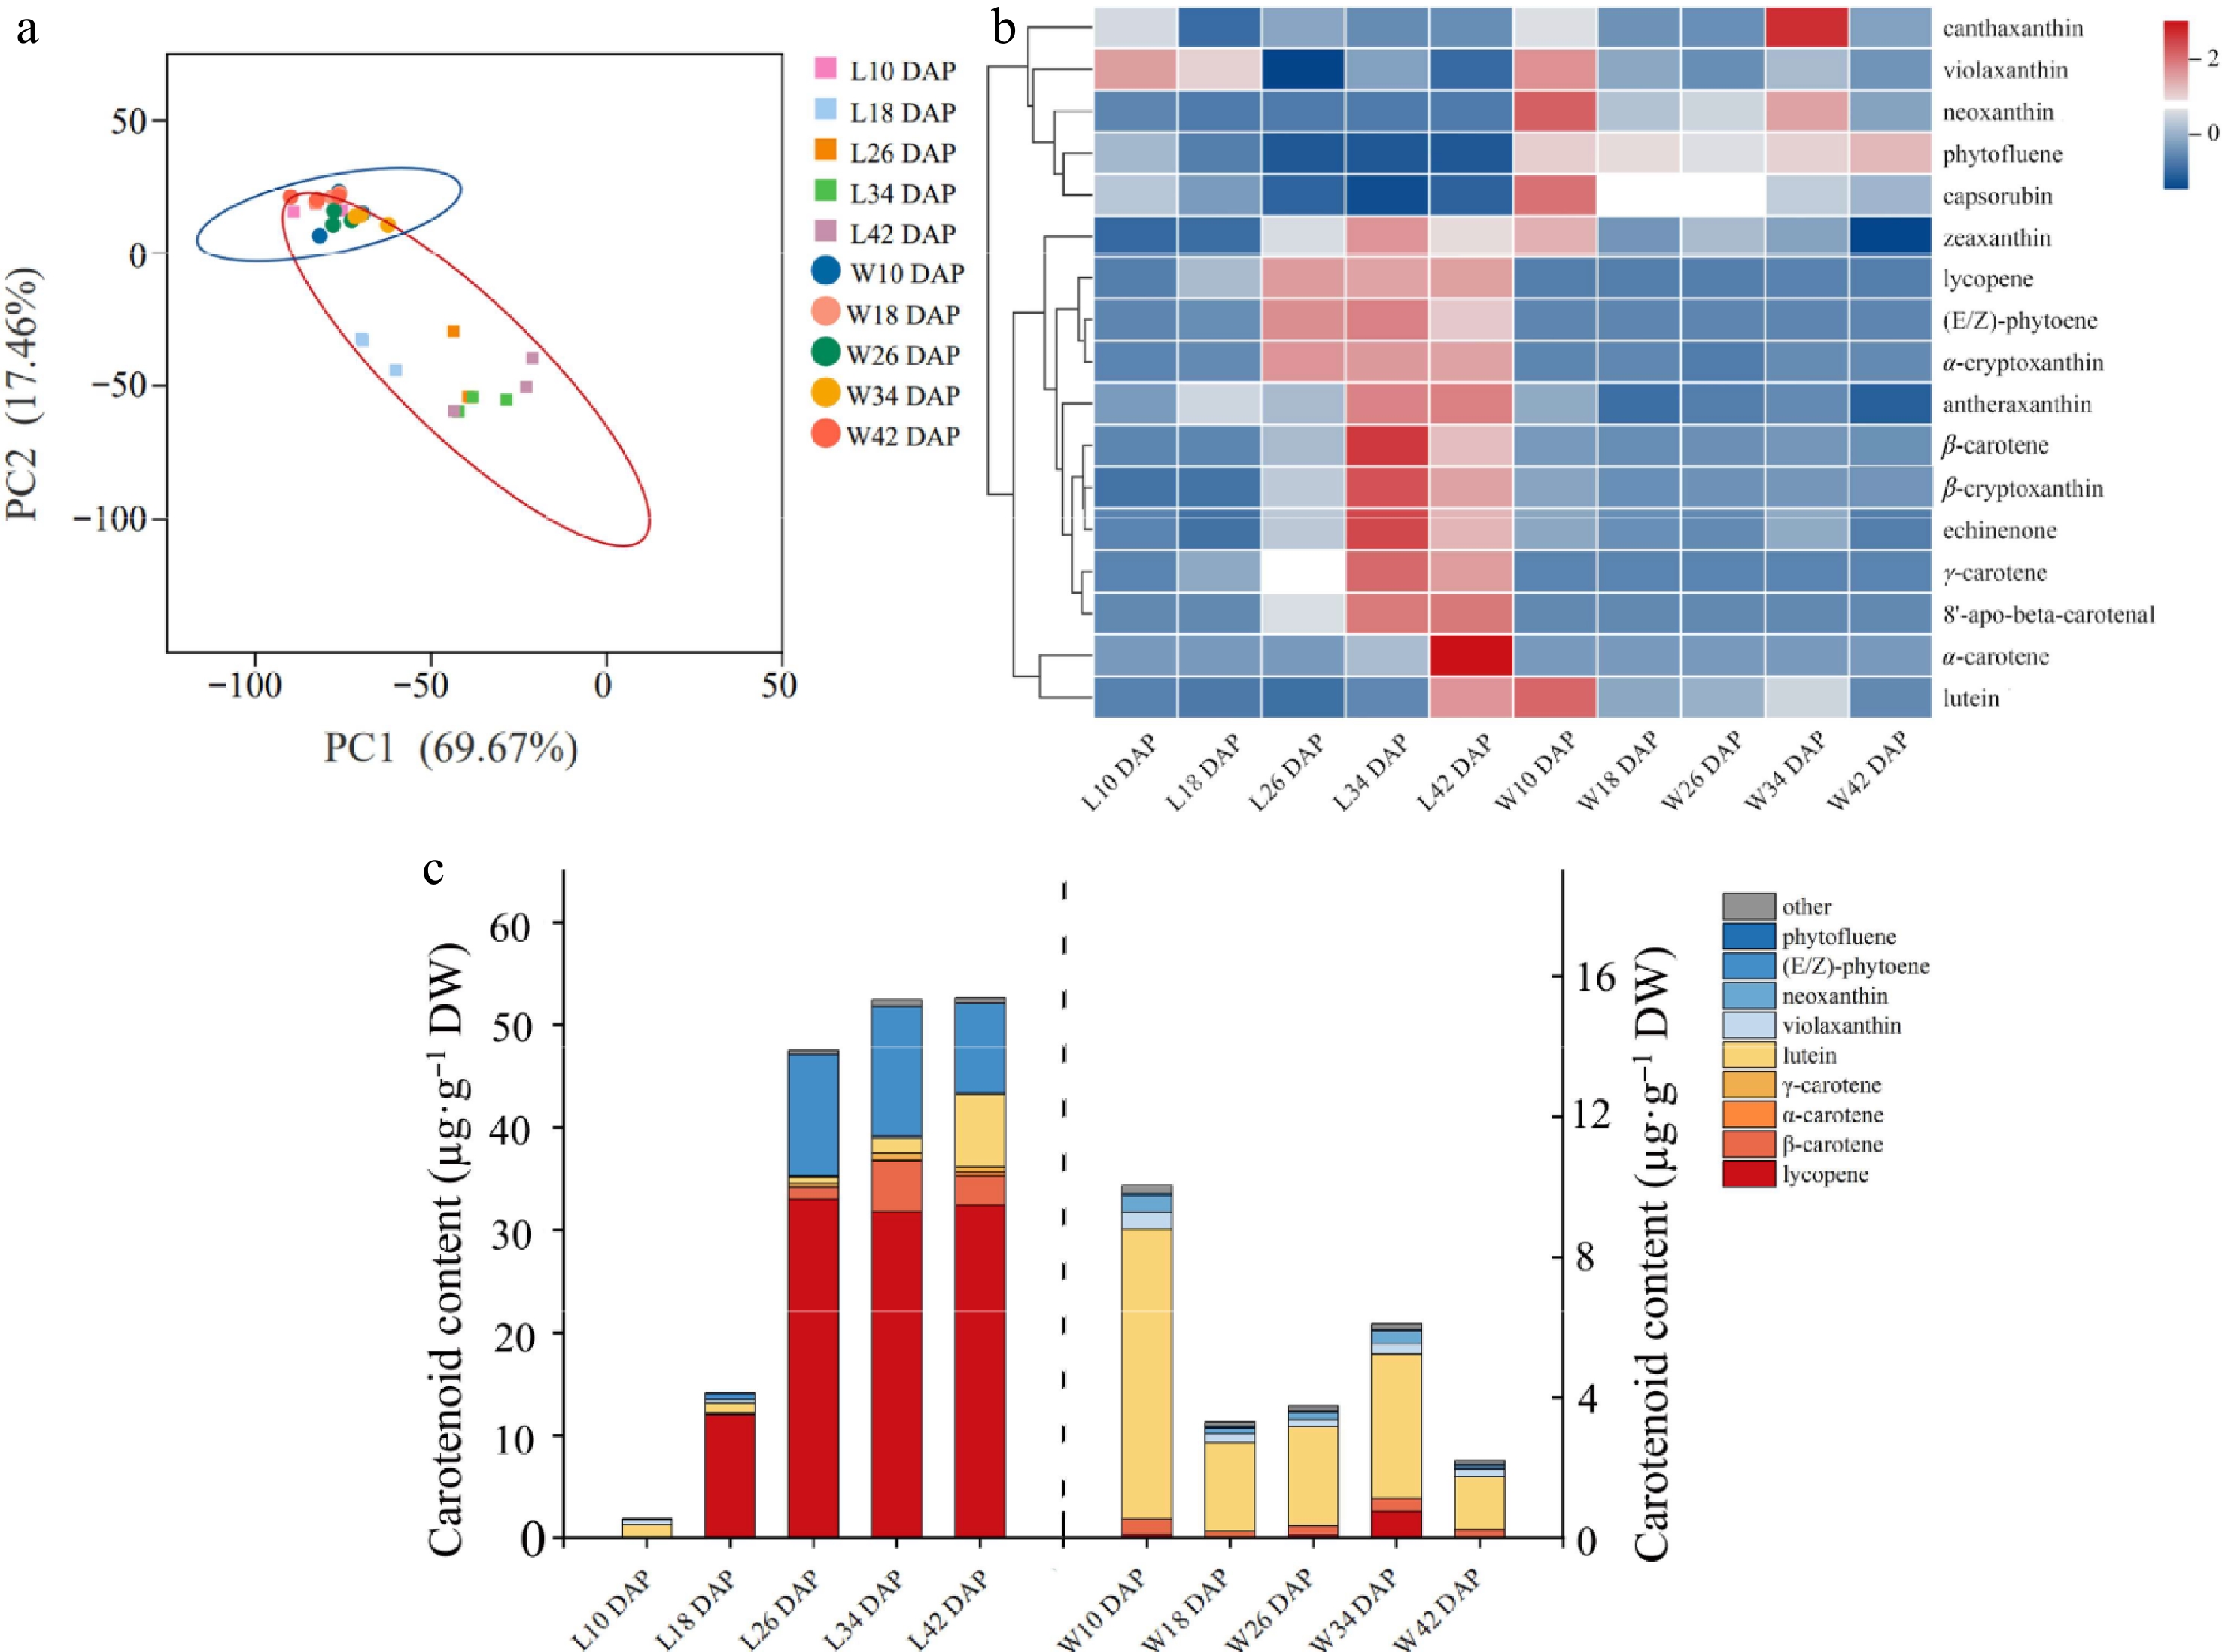
Figure 1.
Carotenoid accumulation and developmental patterns of chromoplast in red- and white-fleshed watermelons. (a) Main component analysis of carotene. The cube with five colors indicates the flesh of LSW-177 at 10, 18, 26, 34, and 42 d after pollination, covered by a red oval. The five colored circles indicate the flesh of W1-60 at 10, 18, 26, 34, and 42 d after pollination, covered by a blue oval. The data was processed log2 (N). (b) Cluster analysis of carotene: the data have been standardized by Z-score processing. (c) Carotenoid composition analysis: the content of carotenoid in fruit of L10, L18, L26, L34, and L42 DAP is shown on the left Y axis, and the content of carotenoid in fruit of W10, W18, W26, W34, and W42 DAP is shown on the right Y axis.
-
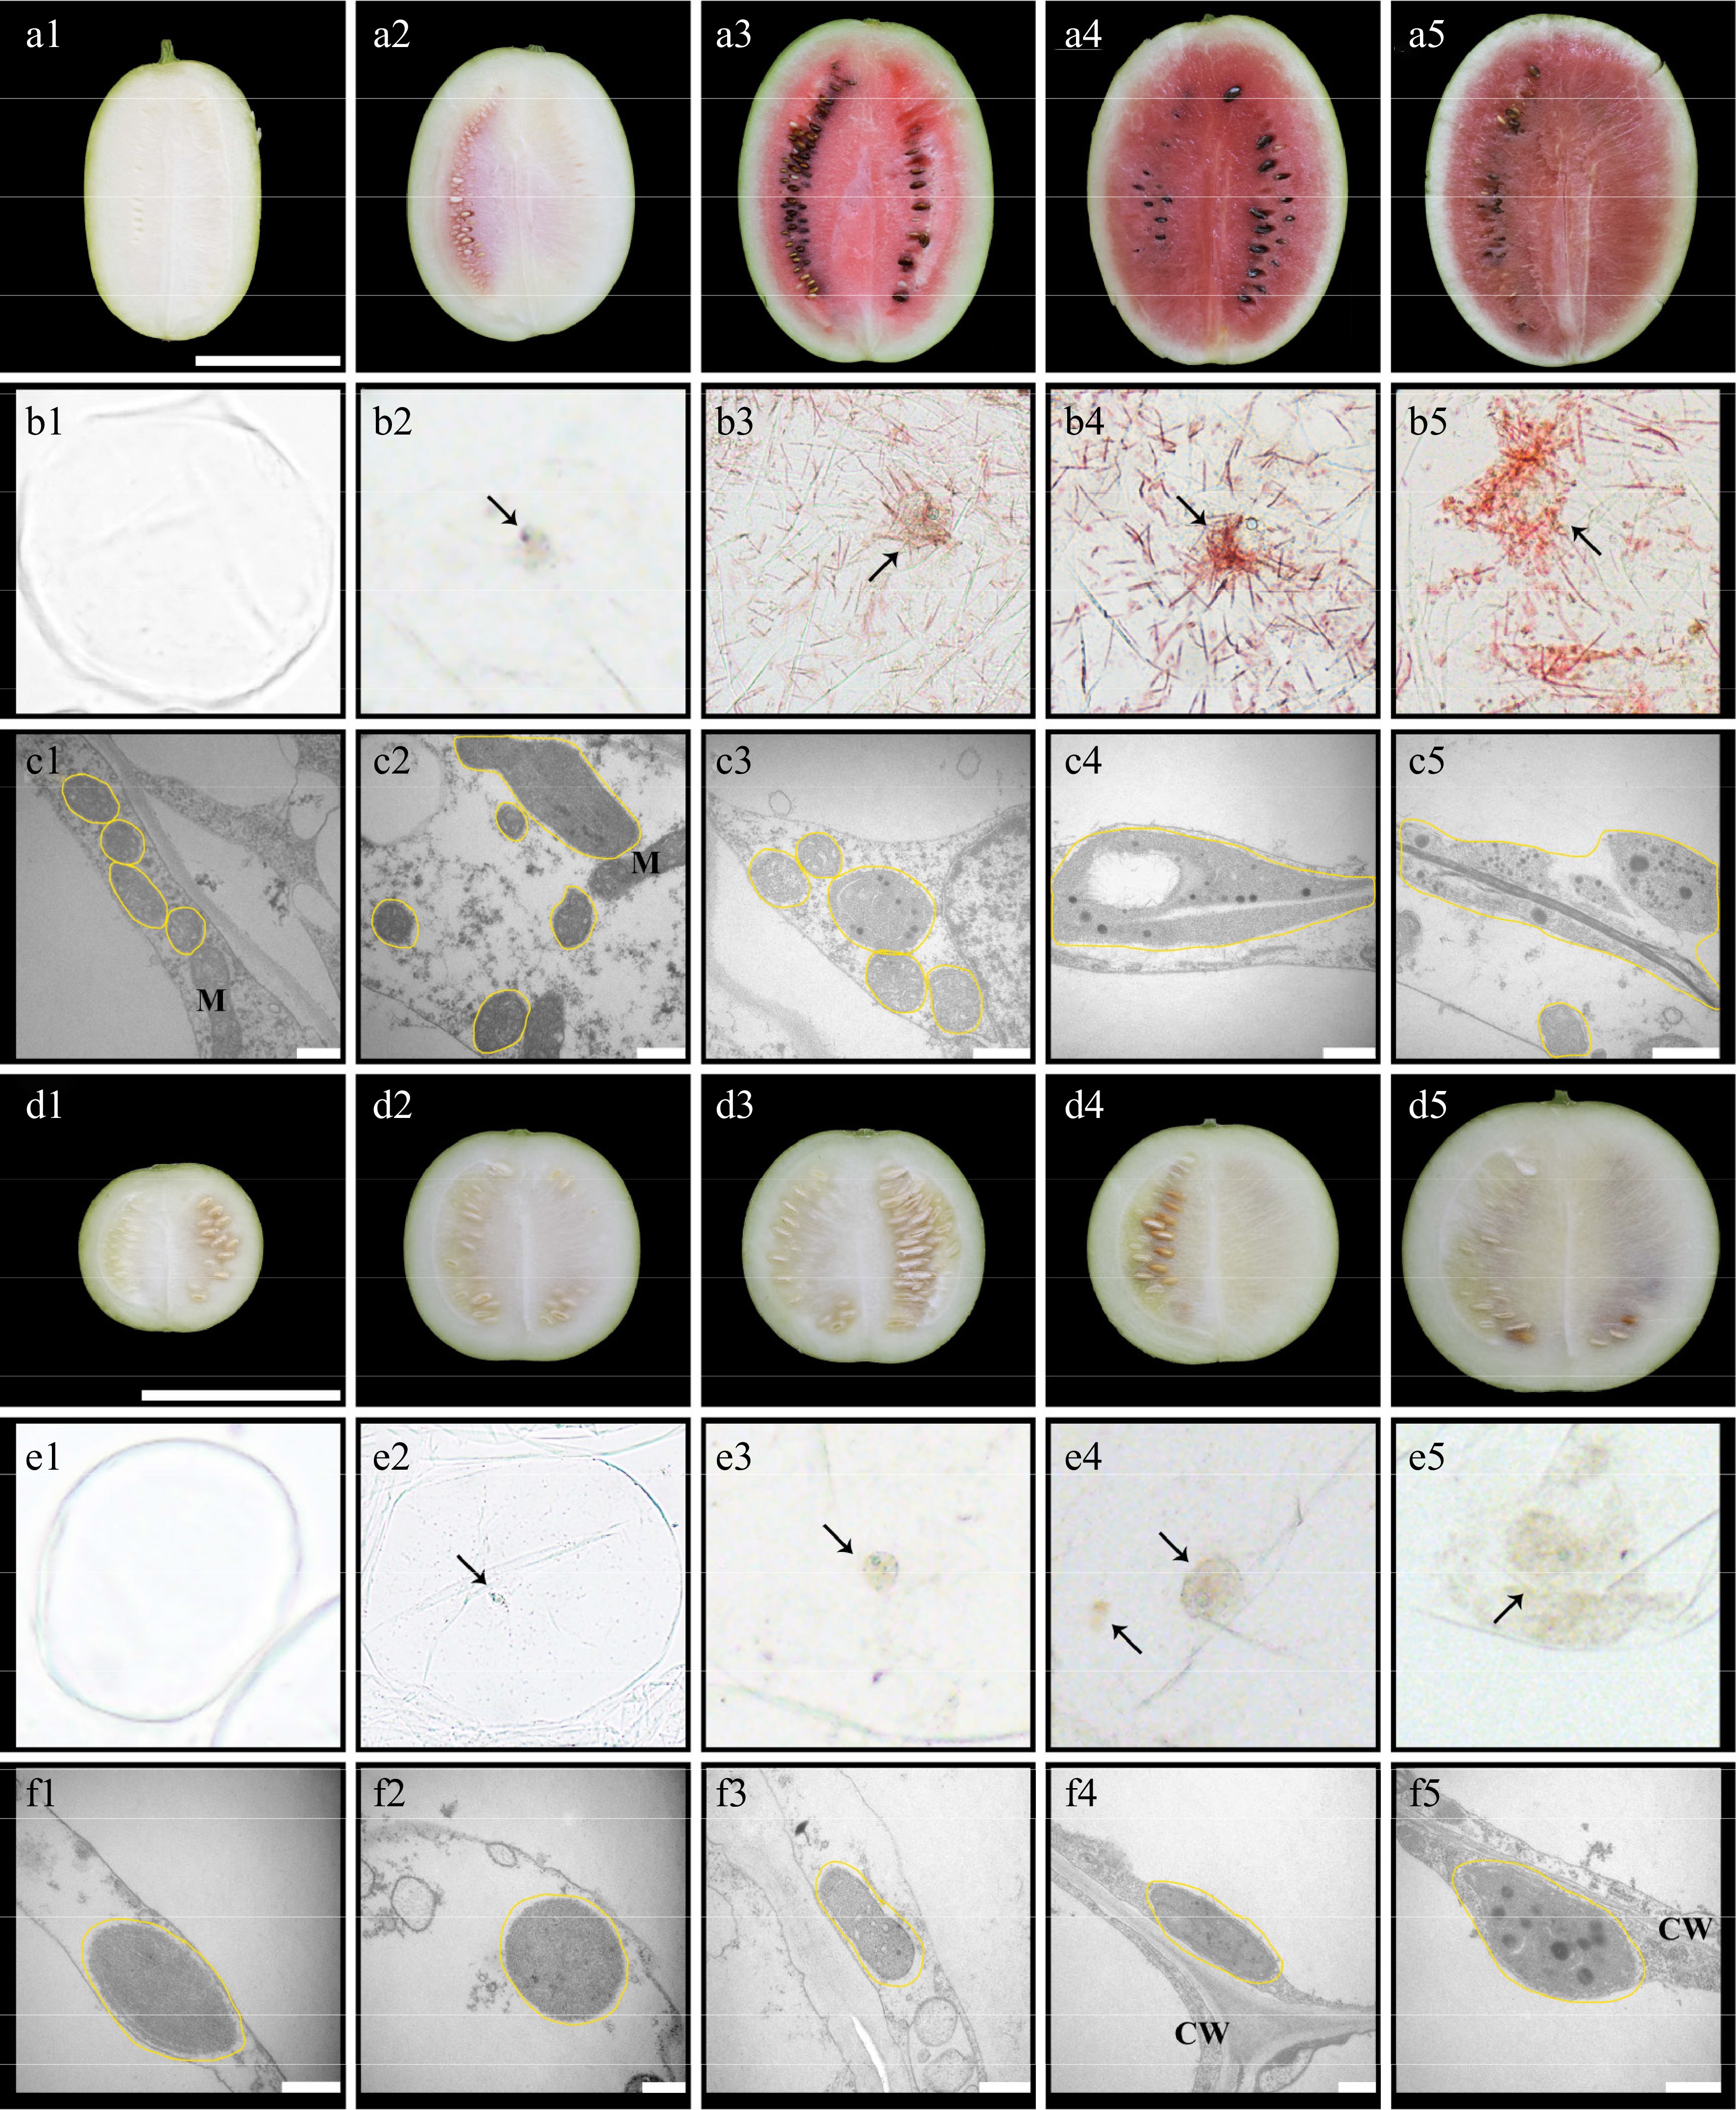
Figure 2.
Cytological observation of chromoplast in the flesh of watermelons (LSW-177 and W1-60). The letters (a)–(c) are the longitudinal section, cell microstructure, and cell sub-microstructure of the fruit of LSW-177, respectively; the letters (d)–(f) are the longitudinal section, cell microstructure, and cell sub-microstructure of the fruit of W1-60, respectively. The scale of (a) and (d) is 10 cm, and the scale of (c) and (f) is 0.5 µm. The numbers (1), (2), (3), (4), and (5) after the letters represent 10, 18, 26, 34, and 42 DAP, respectively. The black arrow points to the chromoplast, the yellow line represents the plast. M: mitochondria; CW: cell wall.
-
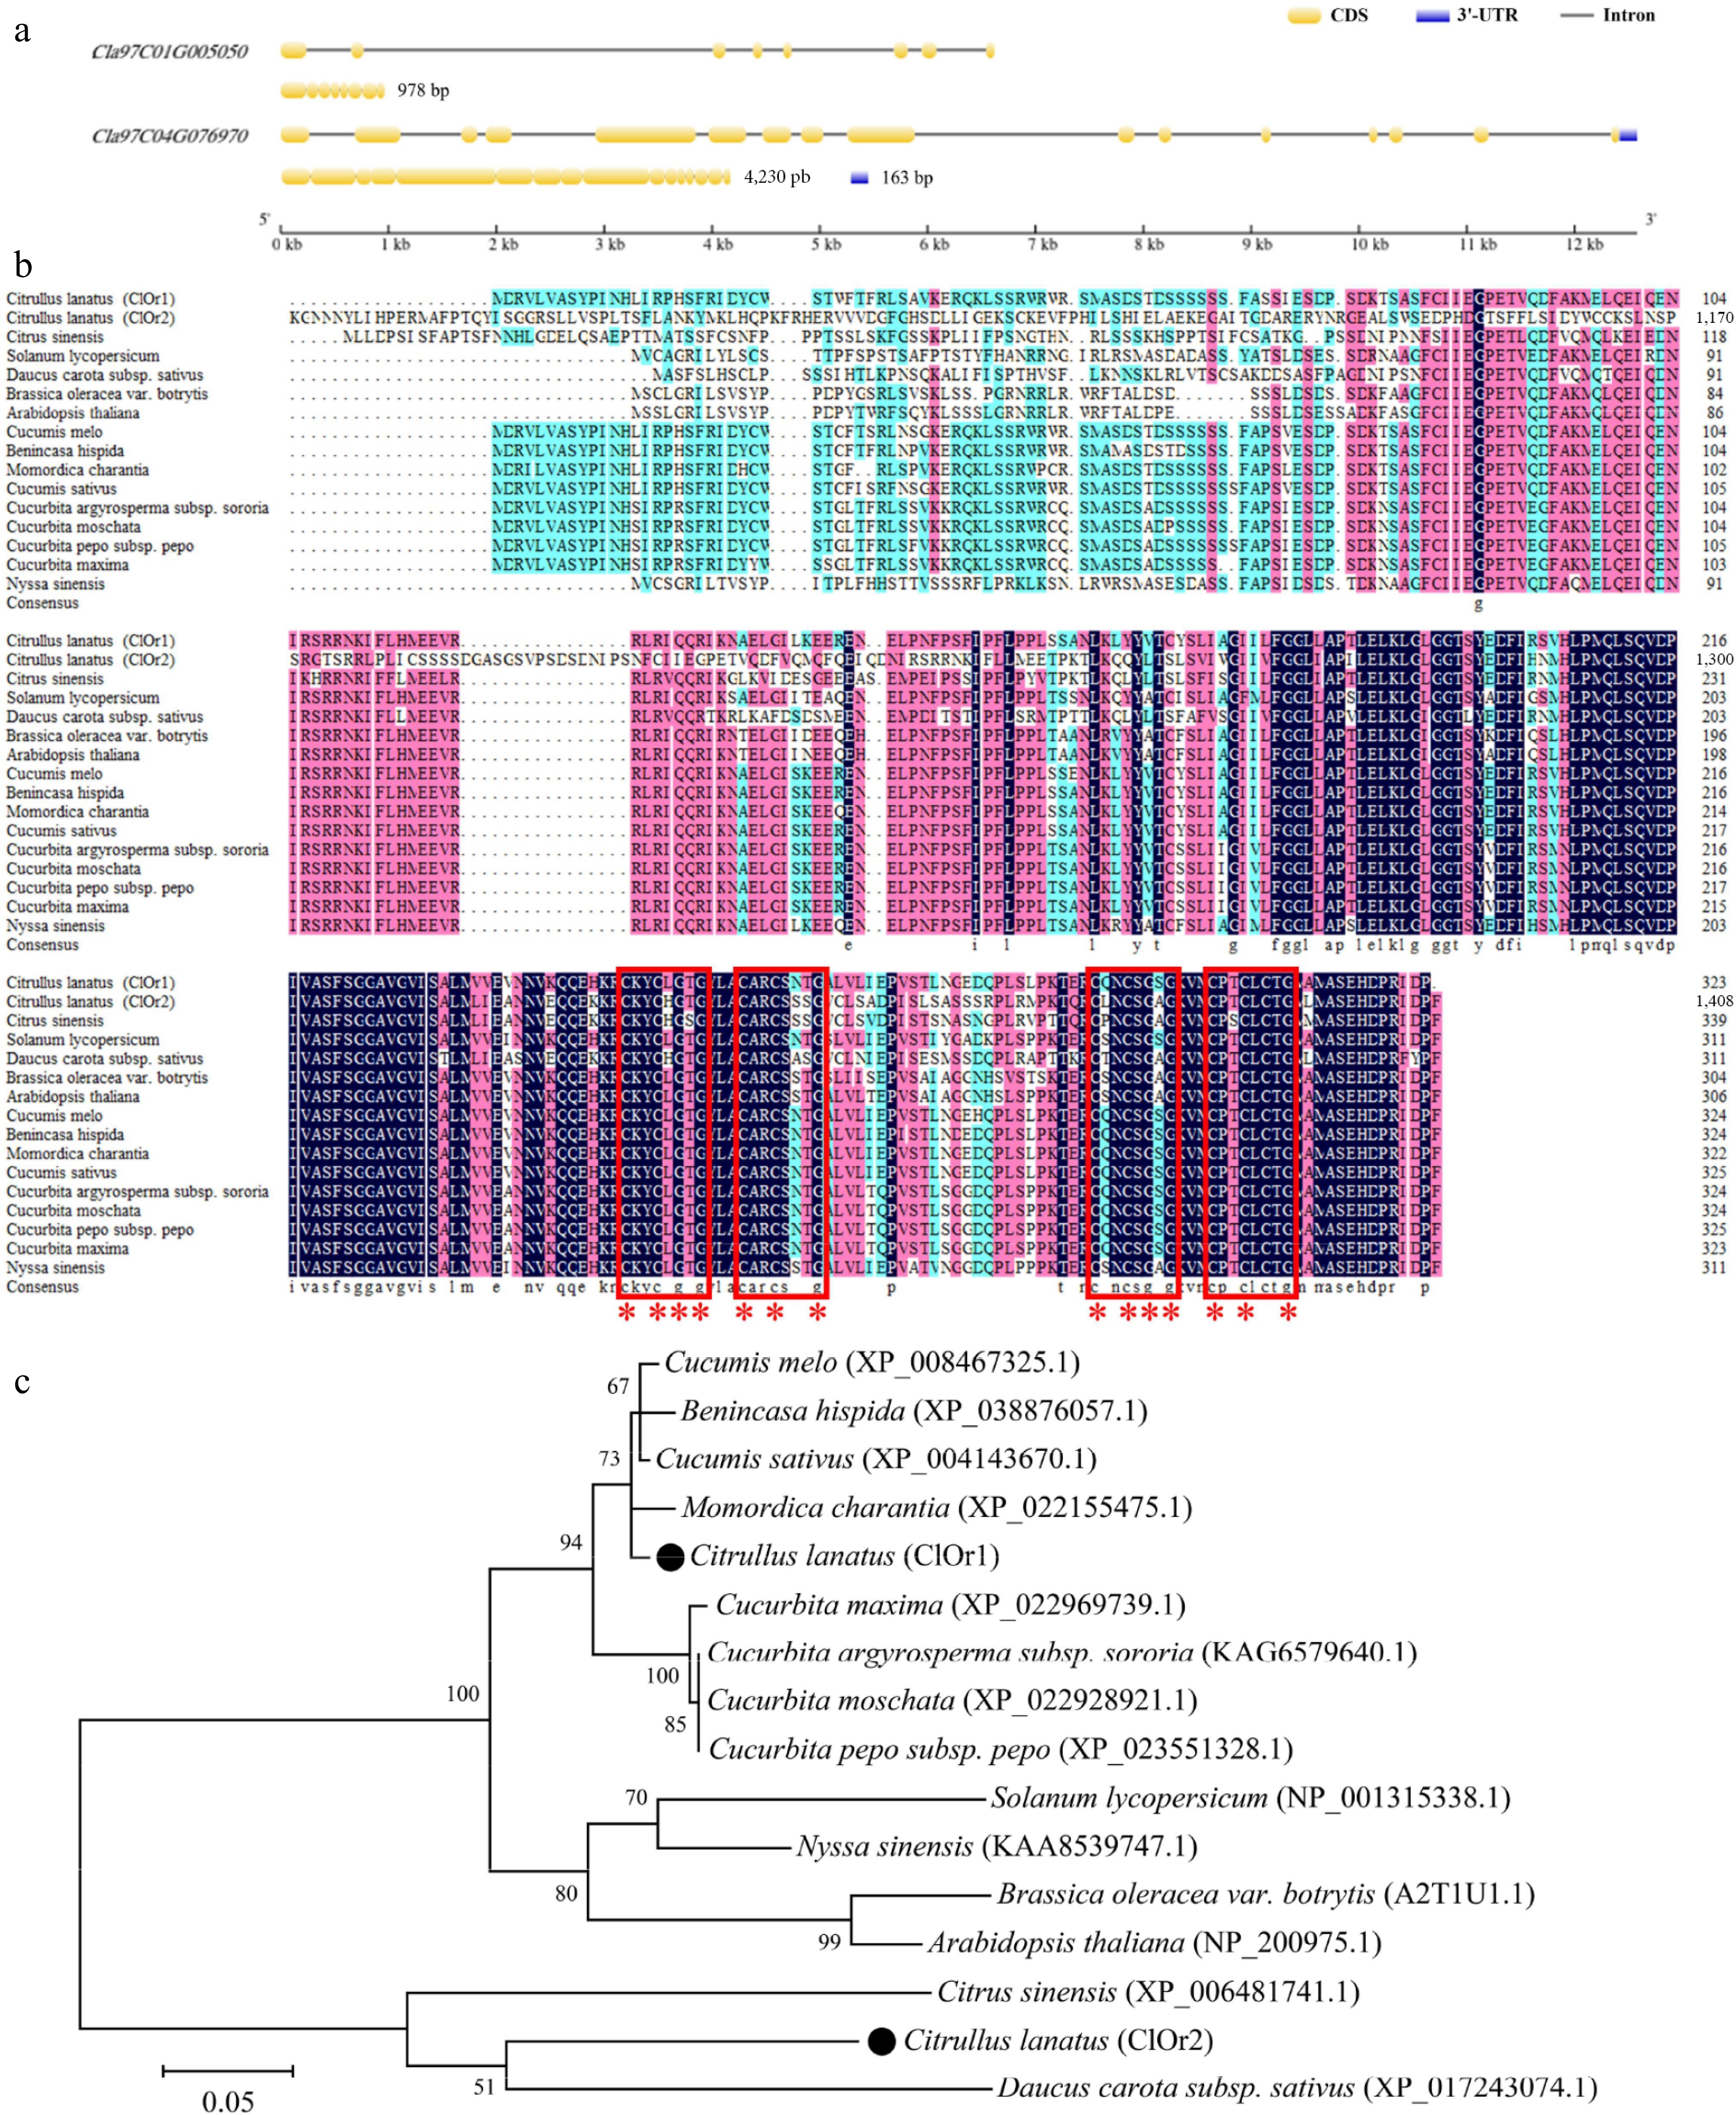
Figure 3.
Sequence alignment and phylogenetic analysis of ClOr. (a) Structure of the ClOr1 and ClOr2 genes. (b) Sequence analysis of the Or protein. The red box marks two (CxxCxGxG) motifs and two (CxxCxxxG) motifs, and the red '*' marks eight cysteine and six glycine residues that are highly conserved. (c) Phylogenetic tree of the Or protein. The bar indicates an evolutionary distance of 0.05%.
-
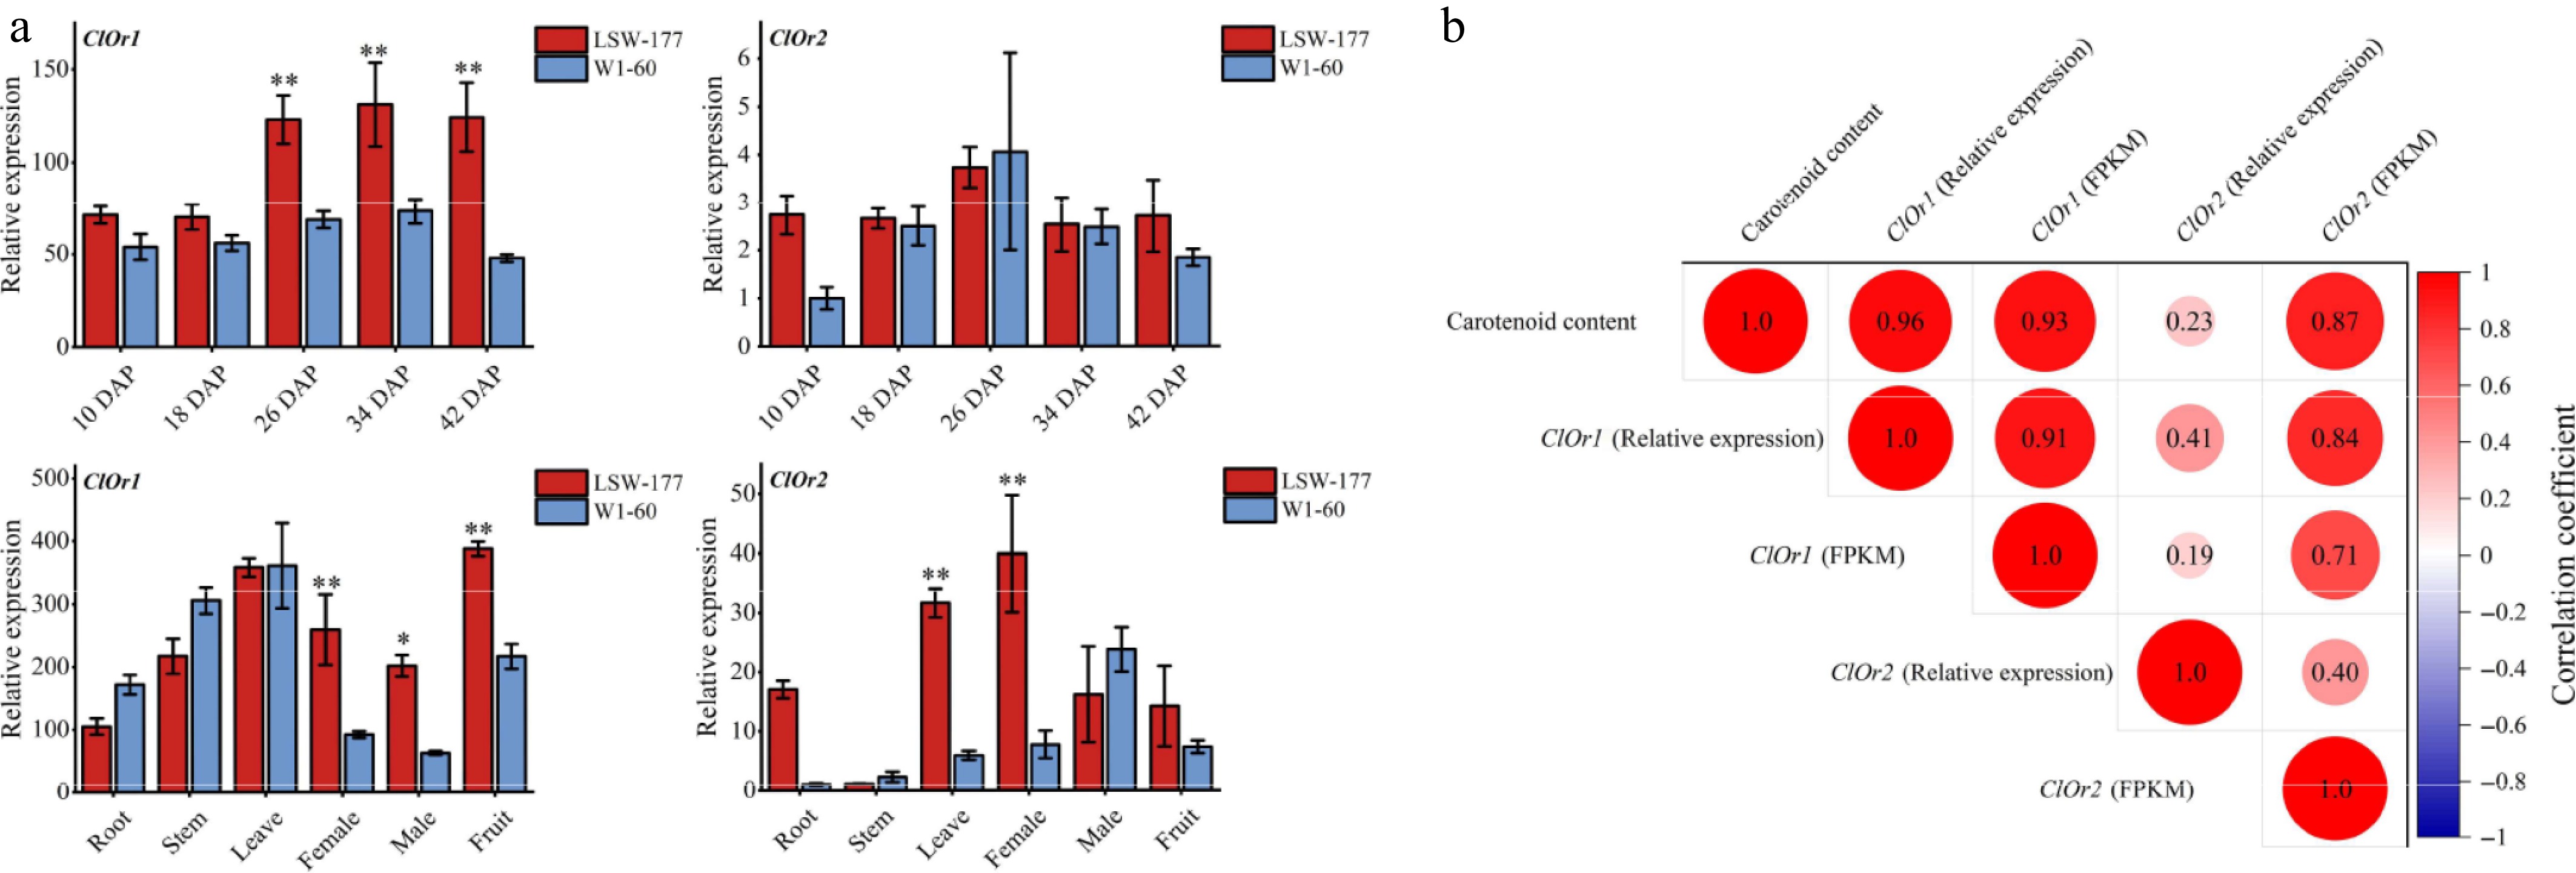
Figure 4.
Expression analysis of the ClOr gene in watermelons. (a) Expression analysis of the ClOr gene in red- and white-fleshed watermelon. Each data point represents the mean of three biological replicates, the error bar represents the mean ± standard error value, * significant difference, p < 0.05; ** p < 0.01 (two-tailed). (b) Correlation analysis between the ClOr gene expression and carotenoid content. Relative expression refers to the fluorescence quantitative data of the ClOr gene in LSW-177 and W1-60 materials at different developmental stages, and FPKM refers to the RNA-Seq data of the ClOr gene in LSW-177 (PRJNA338036) and W1-60 at different developmental stages. The number in the circle pattern is the Pearson correlation coefficient (two-tailed), respectively.
-
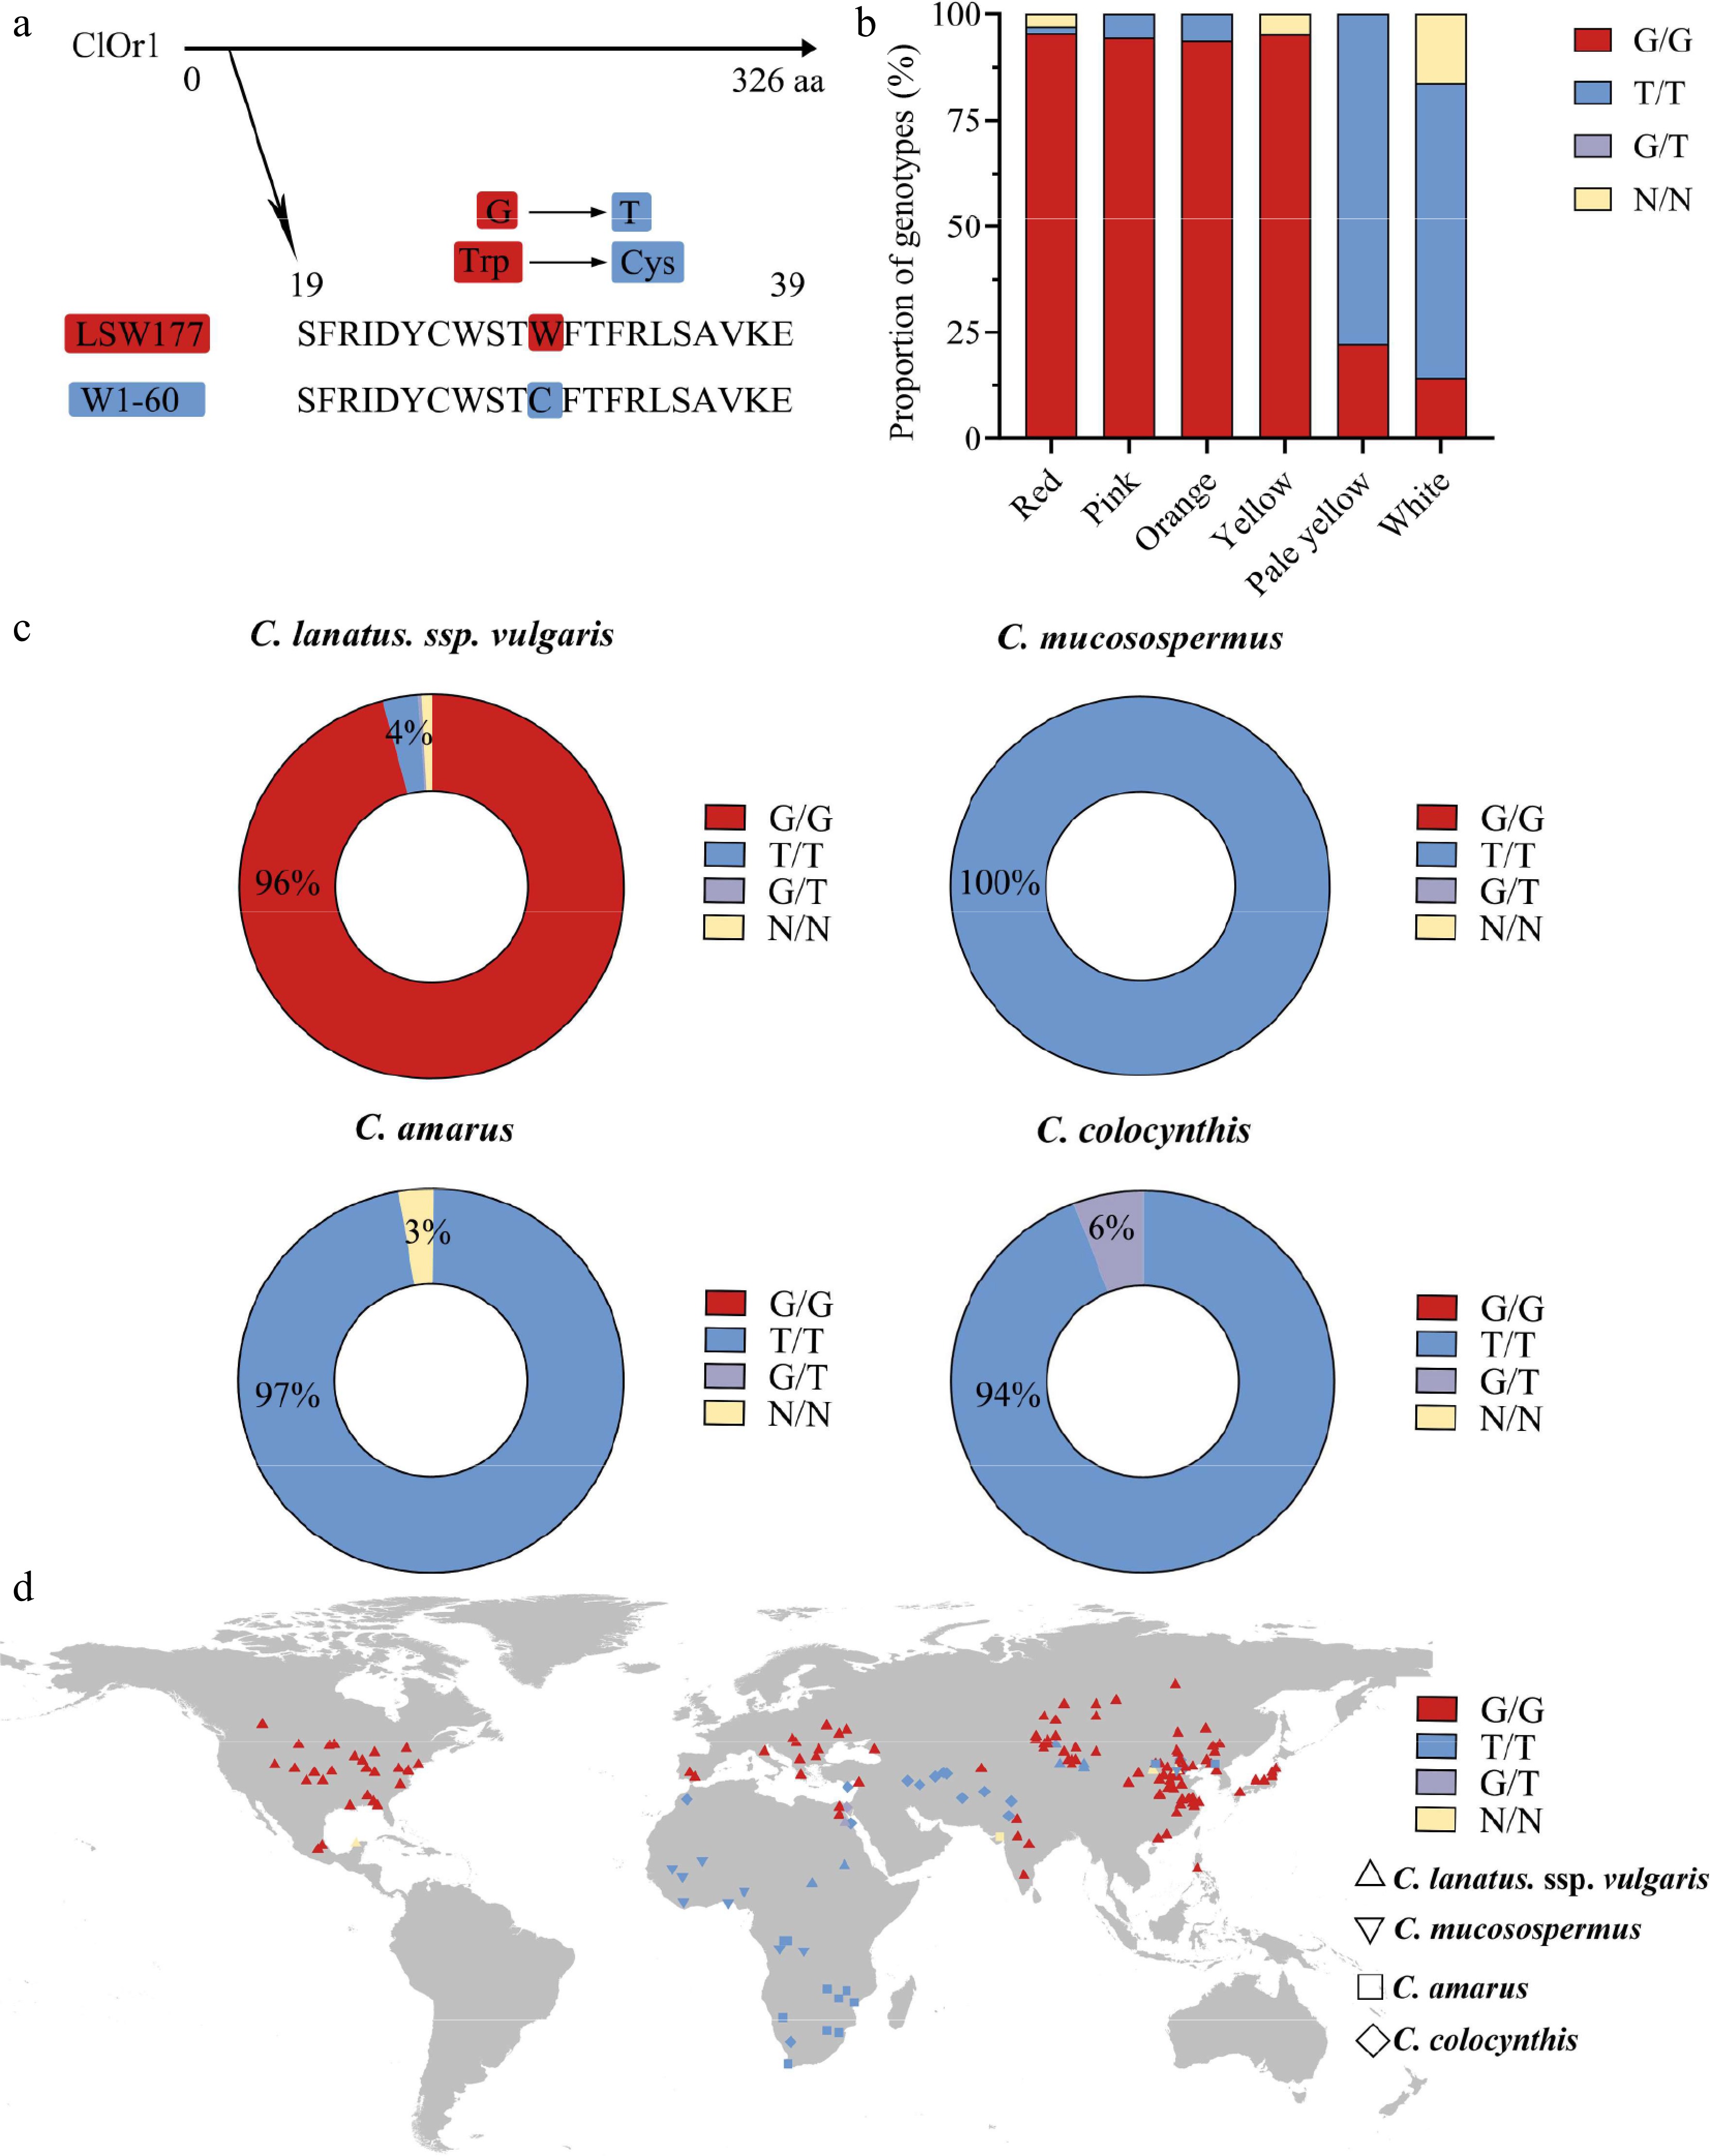
Figure 5.
A single SNP variation in the ClOr1 gene can affect the formation of watermelon flesh color. (a) Sequence variation of ClOr1 protein between LSW-177 and W1-60. A non-synonymous mutation from guanine (G) to thymine (T) at the 29th amino acid of ClOr1 resulted in an amino acid variation from tryptophan (Trp) to cysteine (Cys). (b) Genotype proportions of watermelons with different flesh colors (red, pink, orange, yellow, pale yellow, white). The red sections represented the G/G genotype identical to LSW-177, the blue sections represented the T/T genotype identical to W1-60, the purple sections represented the G/T genotype, and the orange sections represented unknown. (c) Genotype of 406 watermelon accessions using a doughnut chart. (d) Geographical distribution of genomic variations in the ClOr1 gene of 428 watermelon accessions. C. lanatus, ssp. vulgaris was represented by an upright triangle, C. mucosospermus was represented by an inverted triangle, C. amarus was represented by a square, and C. colocynthis was represented by a rhombus.
-
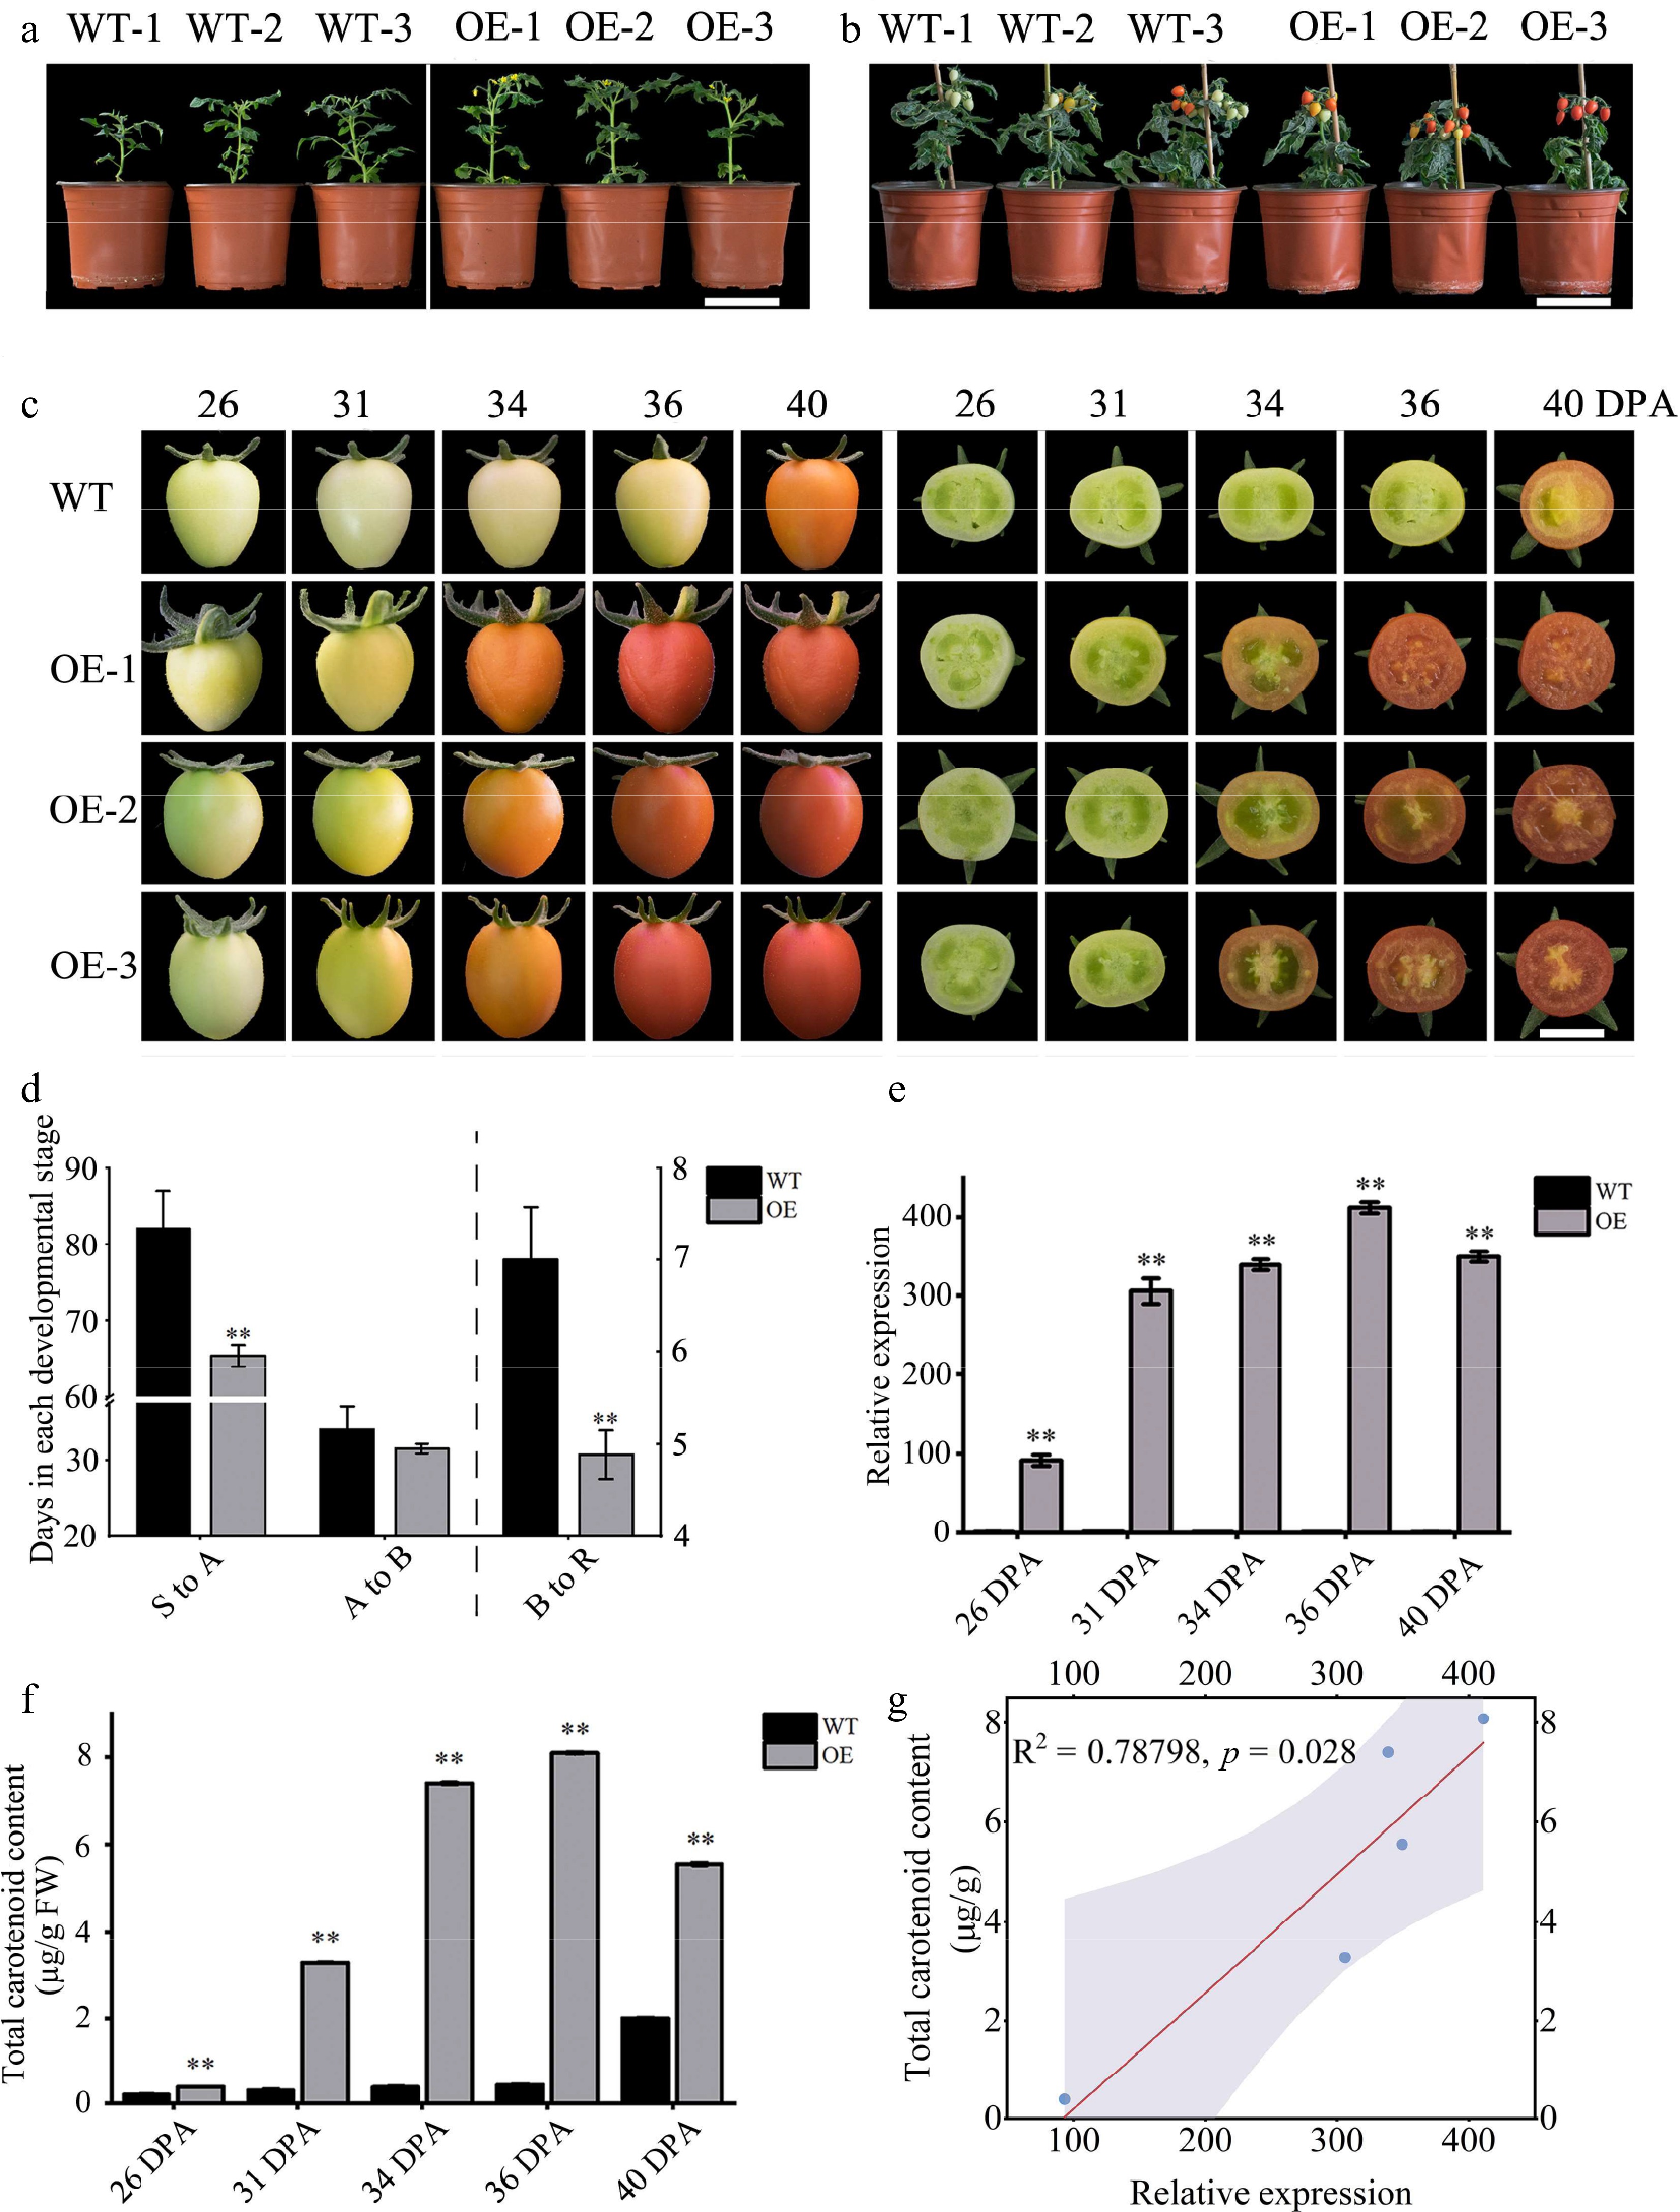
Figure 6.
Phenotypic and gene expression analysis of WT and OE tomatoes. (a) First flowering state of tomato plants, scale = 10 cm. (b) Fruit development status of tomato plants, scale = 10 cm. (c) Tomato fruit phenotype, scale = 1 cm. (d) Number of days required for each developmental period in tomato fruit; see the left Y axis for (S to A) and (A to B), and the right Y axes for (B to R). (e) The expression level of the ClOr1 gene in fruits at different ripening stages, in which the expression level of the 26 DPA fruit of WT tomato was used for calibration. (f) Total carotenoid content in fruits at different ripening stages. In (d)–(f), each data point represents the mean of three biological replicates, the error bar represents the mean ± standard error value, ** significant difference between the WT and OE tomatoes, p < 0.01 (two-tailed). (g) Correlation analysis between the ClOr1 gene expression and total carotenoid content.
-
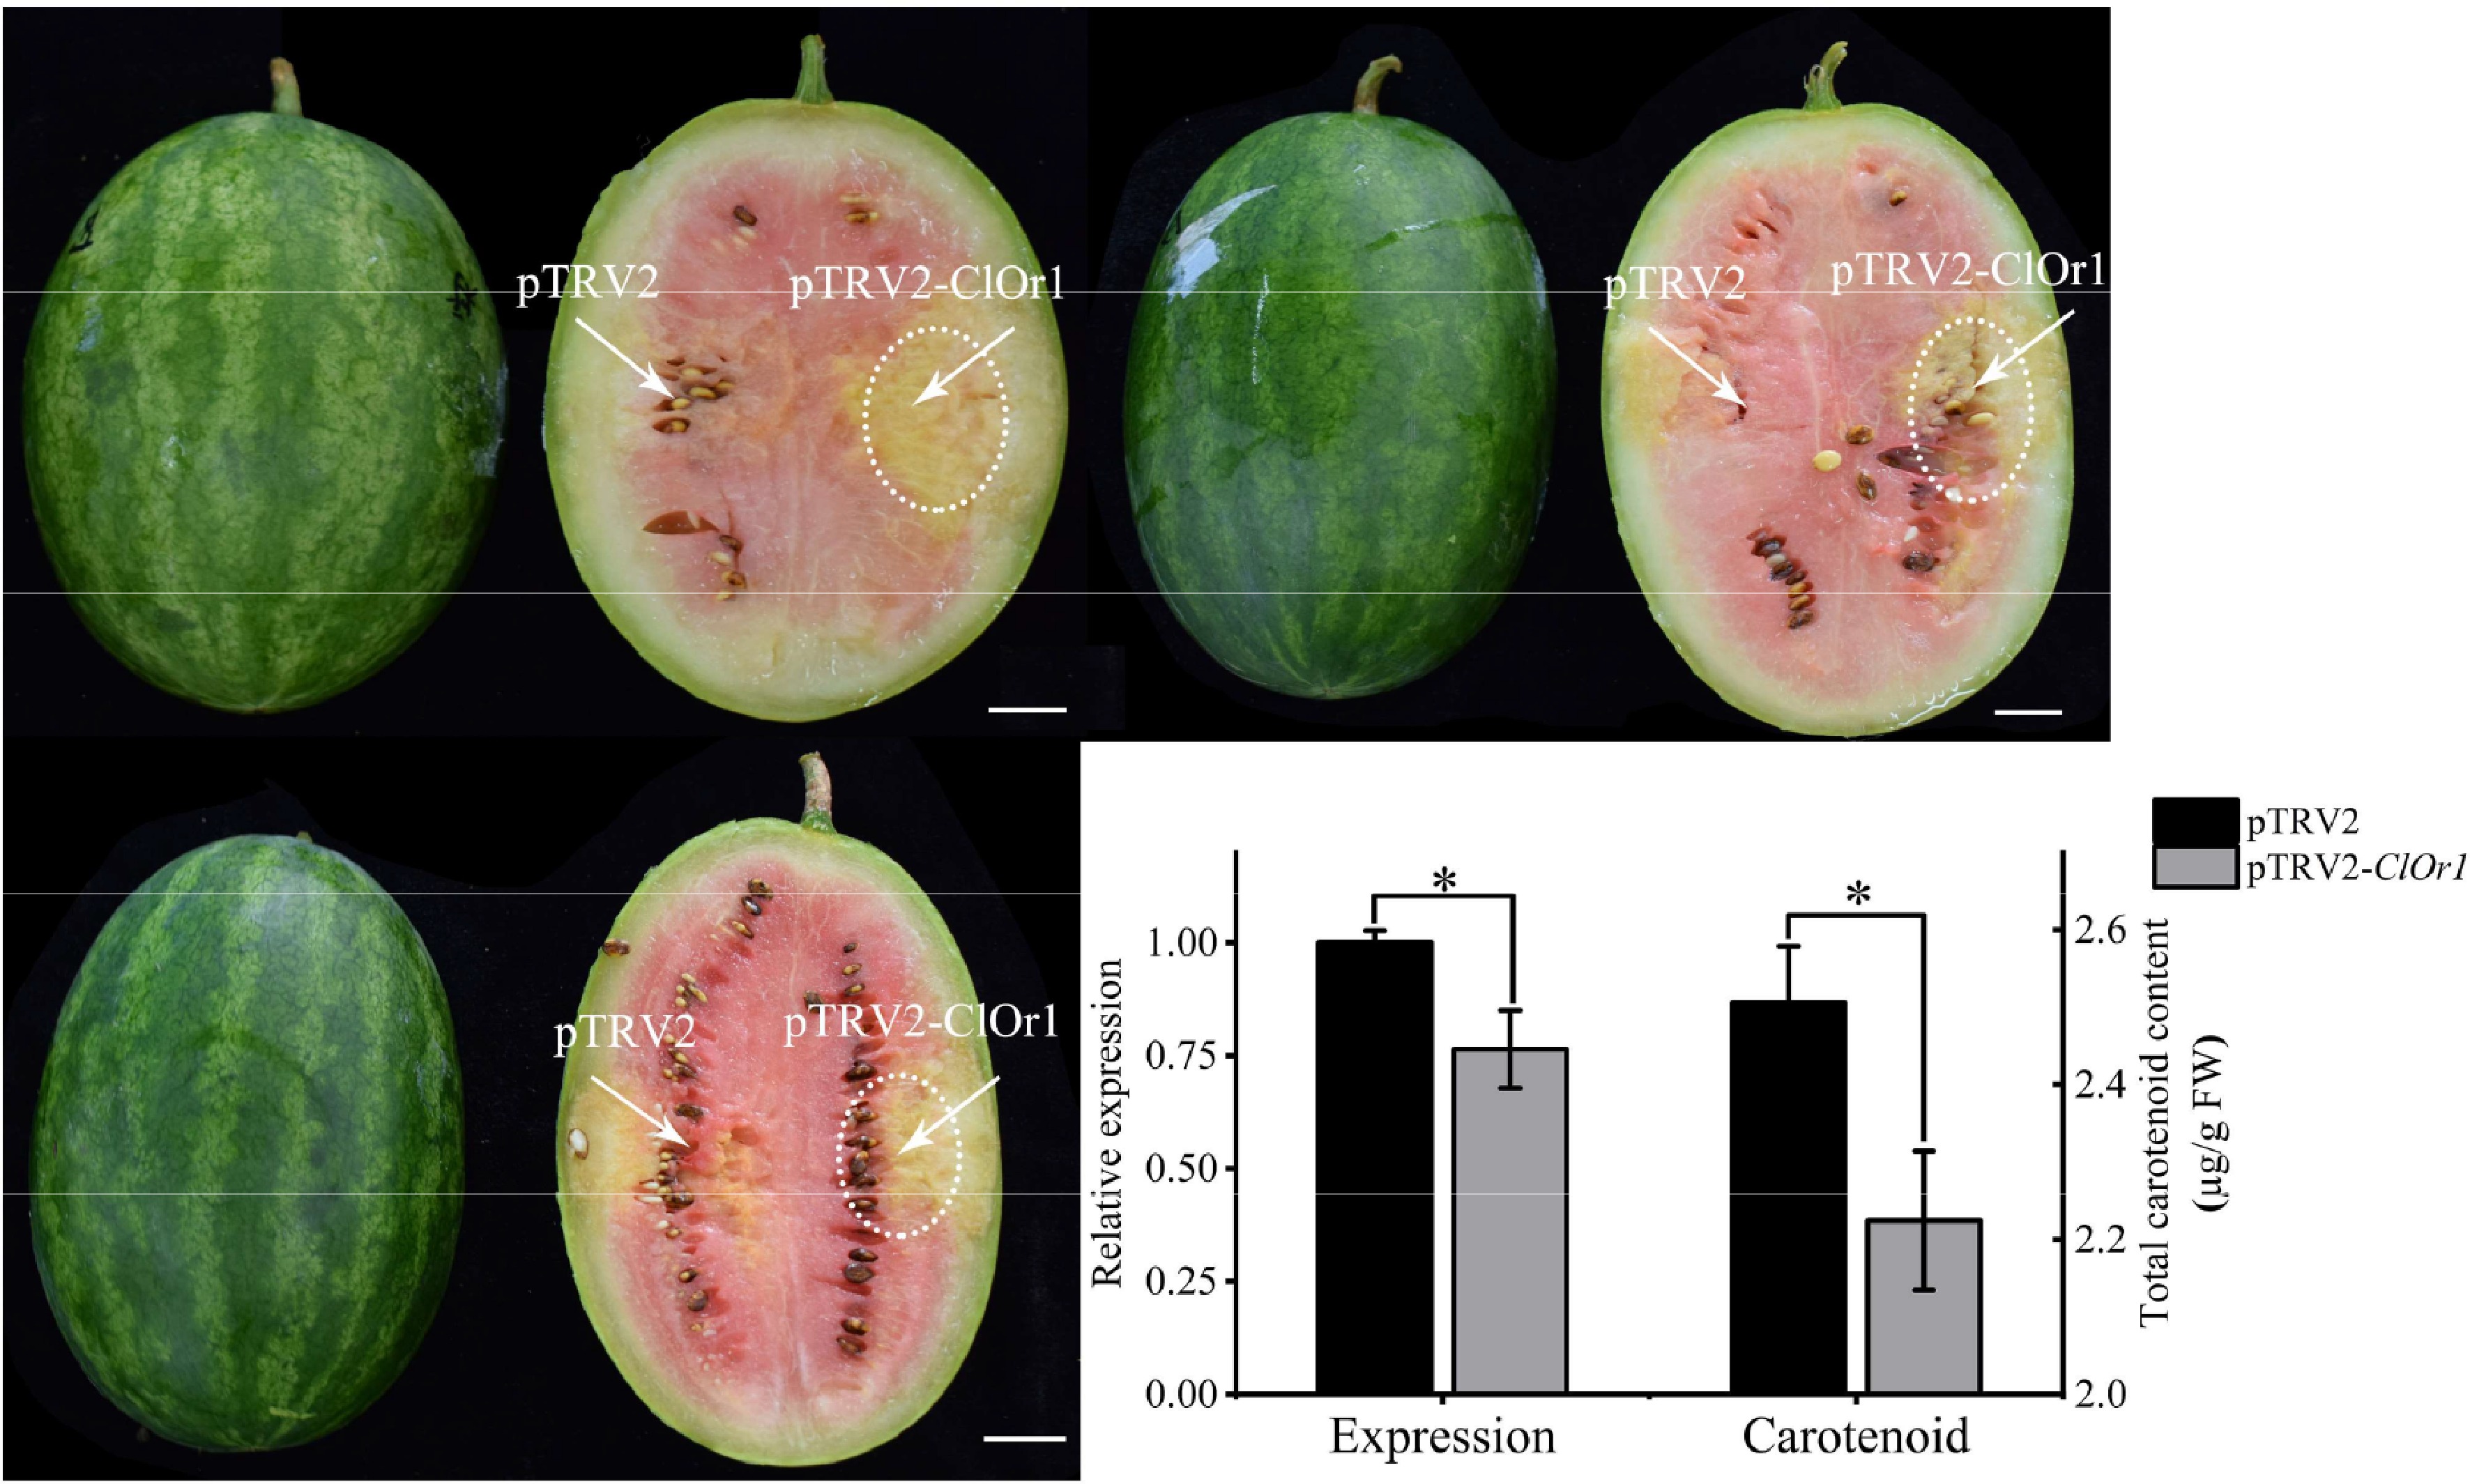
Figure 7.
Analysis of watermelon flesh transformation effect. (a) VIGS effect diagram of watermelon flesh, scale = 2 cm. (b) qRT-PCR analysis and total carotenoid detection, and the expression level of pTRV2 in the control group was used for calibration. * Significant difference between pTRV2 of the control group, and pTRV2-ClOr1 of the experimental group, p < 0.05 (two-tailed). Each data point represents the mean of three biological repeats, and the error bar represents the mean ± standard error value.
-
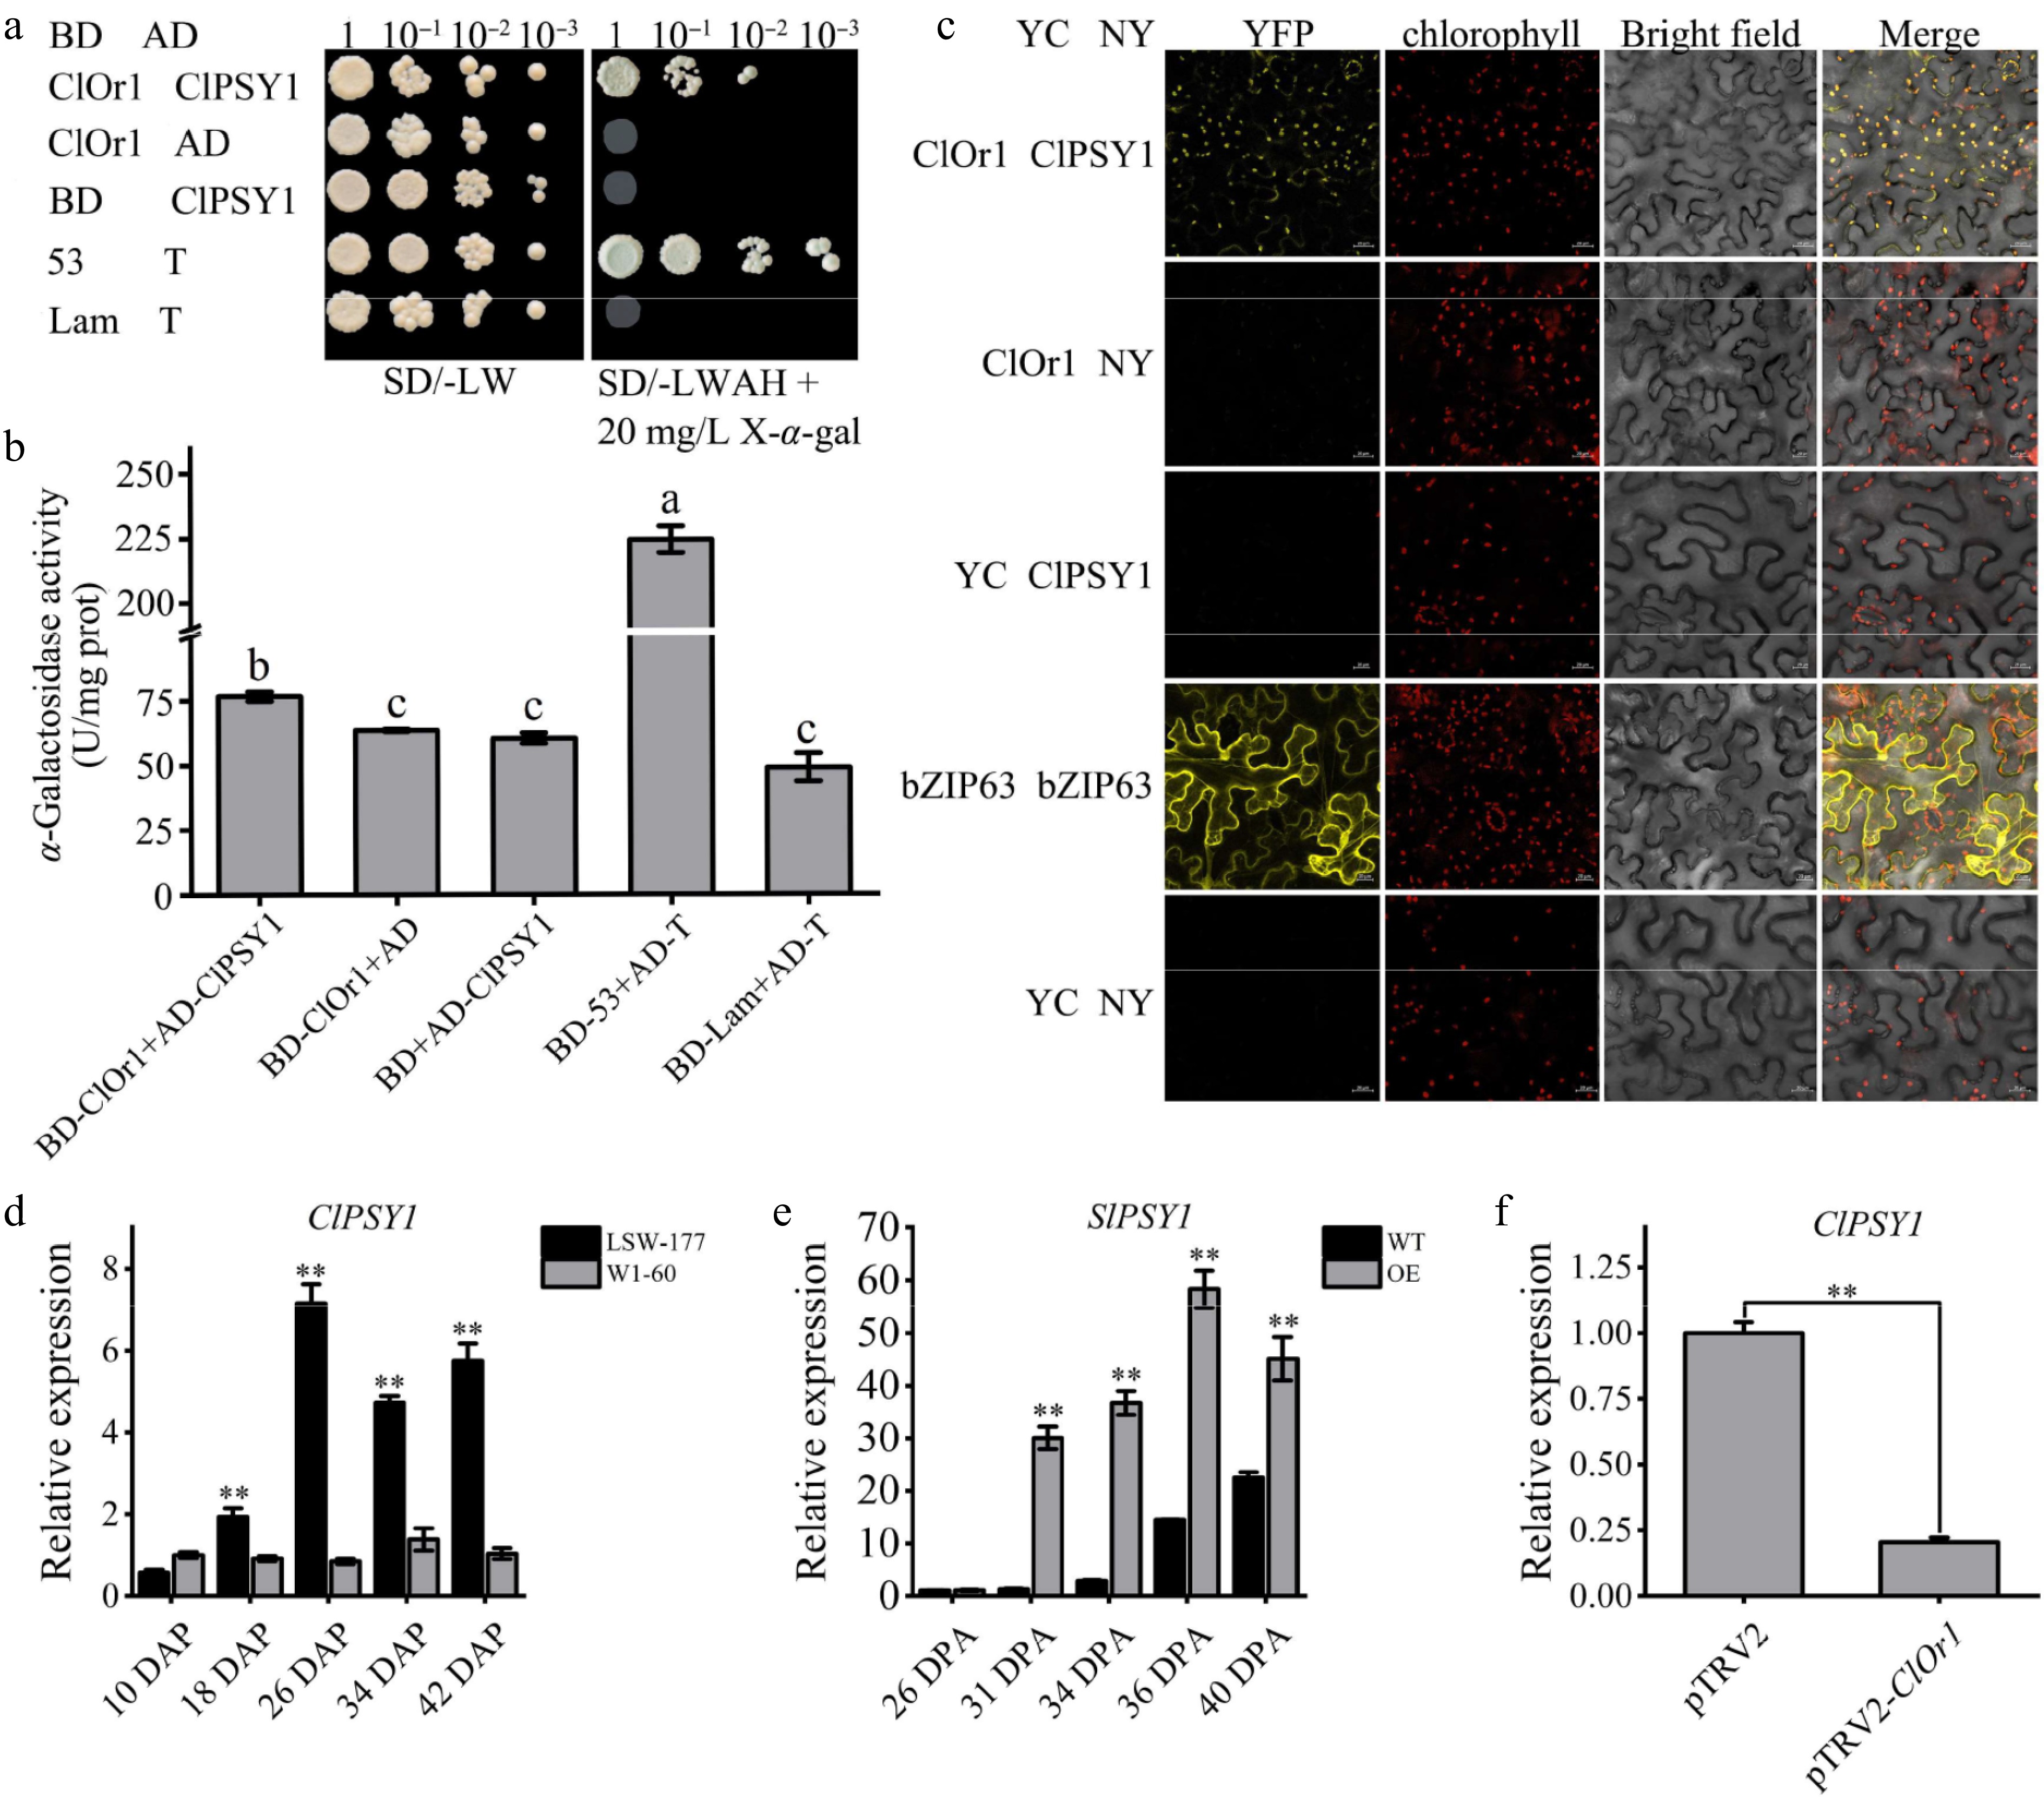
Figure 8.
ClOr1 interacted with ClPSY1. (a) Y2H assays. Growth of co-transformed yeast on non-selective SD/-LW medium and selective SD/-LWAH medium. Positive control BD-53 + AD-T (pGBKT7-53 + pGADT7-T), negative control BD-Lam + AD-T (pGBKT7-Lam + pGADT7-T). (b) α-Galactosidase activity detection. U/mg prot, unit enzyme activity, is 1 nmol p-nitrophenol per mg histone per hour. The results of the one-way analysis of variance were indicated by different lowercase letters (p < 0.05). (c) BiFC assays. YFP: yellow fluorescent channels; Bright field: chloroplast spontaneous fluorescent channels; Merge: superposition field. YC-bZIP-63 + NY-bZIP-63 and YC + NY were used as positive control and negative control, respectively. (d), (f) Expression analysis of the ClPSY1 gene in watermelons. (e) Expression analysis of the SlPSY1 gene in tomato fruits at different ripening stages. Bar data are the means of three biological replicates ± standard error value, * p < 0.05; ** p < 0.01 (two-tailed).
Figures
(8)
Tables
(0)