-
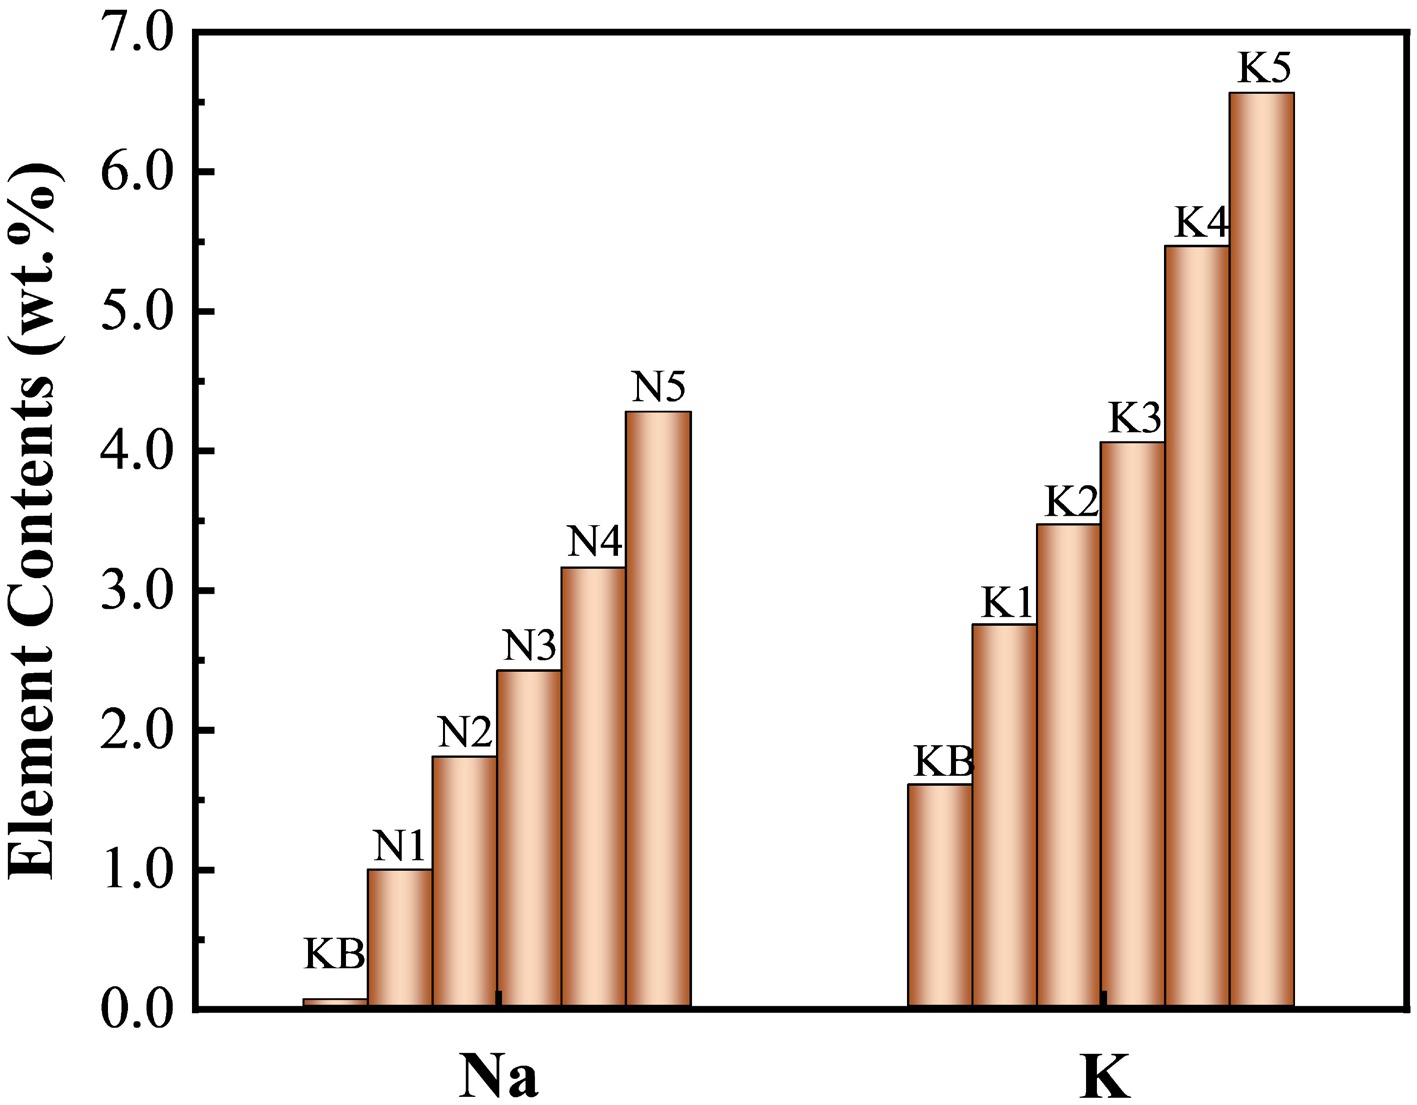
Figure 1.
Contents of Na or K elements in reconstituted tobacco sheets after adding alkali metal salts (measured by ICP‒OES).
-
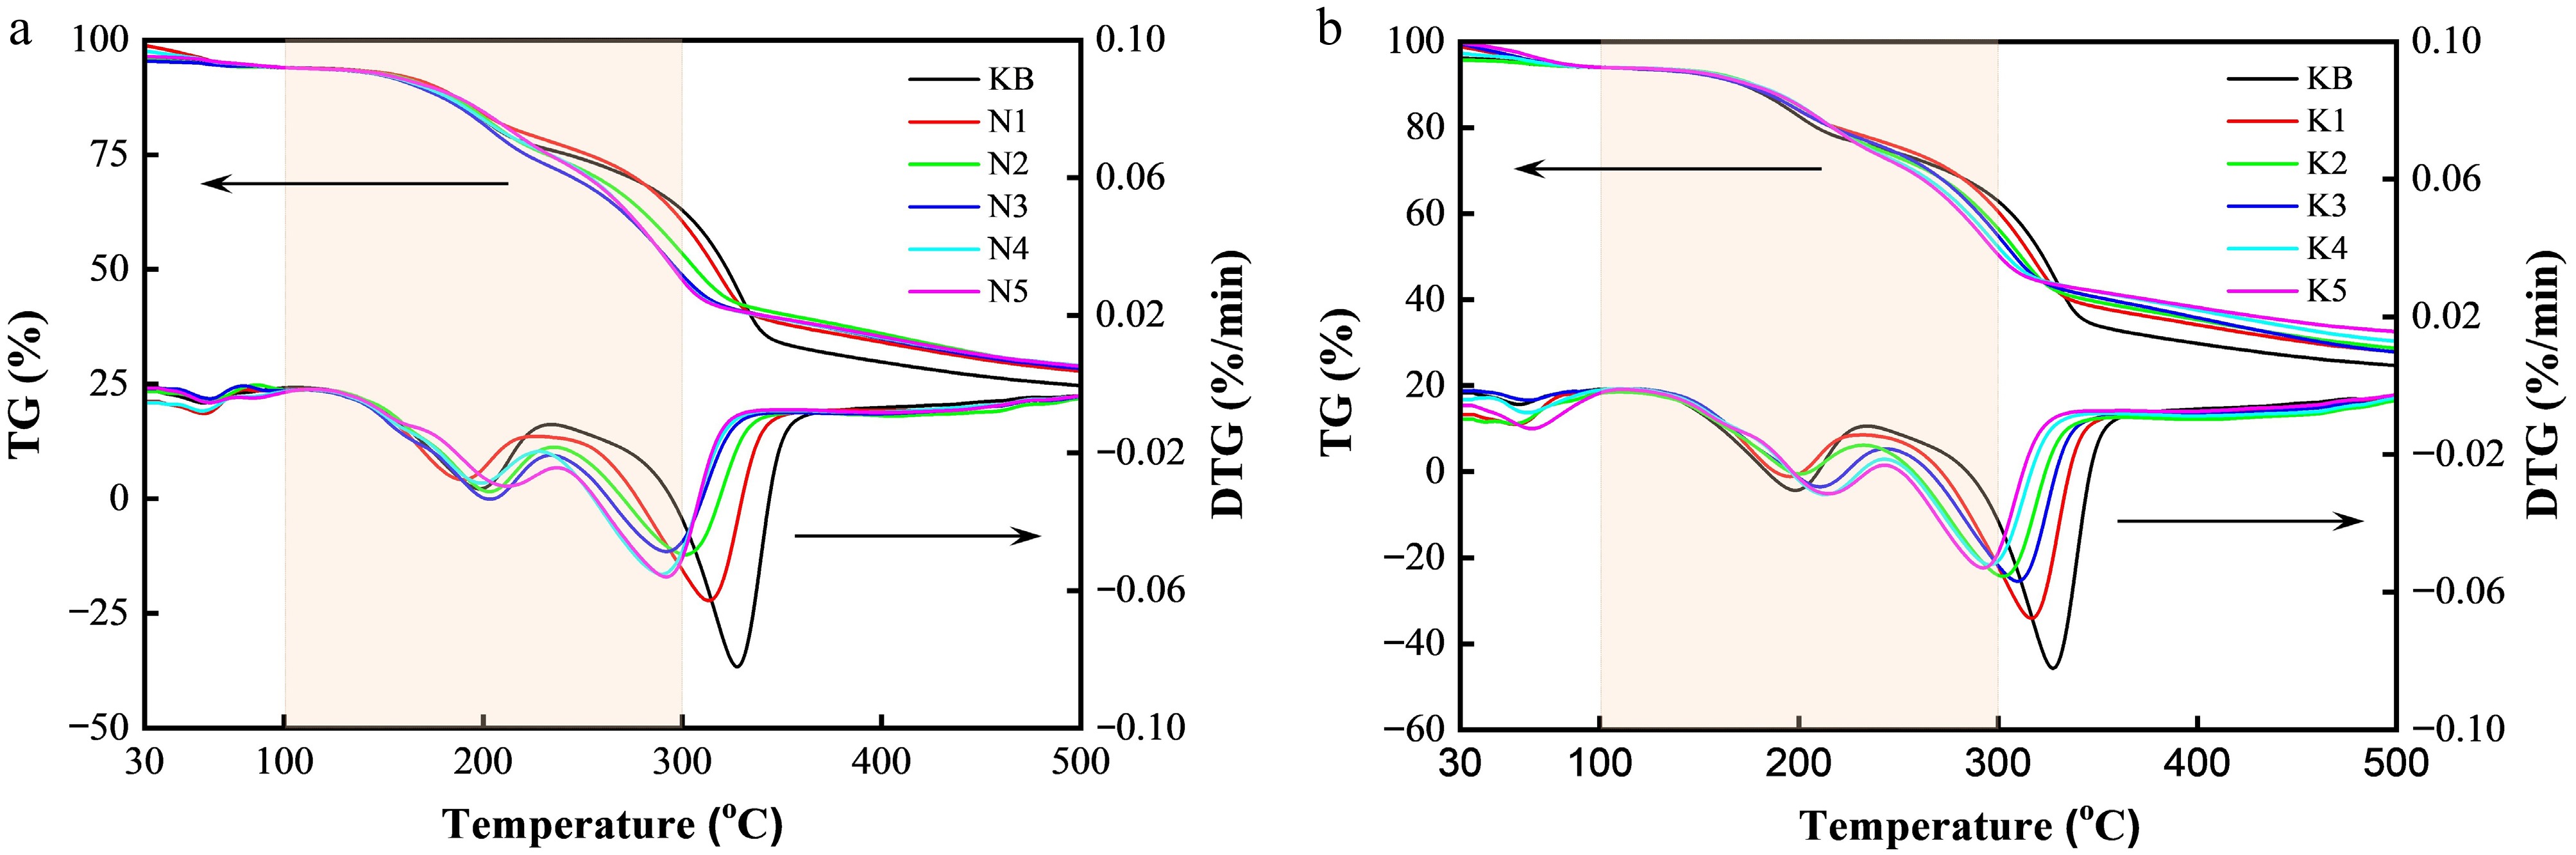
Figure 2.
TG and DTG curves of reconstituted tobacco sheets with varying additions of (a) Na salt and (b) K salt.
-
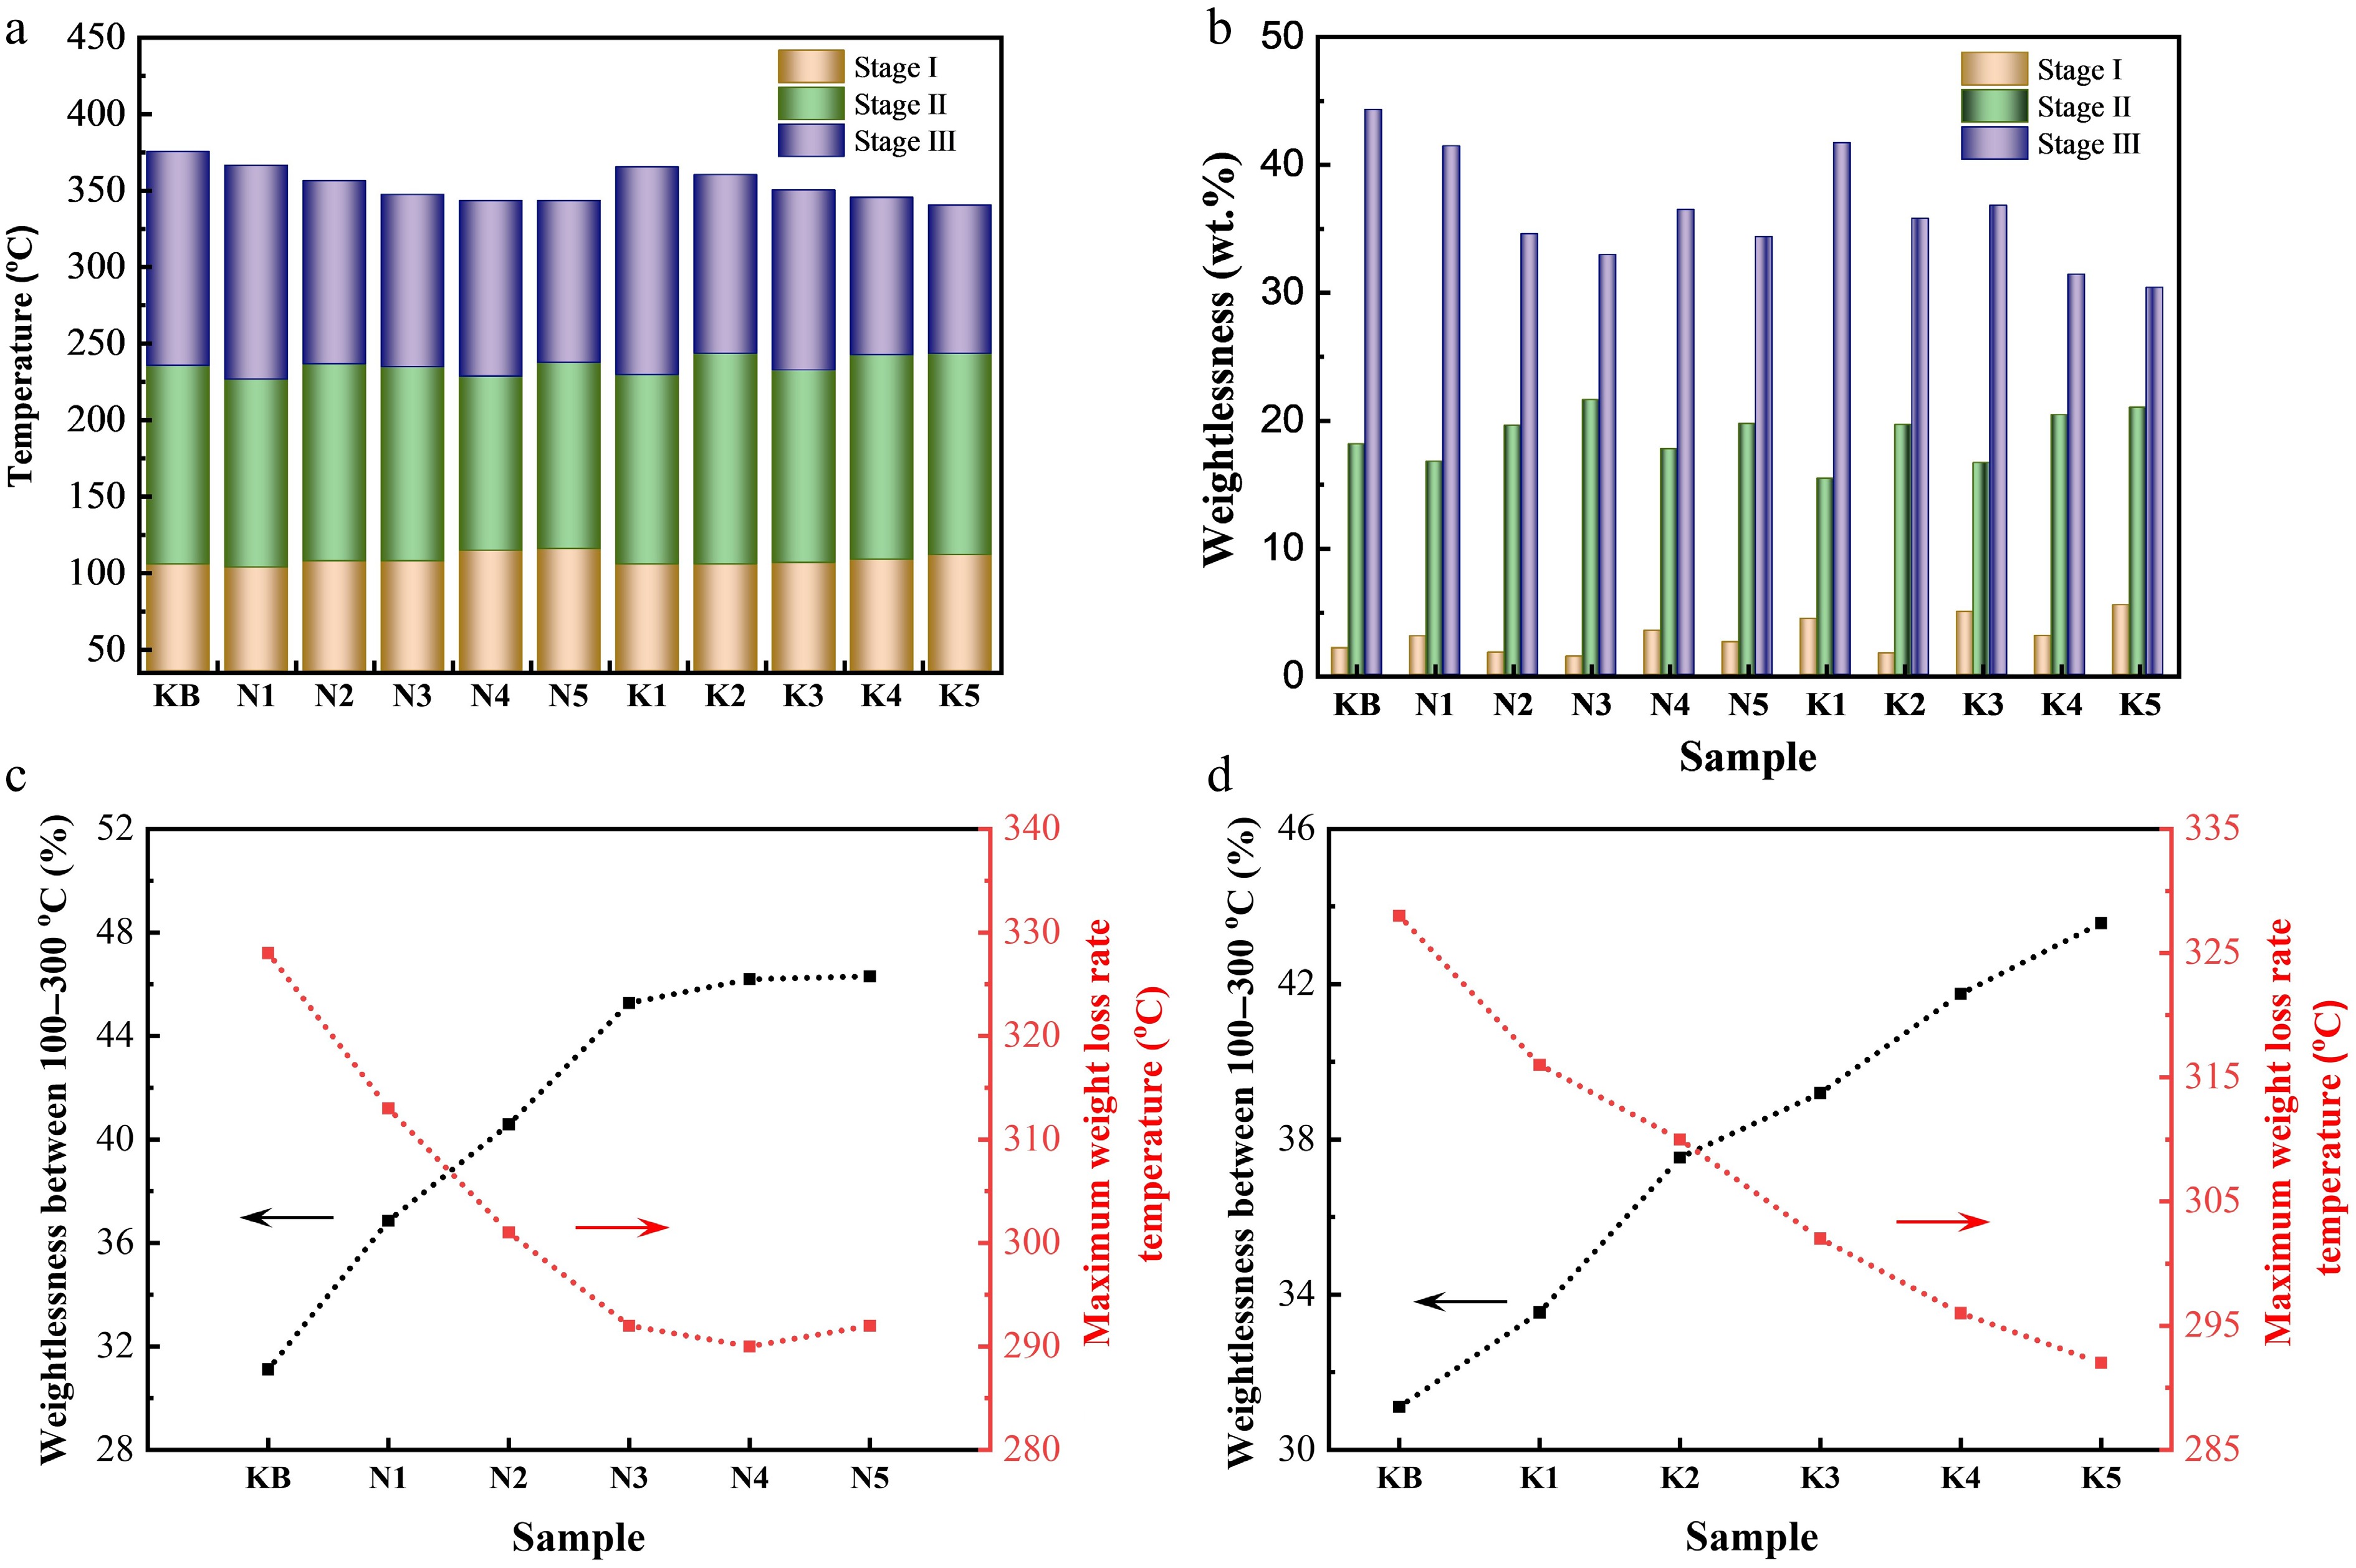
Figure 3.
(a) Weight loss transition temperatures of reconstituted tobacco sheets during pyrolysis at 35–500 °C. (b) Weight loss of reconstituted tobacco sheets in weight loss Stages I–III. Weight loss (left) at 100–300 °C and maximum weight loss rate at temperatures below 500 °C (right) of reconstituted tobacco sheets with added (c) Na salt or (d) K salt.
-
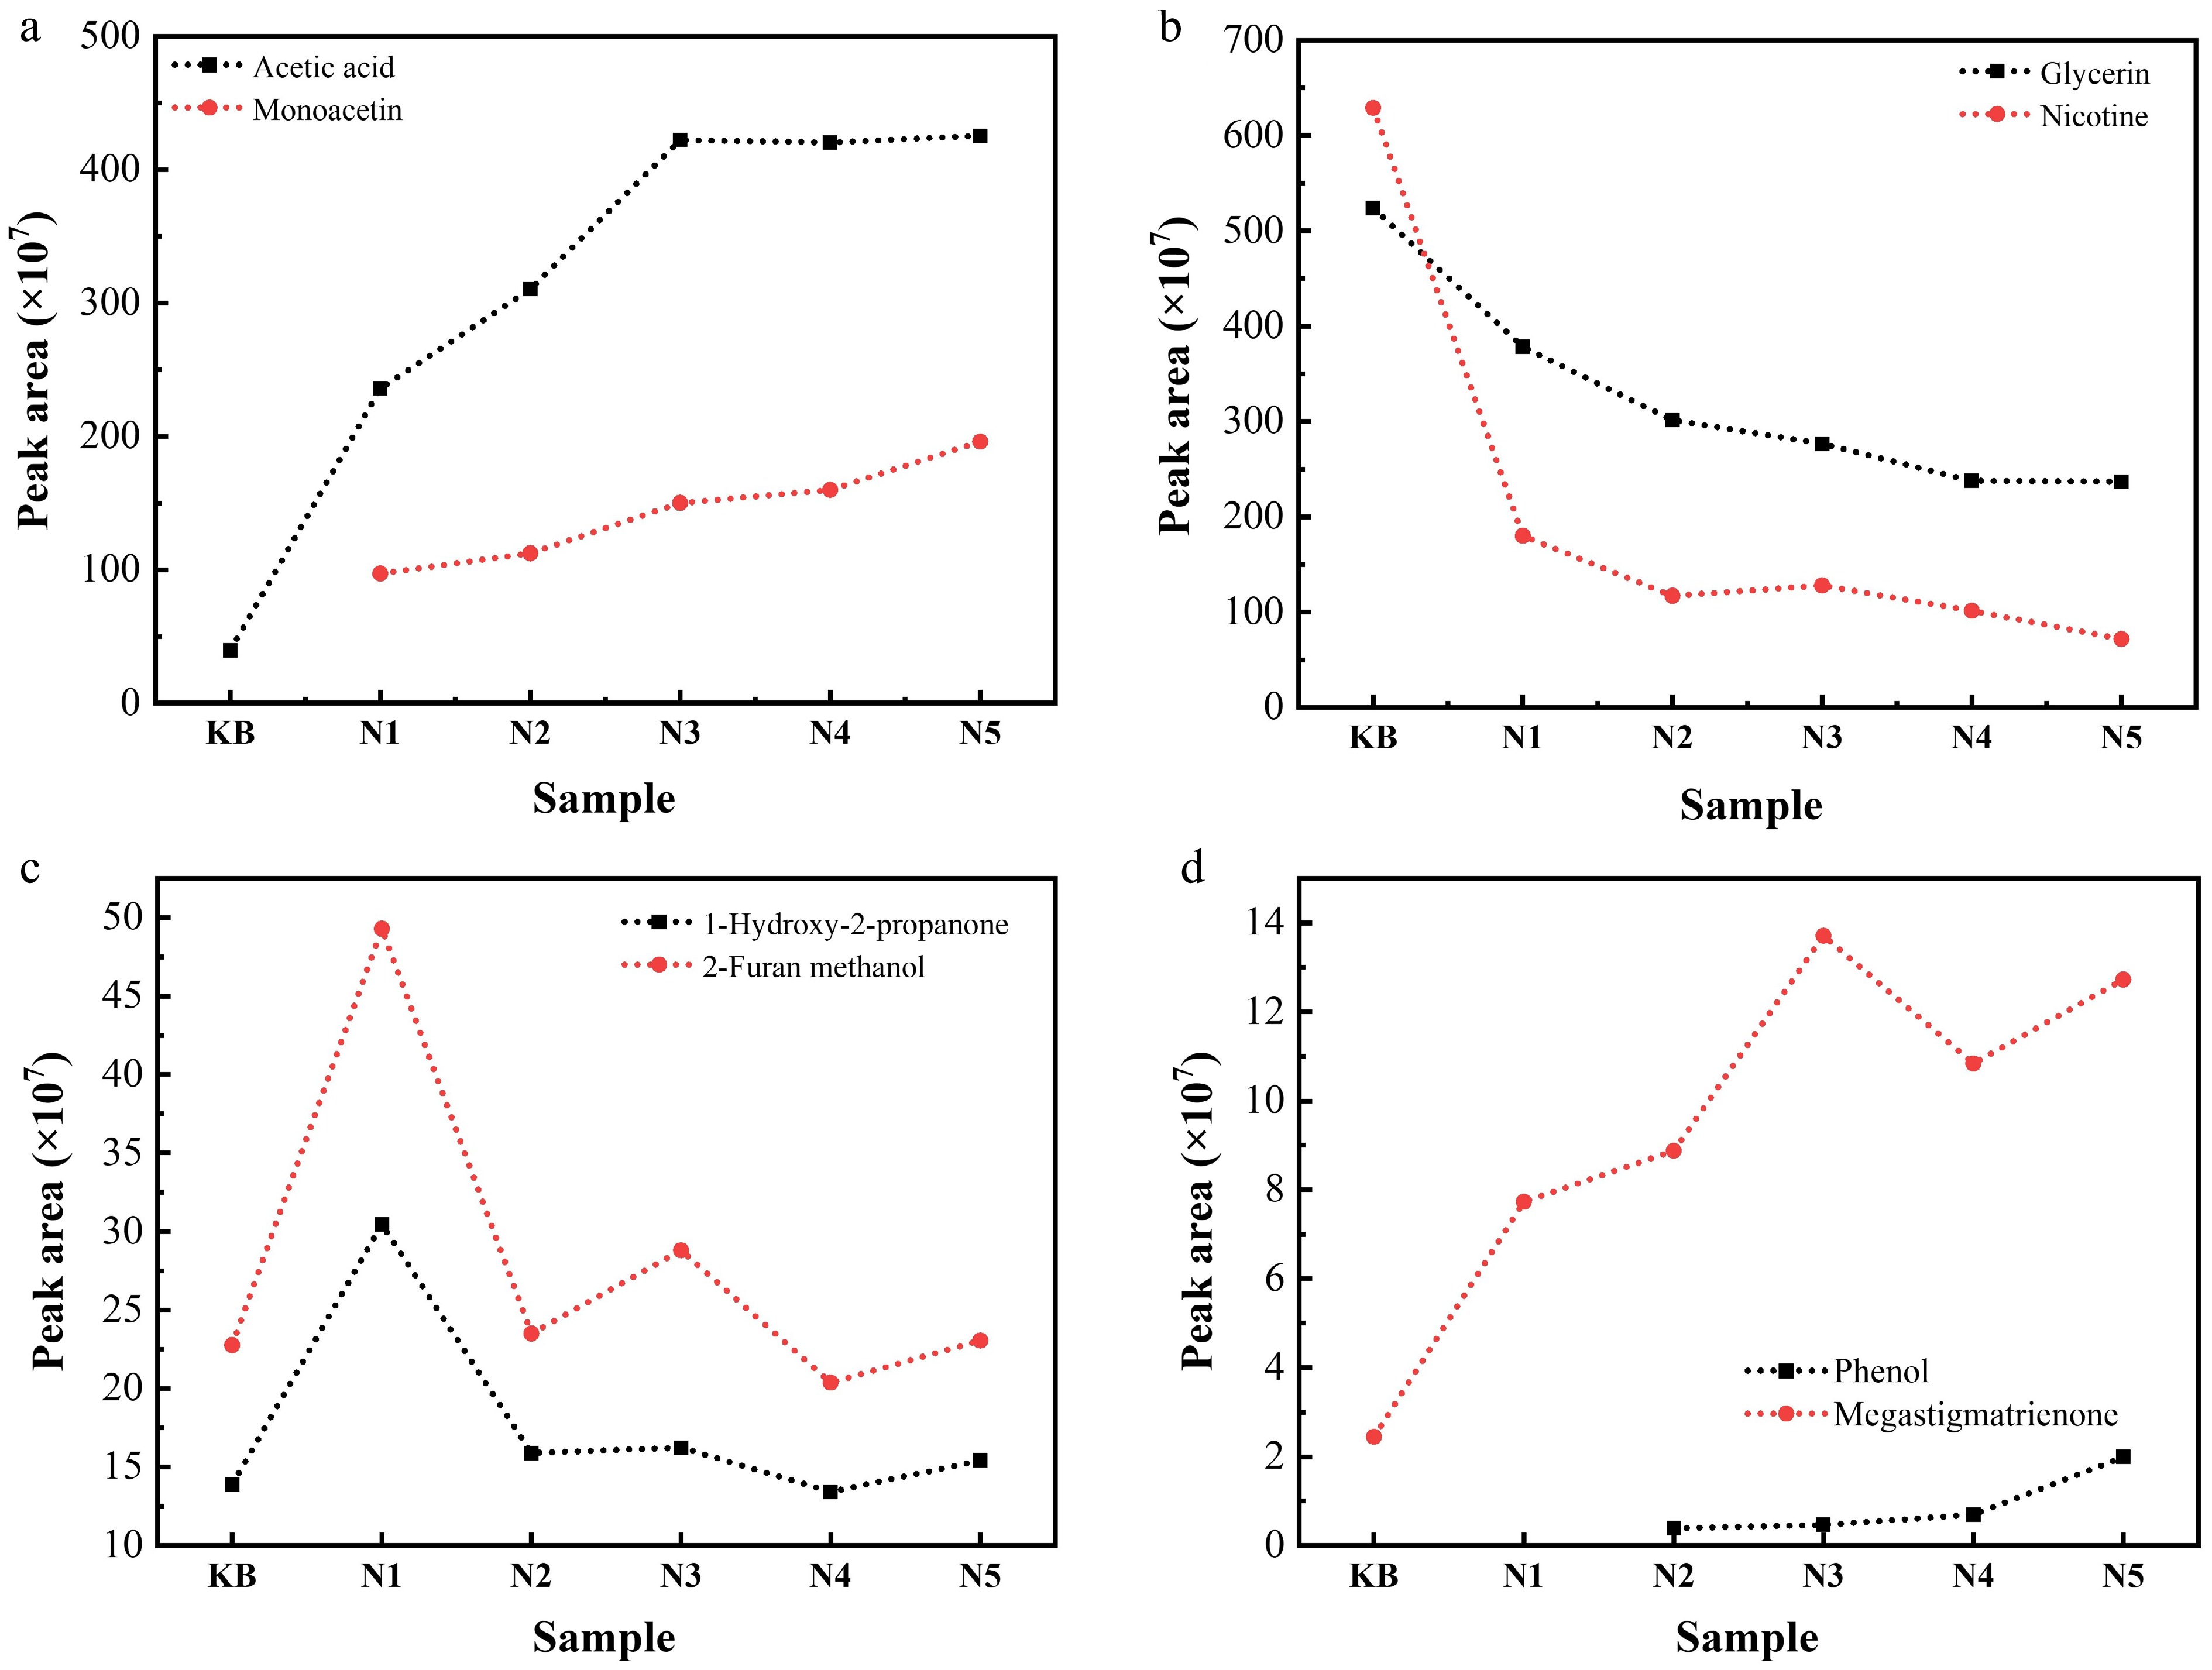
Figure 4.
Contents of (a) acetic acid and monoacetin, (b) glycerin and nicotine, (c) 1-hydroxy-2-propanone and 2-furan methanol, and (d) phenol and megastigmatrienone in the pyrolysis gas of reconstituted tobacco sheets with different amounts of added Na salt at 300 °C (semiquantitative results represented by the peak area measured via Py-GC/MS).
-
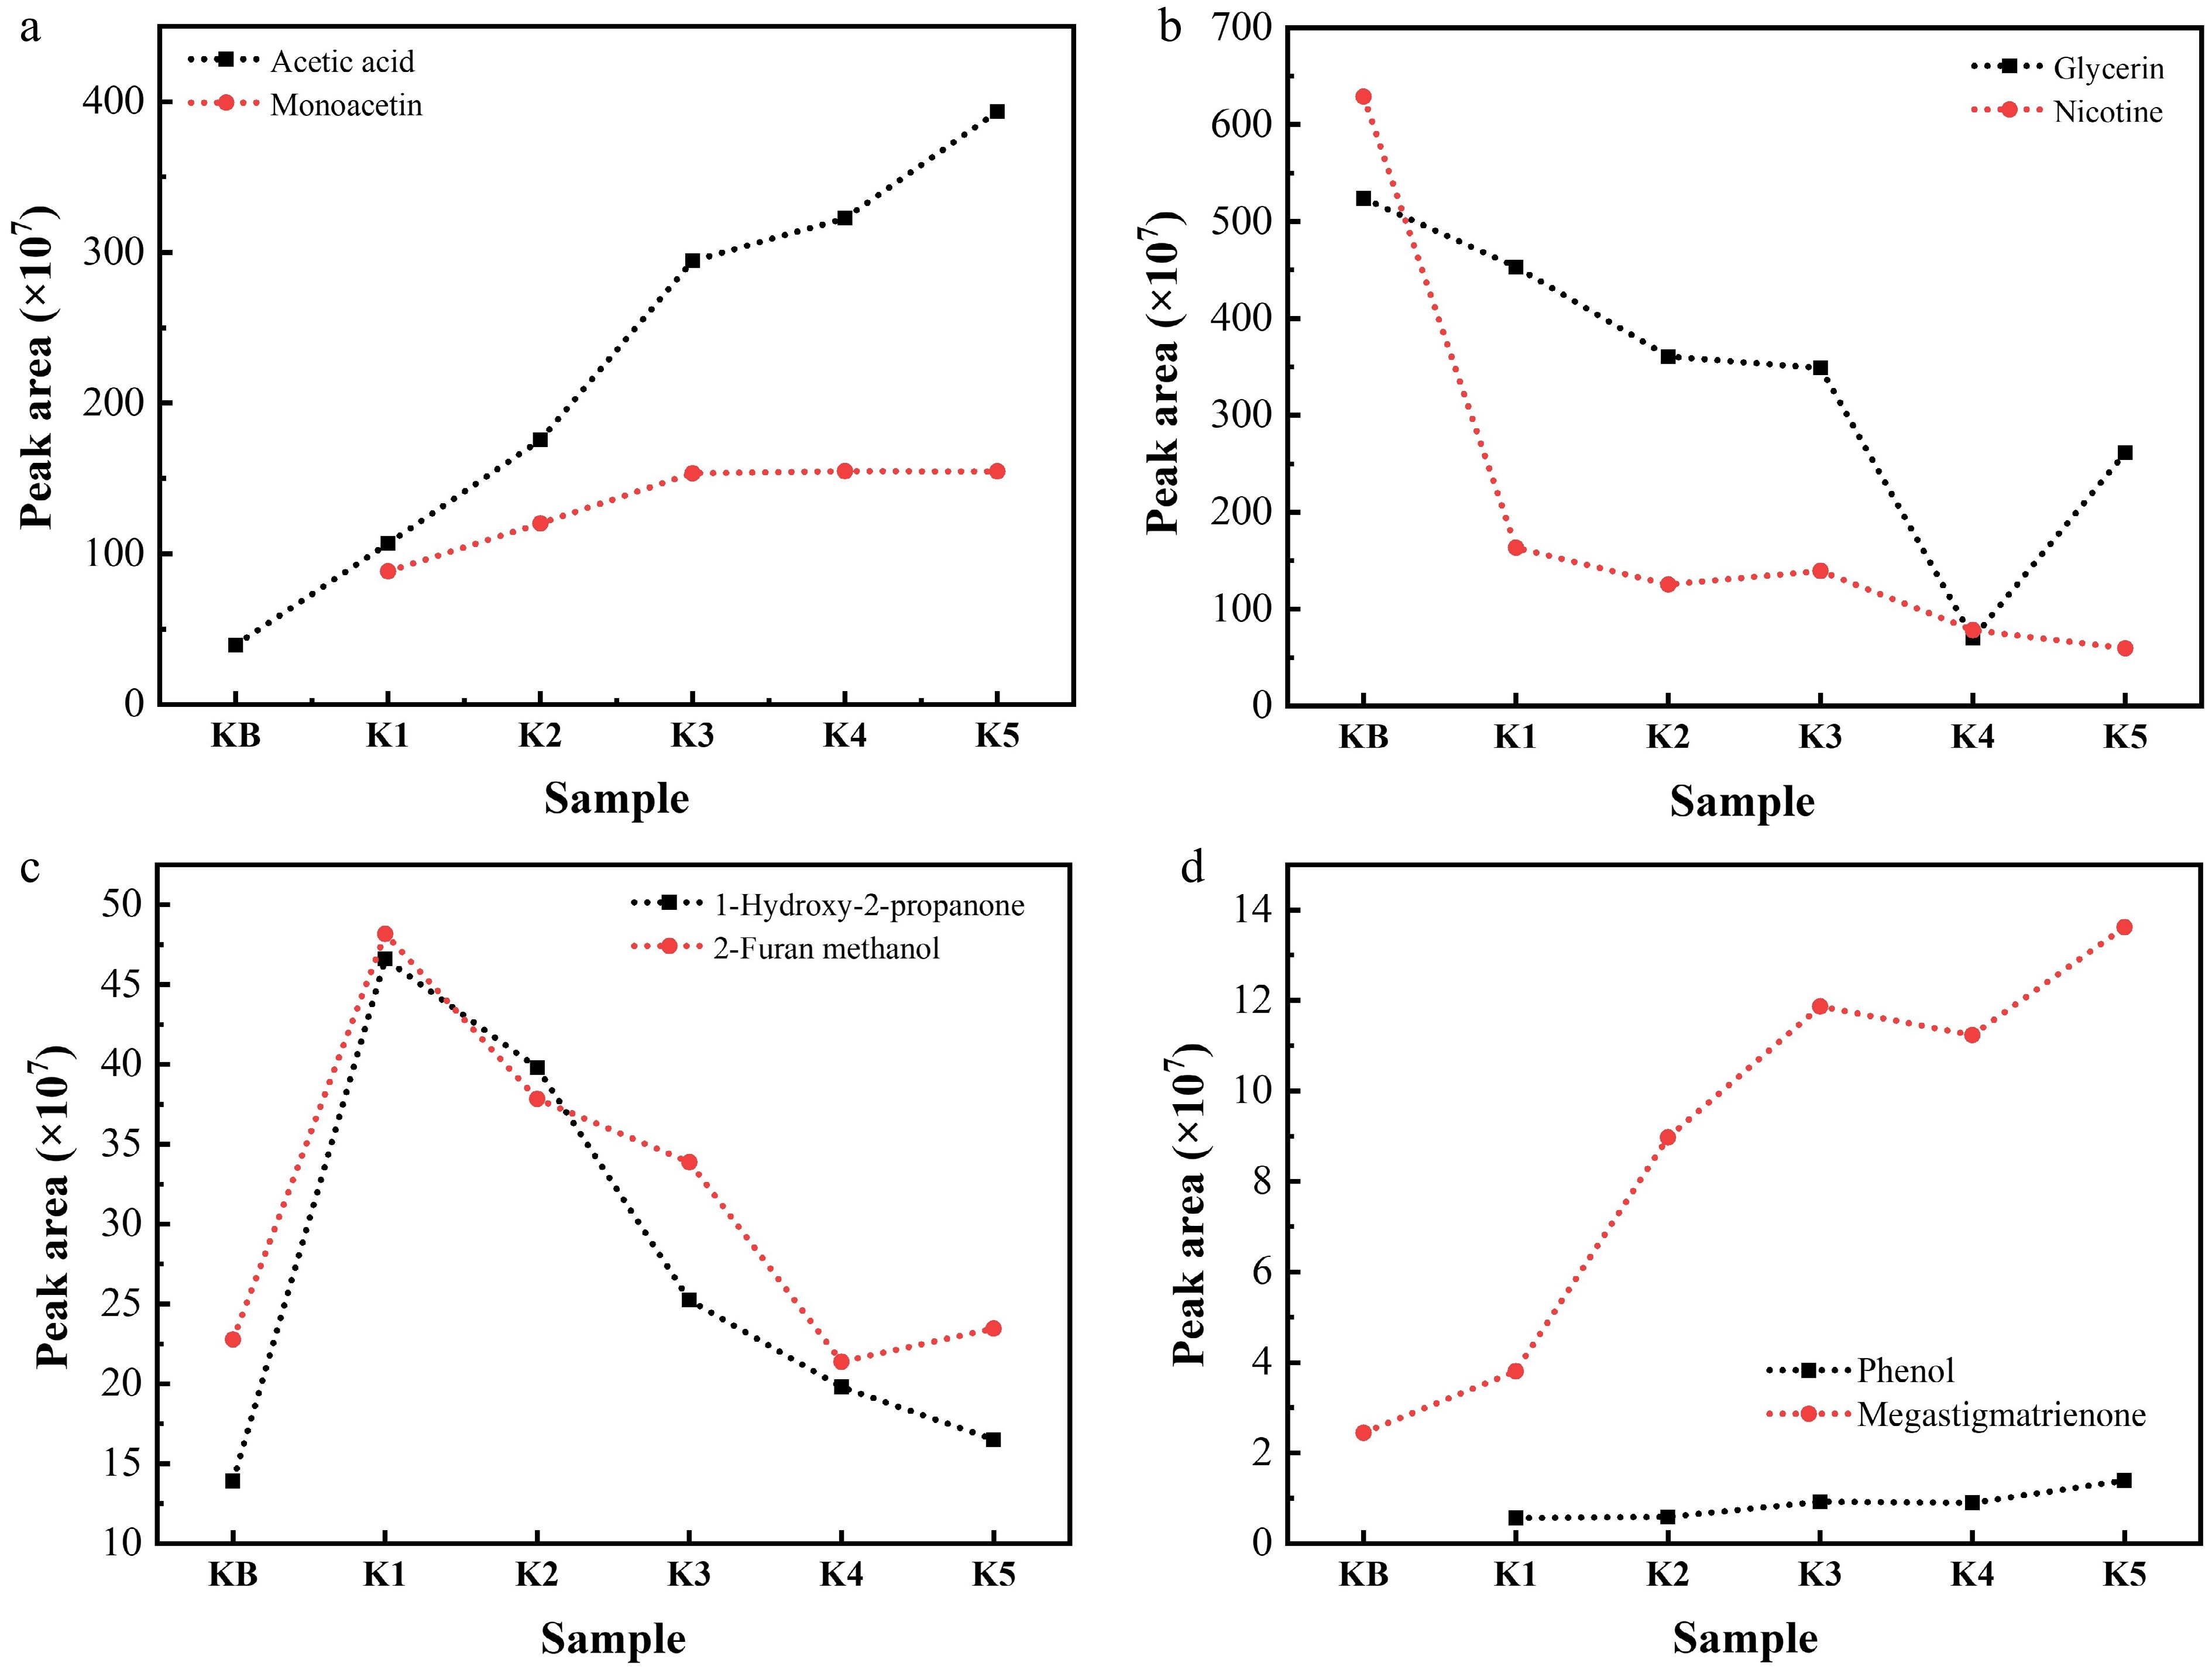
Figure 5.
Contents of (a) acetic acid and monoacetin, (b) glycerin and nicotine, (c) 1-hydroxy-2-propanone and 2-furan methanol, and (d) phenol and megastigmatrienone in the pyrolysis gas of reconstituted tobacco sheets with different amounts of added K salt at 300 °C (semiquantitative restults represented by the peak area measured via Py-GC/MS).
-
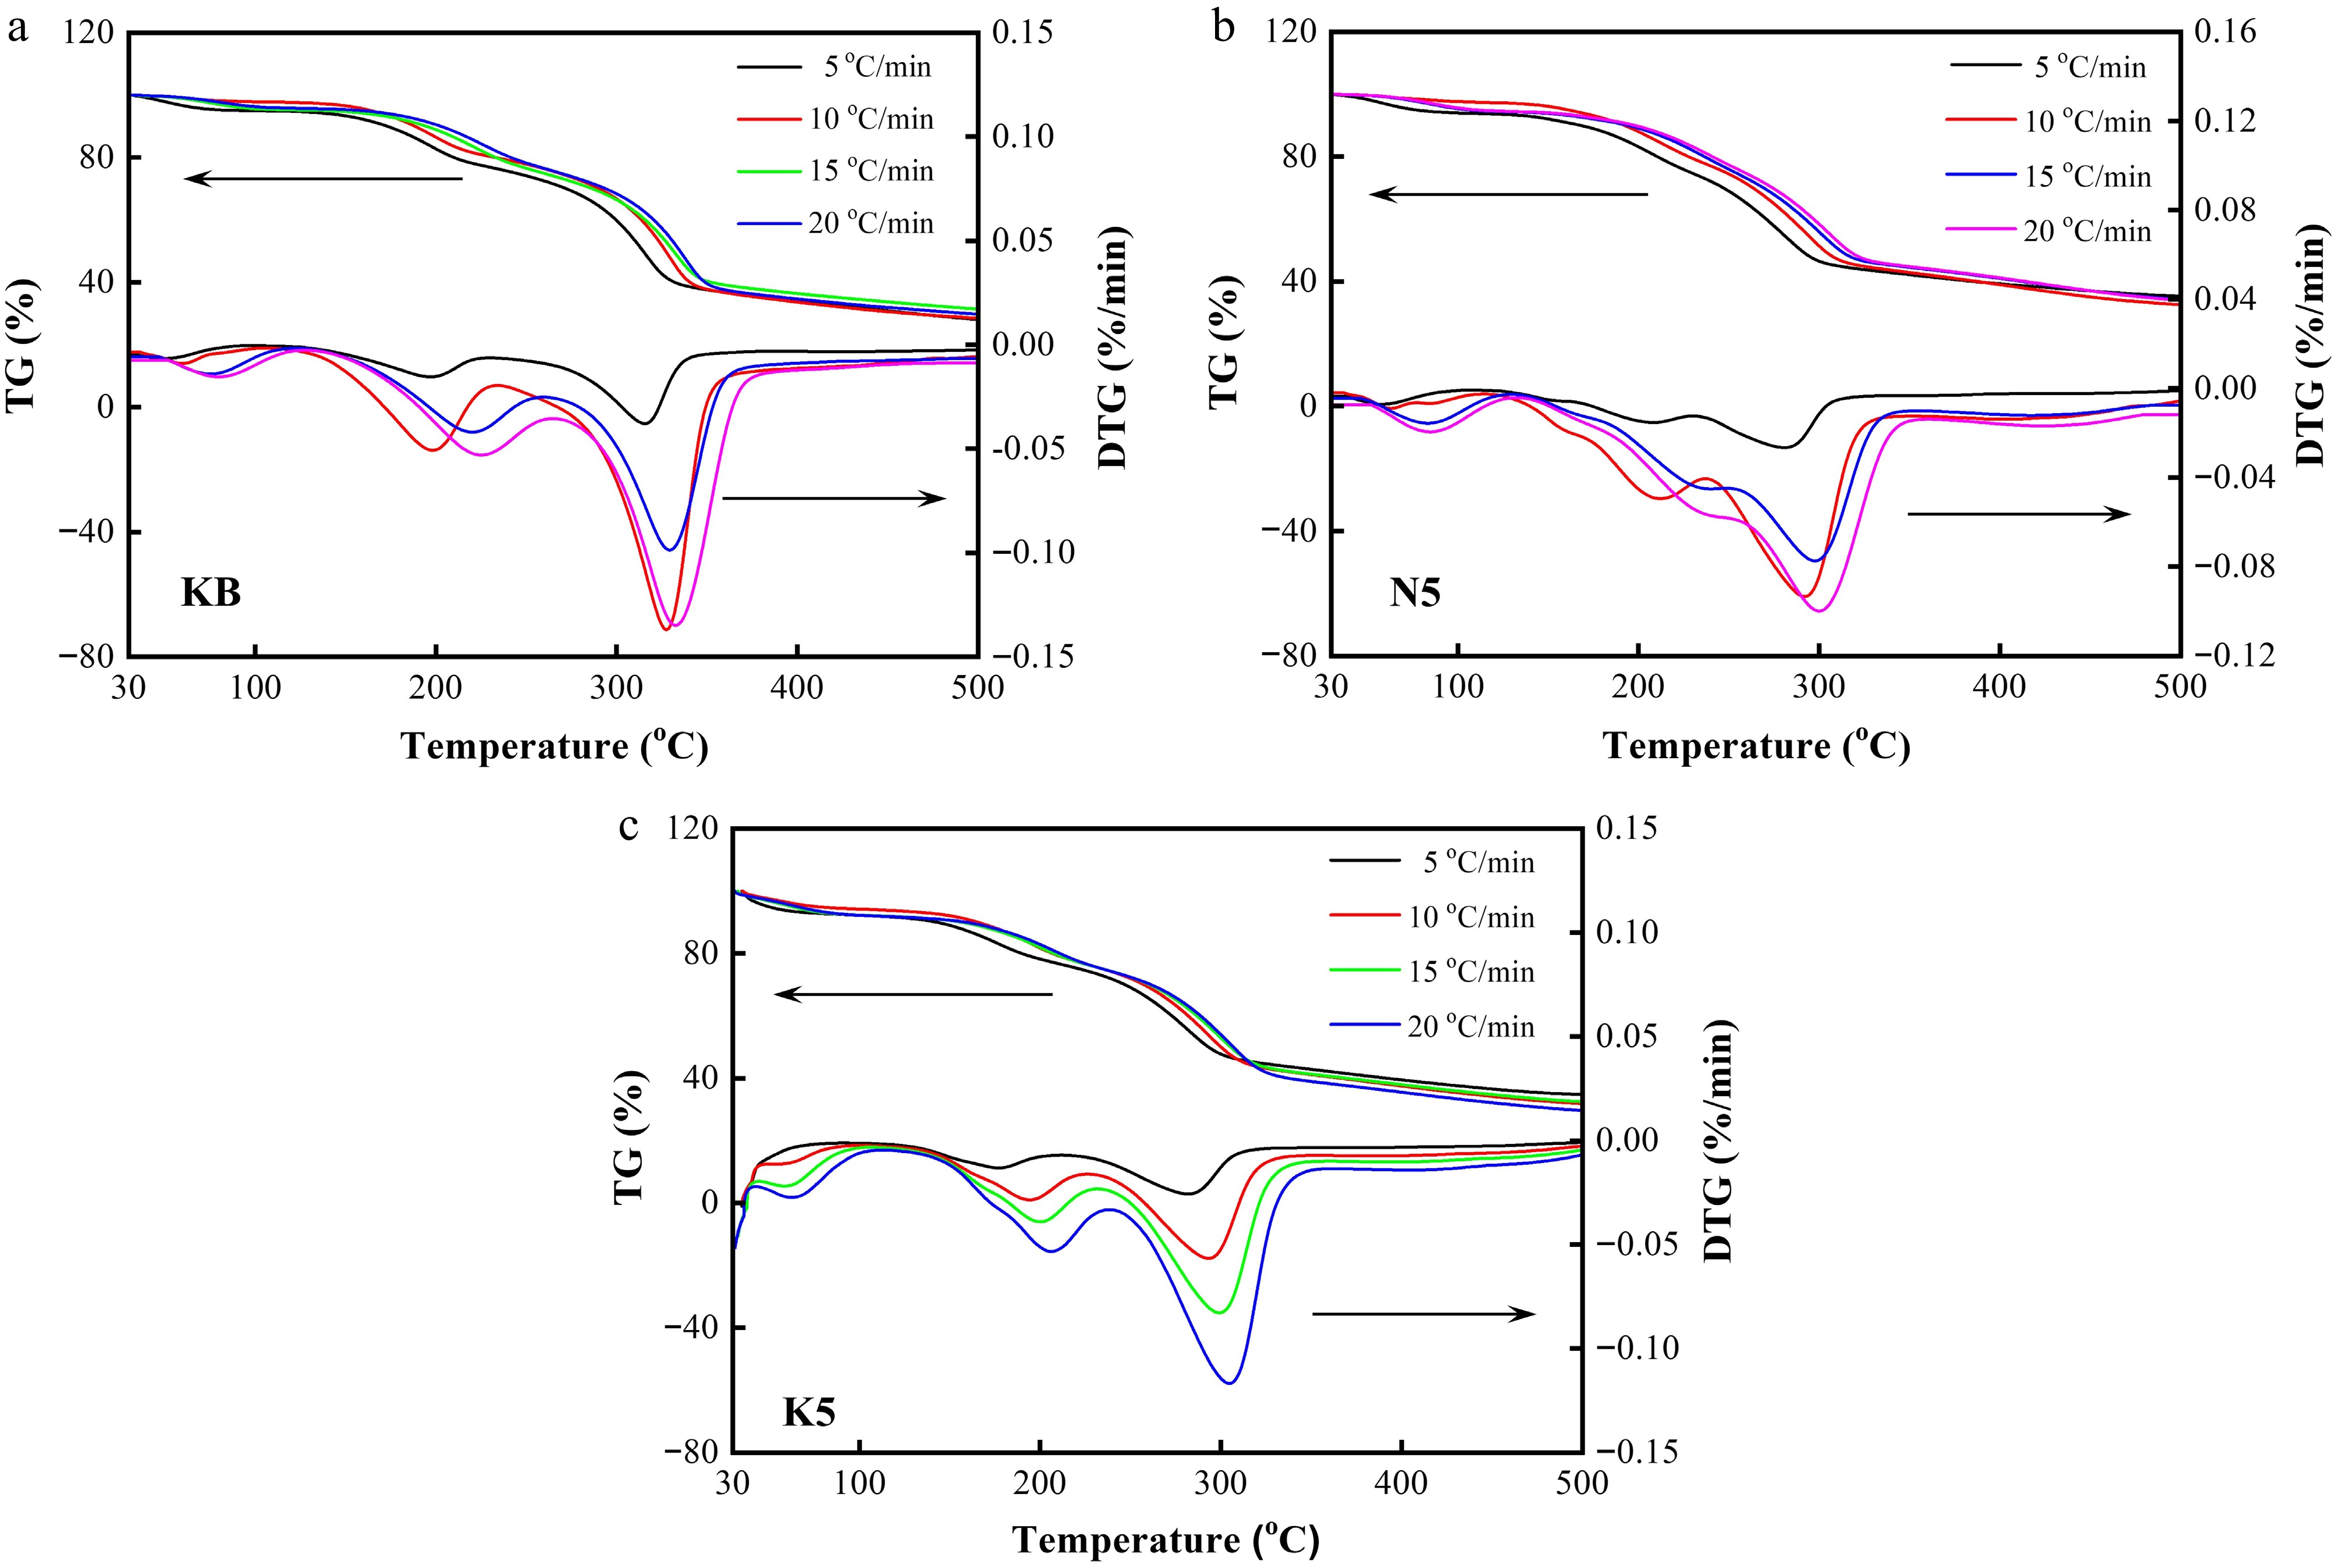
Figure 6.
TG and DTG curves of (a) the KB sample, (b) the N5 sample, and (c) the K5 sample under different heating rates (5, 10, 15, and 20 °C/min, respectively).
-
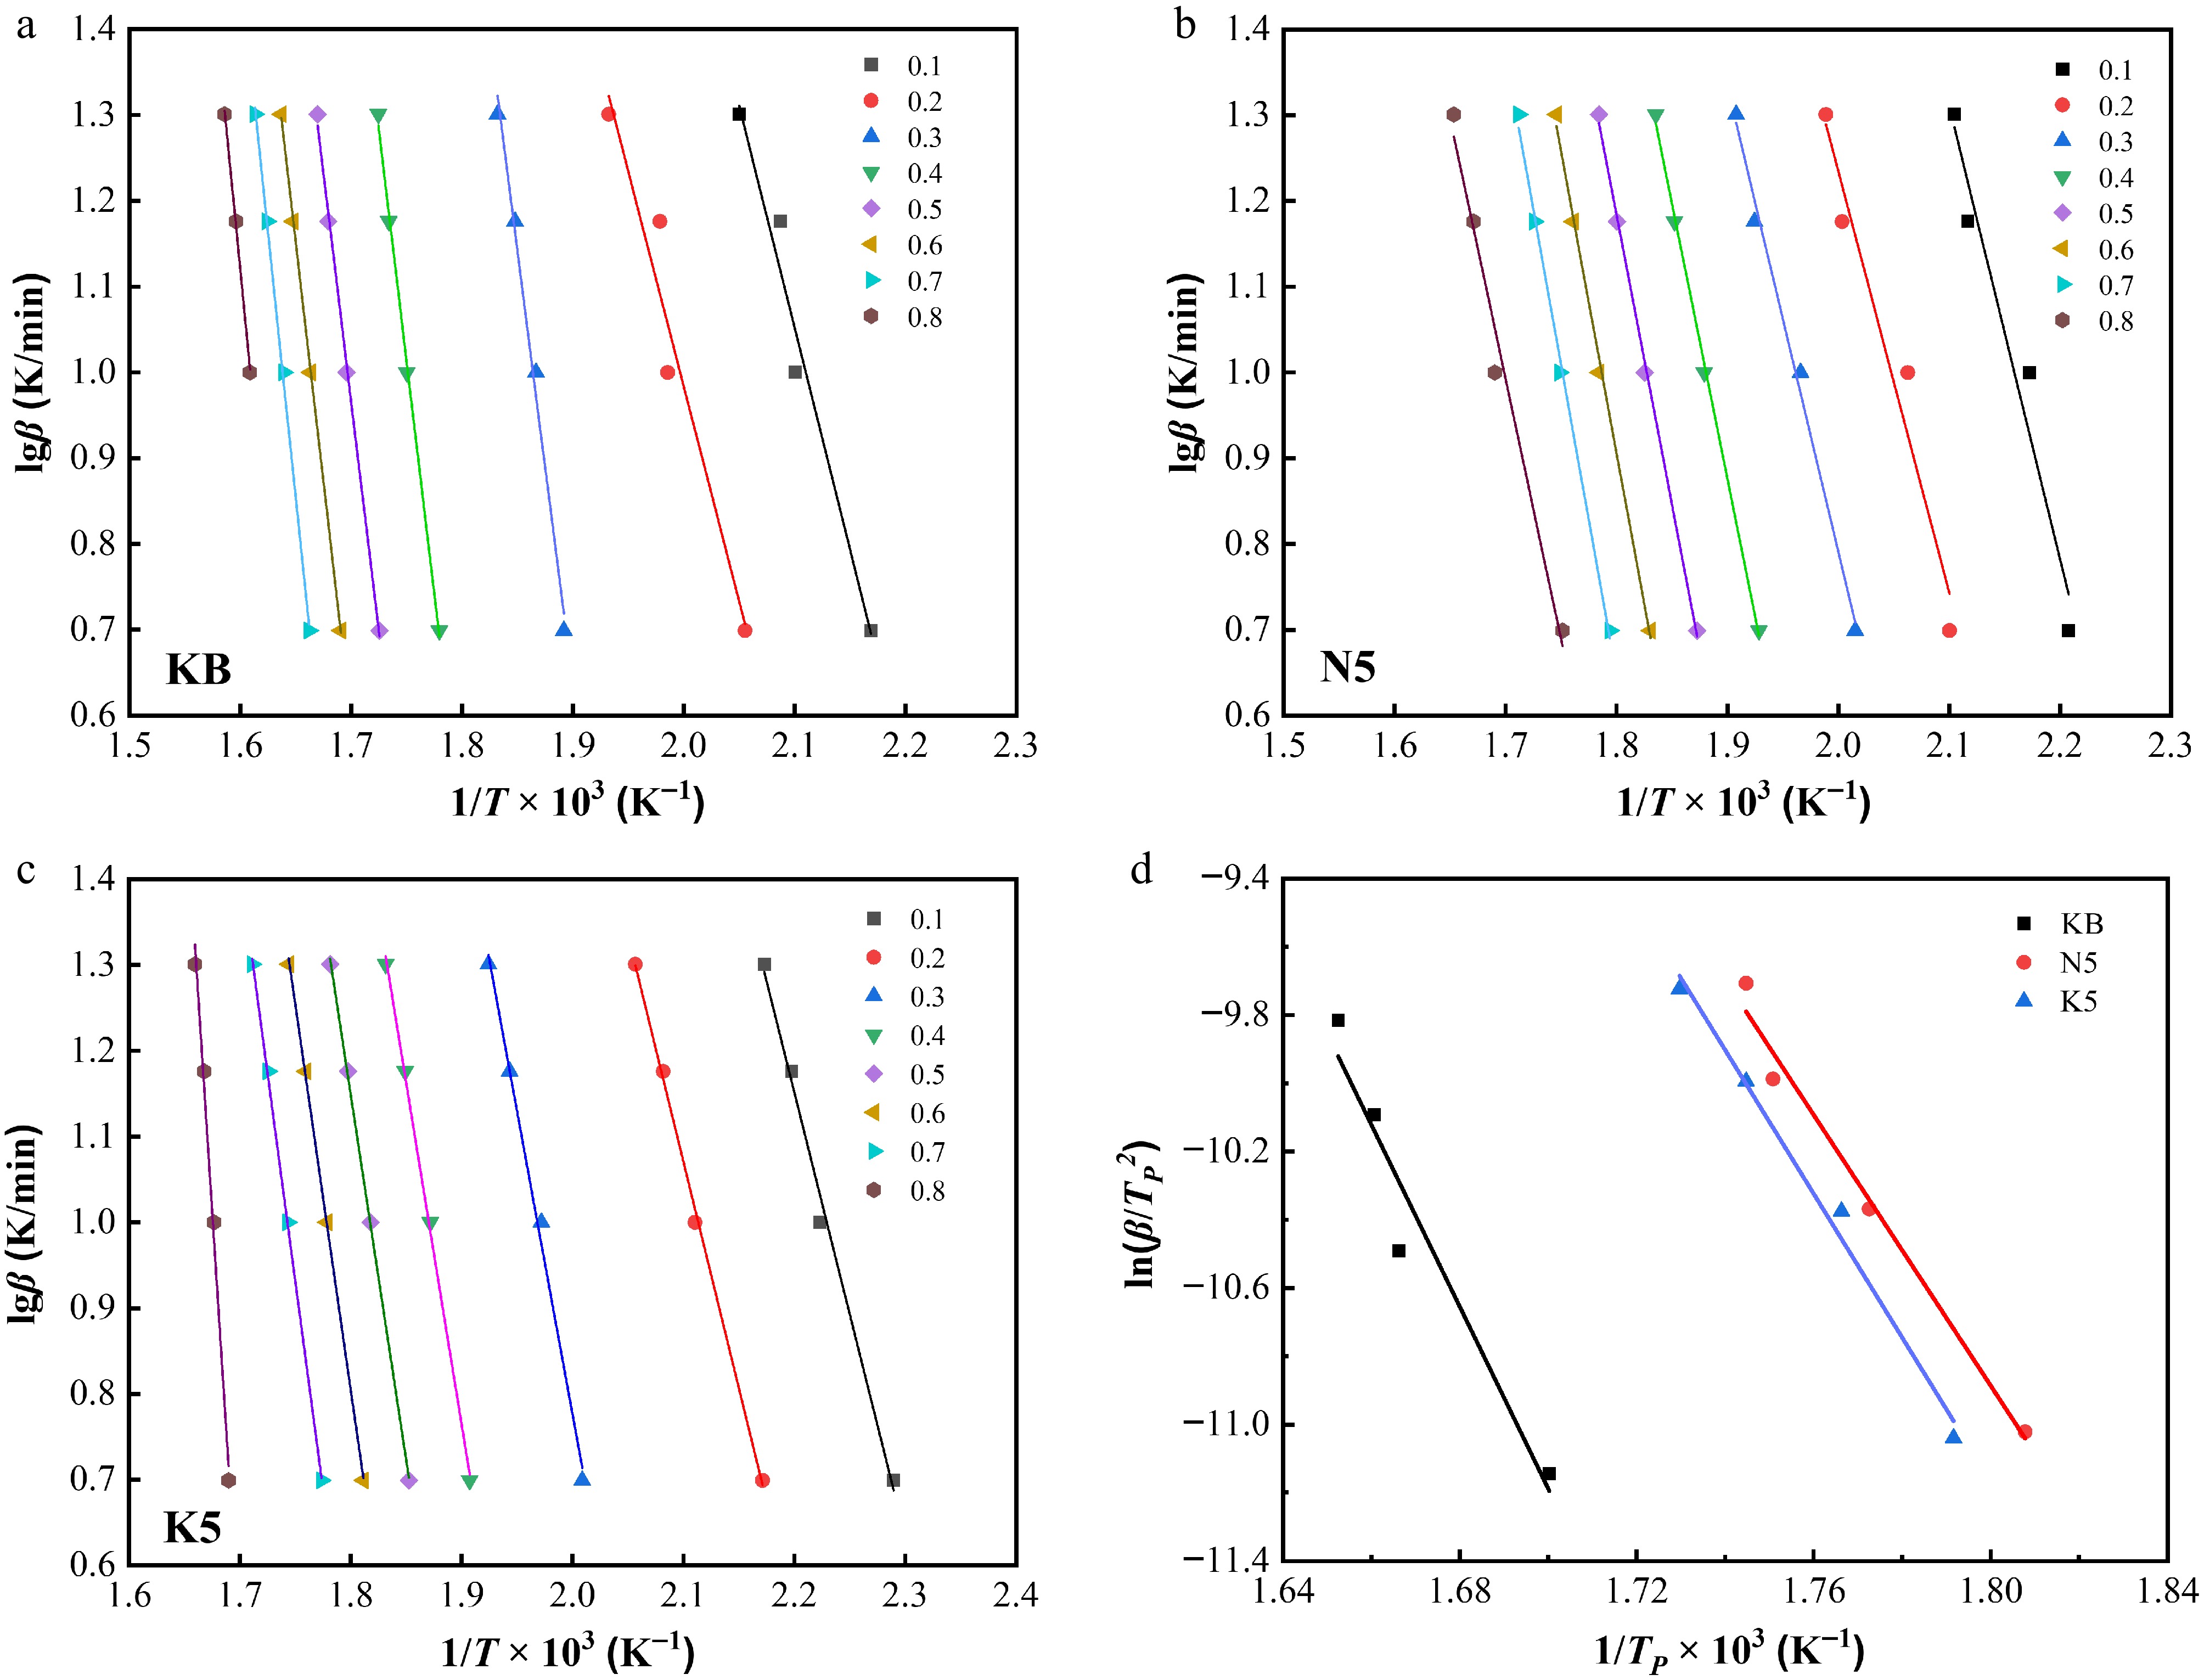
Figure 7.
Linear relationships between lgβ and 1/T × 103 at different conversion ratios (α) for (a) the KB sample, (b) the N5 sample, and (c) the K5 sample. (d) Linear relationships between ln(β/TP2) and 1/TP × 103 for the KB sample, the N5 sample, and the K5 sample.
-
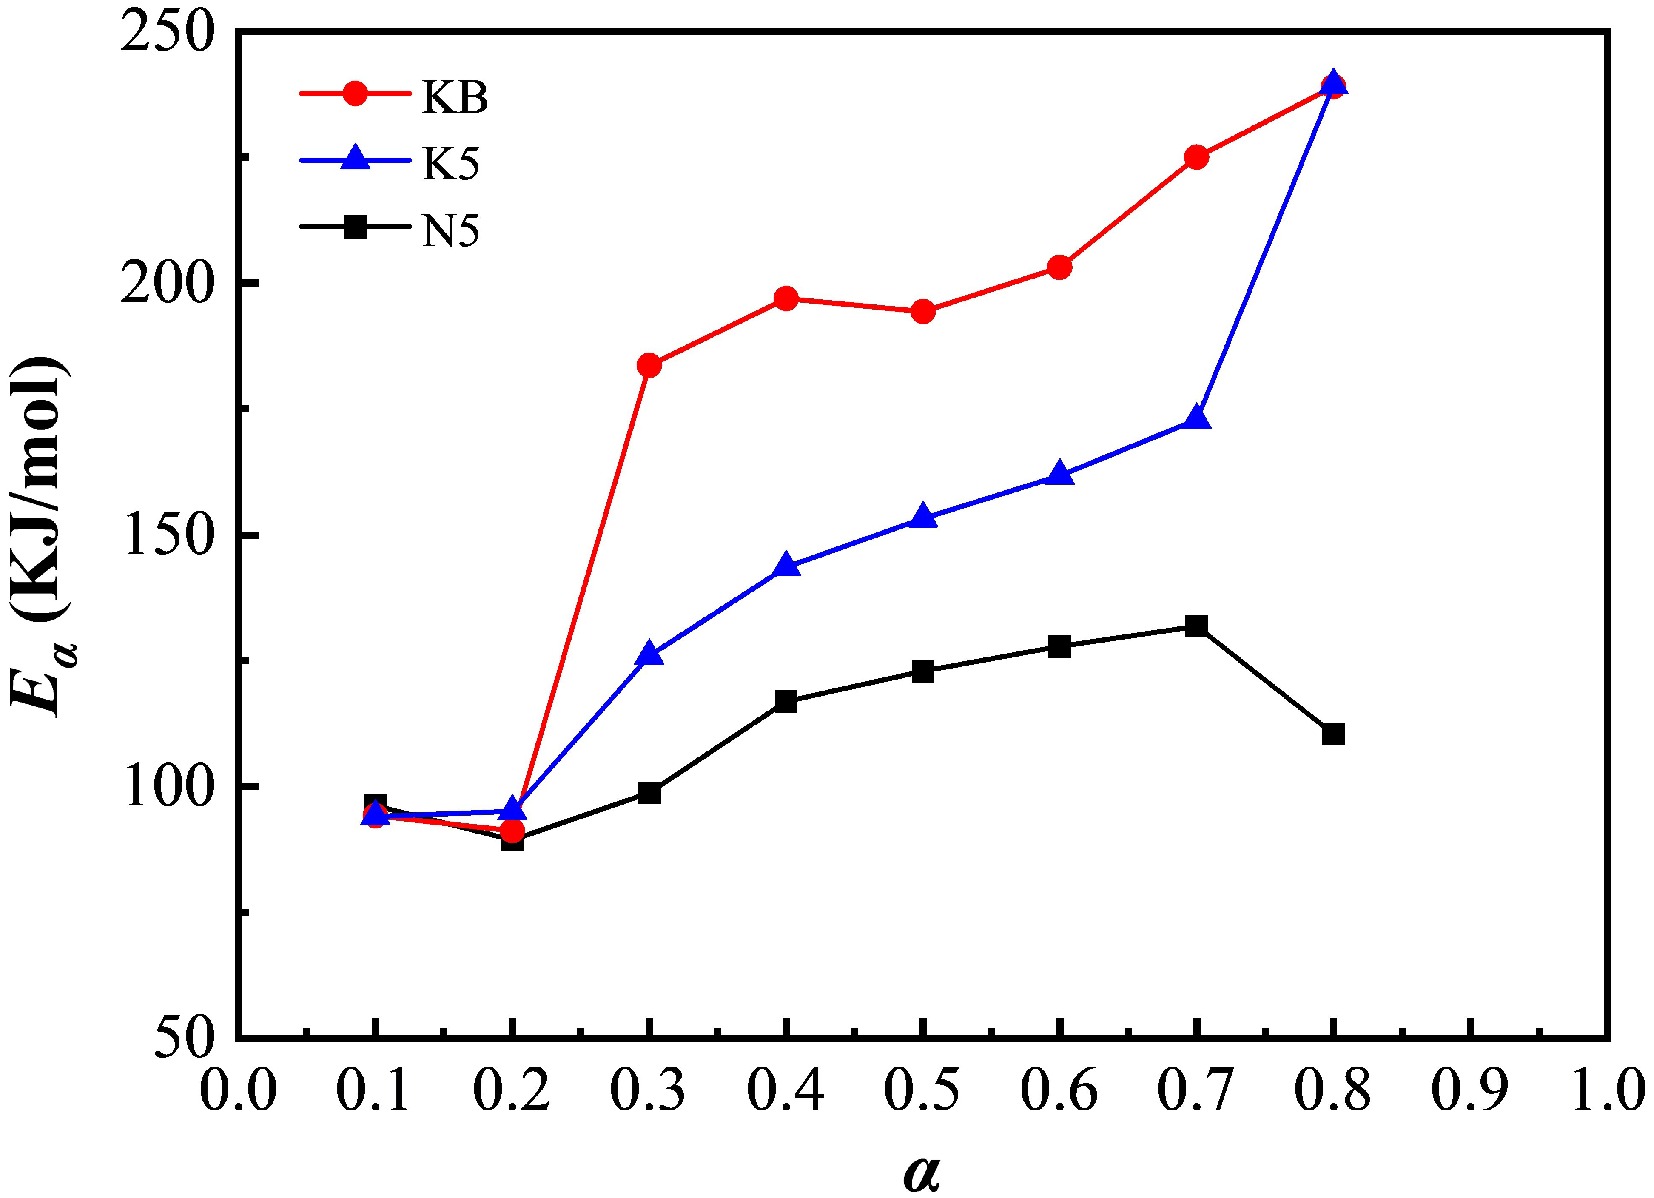
Figure 8.
Eα for the pyrolysis of reconstituted tobacco sheets (KB, K5, N5) at different conversion ratios (α).
-
α KB N5 K5 Eα/(kJ·mol−1) R2 Eα/(kJ·mol−1) R2 Eα/(kJ·mol−1) R2 0.1 94.17 0.96 96.21 0.93 94.08 0.99 0.2 91.21 0.92 89.41 0.93 95.08 0.99 0.3 183.64 0.99 98.74 0.99 126.00 0.99 0.4 196.93 0.99 116.92 0.99 143.59 0.99 0.5 194.36 0.99 122.95 0.99 153.25 0.99 0.6 203.14 0.99 127.86 0.99 161.73 0.99 0.7 224.98 0.99 131.85 0.99 172.86 0.99 0.8 238.99 0.99 110.38 0.97 239.92 0.99 Table 1.
Kinetic parameters and squared correlation coefficients of the FWO method for the pyrolysis of the blank sample and the Na salt-doped and K salt-doped samples.
Figures
(8)
Tables
(1)