-
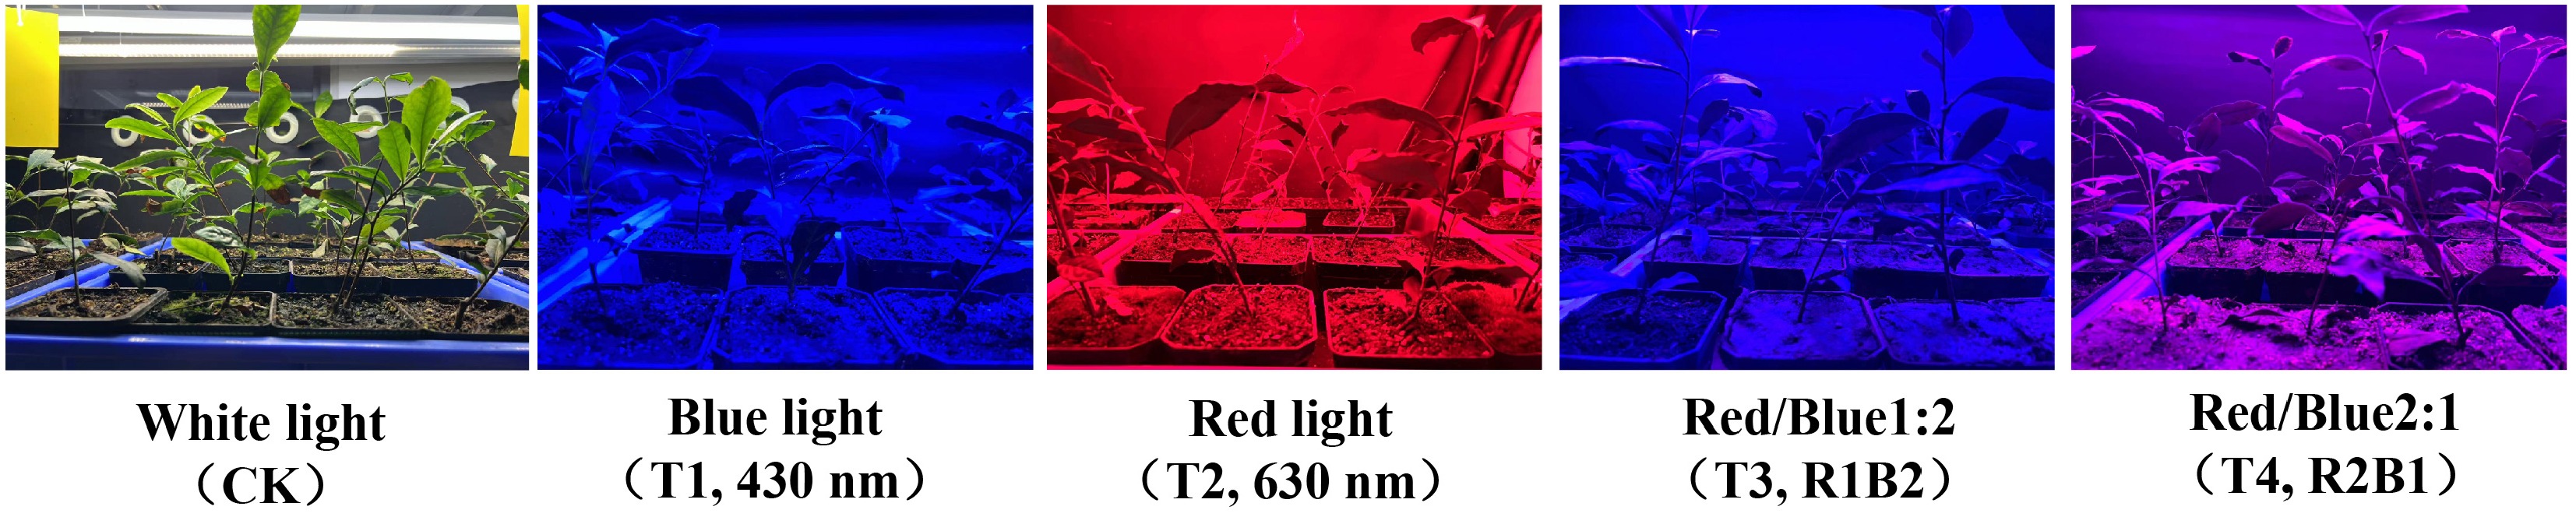
Figure 1.
Tea seedlings illuminated by LED light.
-
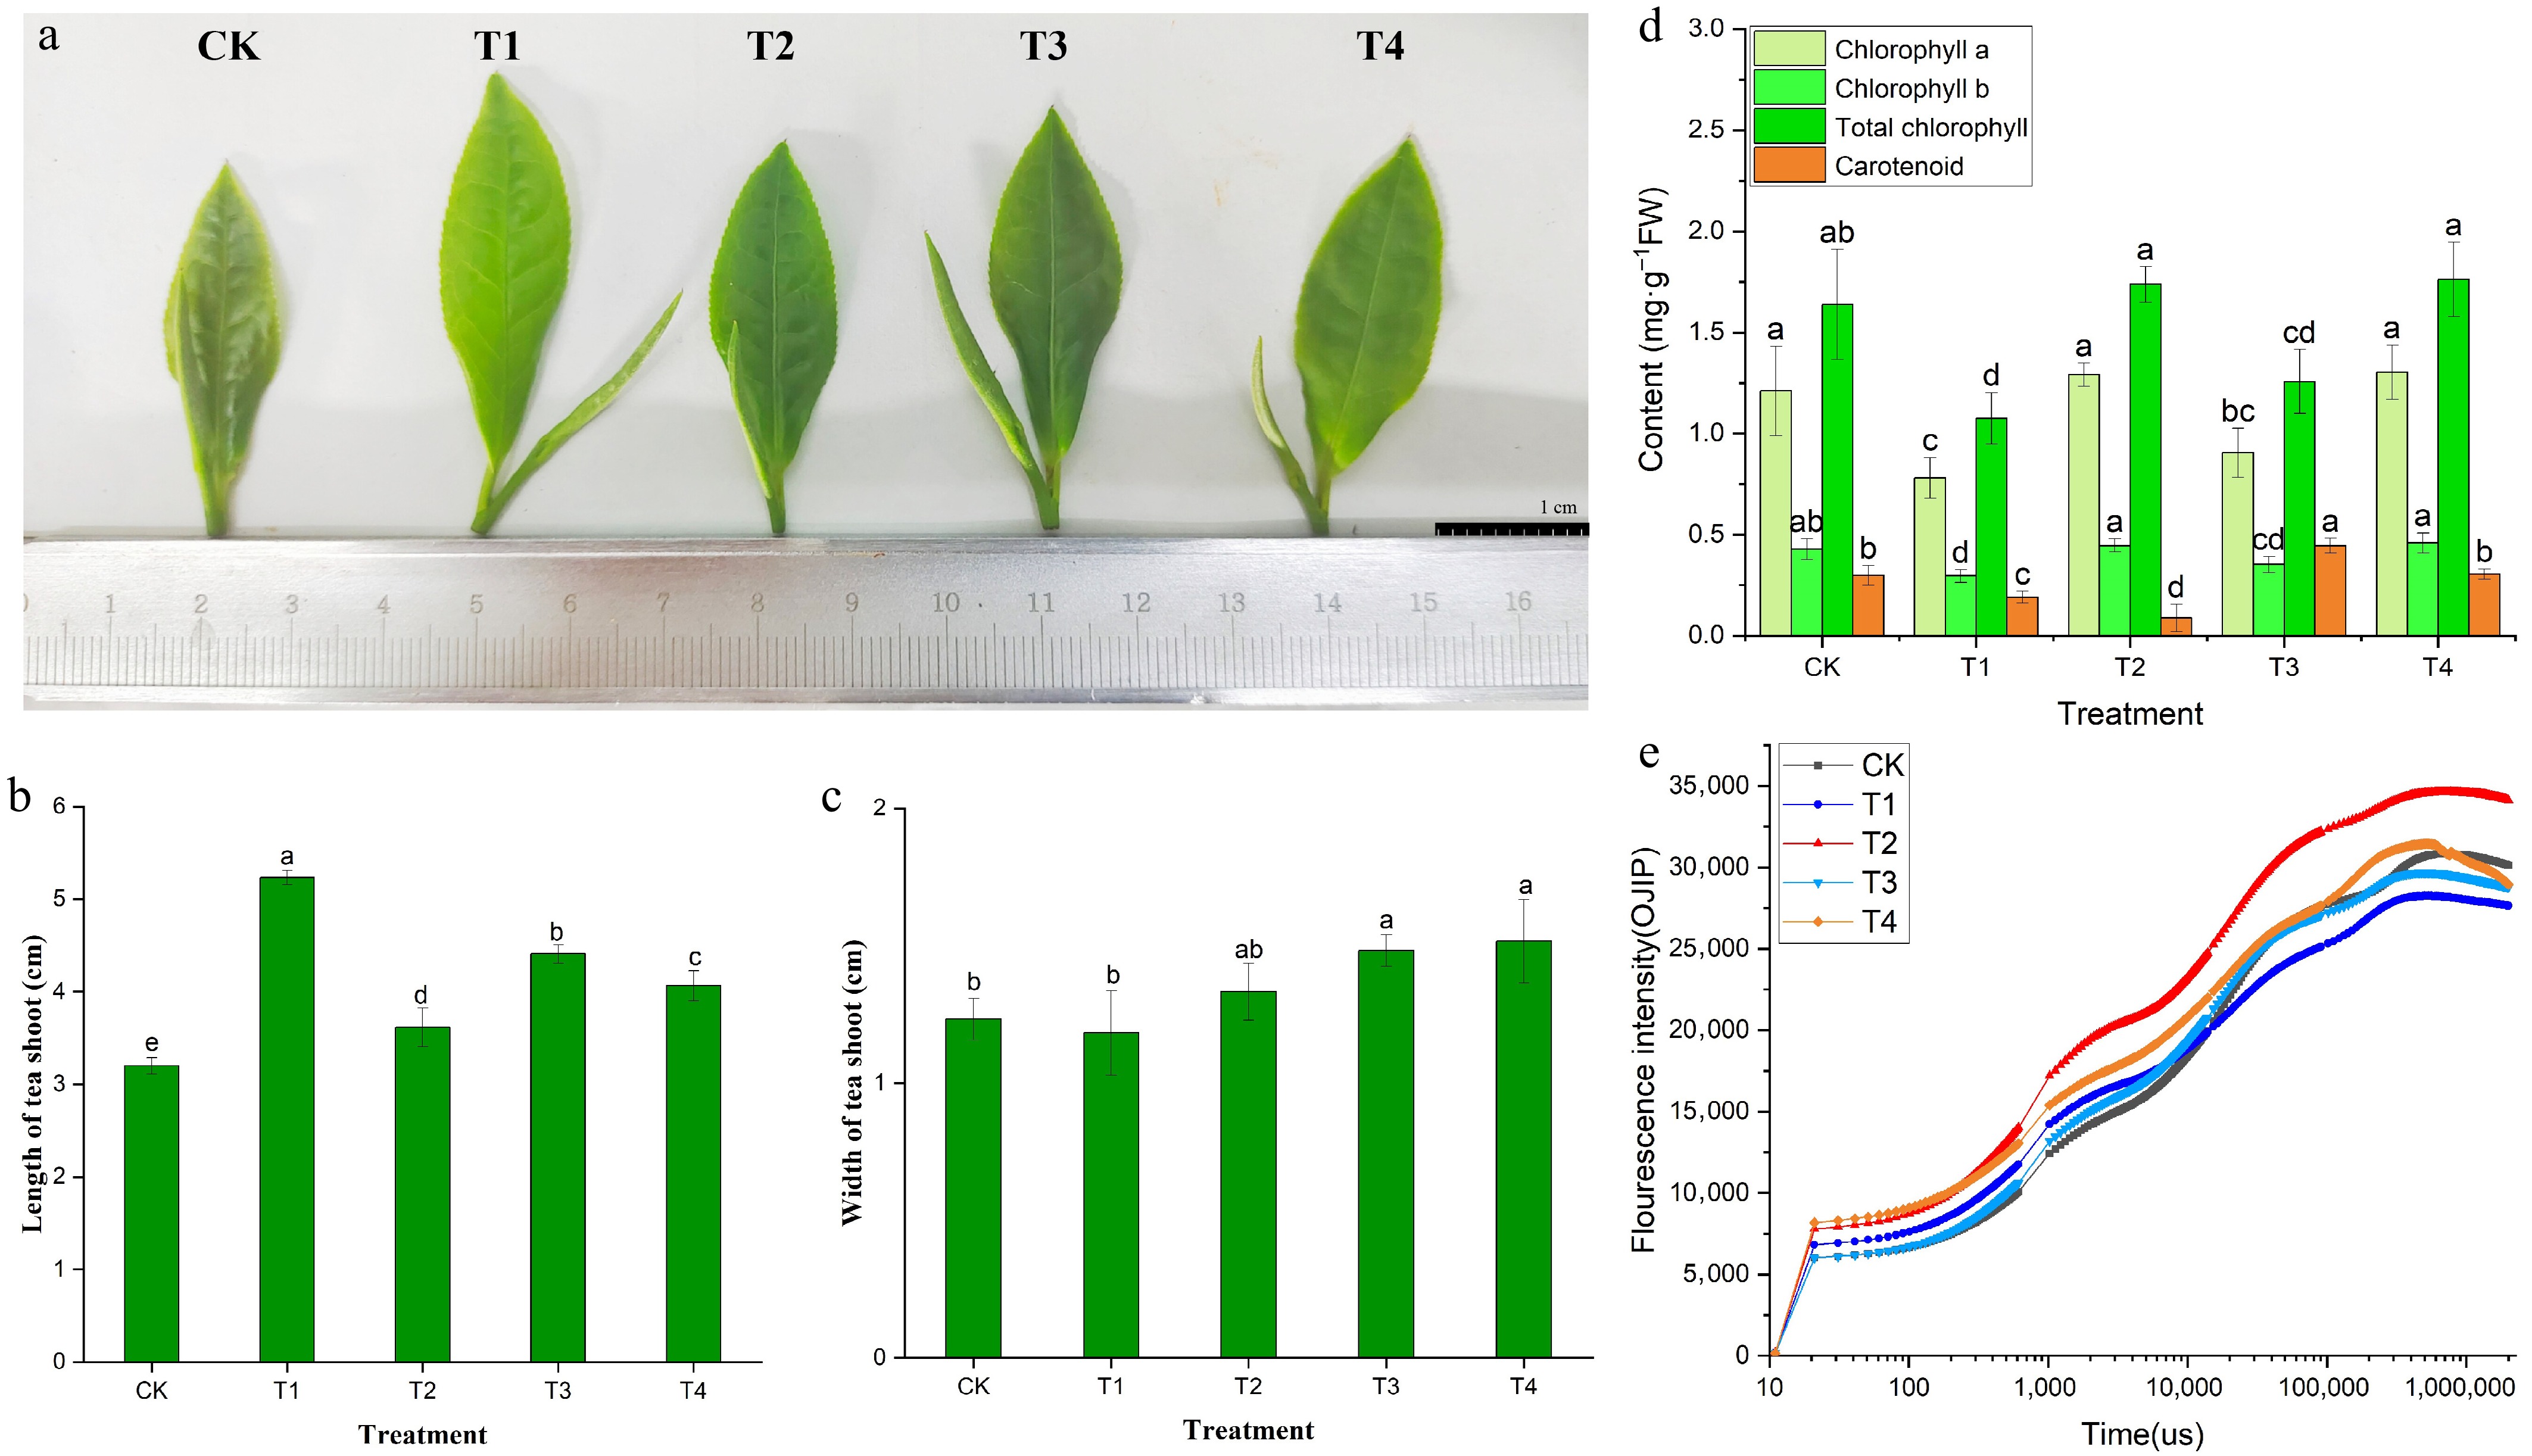
Figure 2.
Leaf color phenotype (a), bud growth (b, c), photosynthetic pigment content (d), and OJIP curve (e) of BJHJC leaves under different light treatments. Different letters represent significant differences between groups (p < 0.05).
-
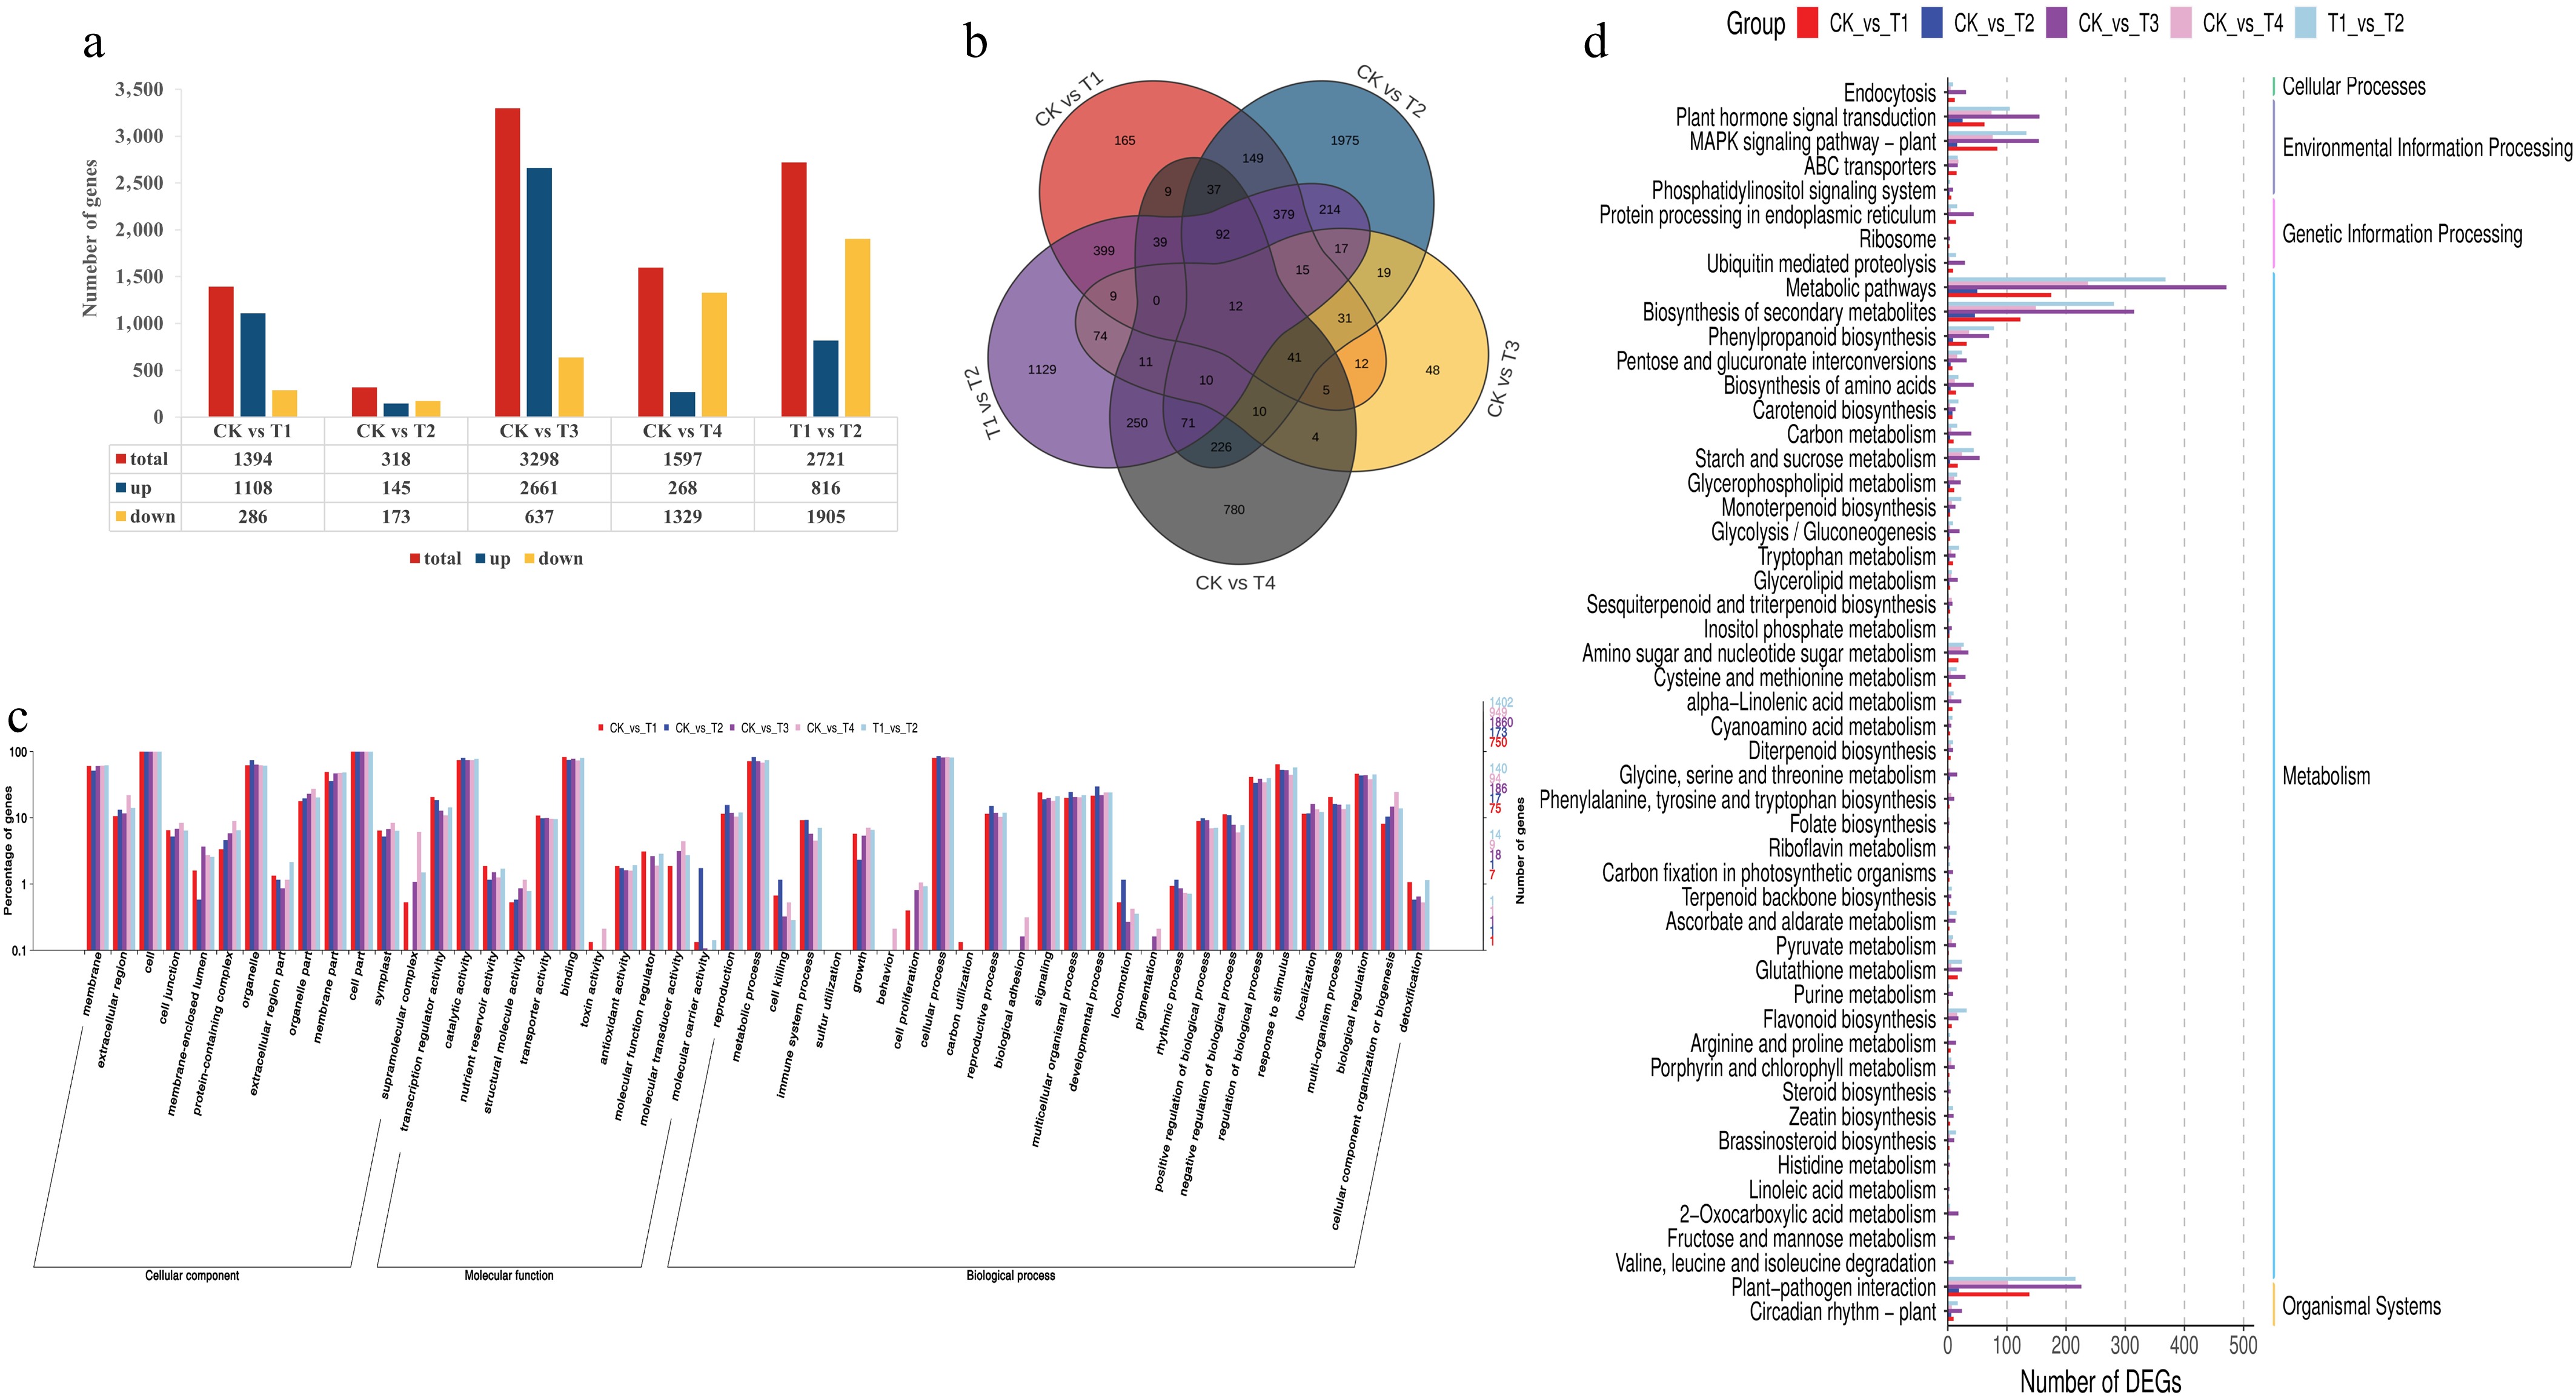
Figure 3.
Functional annotation results of the differentially expressed genes in the blue, red, and red/blue light treatments compared with the control (white). The number of DEGs (a) and a Venn diagram showing the shared and common DEGs (b) for all light treatments. Annotation information obtained from the GO database (c) and functional classification of DEGs according to the KEGG dataset (d).
-
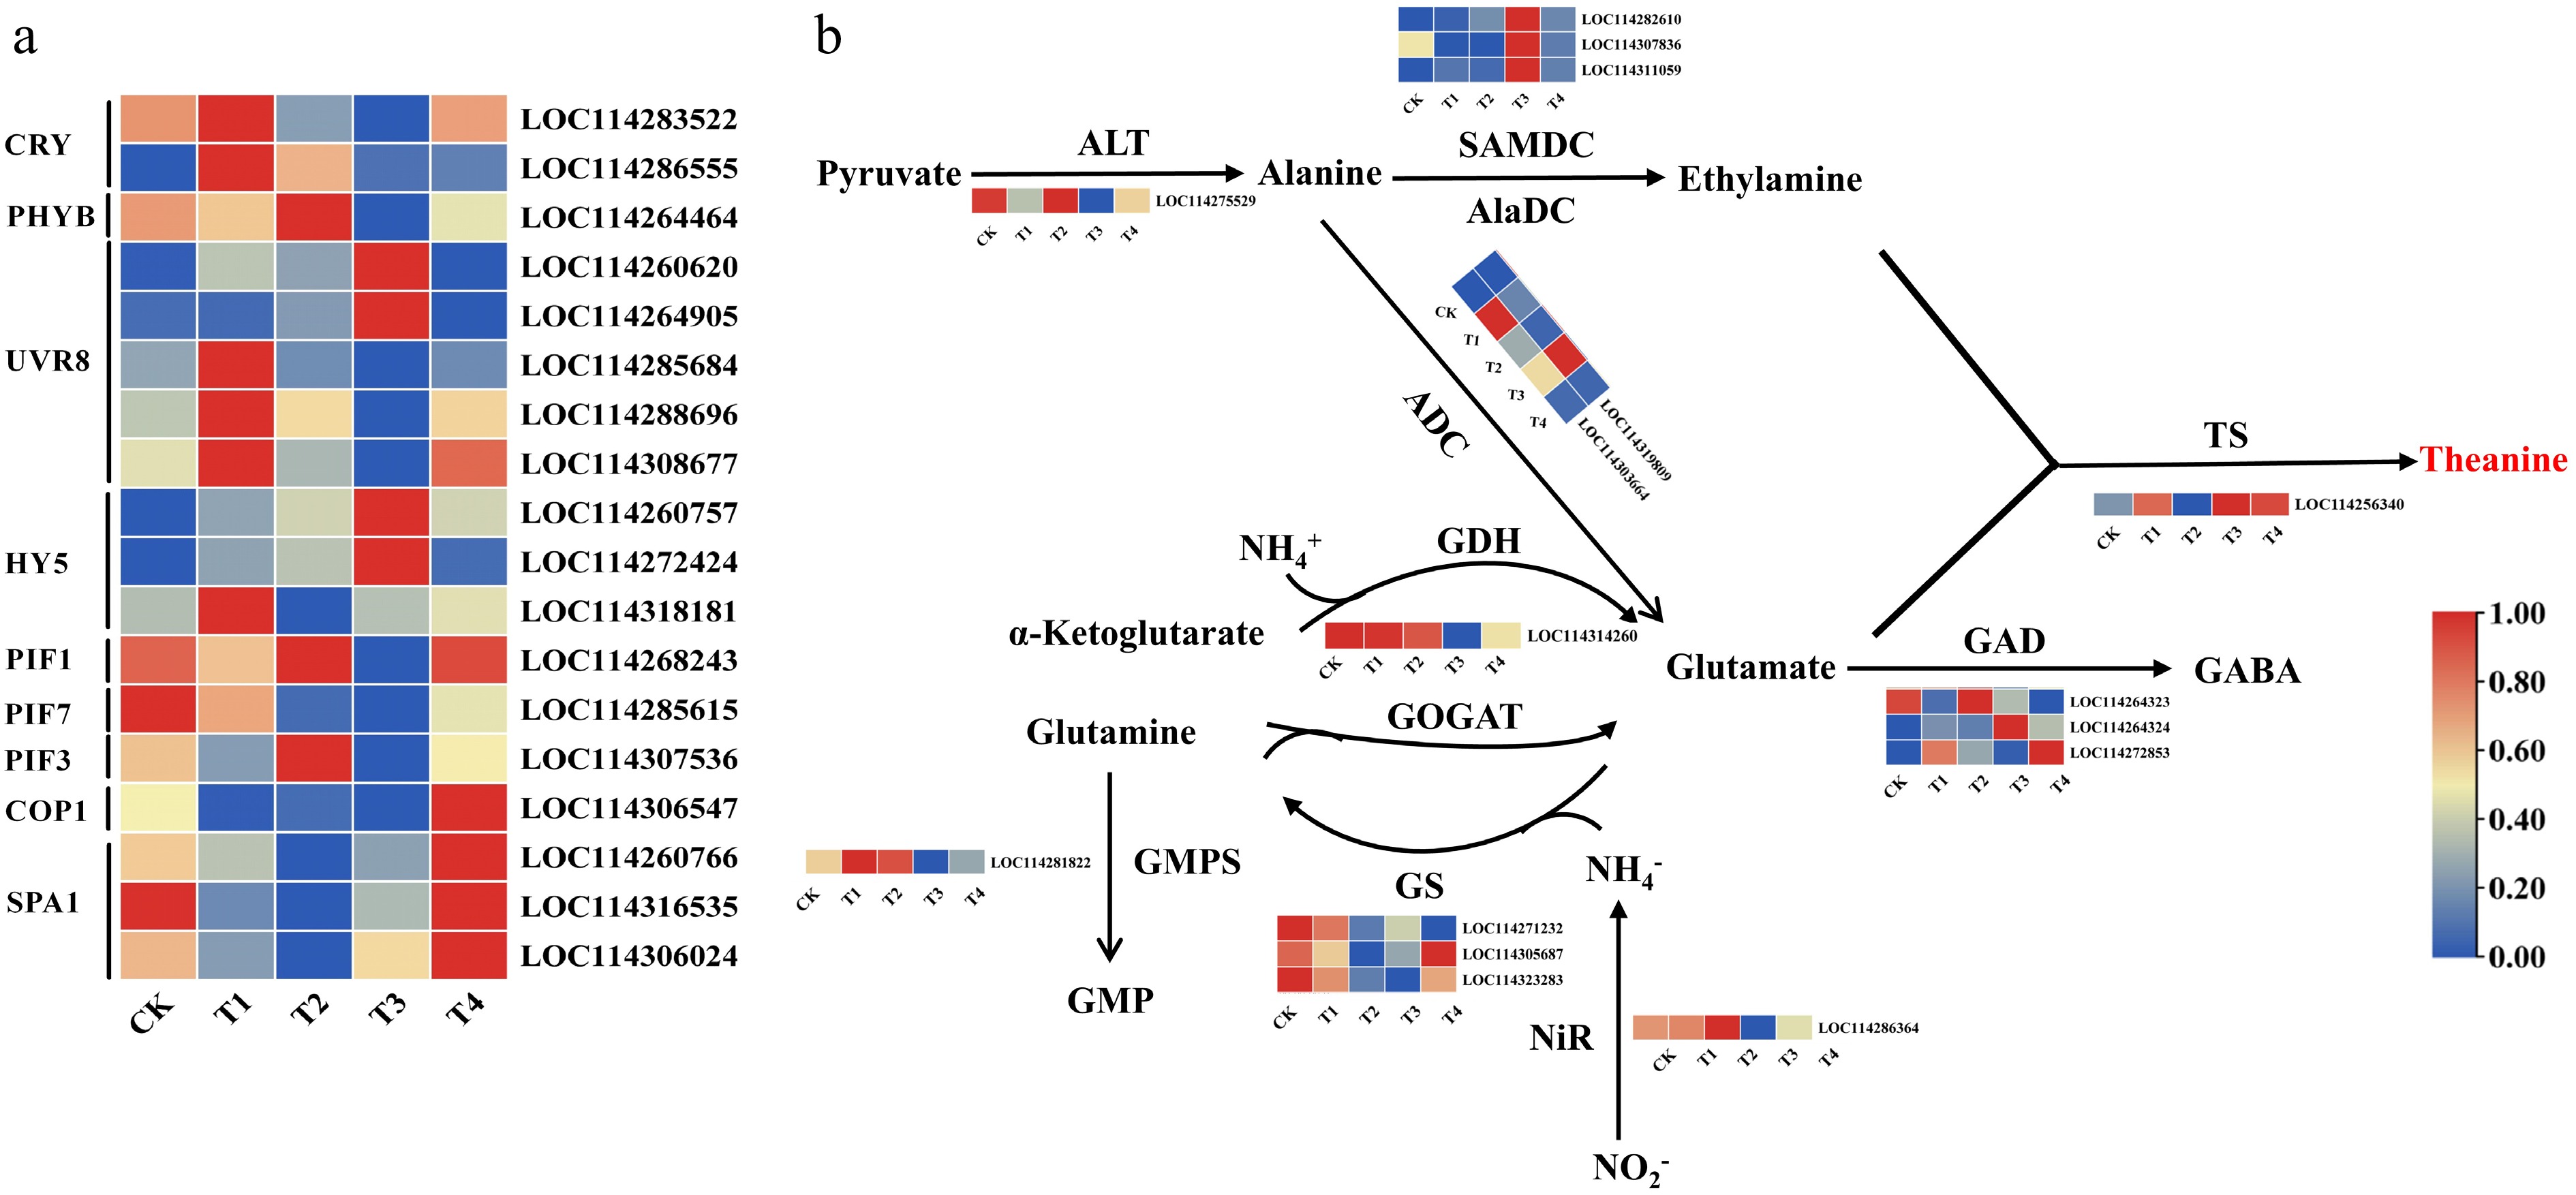
Figure 4.
Expression levels of light signalling genes (a), and expression patterns of the genes involved in theanine biosynthesis (b) under different light treatments. Note: The scale represents the normalized transformation of log10 fragments per kilobase of transcripts per million (FPKM) and the relative expression level of each gene. Differences in gene expression are indicated by different colors, ranging from low (blue) to high (red).
-
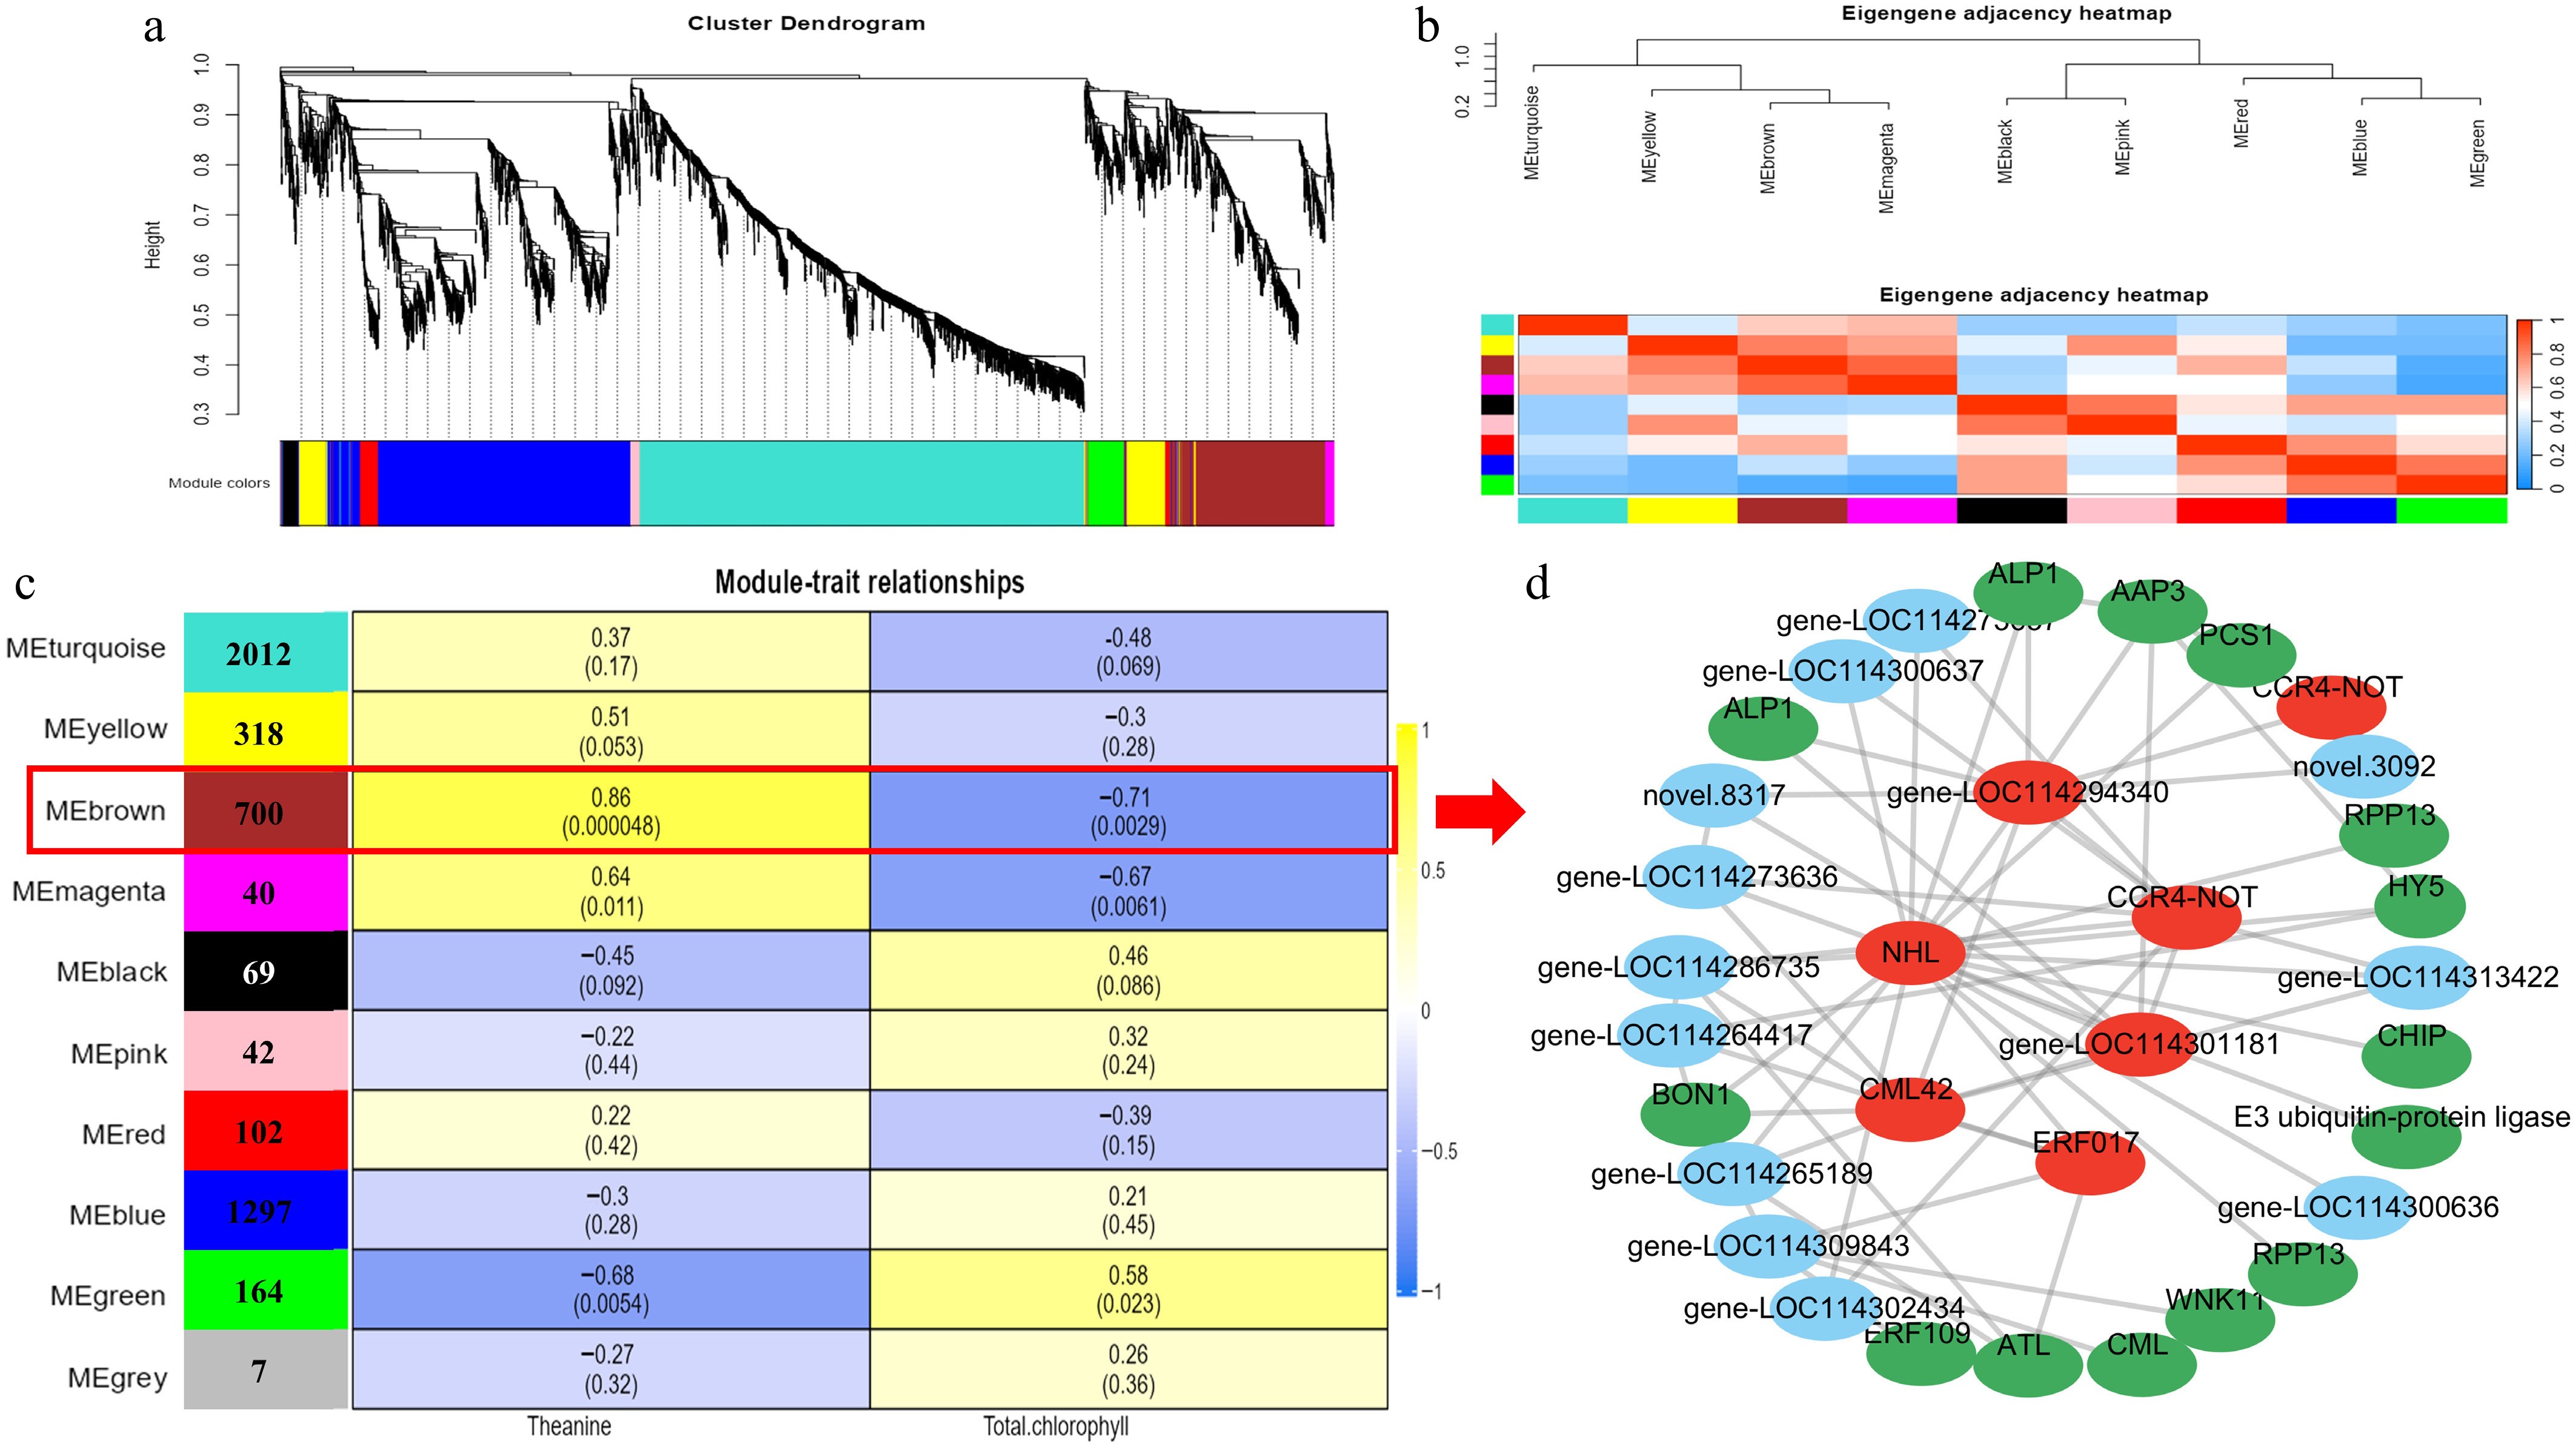
Figure 5.
Gene expression clustering and transcriptome co-expression analysis. (a) Hierarchical cluster tree showing 10 modules obtained by weighted gene co-expression network analysis (WGCNA). (b) Adjacency heatmap of featured genes. Module–metabolite correlation matrix. (c)The number of genes in each module is displayed in the left box, and the correlation coefficients and p-values between modules and metabolites are shown at the row–column intersections. Co-expression subnetwork analysis of the brown module associated with theanine and chlorophyll metabolic accumulation. (d) The top 60 nodes of the brown module were selected to construct the network, with hub genes marked in red, and genes involved in metabolism marked in green.
-
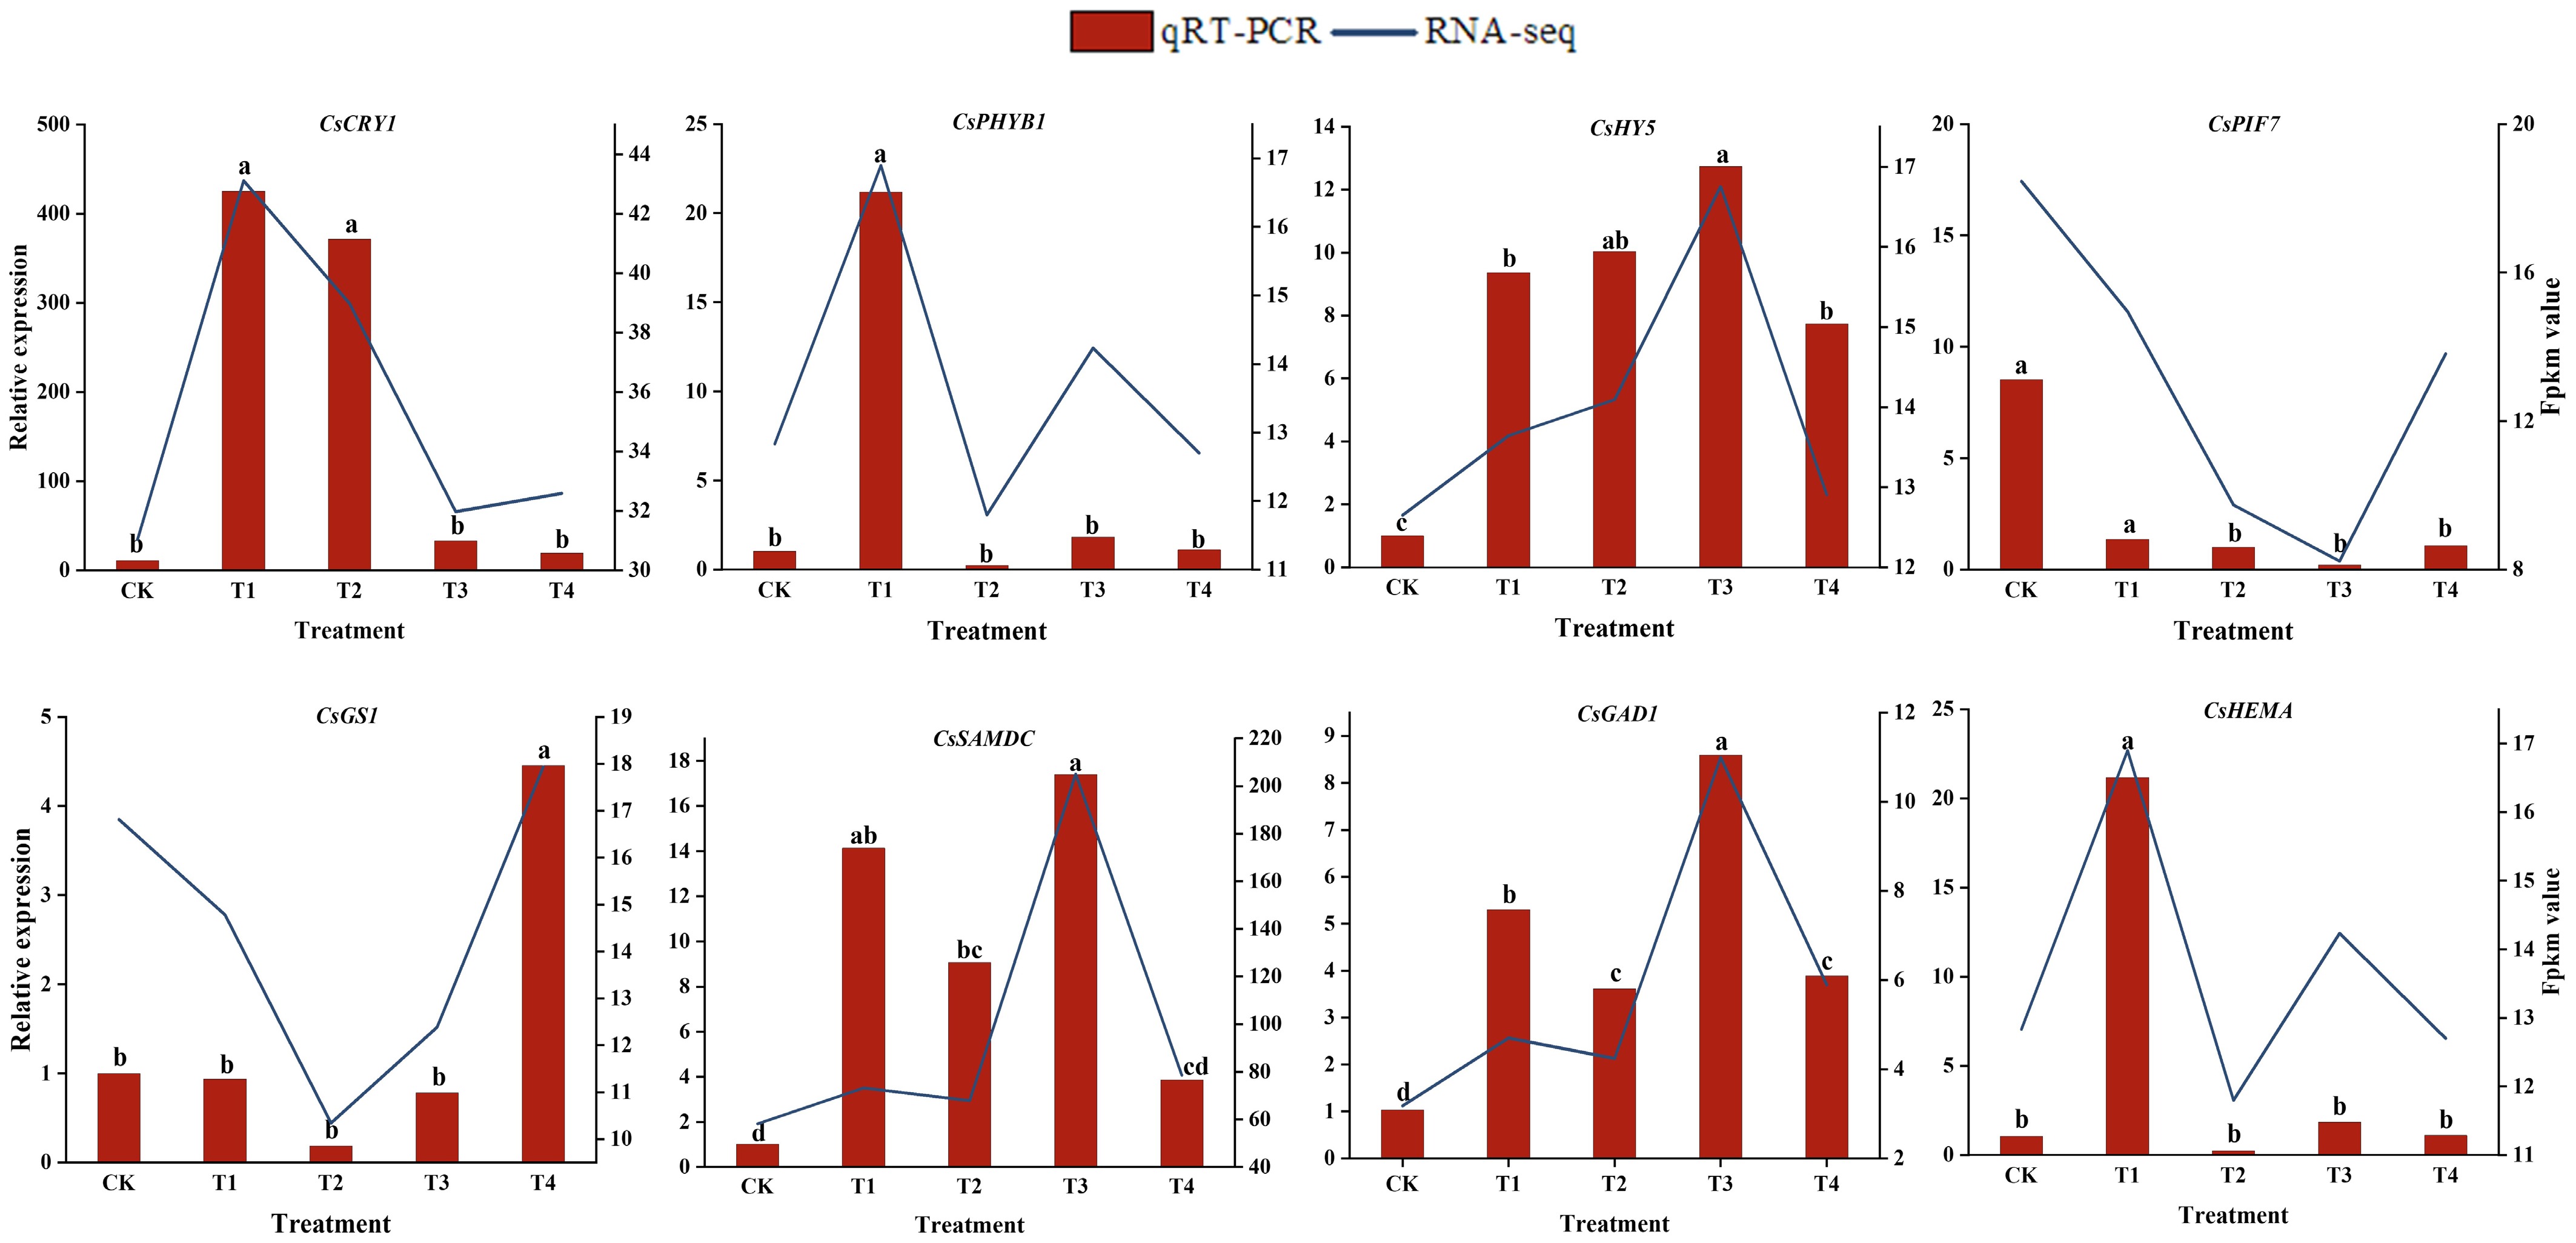
Figure 6.
The relative expression levels of eight selected DEGs were compared by RNA-seq and qRT-PCR. The line chart shows the gene expression levels from the transcriptome (FPKM). The qRT-PCR expression levels were calculated as a ratio relative to the level of expression in the CK, which was set to 1. Different letters above the bars represent significant differences between each other (p < 0.05).
-
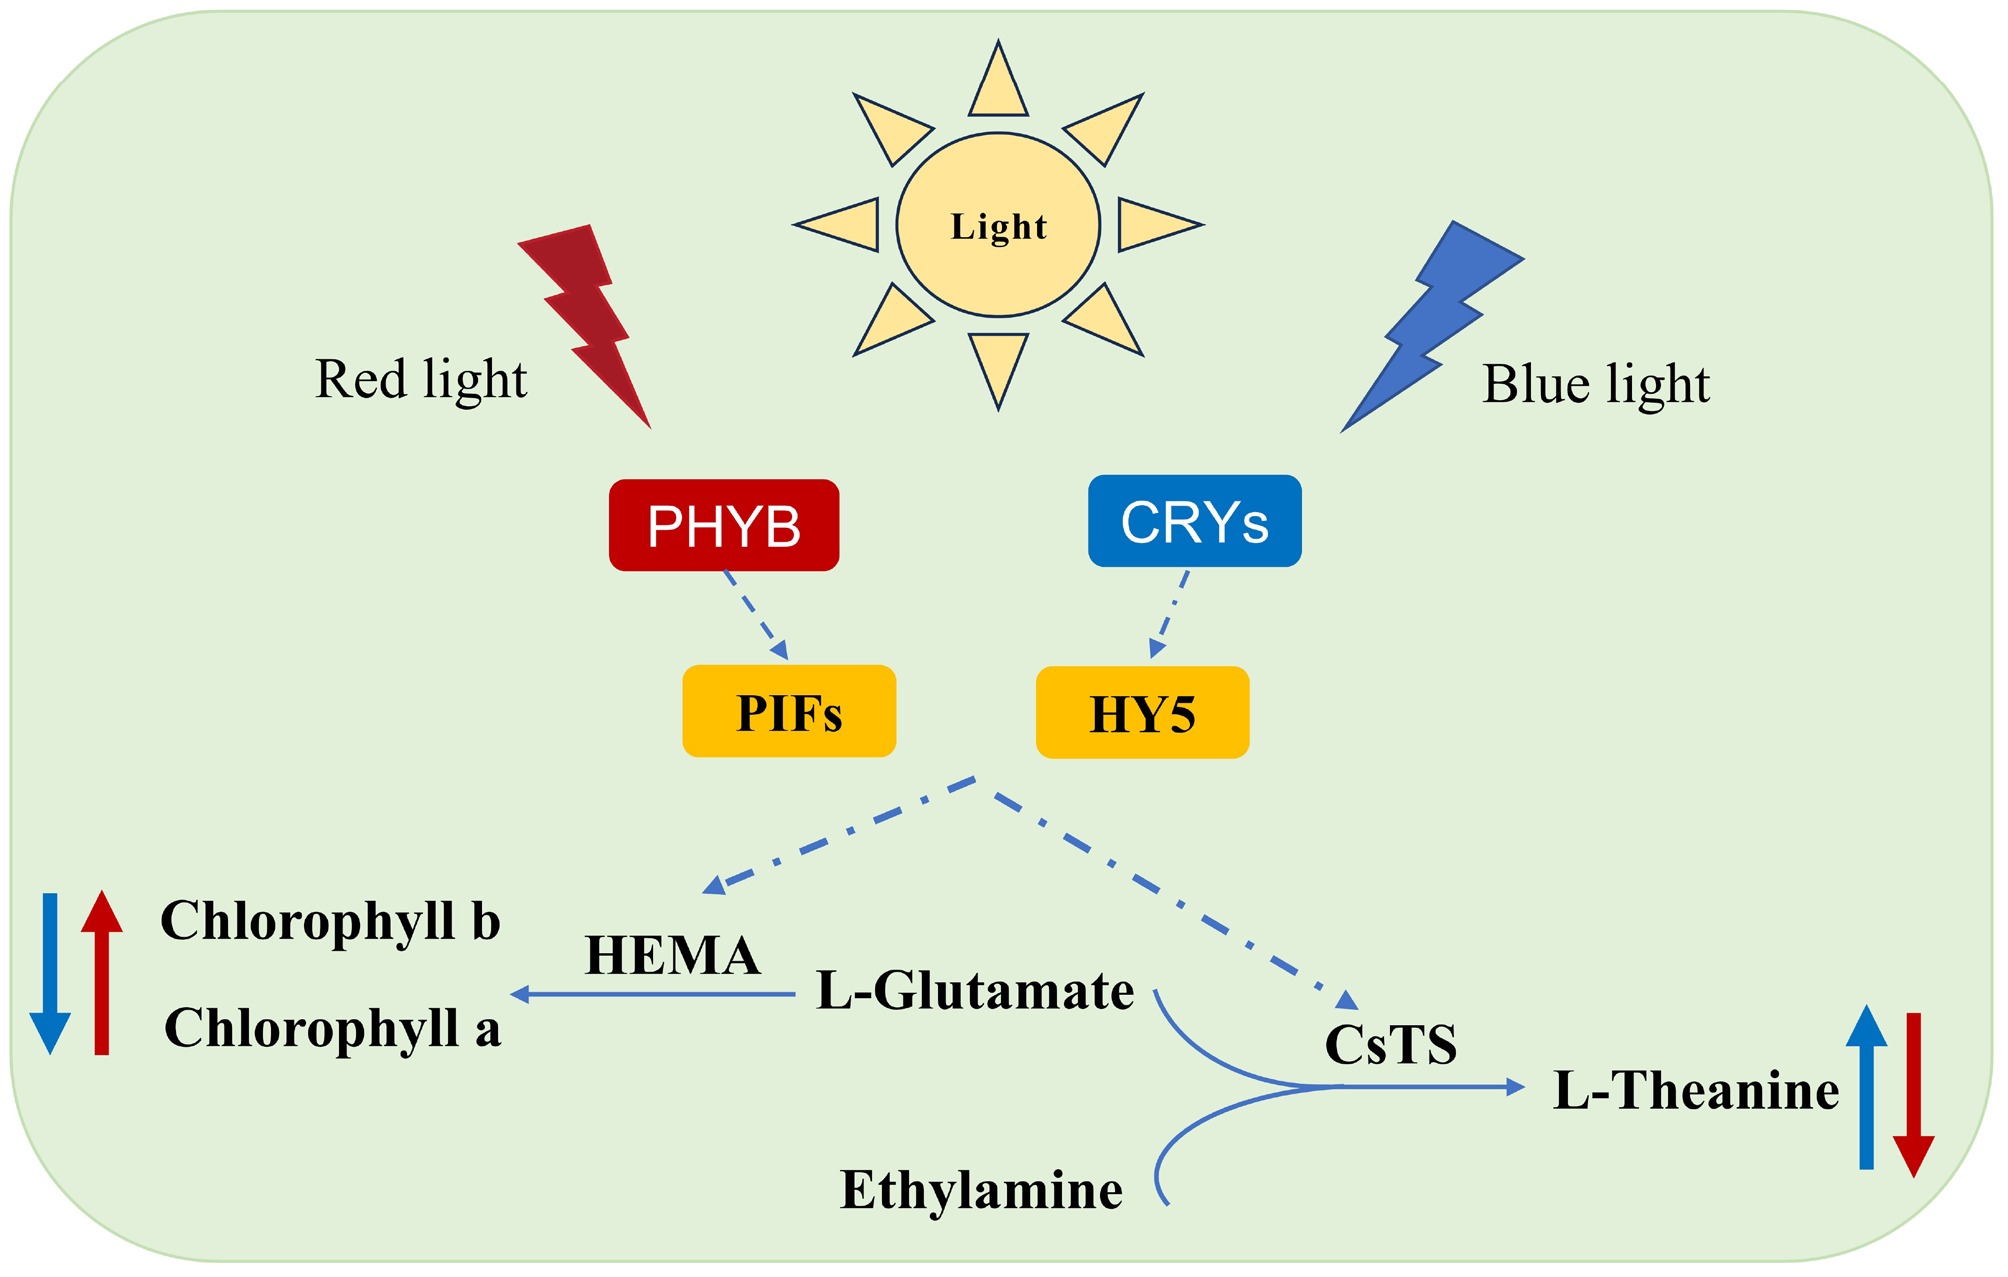
Figure 7.
Model diagram of light-induced theanine and chlorophyll biosynthesis.
-
Amino acid CK T1 T2 T3 T4 Theanine 28.97 ± 1.599c 42.82 ± 2.318a 31.43 ± 5.041c 36.92 ± 1.211b 30.44 ± 1.179c P-Ser 4.10 ± 0.429a 3.93 ± 1.109a 4.66 ± 0.809a 3.43 ± 1.588a 3.44 ± 0.579a Asp 4.74 ± 2.906b 11.07 ± 2.527a 7.12 ± 0.587ab 8.07 ± 3.439ab 6.59 ± 0.403ab Thr 2.31 ± 1.755a 1.35 ± 0.409a 1.45 ± 0.122a 1.45 ± 0.571a 1.37 ± 0.207a Ser 3.29 ± 1.317a 3.49 ± 0.848a 3.05 ± 0.219a 4.12 ± 1.751a 3.94 ± 0.563a Glu 1.52 ± 0.066a 1.37 ± 0.462a 1.63 ± 0.056a 1.08 ± 0.494a 0.49 ± 0.195a Sar 1.49 ± 0.351b 2.33 ± 0.520a 1.10 ± 0.332b 1.42 ± 0.040b ND Gly 0.49 ± 0.567a 0.22 ± 0.070a 0.18 ± 0.015a 0.18 ± 0.030a 0.20 ± 0.022a Ala 2.17 ± 1.340a 2.38 ± 0.749a 1.30 ± 0.319a 1.16 ± 0.395a 1.24 ± 0.173a Cit 1.05 ± 0.505a 1.23 ± 0.275a 1.63 ± 0.209a 1.75 ± 0.863a 1.37 ± 0.273a Val 1.09 ± 0.688a 1.69 ± 0.533a 1.29 ± 0.855a 1.67 ± 0.723a 1.43 ± 0.114a Ile 0.85 ± 0.941a 0.43 ± 0.210a 0.94 ± 0.756a 0.37 ± 0.180a 0.30 ± 0.047a Leu 0.48 ± 0.261b 1.02 ± 0.395a 0.56 ± 0.130ab 0.77 ± 0.202ab 0.51 ± 0.187b Tyr 0.56 ± 0.226a 0.56 ± 0.145a 0.56 ± 0.190a 0.45 ± 0.144a 0.37 ± 0.026a β-Ala 4.04 ± 0.200a 3.44 ± 0.416ab 3.59 ± 0.696ab 2.12 ± 0.877c 2.69 ± 0.392bc g-ABA 1.68 ± 0.947a 0.89 ± 0.244ab 0.97 ± 0.361ab 0.51 ± 0.239b 0.95 ± 0.326ab His ND 0.53 ± 0.124b 0.41 ± 0.023b 0.74 ± 0.054a ND Orn ND 0.42 ± 0.158a 0.23 ± 0.053a 0.27 ± 0.122a 0.32 ± 0.112a Lys 1.38 ± 0.325b 2.55 ± 0.657ab 2.07 ± 0.159ab 3.35 ± 1.518a 1.98 ± 0.631ab Arg 2.60 ± 0.511a 3.88 ± 1.144a 3.76 ± 0.302a 3.92 ± 0.415a 1.91 ± 1.840a Total 62.81 ± 5.370b 85.60 ± 9.086a 67.93 ± 0.347b 73.75 ± 13.275ab 59.54 ± 4.710b Data with different letters in the same line denote a significant difference at the 0.05 level according to the least significant difference (LSD) test; ND stands for 'not detected'. Total amino acid composition represents the summation of 19 quantified free amino acid species, with theanine quantification analyzed separately. The full nomenclature of the analytical targets appears in Supplementary Table S4. Table 1.
The amino acid contents (mg/g DW) in tea samples.
Figures
(7)
Tables
(1)