-
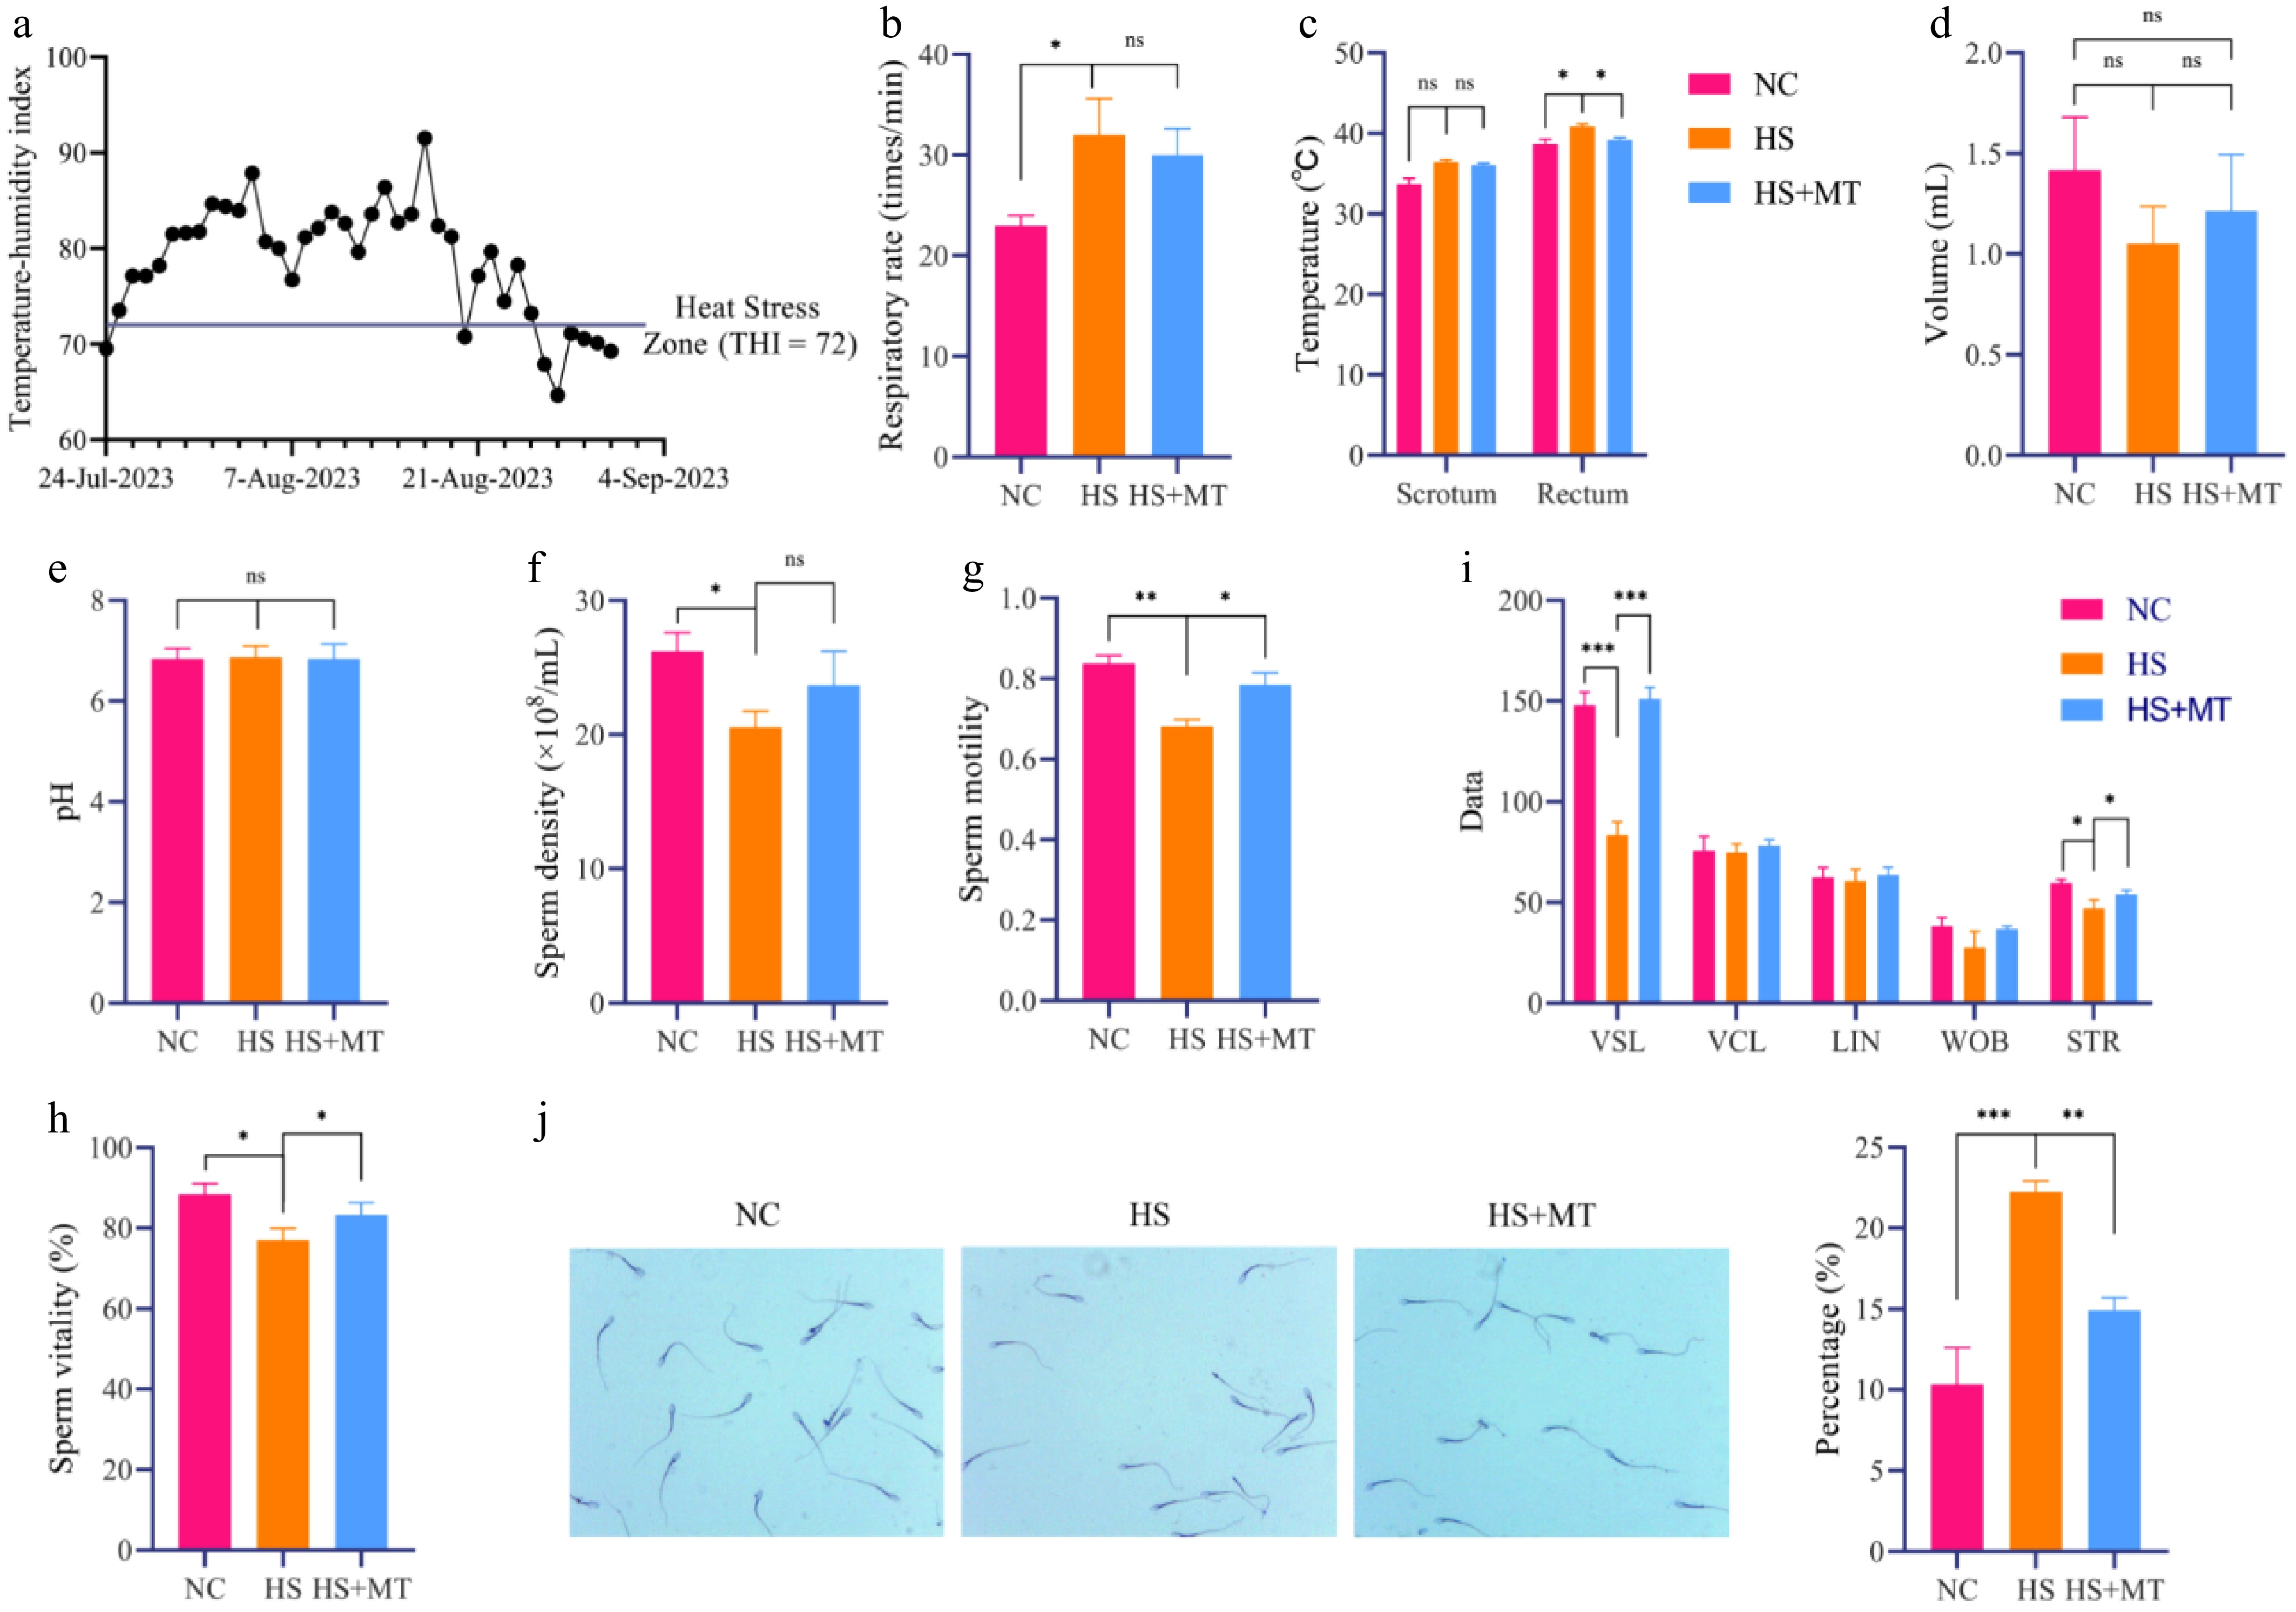
Figure 1.
Protective effects of melatonin on sperm quality in heat-stressed dairy goats. (a) Daily temperature–humidity index (THI) during the experimental period. (b) Respiratory rate of dairy goats in each group. (c) Scrotal and rectal temperatures. (d) Semen volume. (e) Semen pH. (f) Sperm concentration. (g) Sperm motility. (h) Sperm viability. (i) Sperm motility parameters including straight-line velocity (VSL), curvilinear velocity (VCL), linearity (LIN), wobble (WOB), and straightness (STR). (j) Crystal violet staining and sperm abnormality rate. Statistical significance was as follows: * p < 0.05, ** p < 0.01, *** p < 0.001; ns, no statistical significance.
-
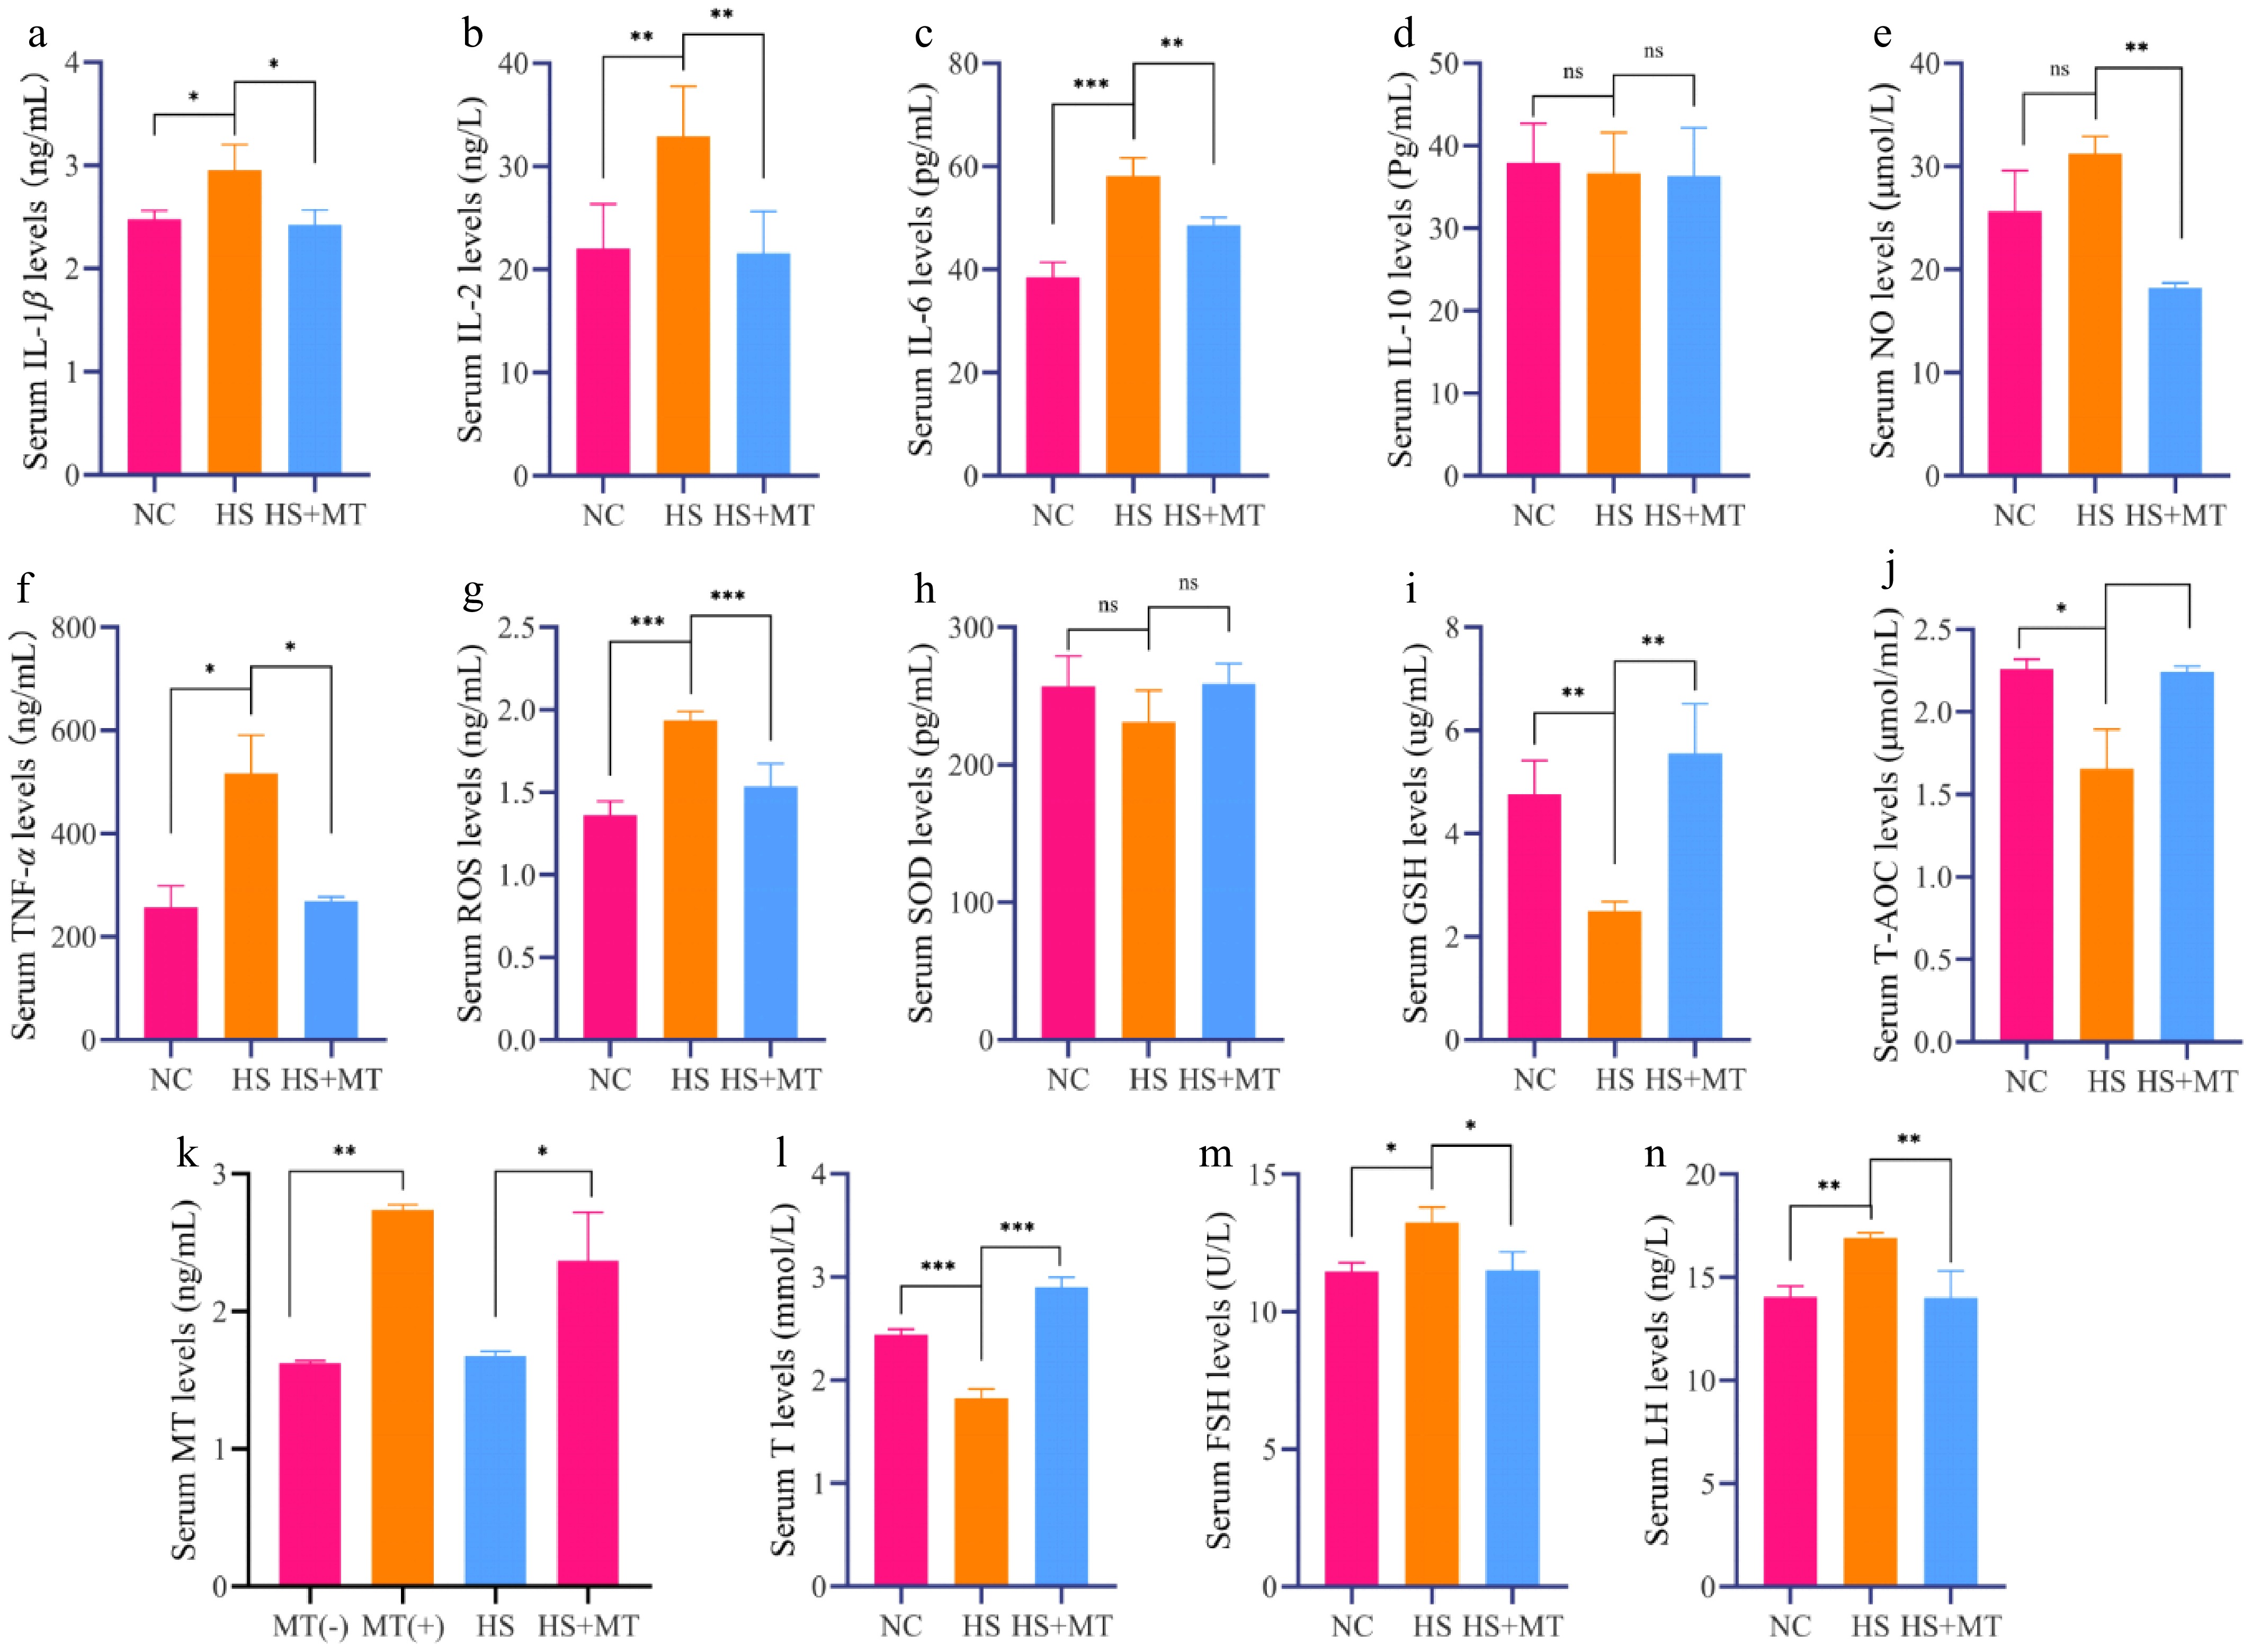
Figure 2.
Effect of melatonin on serum biochemical indicators and reproductive hormones in heat-stressed dairy goats (a) Serum IL-1β levels. (b) Serum IL-2 levels. (c) Serum IL-6 levels. (d) Serum IL-10 levels. (e) Serum NO levels. (f) Serum TNF-α levels. (g) Serum ROS levels. (h) Serum SOD levels. (i) Serum GSH levels. (j) Serum T-AOC levels. (k) Serum melatonin levels before and after injection of melatonin implants, as well as in the HS group and HS+MT group. (l) Serum T levels. (m) Serum FSH levels. (n) Serum LH levels. Statistical significance was as follows: * p < 0.05, ** p < 0.01, *** p < 0.001, ns, no statistical significance.
-
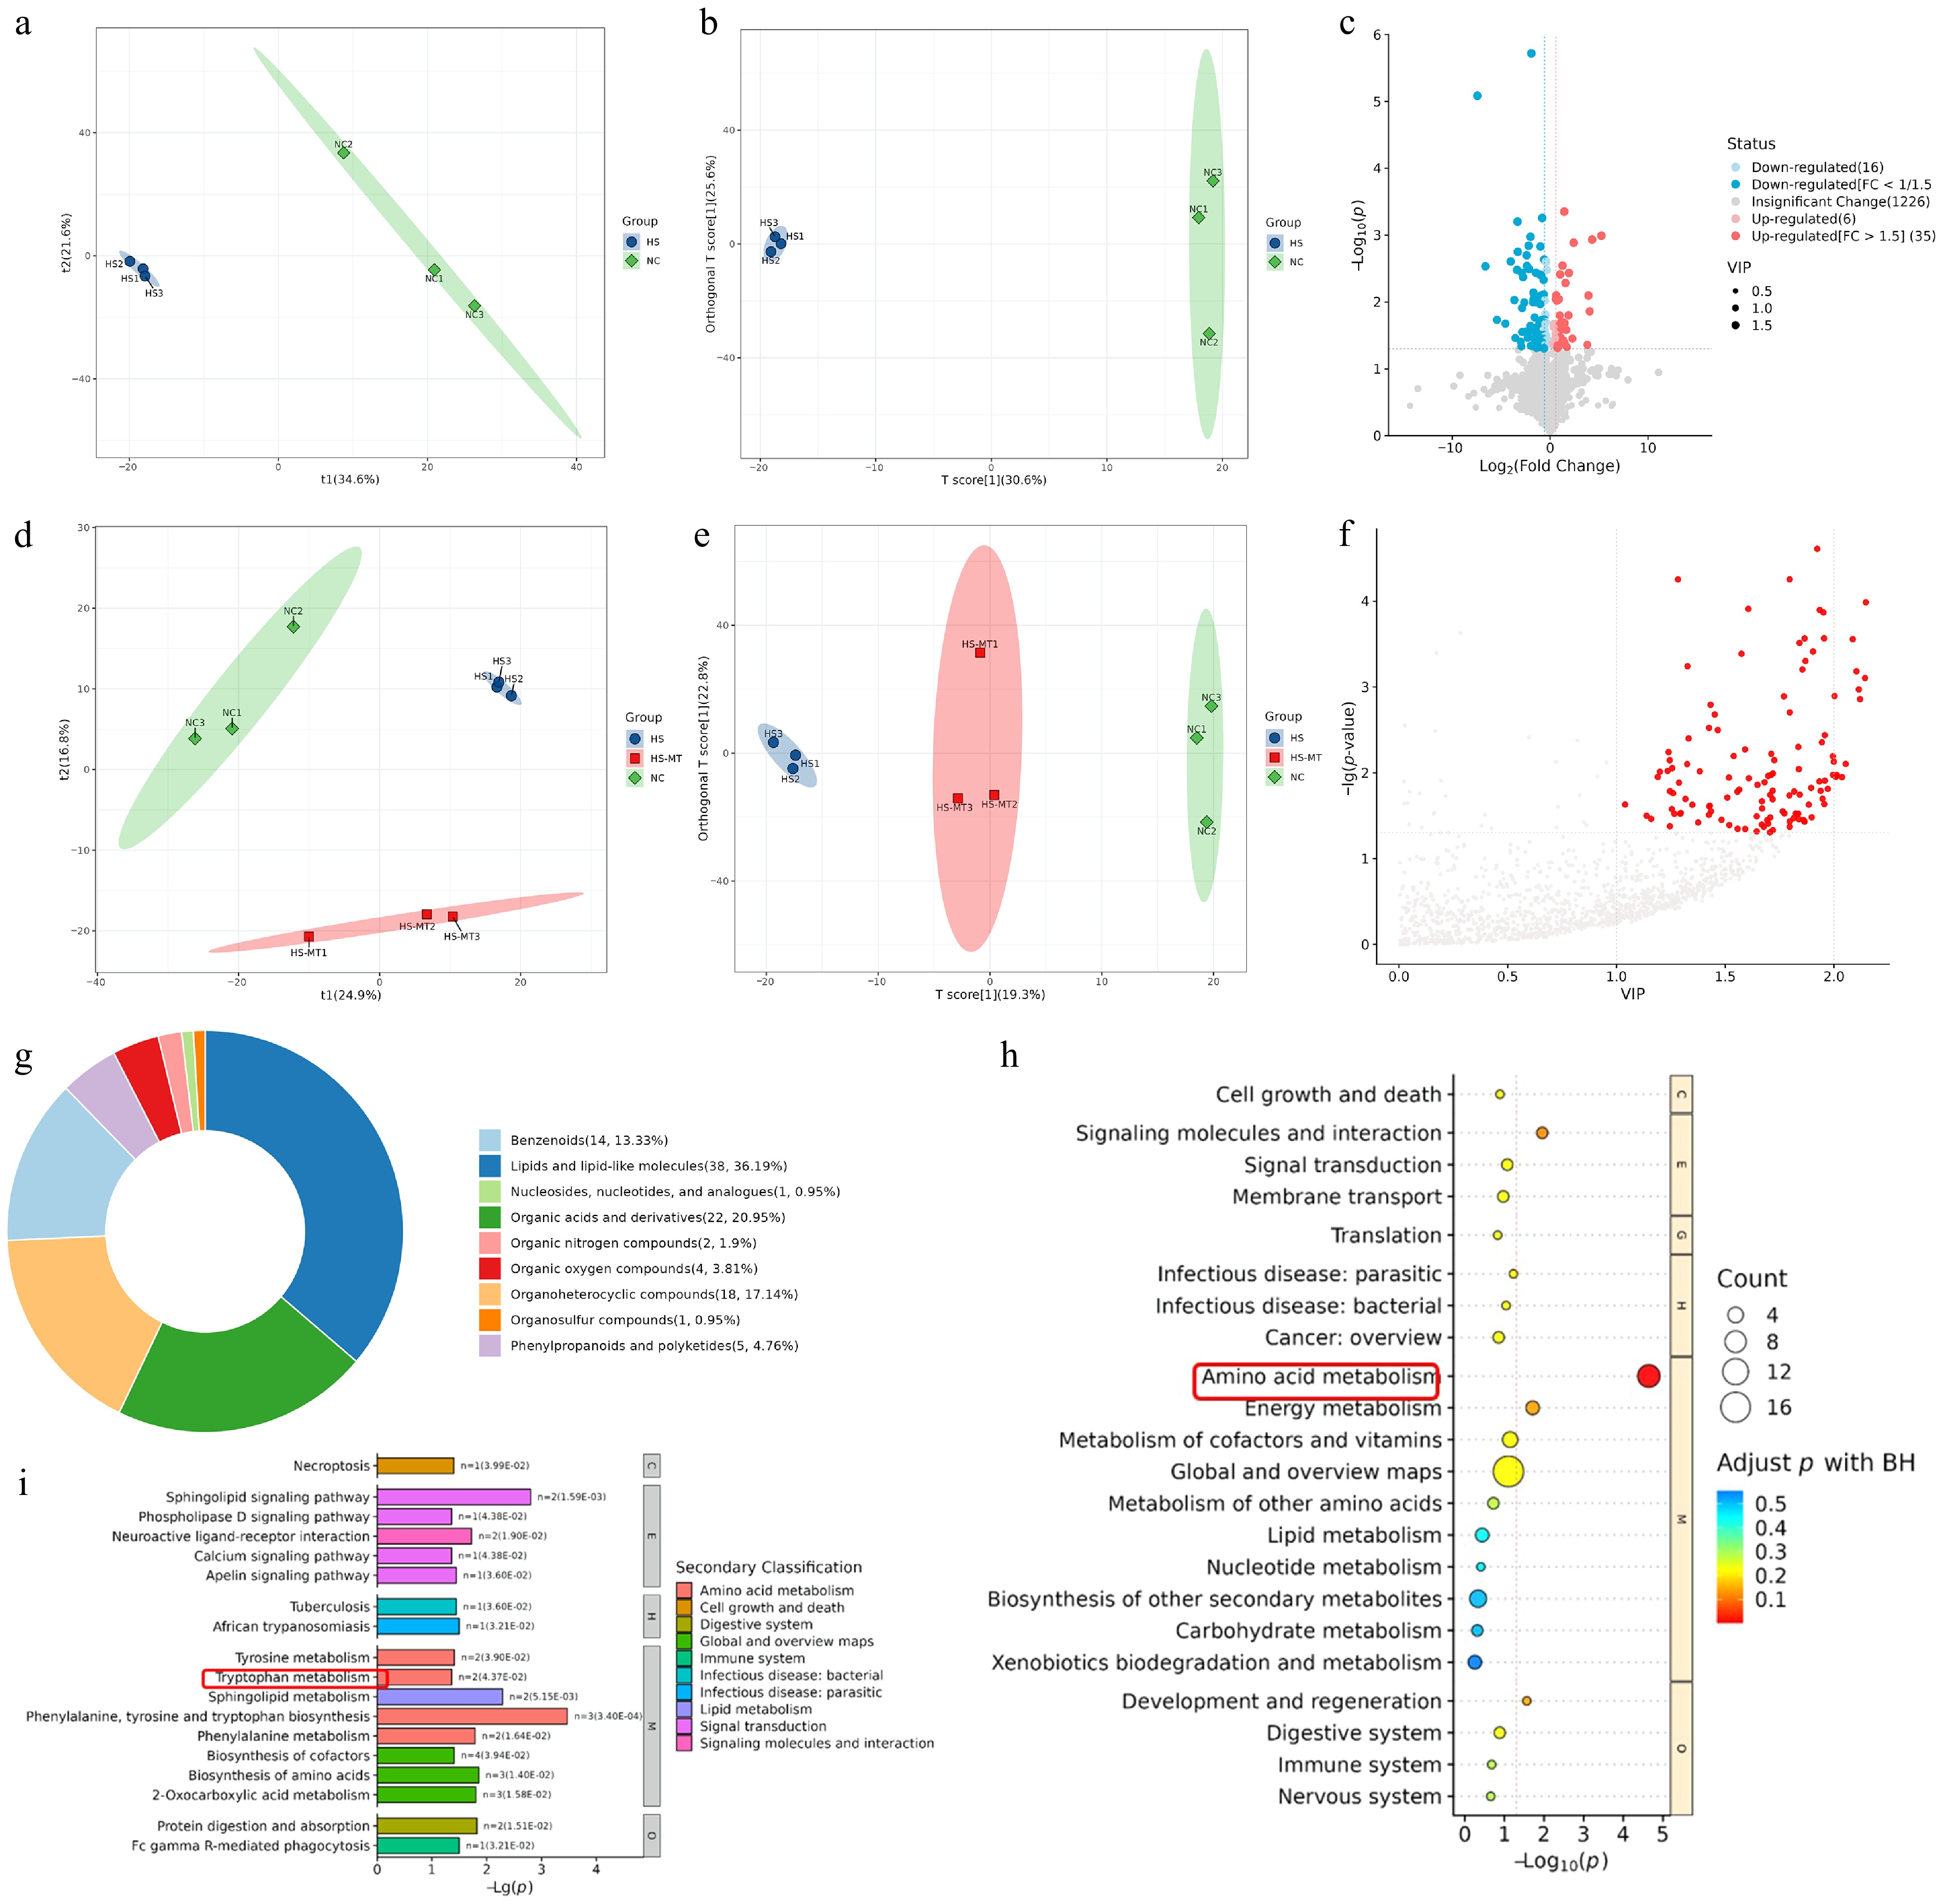
Figure 3.
Effects of heat stress and melatonin on serum metabolomic profiles in dairy goats (a) The PLS-DA score plot of the NC group versus the HS group is used to measure the degree of differences in metabolites between and within groups. (b) The OPLS-DA score plot of the NC verus the HS group is used to measure the degree of the differences in metabolites between and within groups. (c) The volcano plot of the NC vs. HS group was generated using FC ≥ 1.5 or FC ≤ 1/1.5 and p < 0.05 as the screening criteria. Two vertical dashed lines indicate the threshold range of log2 (1/1.5) and log2 (1.5); red dots represent significantly upregulated metabolites, while blue dots indicate significantly downregulated metabolites. (d) NC: The PLS-DA score plot of the NC versus HS+MT groups is used to measure the degree of the differences in metabolites between and within groups. (e) The OPLS-DA score plot of NC vs. HS vs. HS+MT groups was used to measure the degree of differences in metabolites between and within groups. (f) The scatter plot of the NC vs. HS+MT groups uses VIP > 1 and p < 0.05 as screening criteria, with the horizontal axis representing the VIP value of OPLS-DA and the vertical axis representing the log (p-value). The red dots represent metabolites with VIP > 1 and p < 0.05. (g) The substance classification results obtained by classifying and statistically analyzing the differential metabolites of each comparative group on the basis of their structure and function. (h) KEGG Level 1 pathways. (i) KEGG Level 2 pathways.
-
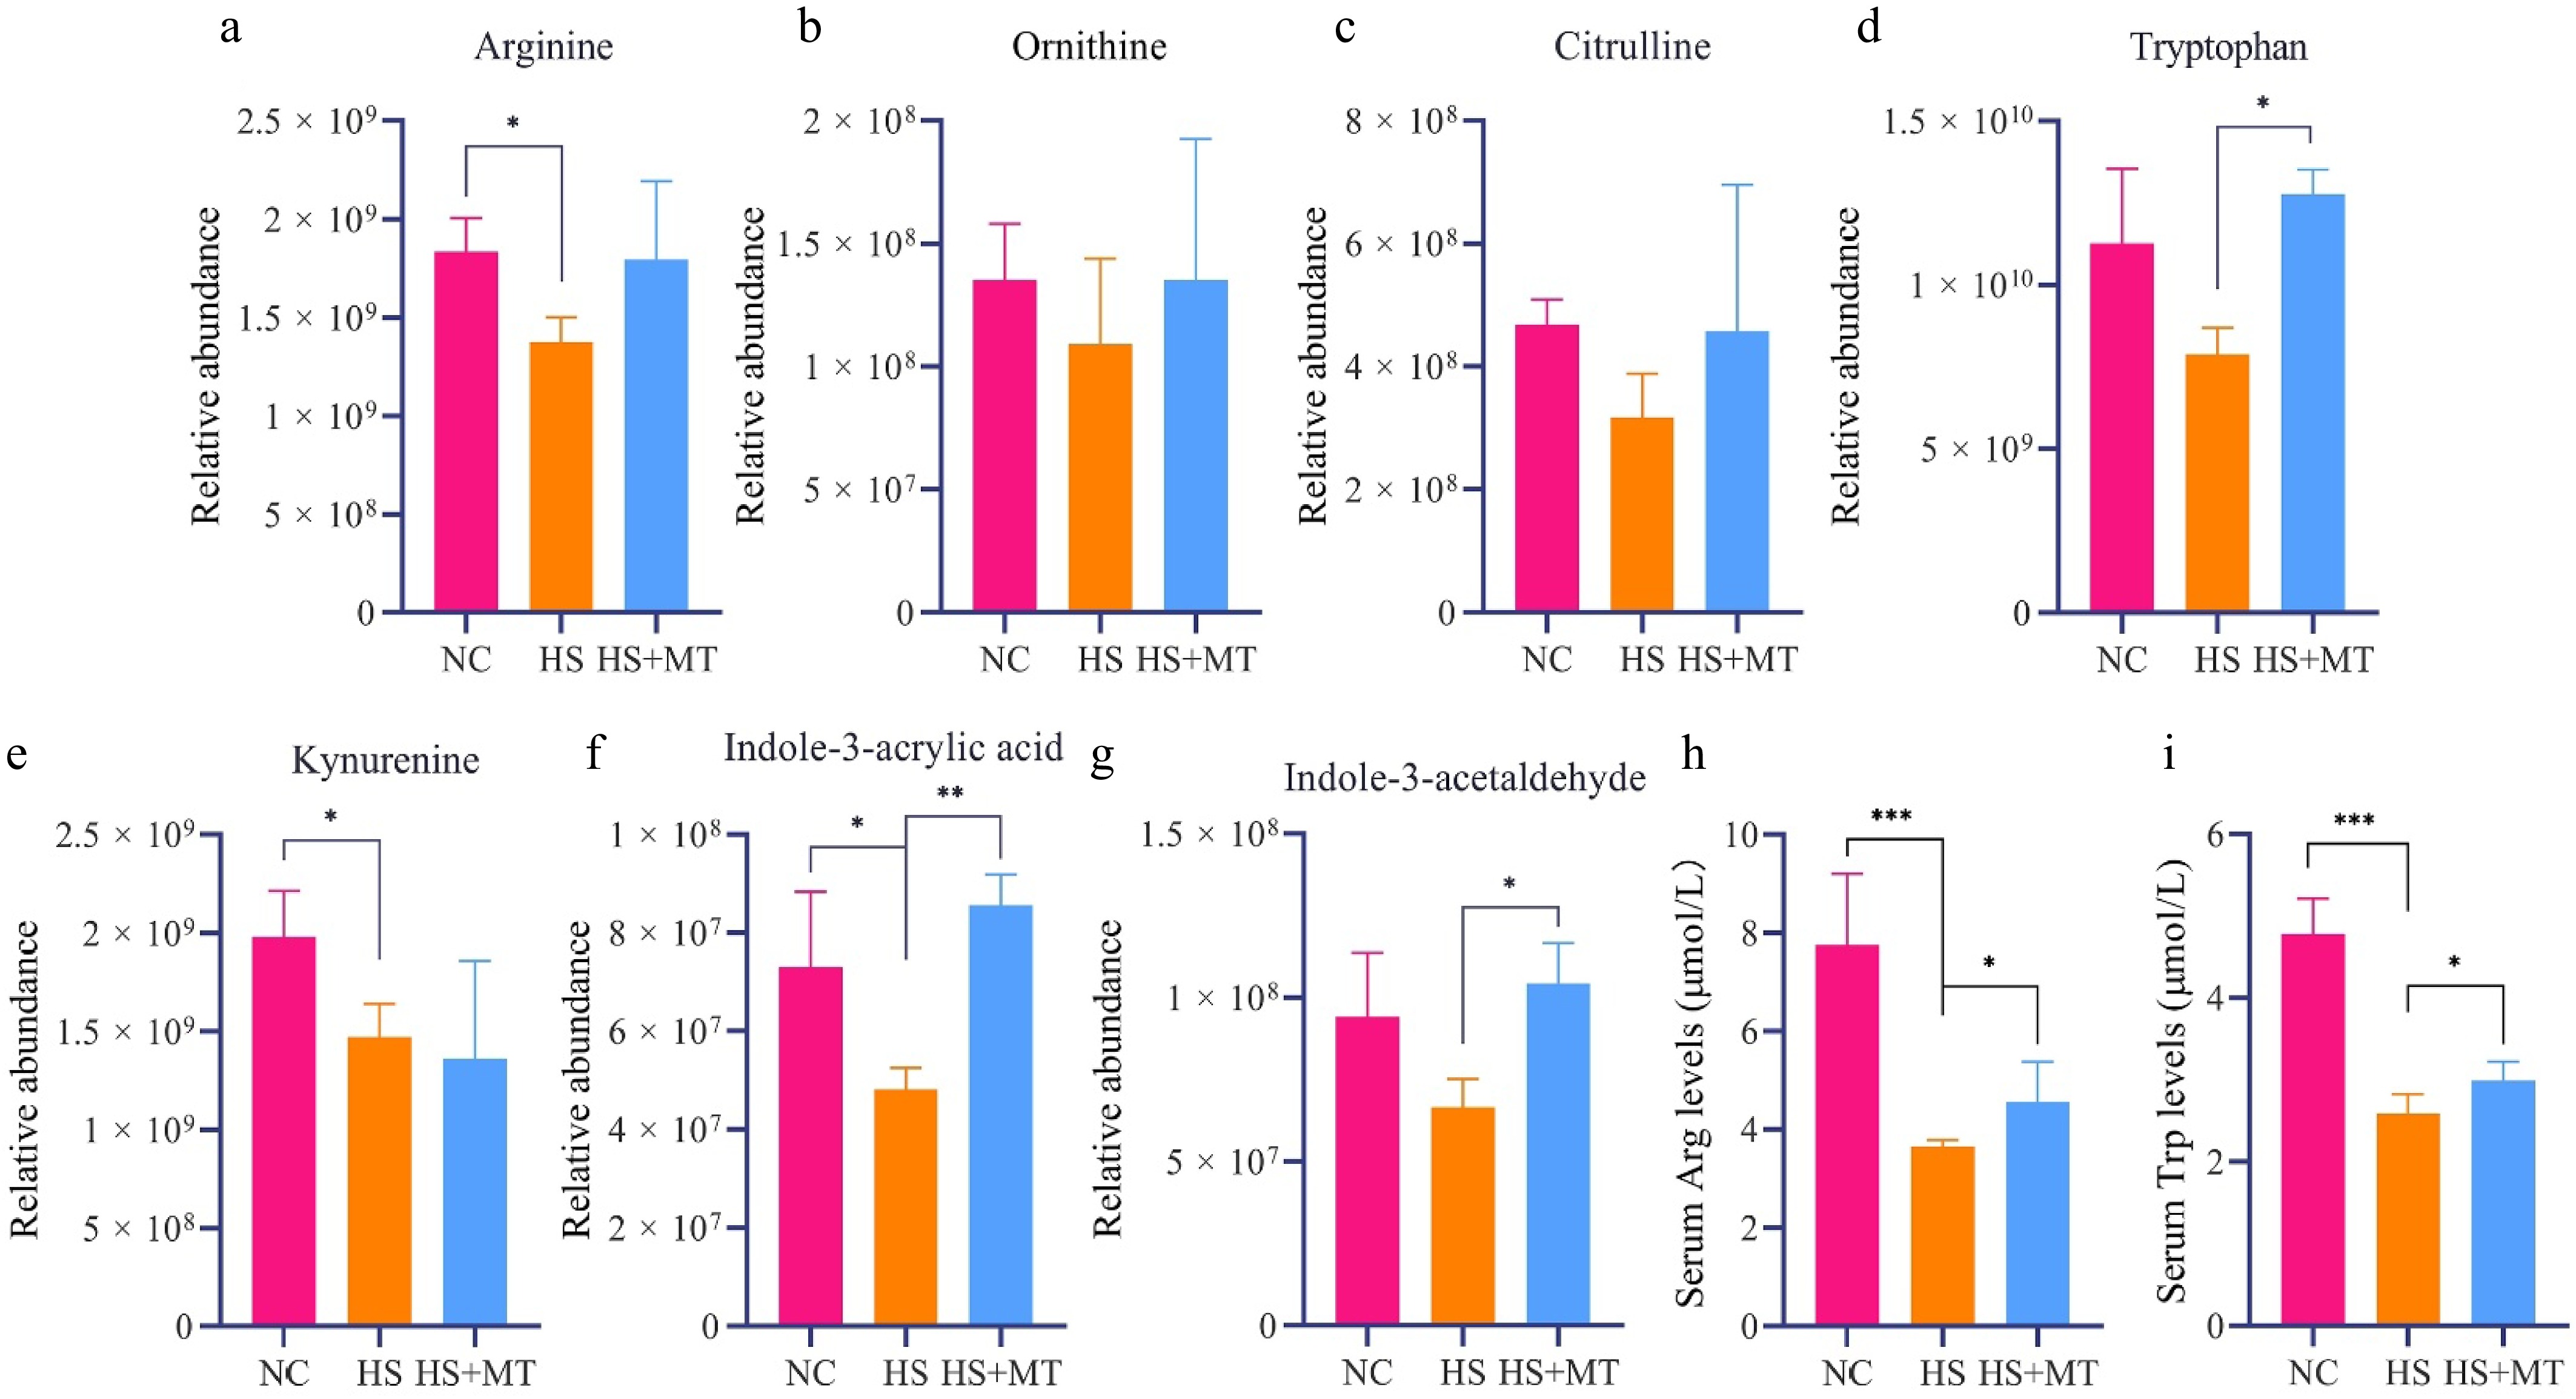
Figure 4.
Effects of melatonin on the serum concentrations of arginine, tryptophan, and related metabolites in heat-stressed dairy goats. (a) Relative abundance of arginine in the serum of dairy goats. (b) Relative abundance of ornithine. (c) Relative abundance of citrulline. (d) Relative abundance of tryptophan. (e) Relative abundance of kynurenine. (f) Relative abundance of indole-3-acrylic acid. (g) Relative abundance of indole-3-acetaldehyde. (h) Serum arginine levels. (i) Serum tryptophan levels. Statistical significance was as follows: * p < 0.05, ** p < 0.01, *** p < 0.001.
-
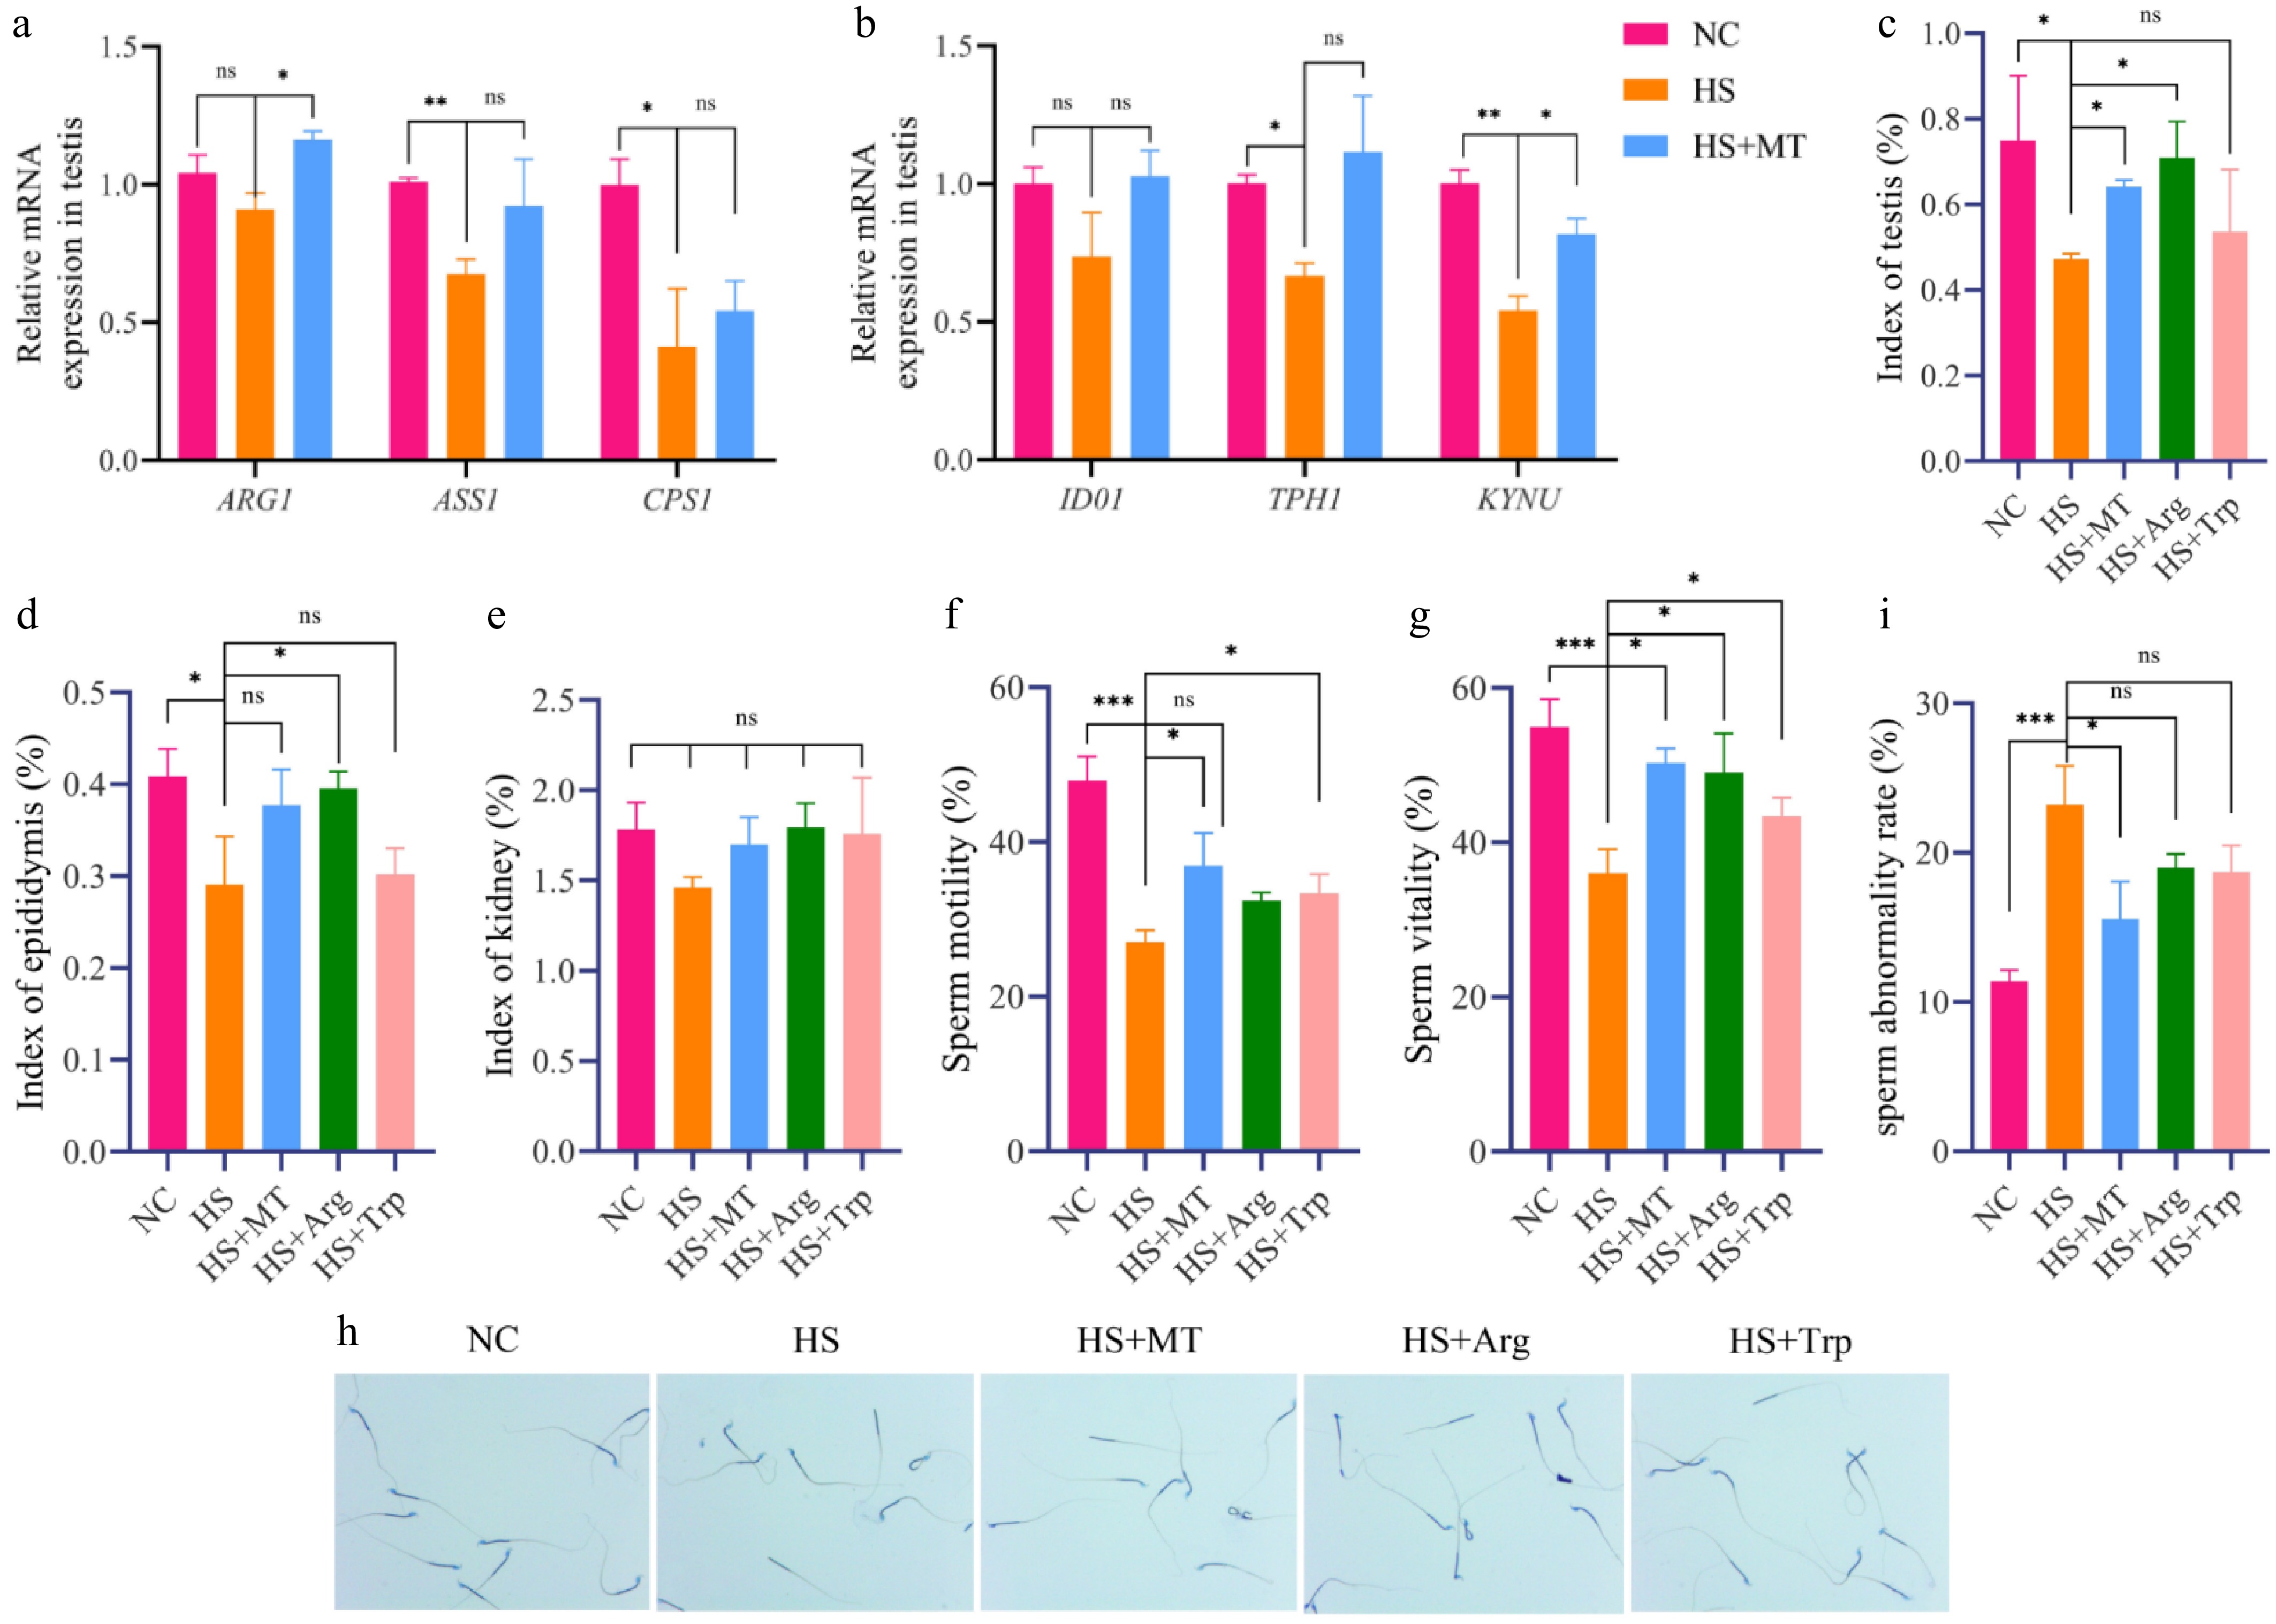
Figure 5.
Melatonin-regulated arginine and tryptophan metabolism improves sperm quality in heat-stressed mice. (a) Arginine metabolism related genes: expression levels of ARG1, ASS1, and CPS1. (b) Tryptophan metabolism-related genes: IDO1, TPH1, and KYNU expression levels. (c) Testicular organ index of mice in each group. (d) Epididymal organ index. (e) Kidney organ index. (f) Sperm motility of each group of mice. (g) Sperm vitality. (h) Crystal violet staining of sperm. (i) Sperm abnormality rate. Statistical significance was as follows: * p < 0.05, ** p < 0.01, *** p < 0.001; ns, no statistical significance.
-
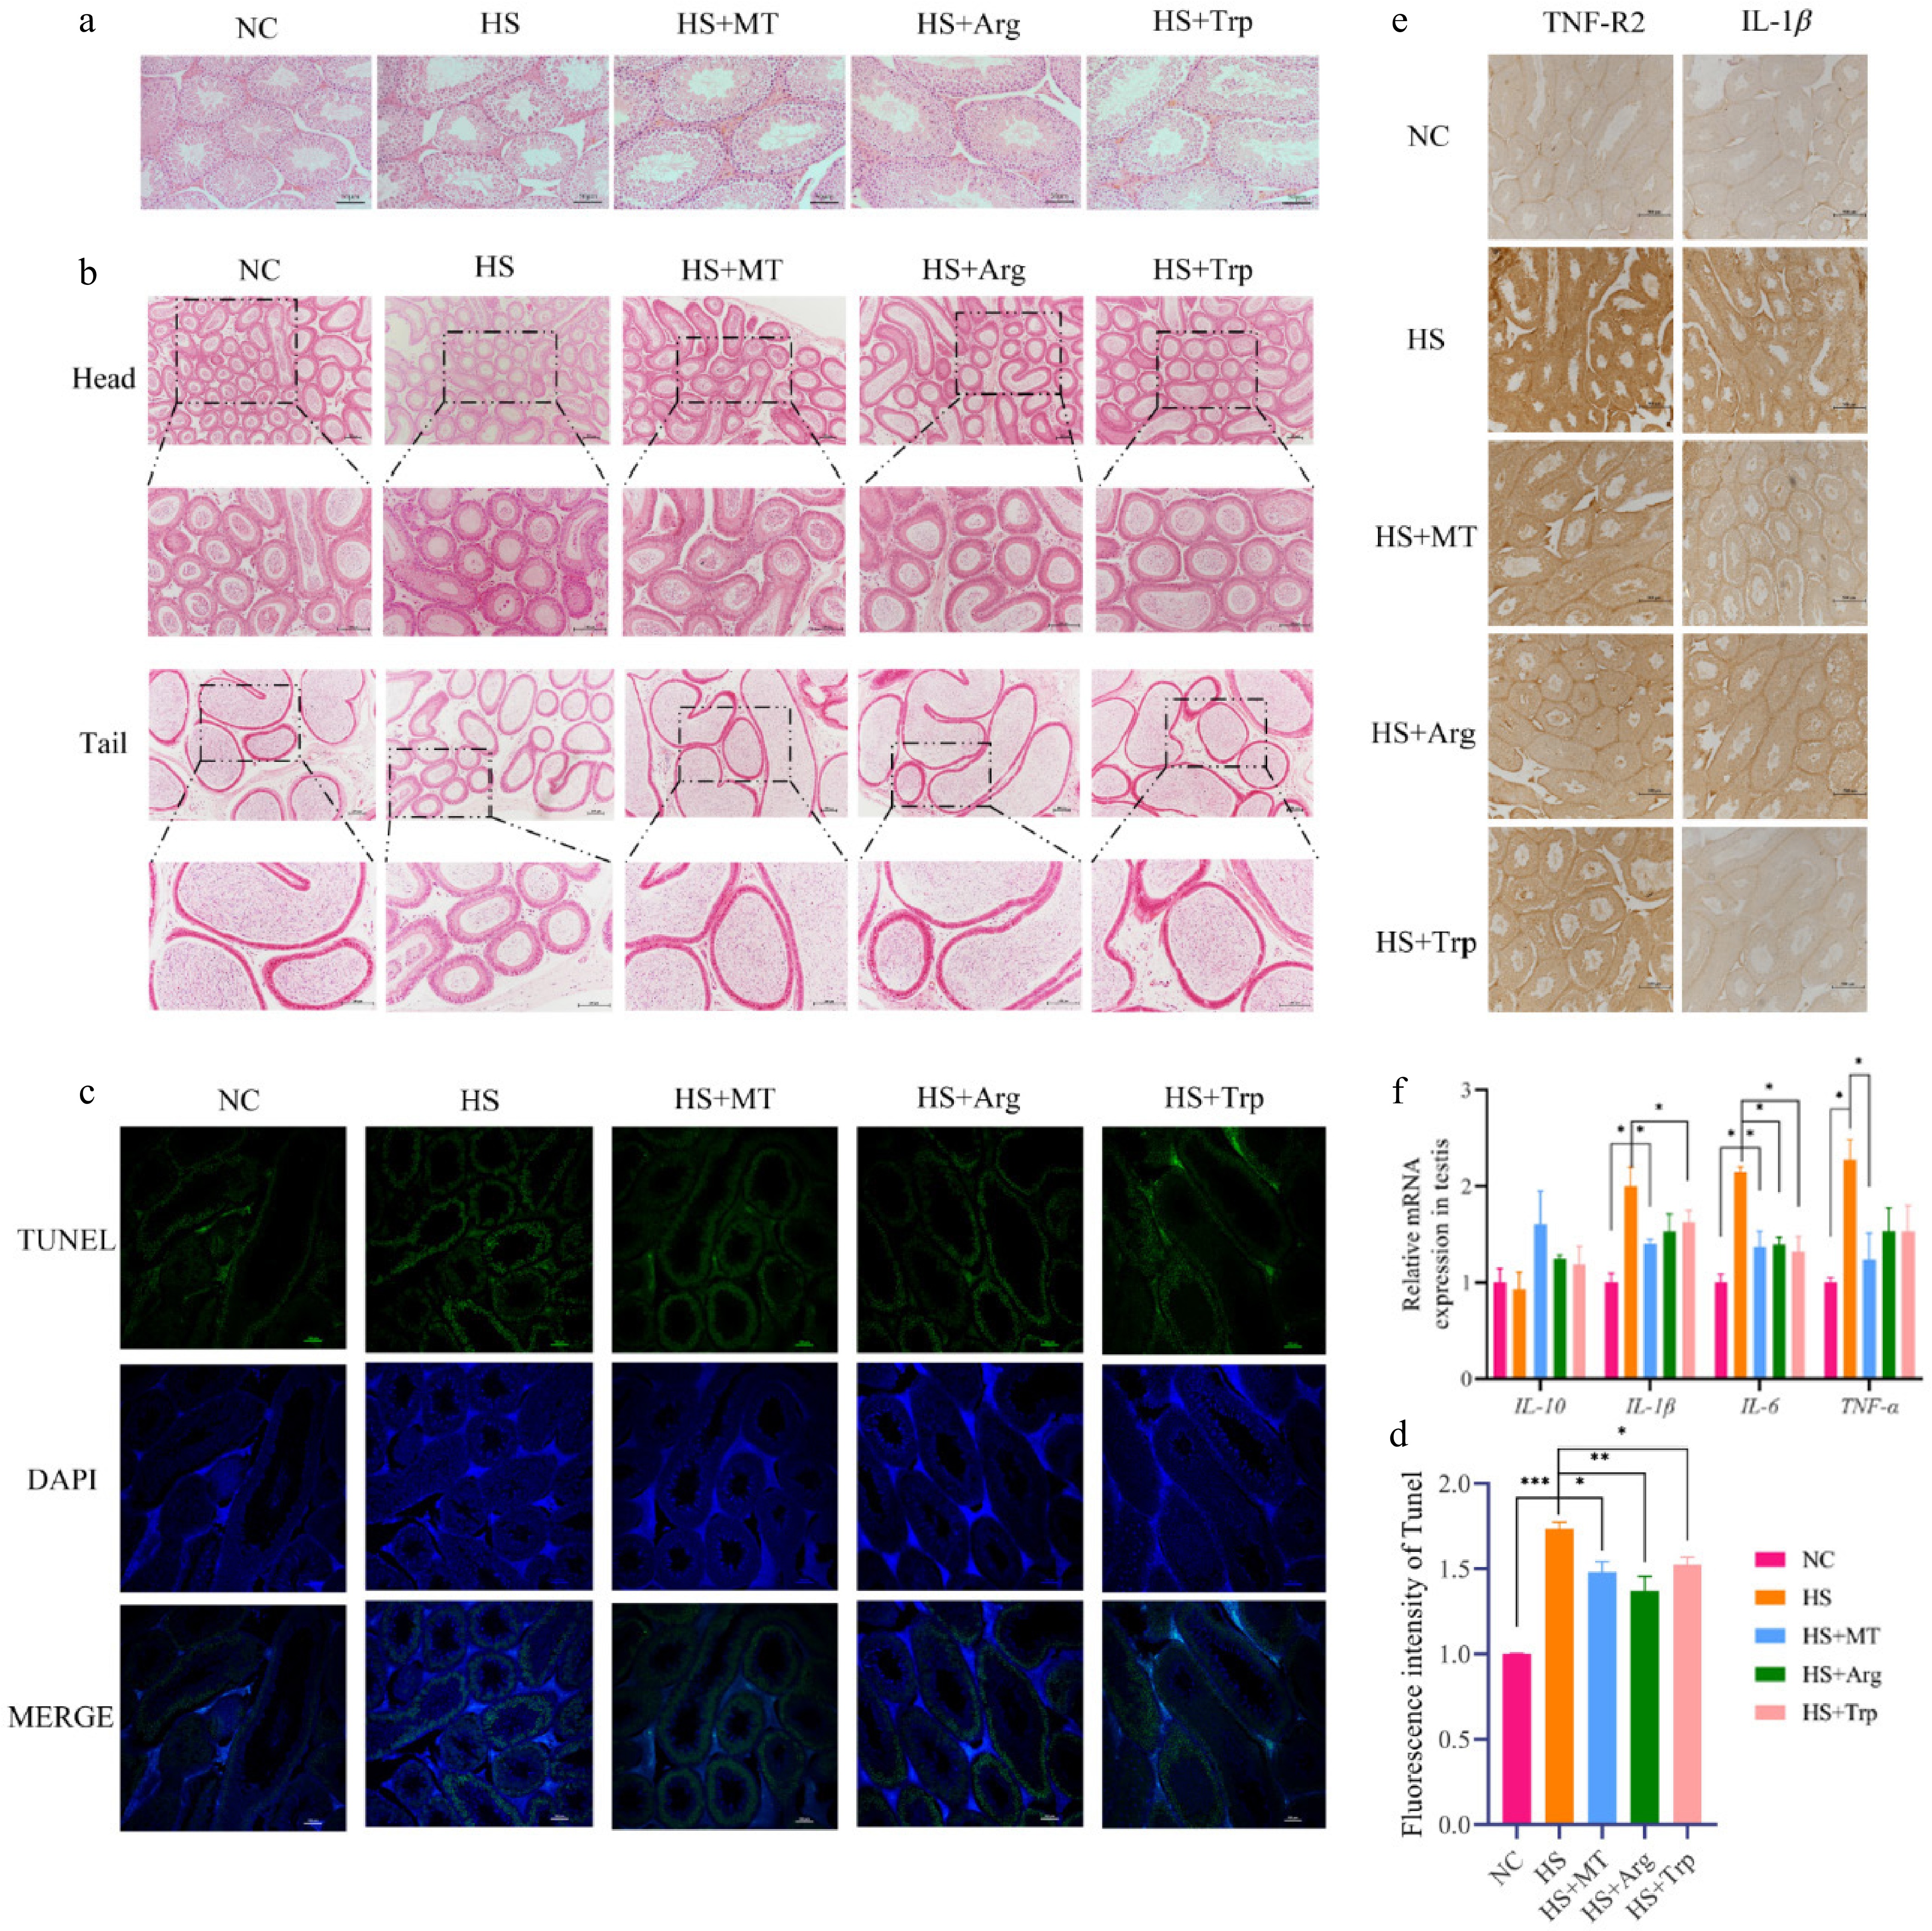
Figure 6.
Effects of arginine and tryptophan on testicular tissue in heat-stressed mice. (a) H&E staining of testicular tissue; scale bar = 50 μm. (b) H&E staining of epididymal tissue; scale bar = 100 μm. (c) TUNEL staining was used to detect testicular cell apoptosis (green); scale bar = 100 μm. (d) Expression of inflammation-related genes in testicular tissue. (e) Immunohistochemical detection of TNF-R2 and IL-1β; scale bar = 500 μm. Statistical significance was as follows: * p < 0.05, ** p < 0.01, *** p < 0.001.
-
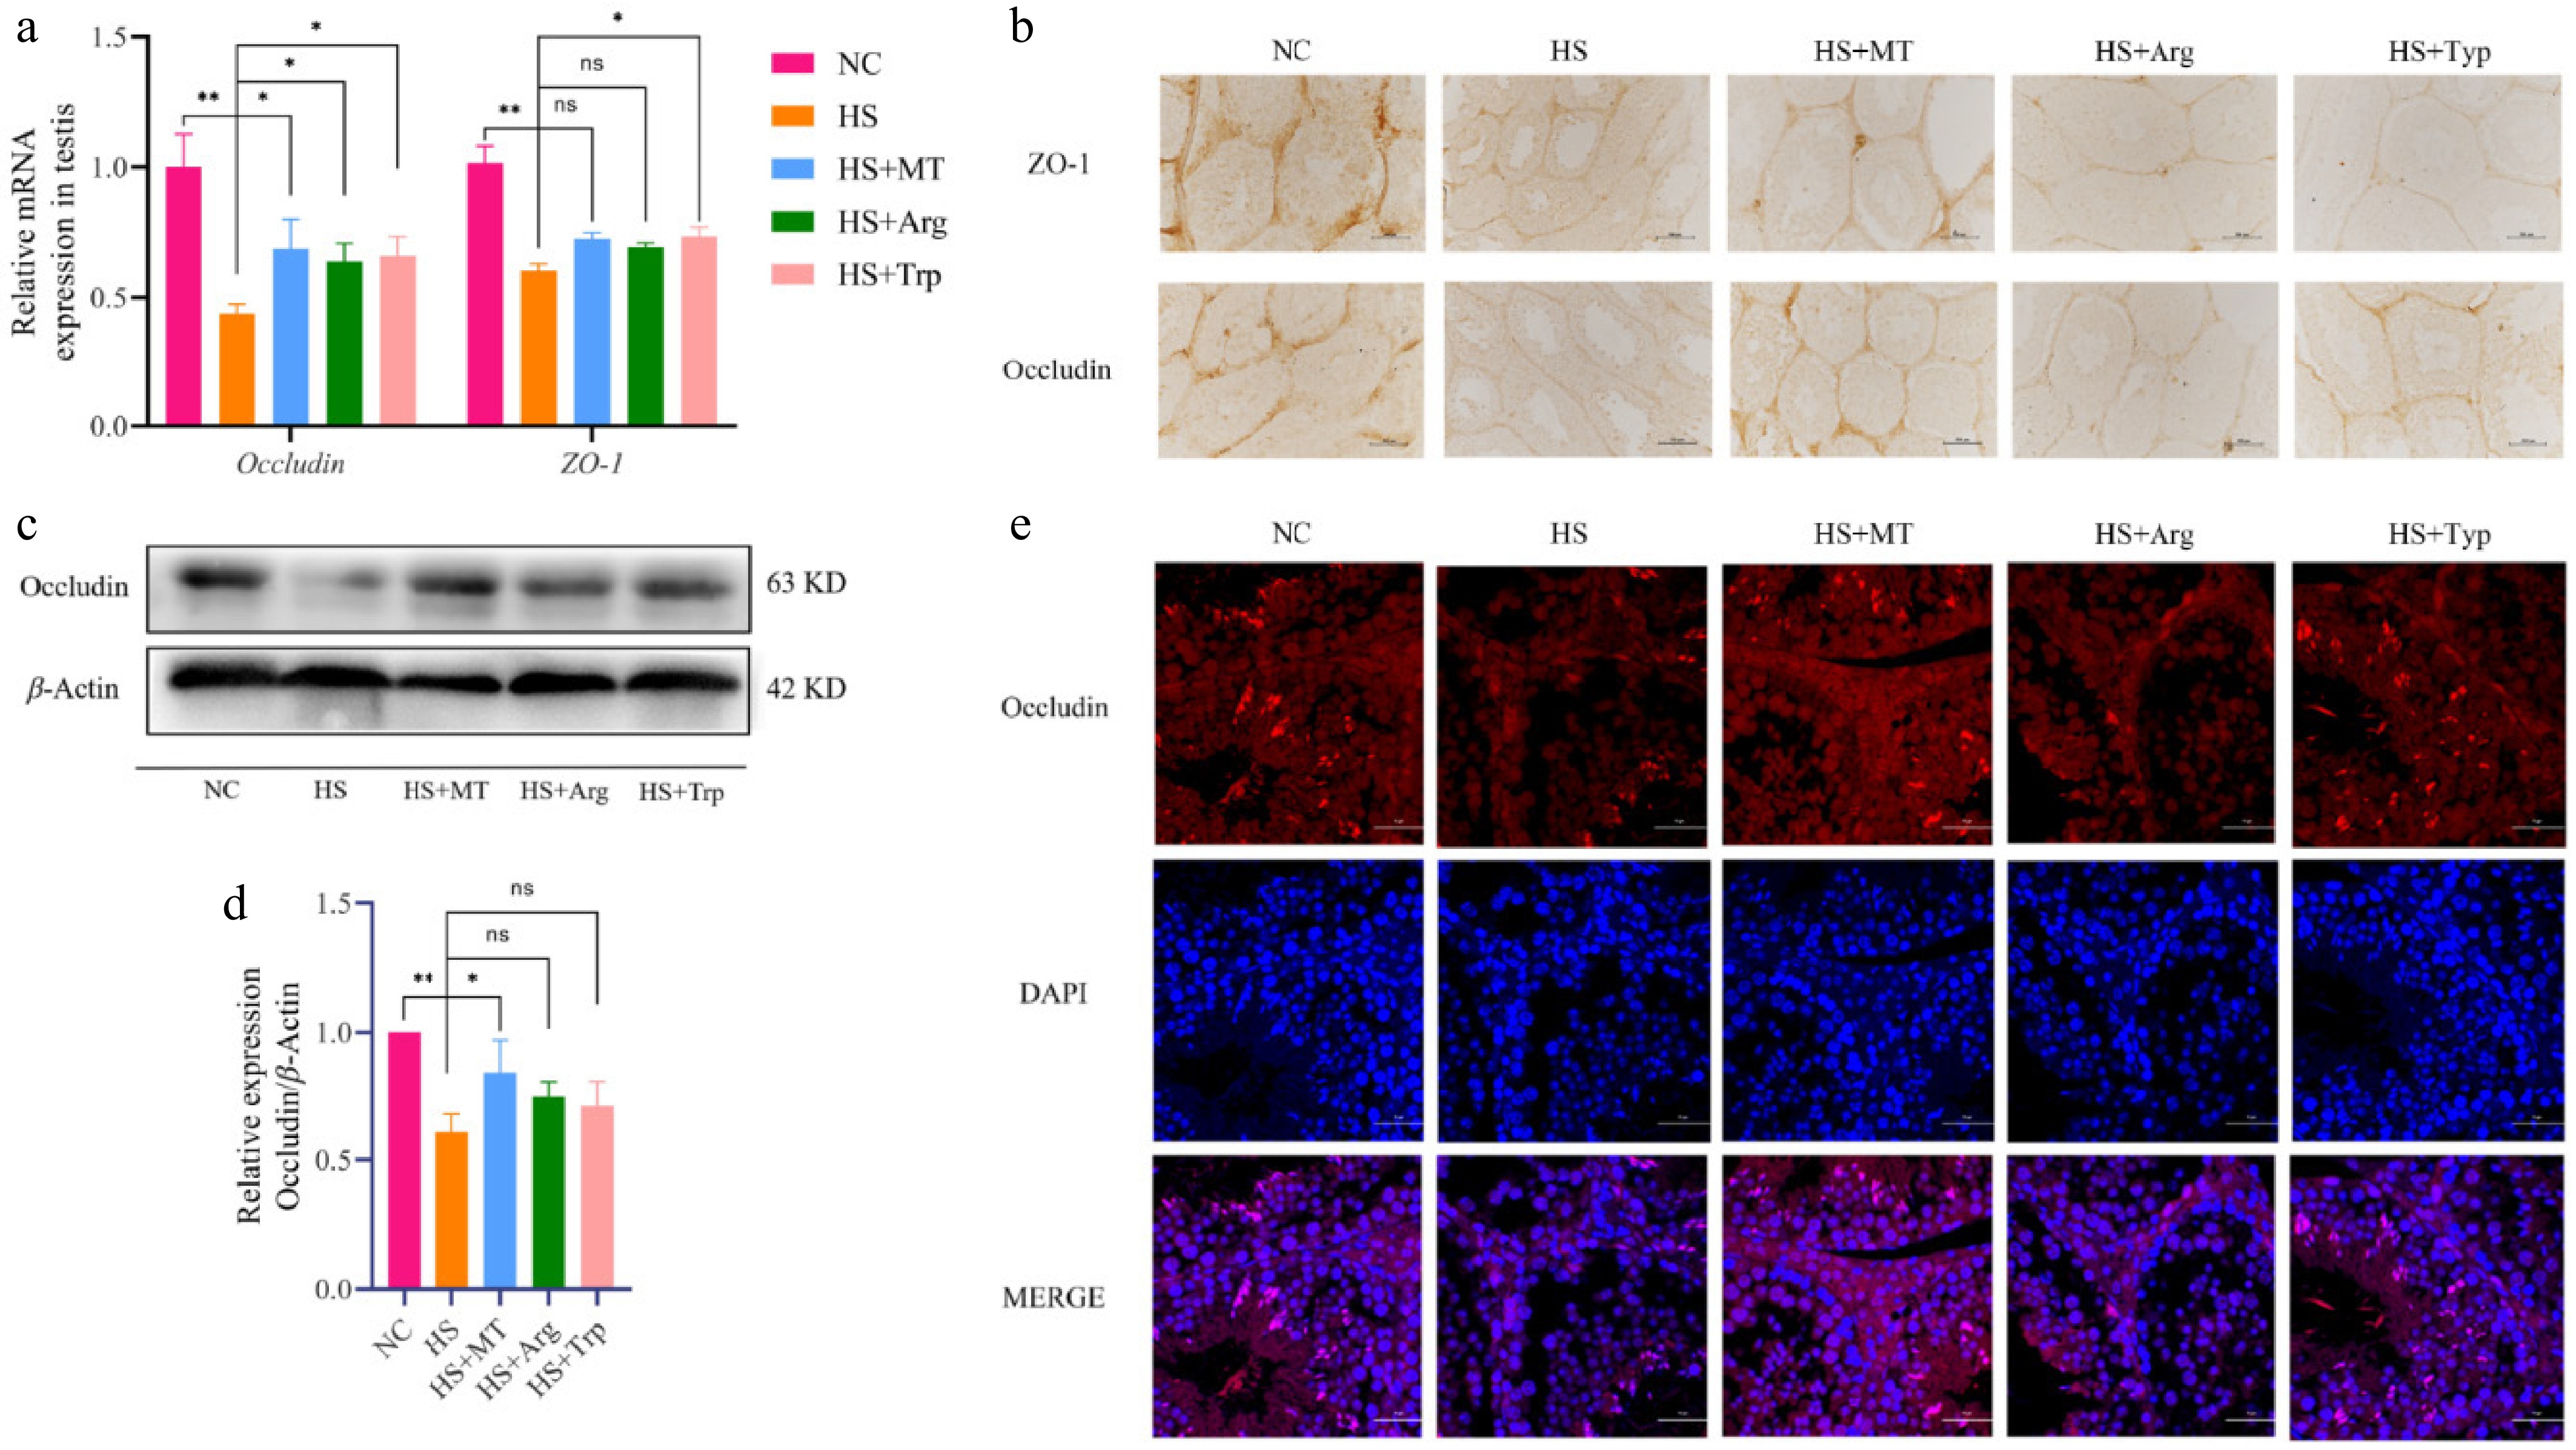
Figure 7.
Effects of arginine and tryptophan on the expression of tight junction-related genes and proteins in testicular tissue of heat-stressed mice. (a) mRNA expression levels of tight junction-related genes. (b) The expression levels of ZO-1 and occludin were analyzed using immunohistochemistry; scale bar = 500 μm. (c) Western blot analysis of protein expression of occludin in testicular tissues from each group. (d) Grayscale analysis of the proteins of occludin. (e) Immunofluorescence staining showing the localization of occludin (red) in testicular tissue, with the nuclei counterstained by DAPI (blue); scale bar = 20 μm. Statistical significance was as follows: * p < 0.05, ** p < 0.01; ns, no statistical significance.
-
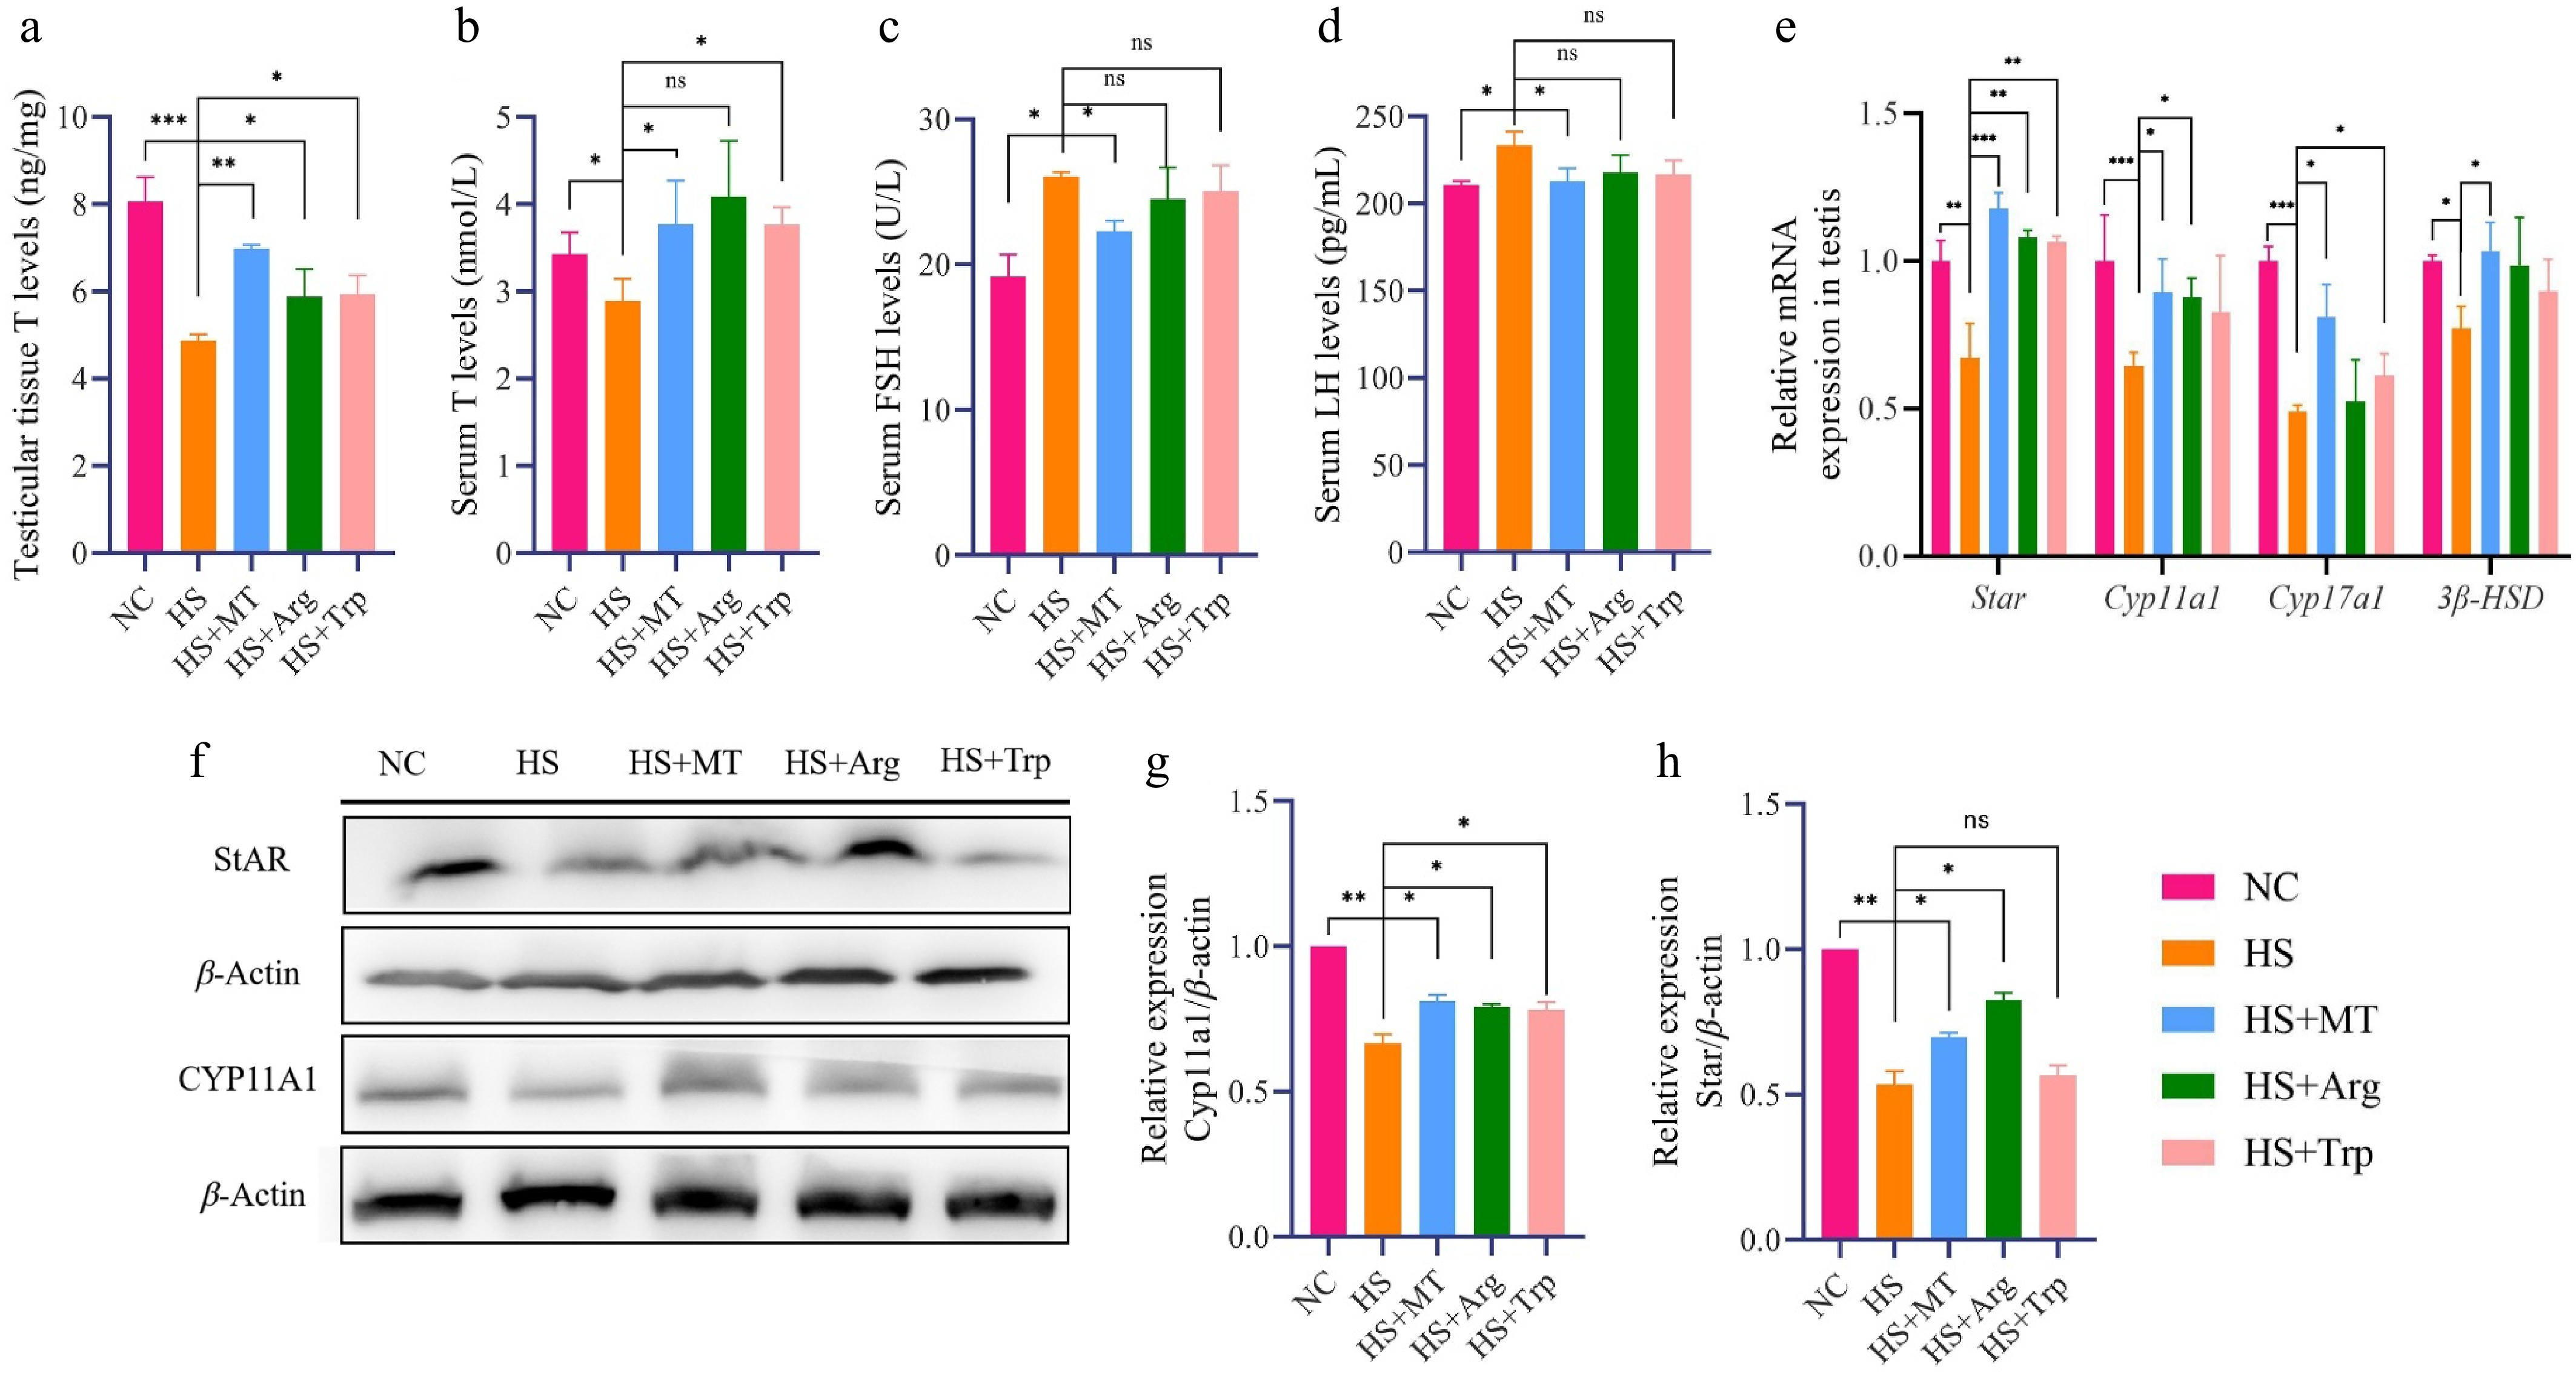
Figure 8.
Effects of arginine and tryptophan on the expression of testosterone synthesis-related genes and proteins in heat-stressed mice. (a) Testosterone concentrations in the testicular tissue of each group. (b) Serum testosterone (T) concentrations. (c) Serum FSH concentrations. (d) Serum LH concentrations. (e) RT-qPCR analysis of steroidogenesis-related gene expression levels in testicular tissue. (f) Western blot analysis of steroidogenic proteins in testicular tissue. (g) Grayscale analysis of the proteins of StAR. (h) Grayscale analysis of the proteins of CYP11A1. Statistical significance was as follows: * p < 0.05, ** p < 0.01, *** p < 0.001; ns, no statistical significance.
Figures
(8)
Tables
(0)