-
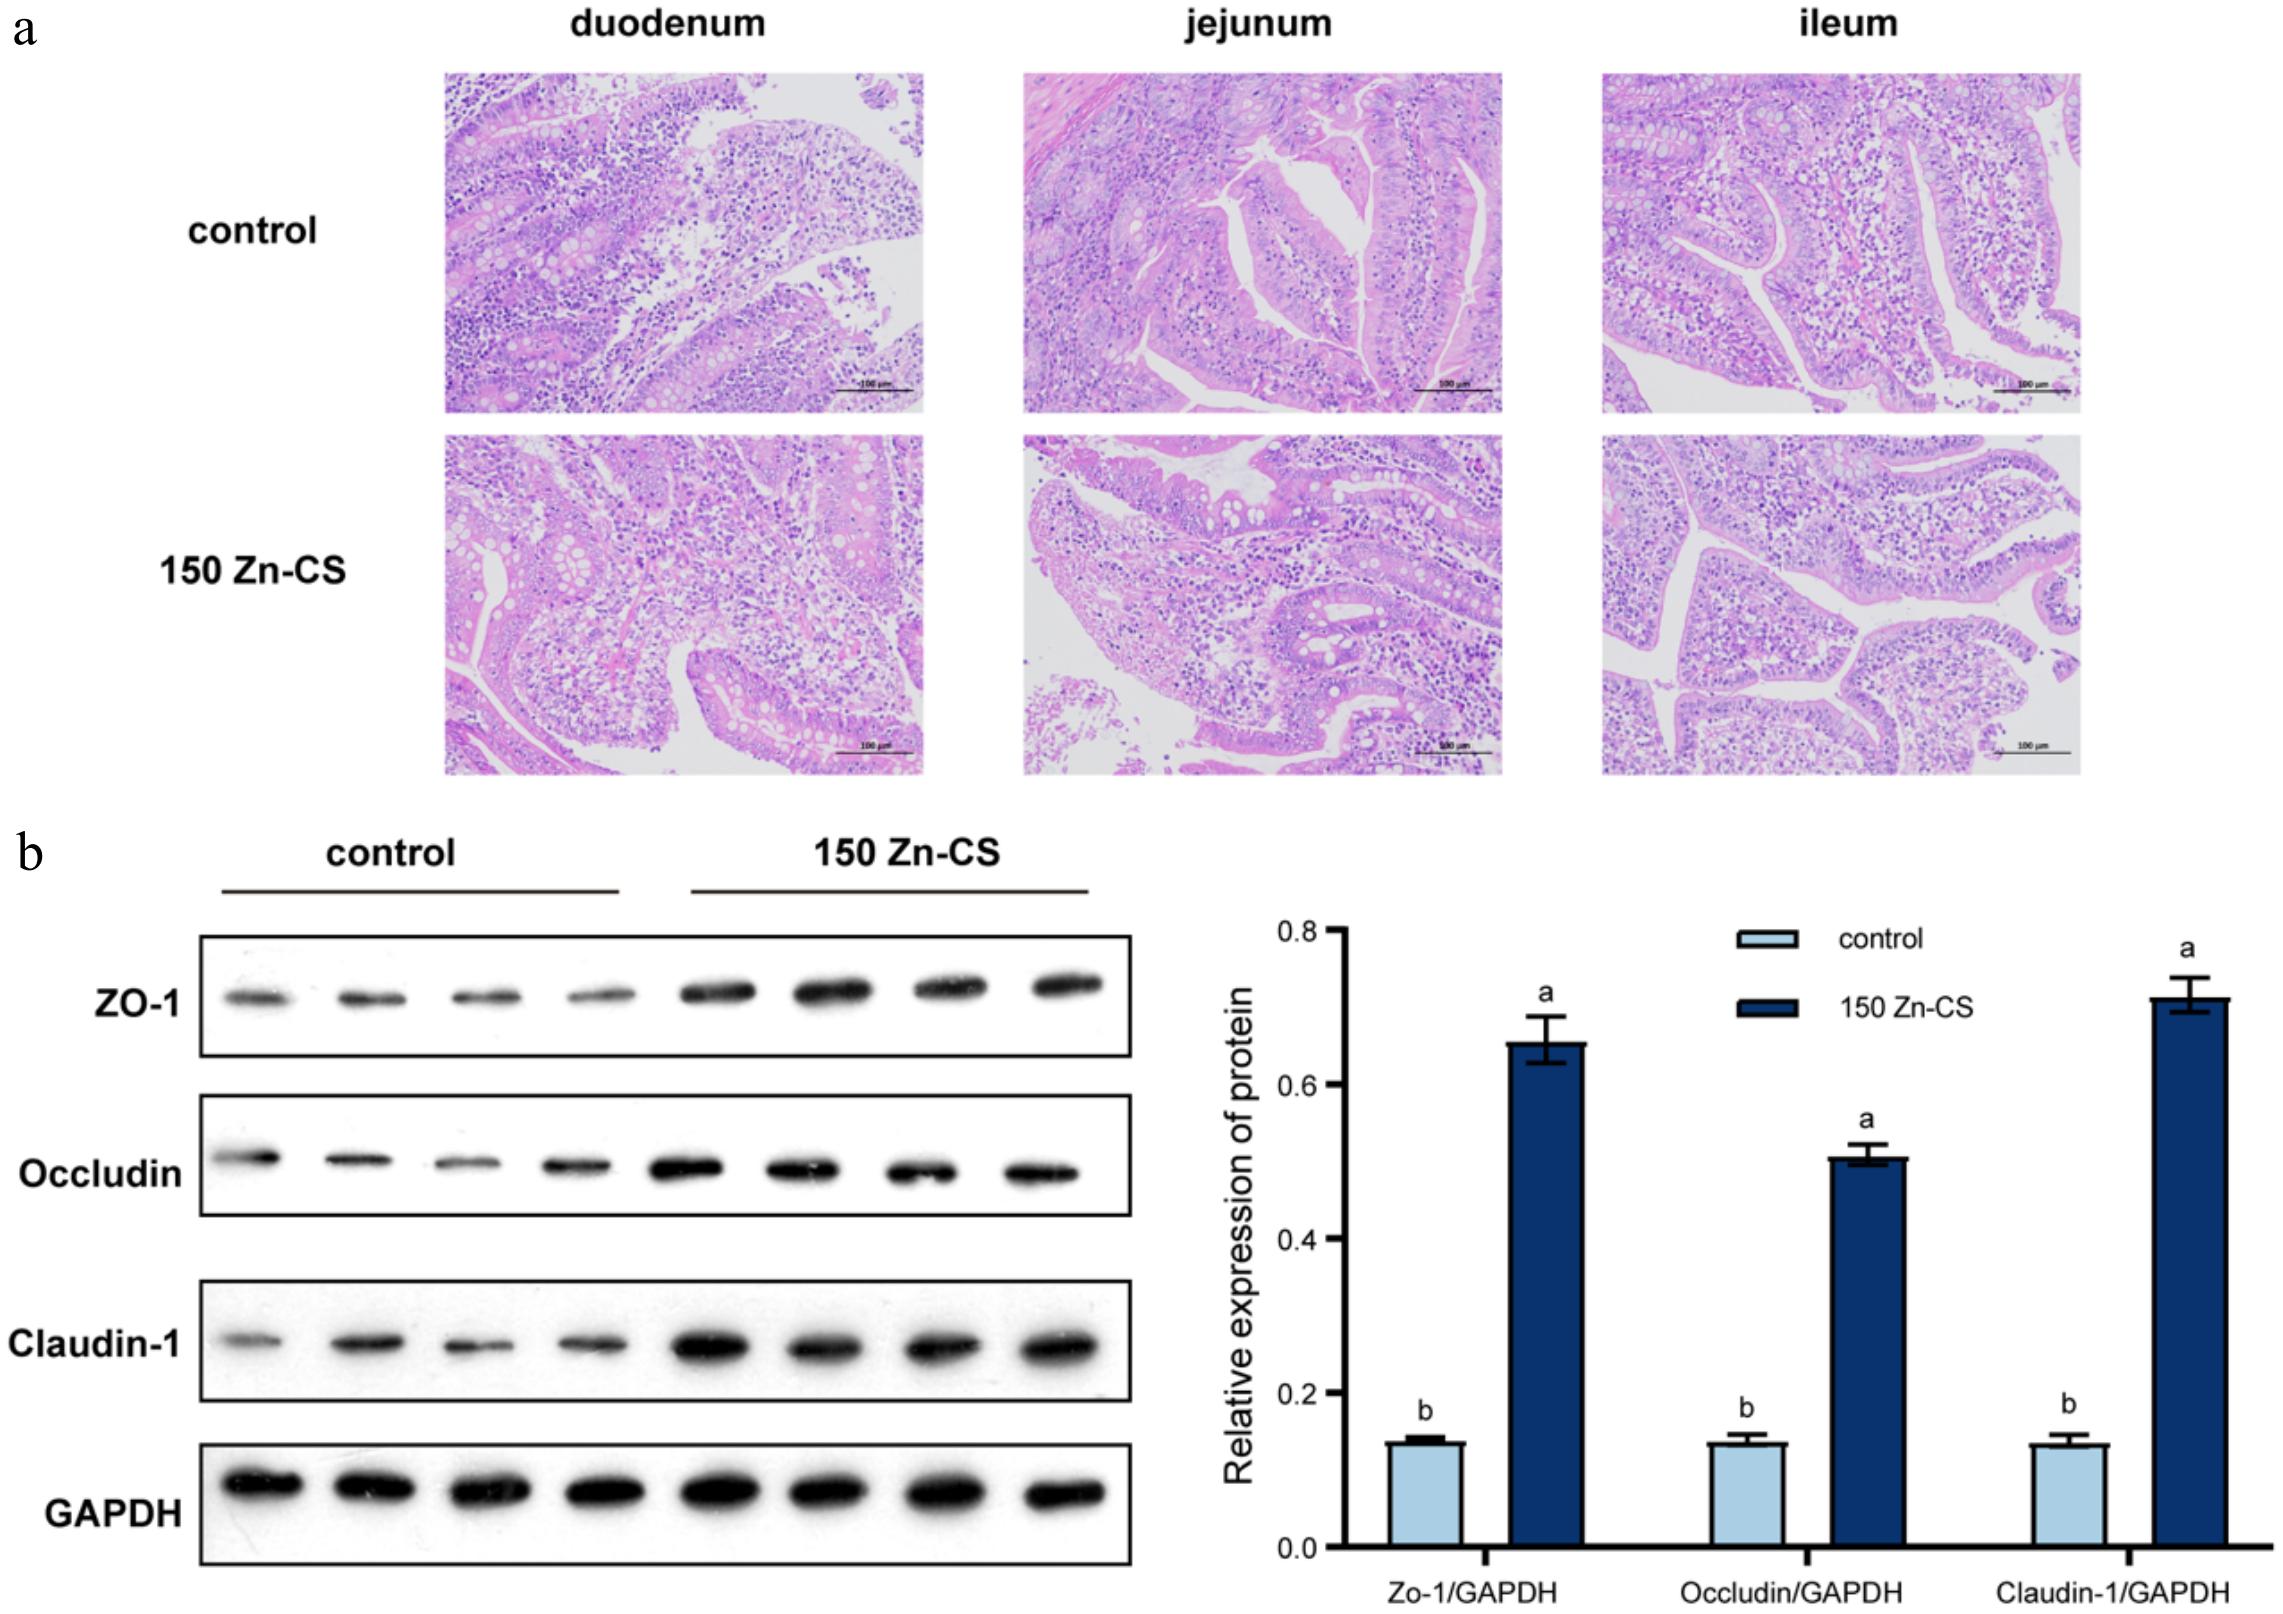
Figure 1.
Effects of Zn-CS supplementation on small intestinal morphology and the expression of jejunal tight junction proteins. (a) Representative histological images of the jejunum (H&E staining, 200× magnification). (b) The protein expression levels of ZO-1, occludin, and Claudin-1 in the jejunum were detected via Western blot analysis. Data are presented as the means ± SEM (n = 4). Different lowercase letters indicate significantly different values (p < 0.05, by analysis of variance).
-
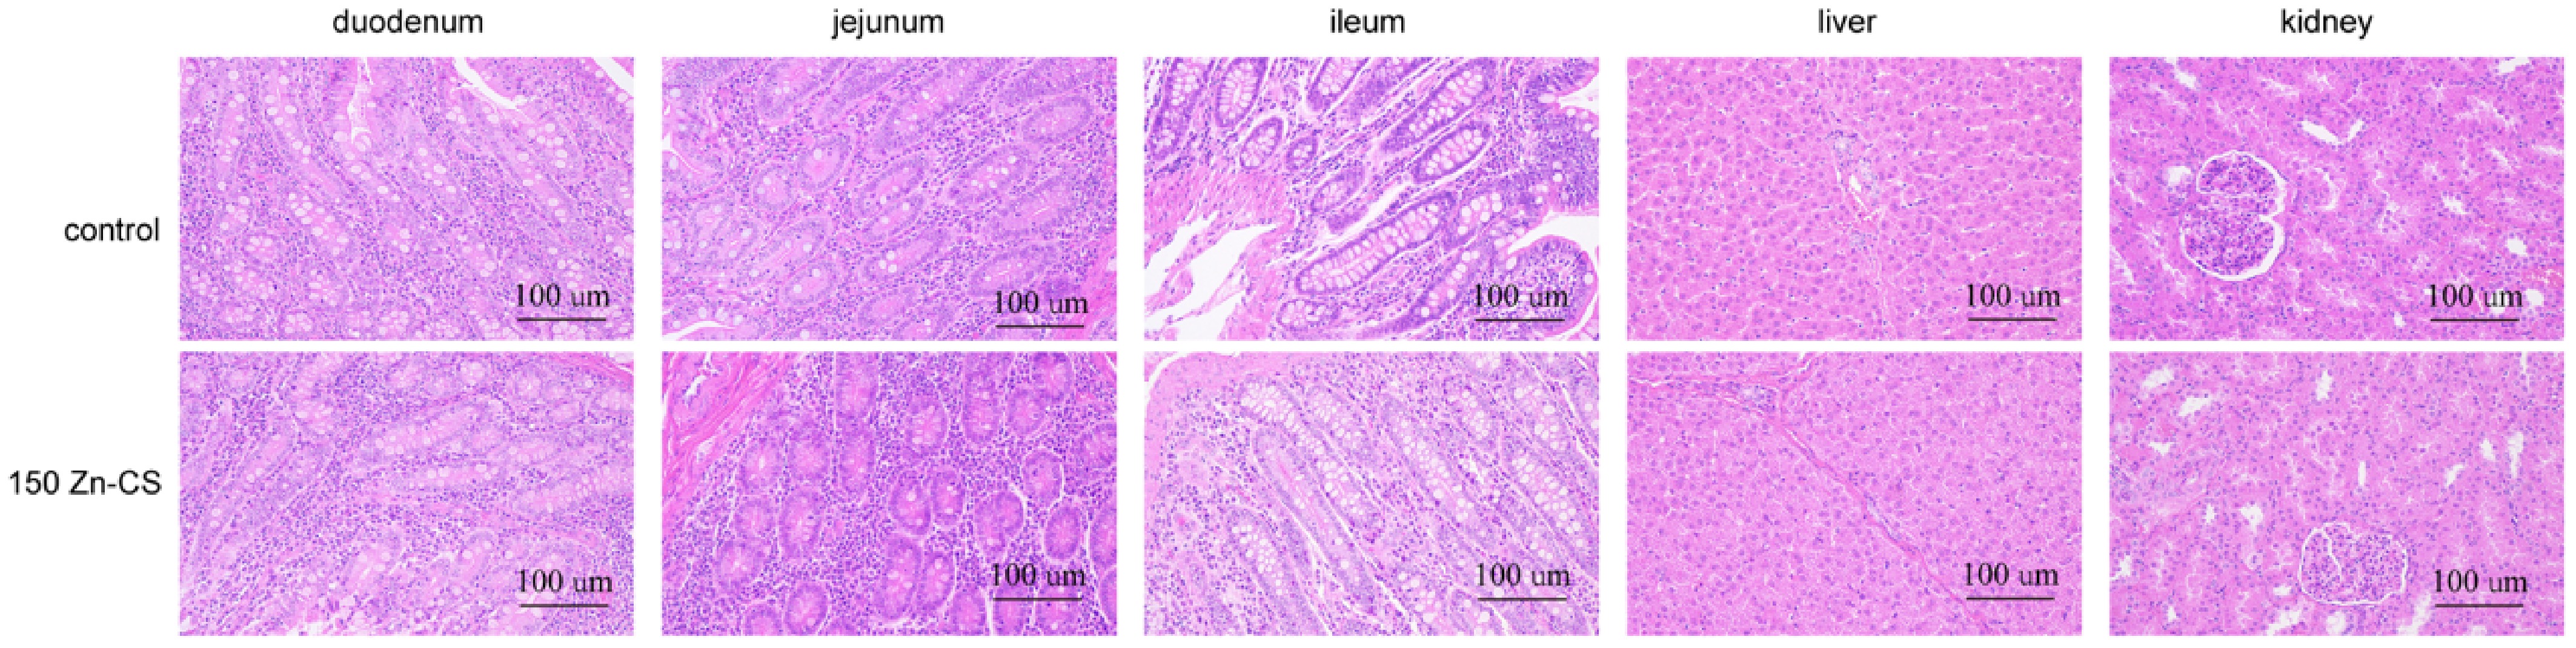
Figure 2.
Representative histological images of the small intestine, liver, and kidney with H&E staining (magnification: 200×).
-
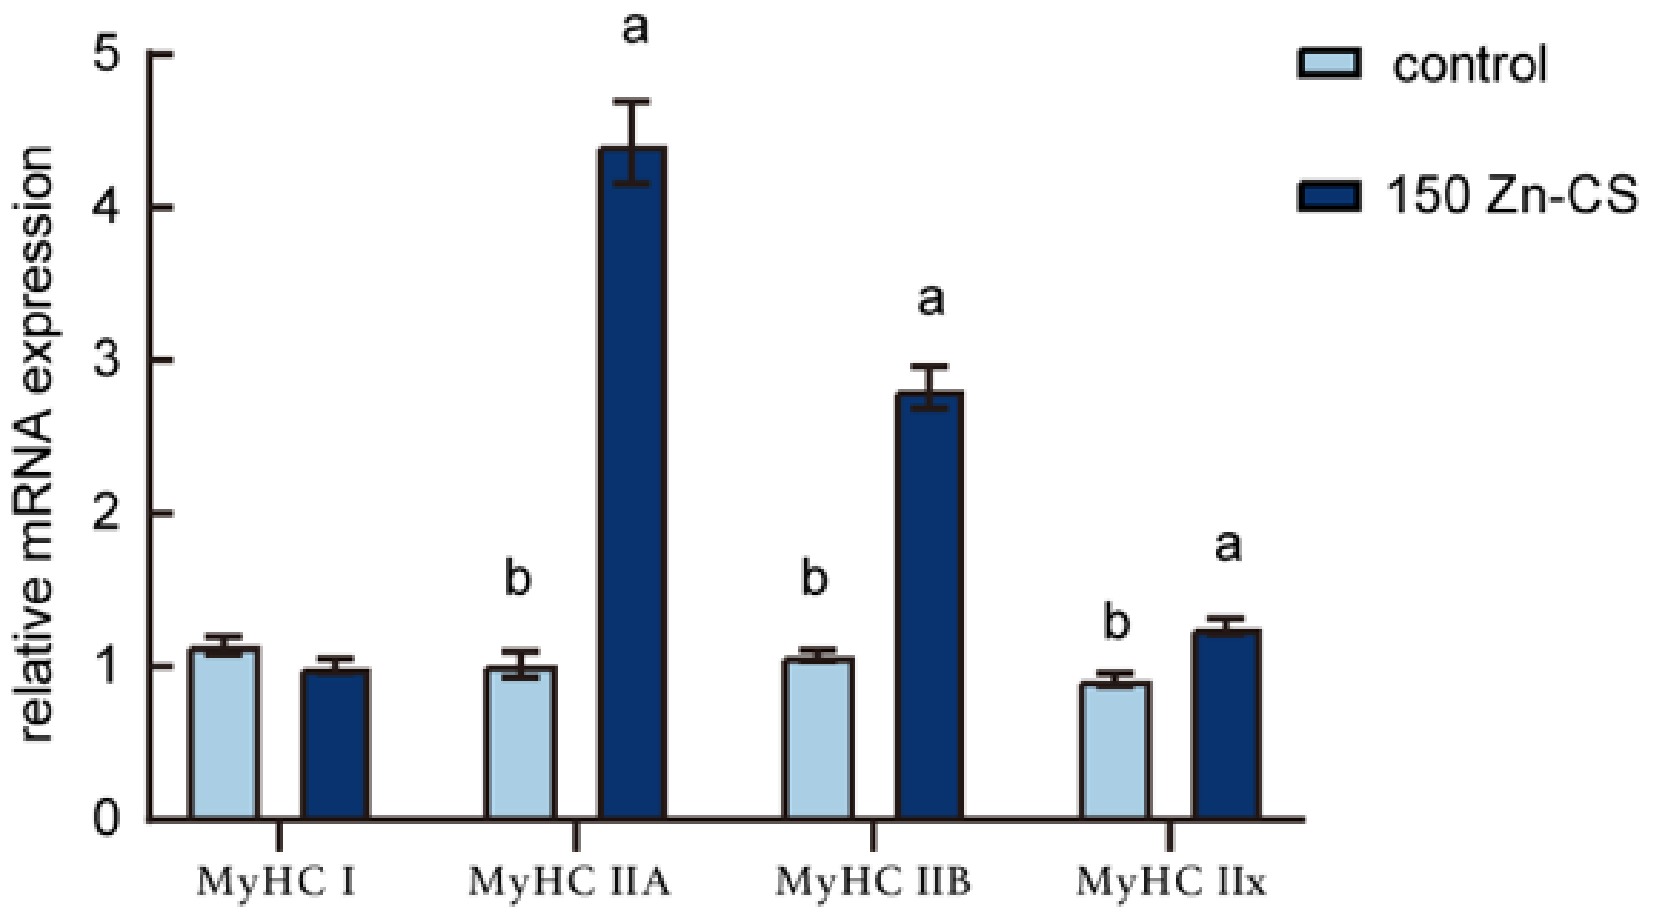
Figure 3.
Effects of Zn-CS supplementation on the mRNA expression of muscle fiber-related genes. Data are the means ± SEM (n = 6). Different lowercase letters indicate significantly different values (p < 0.05, by analysis of variance).
-
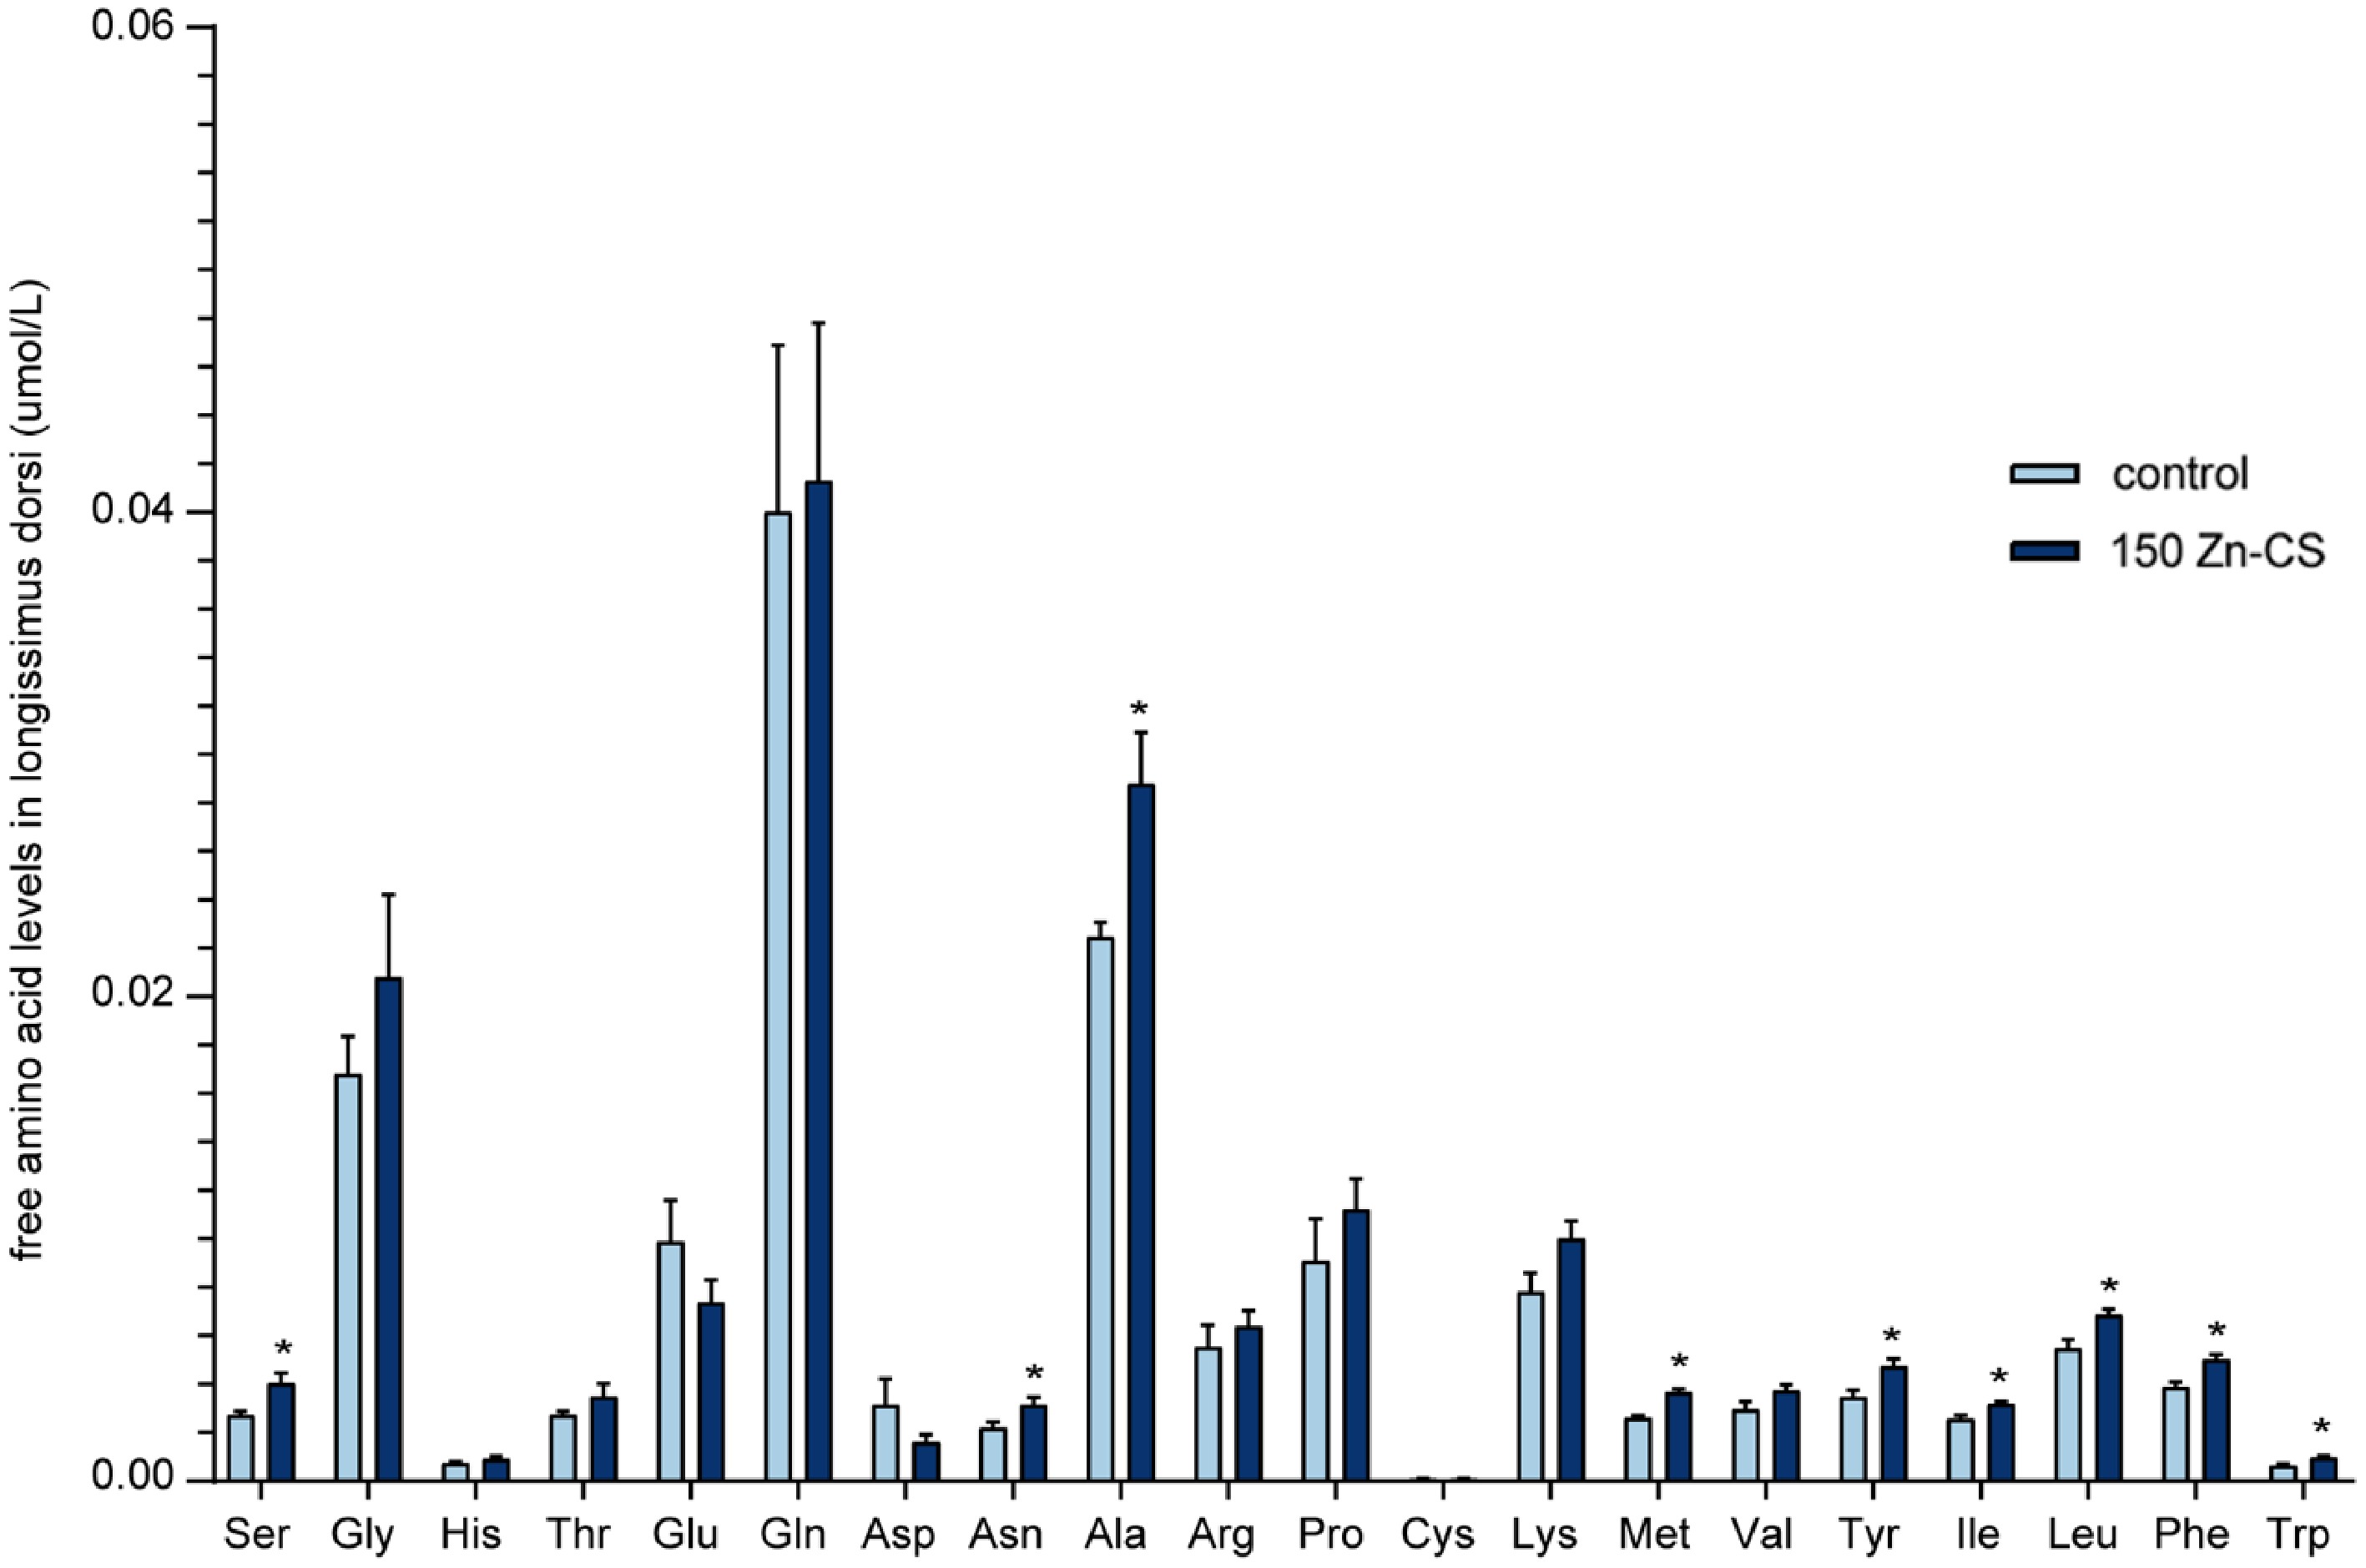
Figure 4.
Effects of Zn-CS supplementation on free amino acid concentrations in longissimus dorsi muscles. Data are the means (n = 6; *, p < 0.05, by analysis of variance). Ser, serine; Gly, glycine; His, histidine; Thr, threonine; Glu, glutamic acid; Gln, glutamine; Asp, aspartic acid; Asn, asparagine; Ala, alanine; Arg, arginine; Pro, proline; Cys, cysteine; Lys, lysine; Met, methionine; Val, valine; Tyr, tyrosine; Ile, isoleucine; Leu, leucine; Phe, phenylalanine; Trp, tryptophan.
-
Ingredients Period 1
0–14 dPeriod 2
15–28 dPeriod 3
29–143 dPeriod 4
144–192 dCorn 60.43 63.57 73.00 71.30 Soybean meal 10.45 12.85 15.10 13.34 Wheat flour 8.00 6.00 Extruded full-fat soybean 8.00 8.00 Wheat bran 4.00 2.30 8.00 12.00 Fish meal 2.00 Soybean oil 1.20 1.00 Limestone 0.77 0.85 1.56 1.61 Dicalcium phosphate 0.75 0.98 0.44 0.35 Sodium chloride 0.40 0.45 0.40 0.40 Premix1 4.00 4.00 1.50 1.00 Calculated nutritional levels CP (%) 17.00 16.50 14.50 14.00 DM (%) 86.64 86.64 86.46 86.46 Ash (%) 4.78 4.71 4.52 4.58 NFE (%) 56.47 57.44 61.48 61.57 EE (%) 5.55 5.21 2.87 2.89 CF (%) 2.84 2.79 3.09 3.42 Ca (%) 0.60 0.60 0.75 0.75 Total P (%) 0.51 0.51 0.40 0.40 GE (kcal/kg) 3,894 3,873 3,777 3,774 Lysine (%) 1.2000 1.2068 0.9606 0.8906 Methionine (%) 0.4043 0.4121 0.2831 0.2492 Threonine (%) 0.8418 0.8156 0.6496 0.5858 Tryptophan (%) 0.2713 0.2648 0.1594 0.1414 1 The premix provided the following per kg of complete diet. Periods 1 and 2: vitamin A, 16,000 IU; vitamin D3, 5,000 IU; vitamin E, 24.0 IU; vitamin K3, 2.8 mg; vitamin B1, 1.2 mg; vitamin B2, 7.35 mg; vitamin B6, 1.14 mg; niacinamide, 35.0 mg; pantothenic acid, 19.85 mg; folacin, 0.7 mg; biotin, 70.00 μg; Fe, 450.0 mg; Cu, 125.0 mg; Mn, 150.0 mg; I, 0.625 mg; Se, 0.5 mg. Period 3: vitamin A, 65,000 IU; vitamin D3, 5,000 IU; vitamin E, 13.6 IU; vitamin K3, 1.4 mg; vitamin B1, 0.7 mg; vitamin B2, 4.6 mg; vitamin B6, 0.75 mg; niacinamide, 16.0 mg; pantothenic acid, 10 mg; Fe, 350.0 mg; Cu, 25.0 mg; Mn, 150.0 mg; Se, 0.5 mg. Period 4: vitamin A, 5,200 IU; vitamin D3, 4,000 KIU; vitamin E, 10.88 IU; vitamin K3, 1.12 mg; vitamin B1, 0.56 mg; vitamin B2, 3.68 mg; vitamin B6, 0.6 mg; niacinamide, 12.8 mg; pantothenic acid, 8.0 mg; Fe, 280.0 mg; Cu, 20.0 mg; Mn, 120.0 mg; Se, 0.4 mg. NFE, nitrogen-free extract; CF, crude fiber. Table 1.
Ingredient composition and nutrient content of the basal diet (as-fed basis, %).
-
Antigen Host Dilution Source Cat# Occludin Rabbit 1:40,000 Proteintech 80545-1-RR Claudin-1 Rabbit 1:3,000 Proteintech 28674-1-AP ZO-1 Rabbit 1:10,000 Proteintech 21773-1-AP GAPDH Rabbit 1:10,000 Proteintech 10494-1-AP Table 2.
Primary and secondary antibodies used for Western blot labeling.
-
Gene Primer sequence (5'–3') MHC I Forward (F): CGTGGACTACAACATCATAGGC Reverse (R): CTTTGCCCTTCTCAACAGGT MHC IIa F: GGAGATCGACGACCTTGCTA R: CTCCTTGGATTTCAGCTCGC MHC IIx F: GAAACCGTCAAGGGTCTACG R: CGCTTCCTCAGCTTGTCTCT MHC IIb F: GTTCTGAAGAGGGTGGTAC R: AGATGCGGATGCCCTCCA GAPDH F: CTGCCGCCTGGAGAAACCT R: GCTGTAGCCAAATTCATTGTCG Table 3.
Primers for real-time PCR.
-
Items Zn-CS (mg/kg diet) SEM1 p-value Linear Quadratic 0 150 300 450 BW 0 d (kg) 10.20 10.12 10.04 10.10 0.333 > 0.99 0.9 0.92 14 d (kg) 15.95 17.17 17.29 16.04 0.357 0.62 0.93 0.2 28 d (kg) 22.77 24.54 23.67 23.07 0.391 0.72 0.99 0.33 192 d (kg) 105.08 109.15 110.58 101.63 1.79 0.36 0.25 0.56 0–14 d ADG (g) 411b 504ab 518a 424b 27 < 0.01 0.58 < 0.01 ADFI (g) 661 664 683 620 13 0.56 0.47 0.3 F:G 1.61a 1.32b 1.32b 1.47ab 0.069 < 0.01 0.06 < 0.01 14–28 d ADG (g) 487 527 455 502 15 0.23 0.8 0.88 ADFI (g) 870 926 823 877 21 0.59 0.73 0.99 F:G 1.80 1.78 1.81 1.75 0.013 0.98 0.82 0.87 0–28 d ADG (g) 449 515 486 463 15 0.10 0.87 0.03 ADFI (g) 773 804 757 757 11 0.81 0.6 0.69 F:G 1.73 1.57 1.56 1.63 0.039 0.24 0.28 0.08 Means in the same row with different superscript letters differ (p < 0.05, n = 6). BW, body weight; SEM, standard error of the mean; ADFI, average daily feed intake; ADG, average daily gain; F:G, feed-to-gain ratio. Table 4.
Effects of dietary Zn-CS supplementation on growth performance.
-
Items Zn-CS (mg/kg diet) SEM p-value 0 150 300 450 DM 82.35c 85.49b 89.44a 81.00c 1.88 < 0.01 CP 75.87c 80.84b 85.64a 74.88c 2.48 < 0.01 EE 82.36b 87.06a 89.14a 80.75b 1.96 < 0.01 Ca 50.76c 63.65b 74.31a 47.93c 6.10 < 0.01 P 59.55c 67.52b 76.27a 57.12c 4.33 < 0.01 Means in the same row with different superscript letters differ (p < 0.05, n = 6). DM, dry matter; CP, crude protein; EE, ether extract; Ca, calcium; P, phosphorus. Table 5.
Effects of dietary Zn-CS supplementation apparent total tract digestibility (ATTD, %) of DM, CP, EE, Ca, and P in weaned piglets.
-
Items Zn-CS (mg/kg diet) SEM p-value 0 150 Pathological score Duodenum 2.80 3.00 0.60 0.13 Jejunum 3.17 3.33 0.27 0.55 Ileum 3.17 3.00 0.60 0.79 Villus height (mm) Duodenum 0.46 0.54 0.06 0.27 Jejunum 0.47b 0.58a 0.04 0.01 Ileum 0.35 0.38 0.05 0.52 Crypt depth (mm) Duodenum 0.47 0.44 0.05 0.63 Jejunum 0.37 0.36 0.03 0.85 Ileum 0.24 0.30 0.04 0.10 Villus height/
crypt depthDuodenum 1.03 1.23 0.17 0.27 Jejunum 1.30b 1.73a 0.16 0.02 Ileum 1.49 1.28 0.19 0.27 Means in the same row with different superscript letters differ (p < 0.05, n = 6). Table 6.
Effects of dietary Zn-CS supplementation on small intestine health indices (D 28).
-
Items Zn-CS (mg/kg diet) SEM p-value 0 150 300 450 Day 14 Glucose (mmol/L) 5.27 4.90 4.92 5.72 0.19 0.20 T3 (nmol/L) 2.05 2.28 2.13 2.52 0.10 0.52 T4 (nmol/L) 64.17 69.67 68.02 67.13 1.15 0.96 Day 28 Insulin (mU/L) 0.74 1.57 0.41 0.20 Glucose (mmol/L) 6.22 6.58 0.18 0.30 T3 (nmol/L) 2.69 3.00 0.16 0.31 T4 (nmol/L) 91.40 101.40 5.00 0.35 Means in the same row with different superscript letters differ (p < 0.05, n = 6). T3, tri-iodothyronine; T4, thyroxine. Table 7.
Effects of dietary Zn-CS supplementation on serum hormone levels.
-
Items Zn-CS (mg/kg diet) SEM p-value 0 150 Villus height (μm) Duodenum 830.3 839.6 137.6 >0.99 Jejunum 607.3 594.1 97.92 0.89 Ileum 607.3 597.4 95.66 0.92 Crypt depth (μm) Duodenum 724.1 605 57.86 0.06 Jejunum 547.0 488.8 69.86 0.42 Ileum 547.0a 370.9b 55.62 0.01 Villus height/
crypt depthDuodenum 1.19 1.39 0.21 0.37 Jejunum 1.29 1.32 0.44 0.94 Ileum 1.29 1.65 0.42 0.40 Means in the same row with different superscript letters differ (p < 0.05, n = 6). Table 8.
Effects of dietary Zn-CS supplementation on villus height and crypt depth in the small intestine of finished pigs.
-
Items Zn-CS (mg/kg diet) SEM p-value 0 150 Carcass weight (kg) 74.93 92.57 8.82 < 0.01 Dressing percentage (%) 71.38 71.73 0.18 0.78 Straight carcass length (cm) 77.67 83.83 3.08 < 0.01 Diagonal carcass length (cm) 74.50 80.33 2.92 < 0.01 Longissimus dorsi length (cm) 102.02 98.74 1.64 0.68 Longissimus dorsi width (cm) 38.12 41.84 1.86 0.14 Loin eye area (cm2) 27.15 28.94 0.90 0.50 Deltoid muscle length (cm) 91.37 91.36 < 0.01 0.99 Deltoid muscle width (cm) 20.13 17.86 1.13 0.43 Back fat depth (mm) Shoulder fat thickness 41.44 42.77 0.66 0.56 Last rib fat thickness 25.73 26.95 0.61 0.71 Lumbosacral fat thickness 18.83 18.81 0.01 0.99 pH3h 6.08 5.87 0.10 0.35 pH24h 5.93 6.12 0.10 < 0.01 Flesh color score 74.43 78.18 1.88 0.30 Drip loss (%) 4.13 4.01 0.06 0.76 Shear force (N) 54.89 64.10 4.60 0.34 Means in the same row with different superscript letters differ (p < 0.05, n = 6). Indicators with significant differences are displayed in bold. Table 9.
Effects of dietary Zn-CS supplementation on the carcass traits and meat quality of finished pigs.
Figures
(4)
Tables
(9)