-
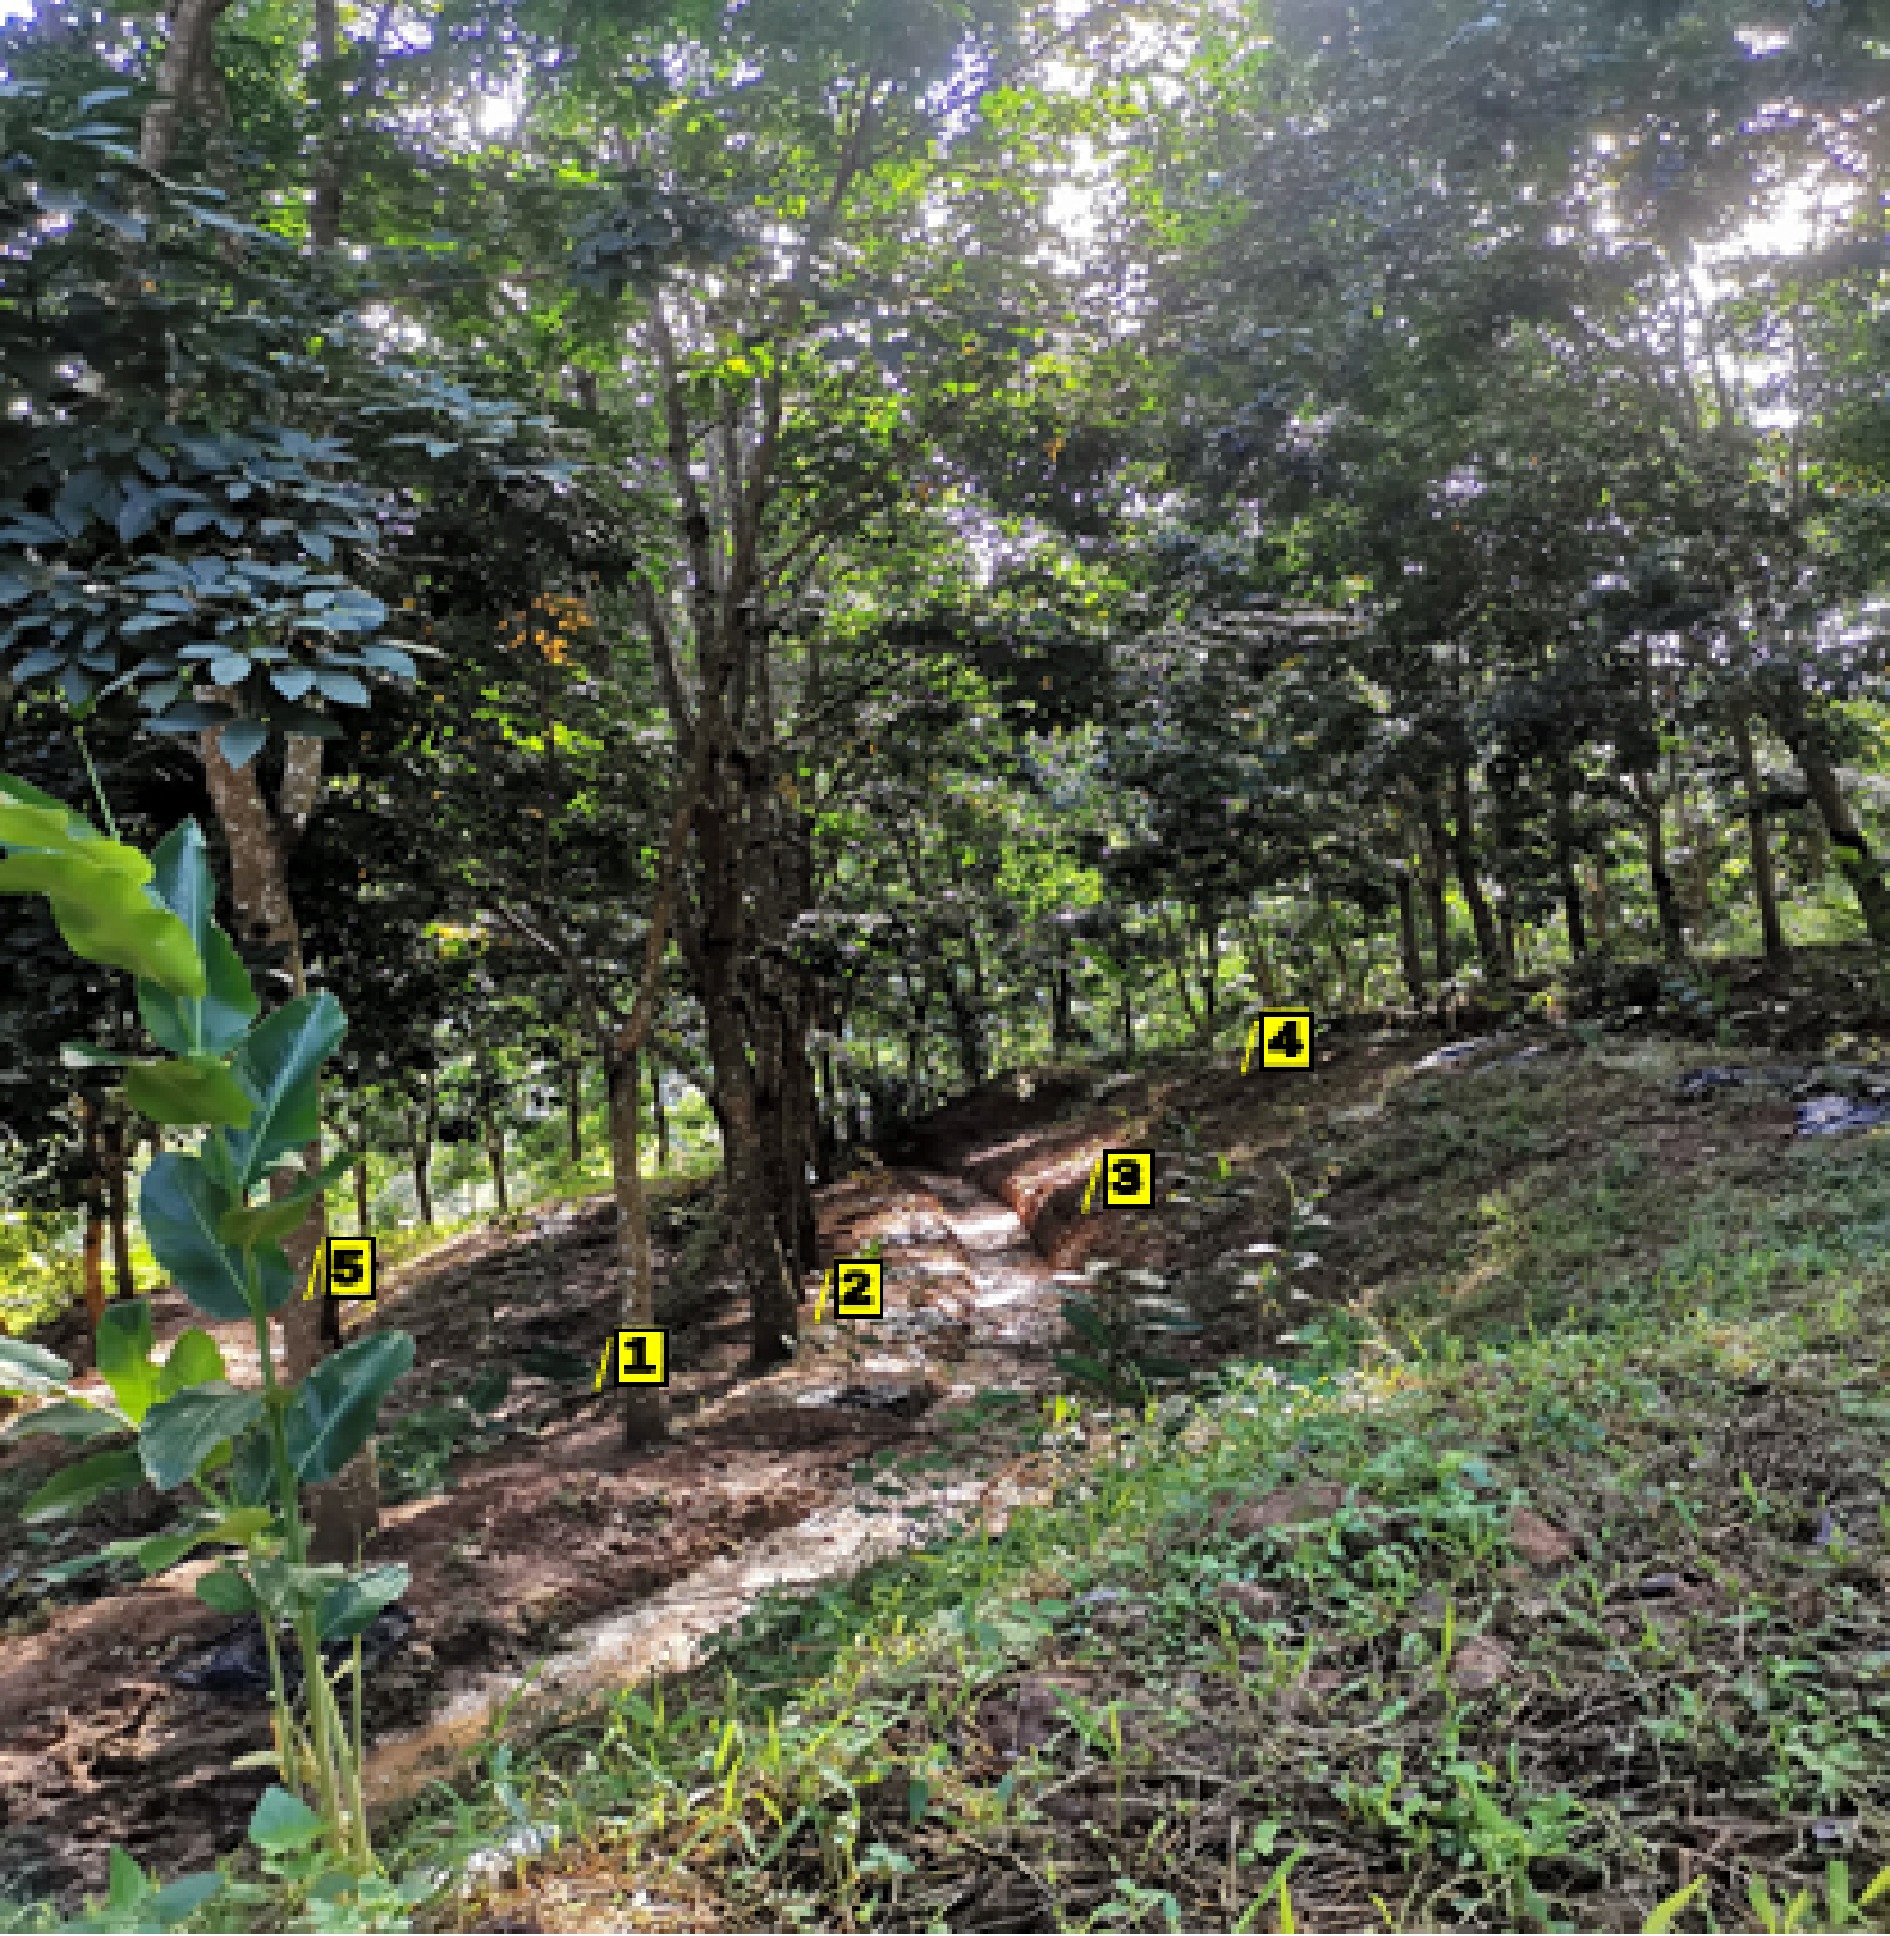
Figure 1.
Soil sampling diagram in an irrigated rubber forest in the dry season. 1, Platform between plants; 2, irrigation ditch edge; 3, wide slope bottom; 4, wide slope middle; 5, narrow slope middle.
-
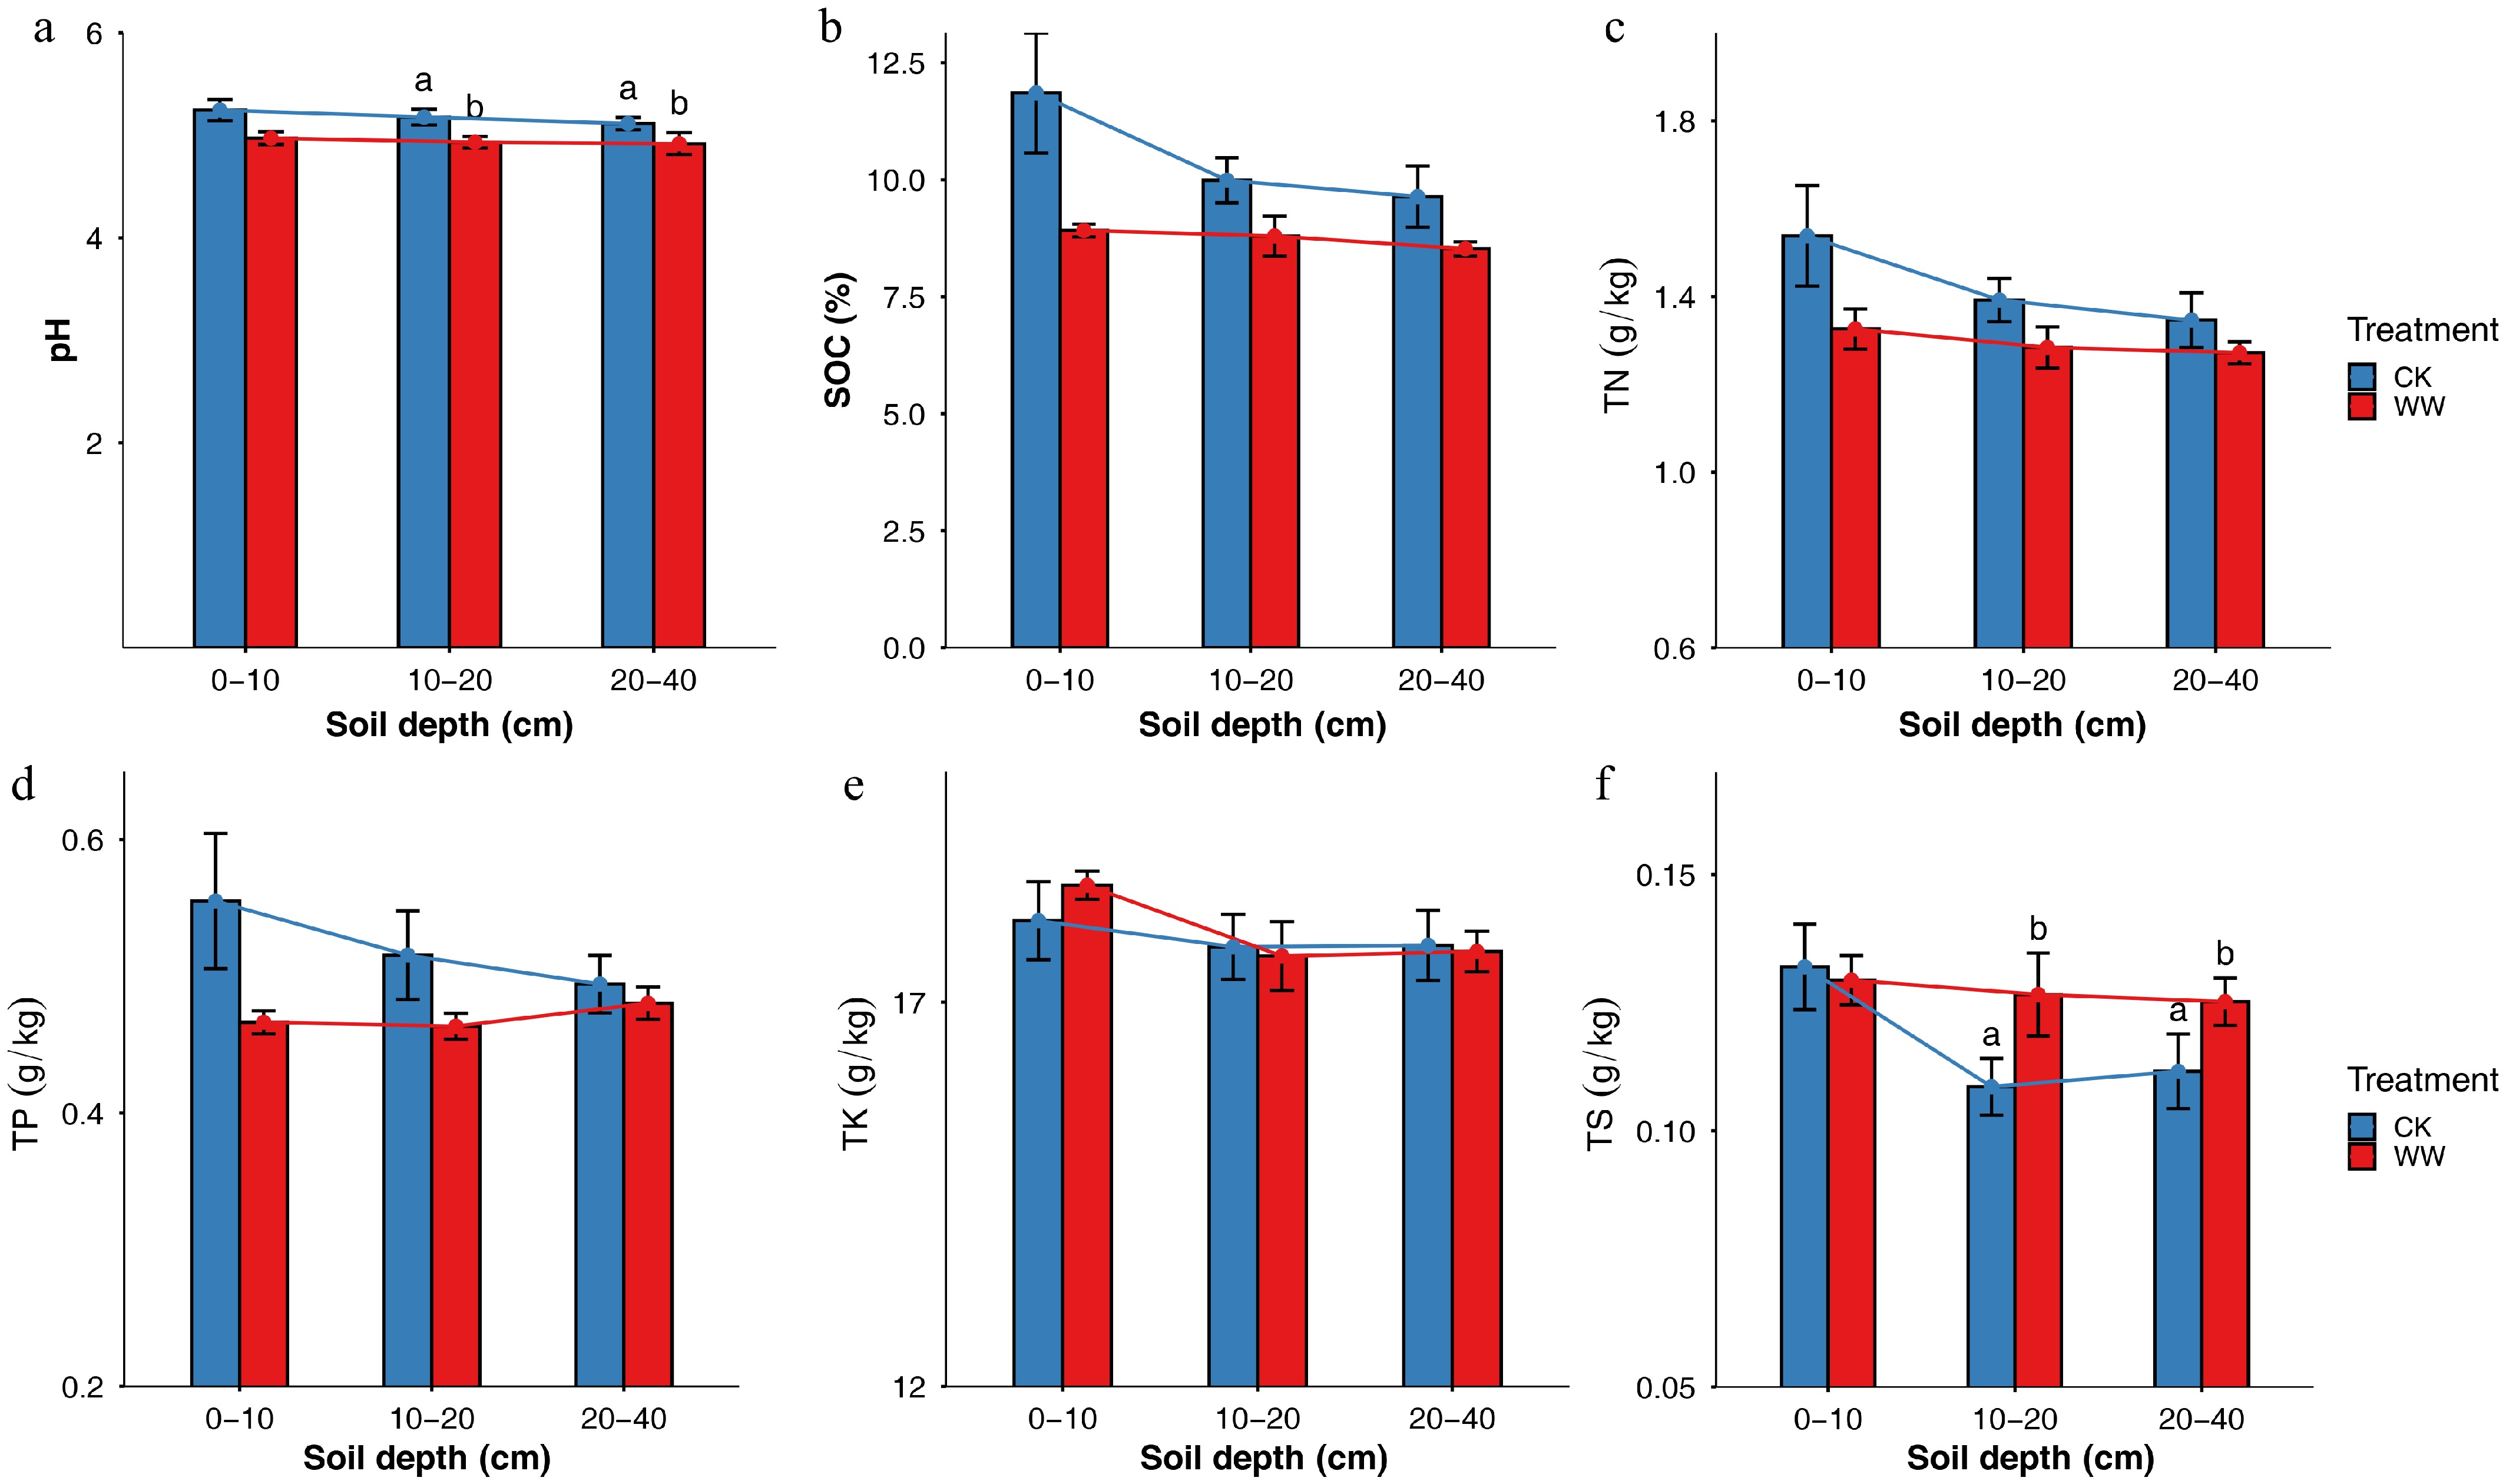
Figure 2.
Changes of total soil nutrients in dry season wastewater irrigation and control treatment: (a) pH, (b) soil organic carbon, (c) total nitrogen, (d) total phosphorus, (e) total potassium, (f) total sulfur. Note: WW is wastewater irrigation treatment; CK is control treatment. Data is presented as mean ± standard error (SE, n = 5). Statistical differences between treatments were assessed using two-way analysis of variance (ANOVA) followed by Tukey's HSD test. Different letters above bars indicate significant differences at p < 0.05; no letters indicate no significant difference.
-
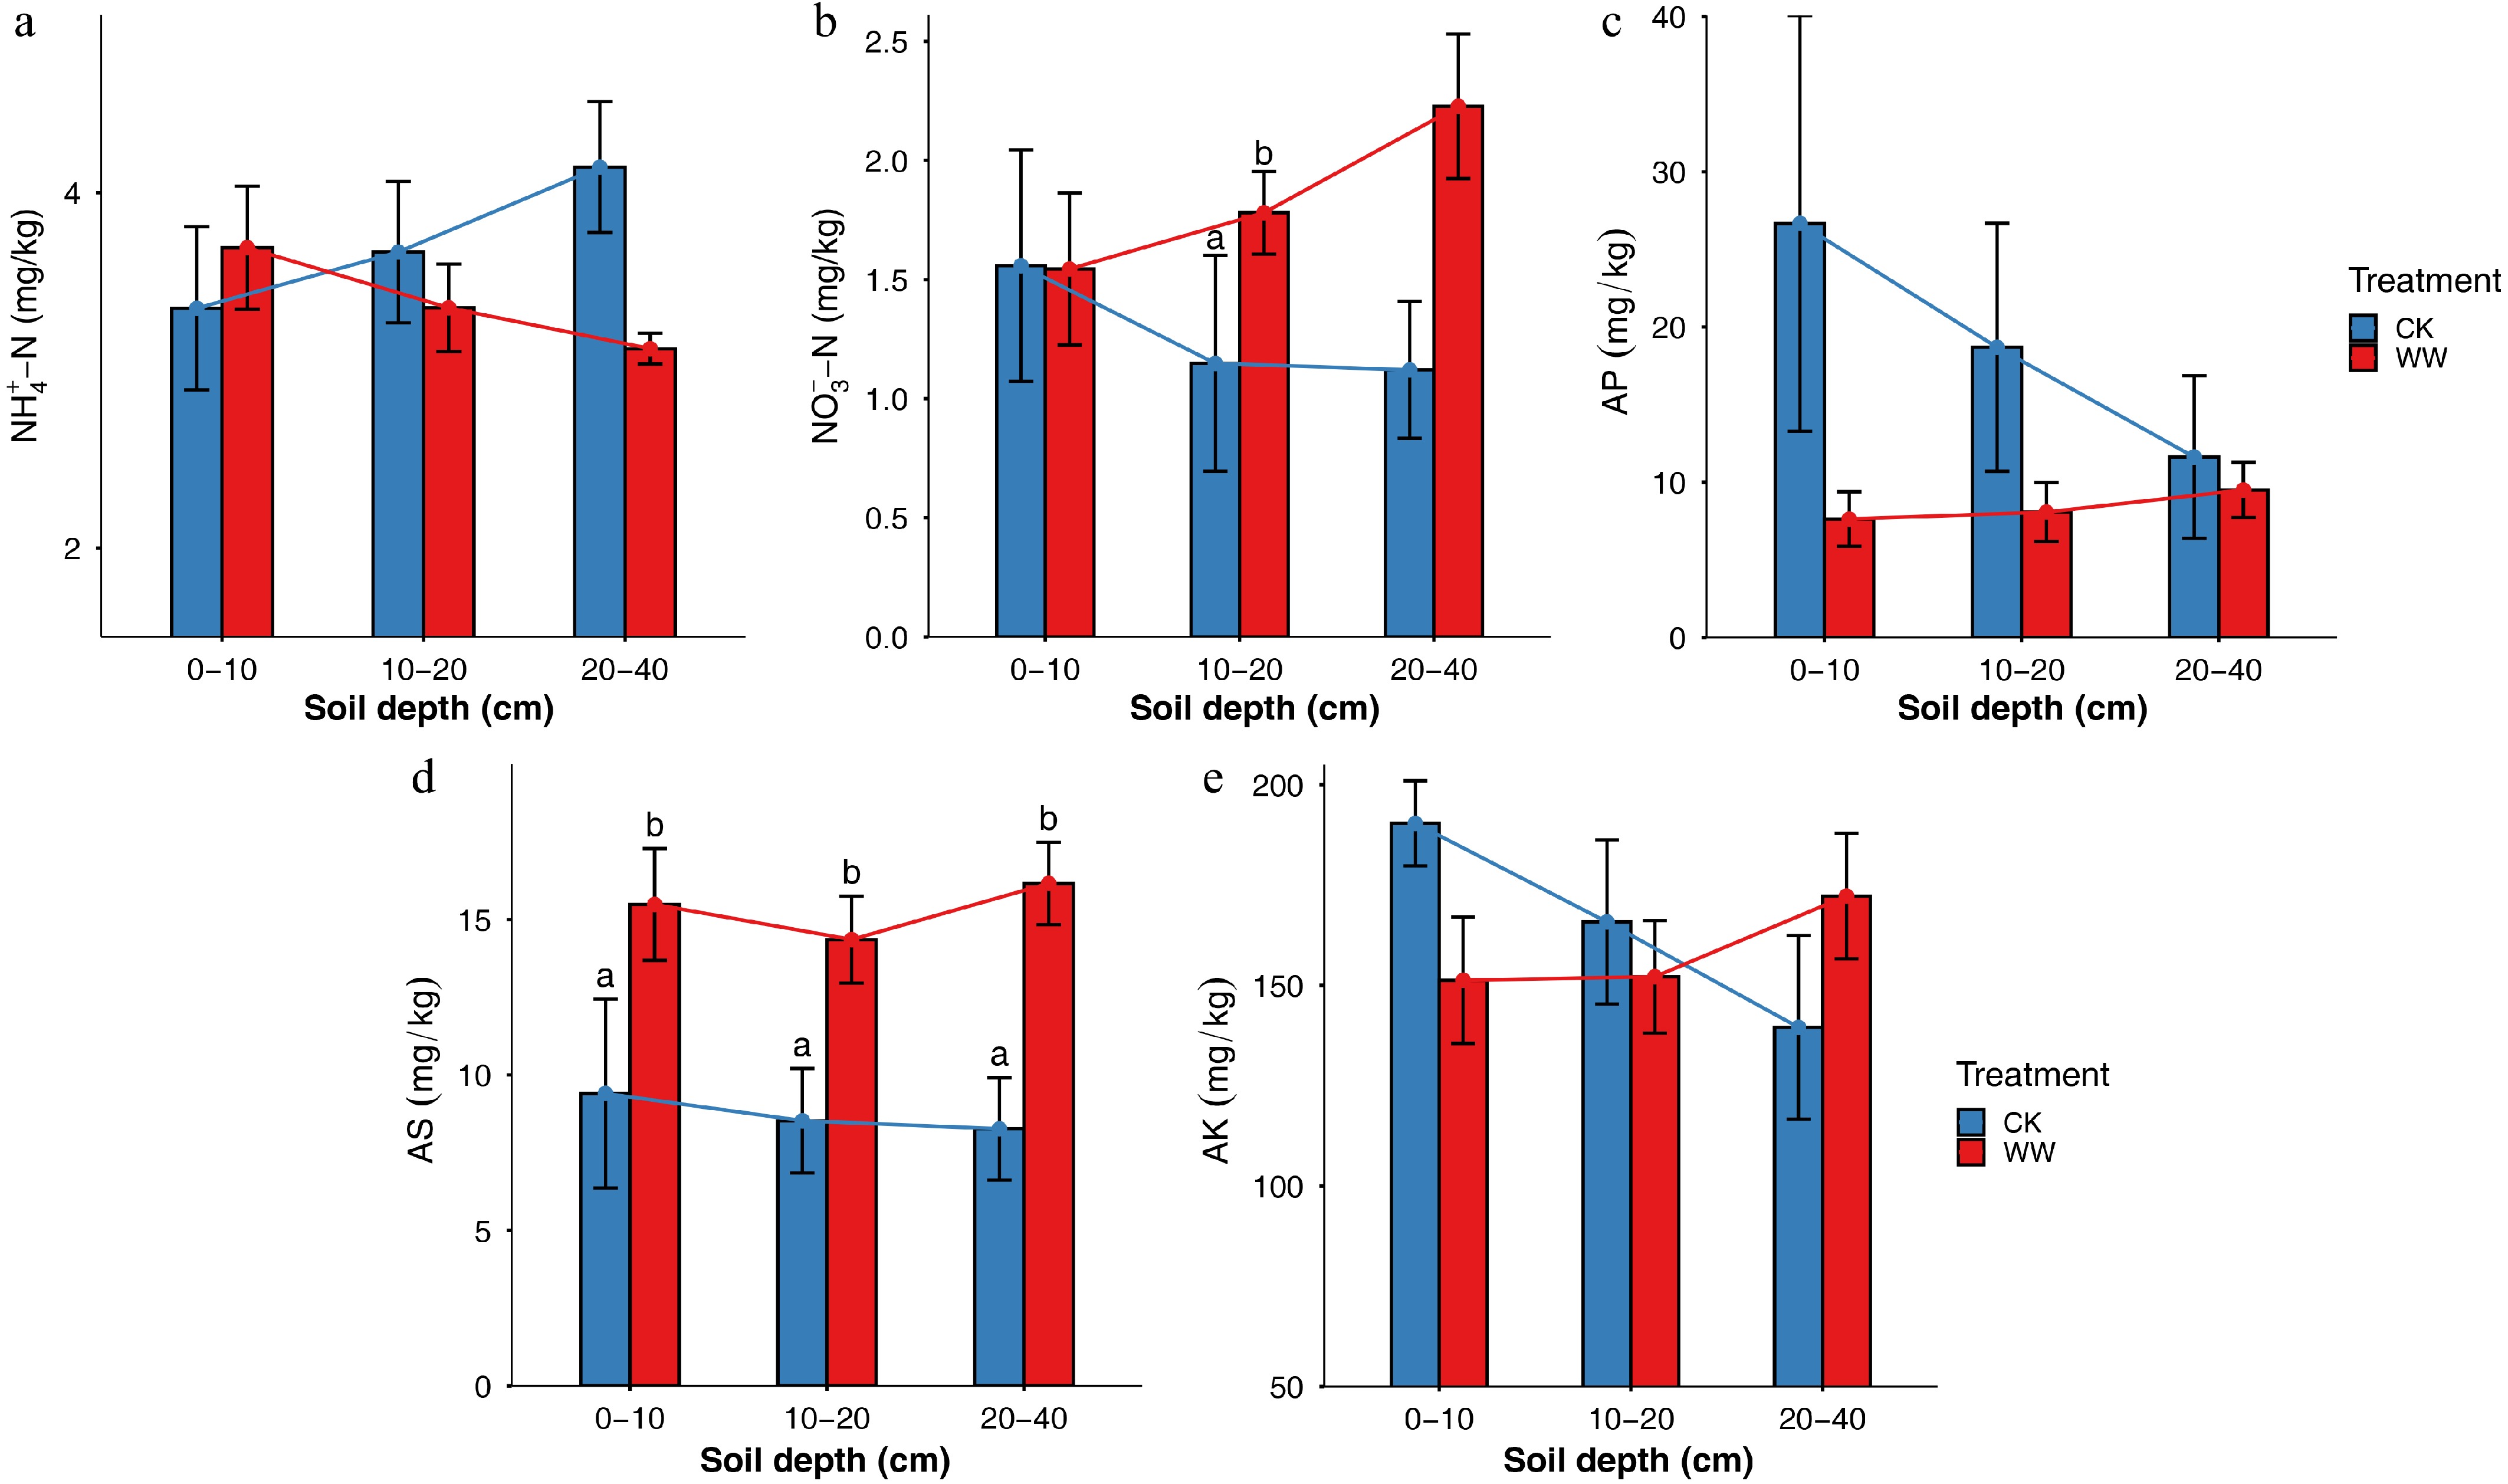
Figure 3.
Changes of soil available nutrients in dry season wastewater irrigation and control treatment: (a) ammonia nitrogen, (b) nitrate nitrogen, (c) available phosphorus, (d) available sulfur, (e) available potassium. Note: WW is wastewater irrigation treatment; CK is control treatment. Data is presented as mean ± standard error (SE, n = 5). Statistical differences between treatments were assessed using two-way analysis of variance (ANOVA) followed by Tukey's HSD test. Different letters above bars indicate significant differences at p < 0.05; no letters indicate no significant difference.
-
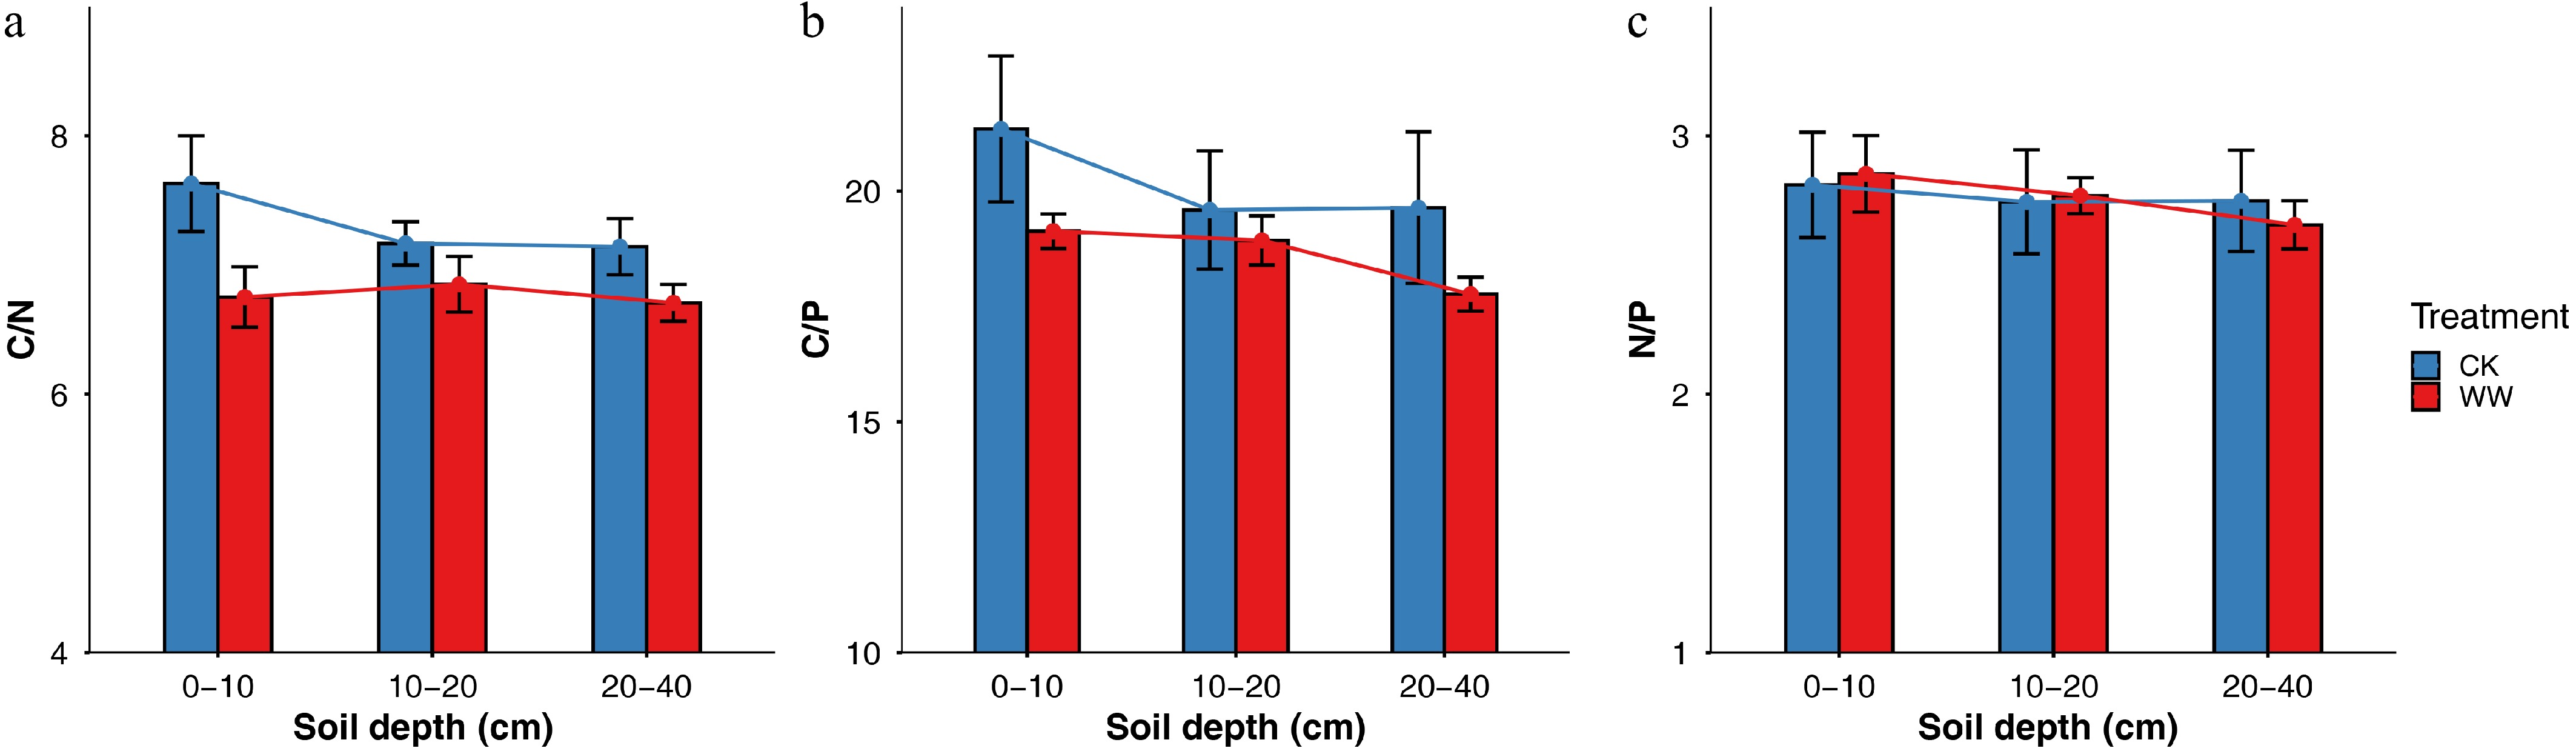
Figure 4.
Changes of soil C, N, and P stoichiometry in dry season wastewater irrigation and control treatment: (a) soil C/N ratio, (b) soil C/P ratio, (c) soil N/P ratio. Note: WW is wastewater irrigation treatment; CK is control treatment. Data is presented as mean ± standard error (SE, n = 5). Statistical differences between treatments were assessed using two-way analysis of variance (ANOVA) followed by Tukey's HSD test. Different letters above bars indicate significant differences at p < 0.05; no letters indicate no significant difference.
-
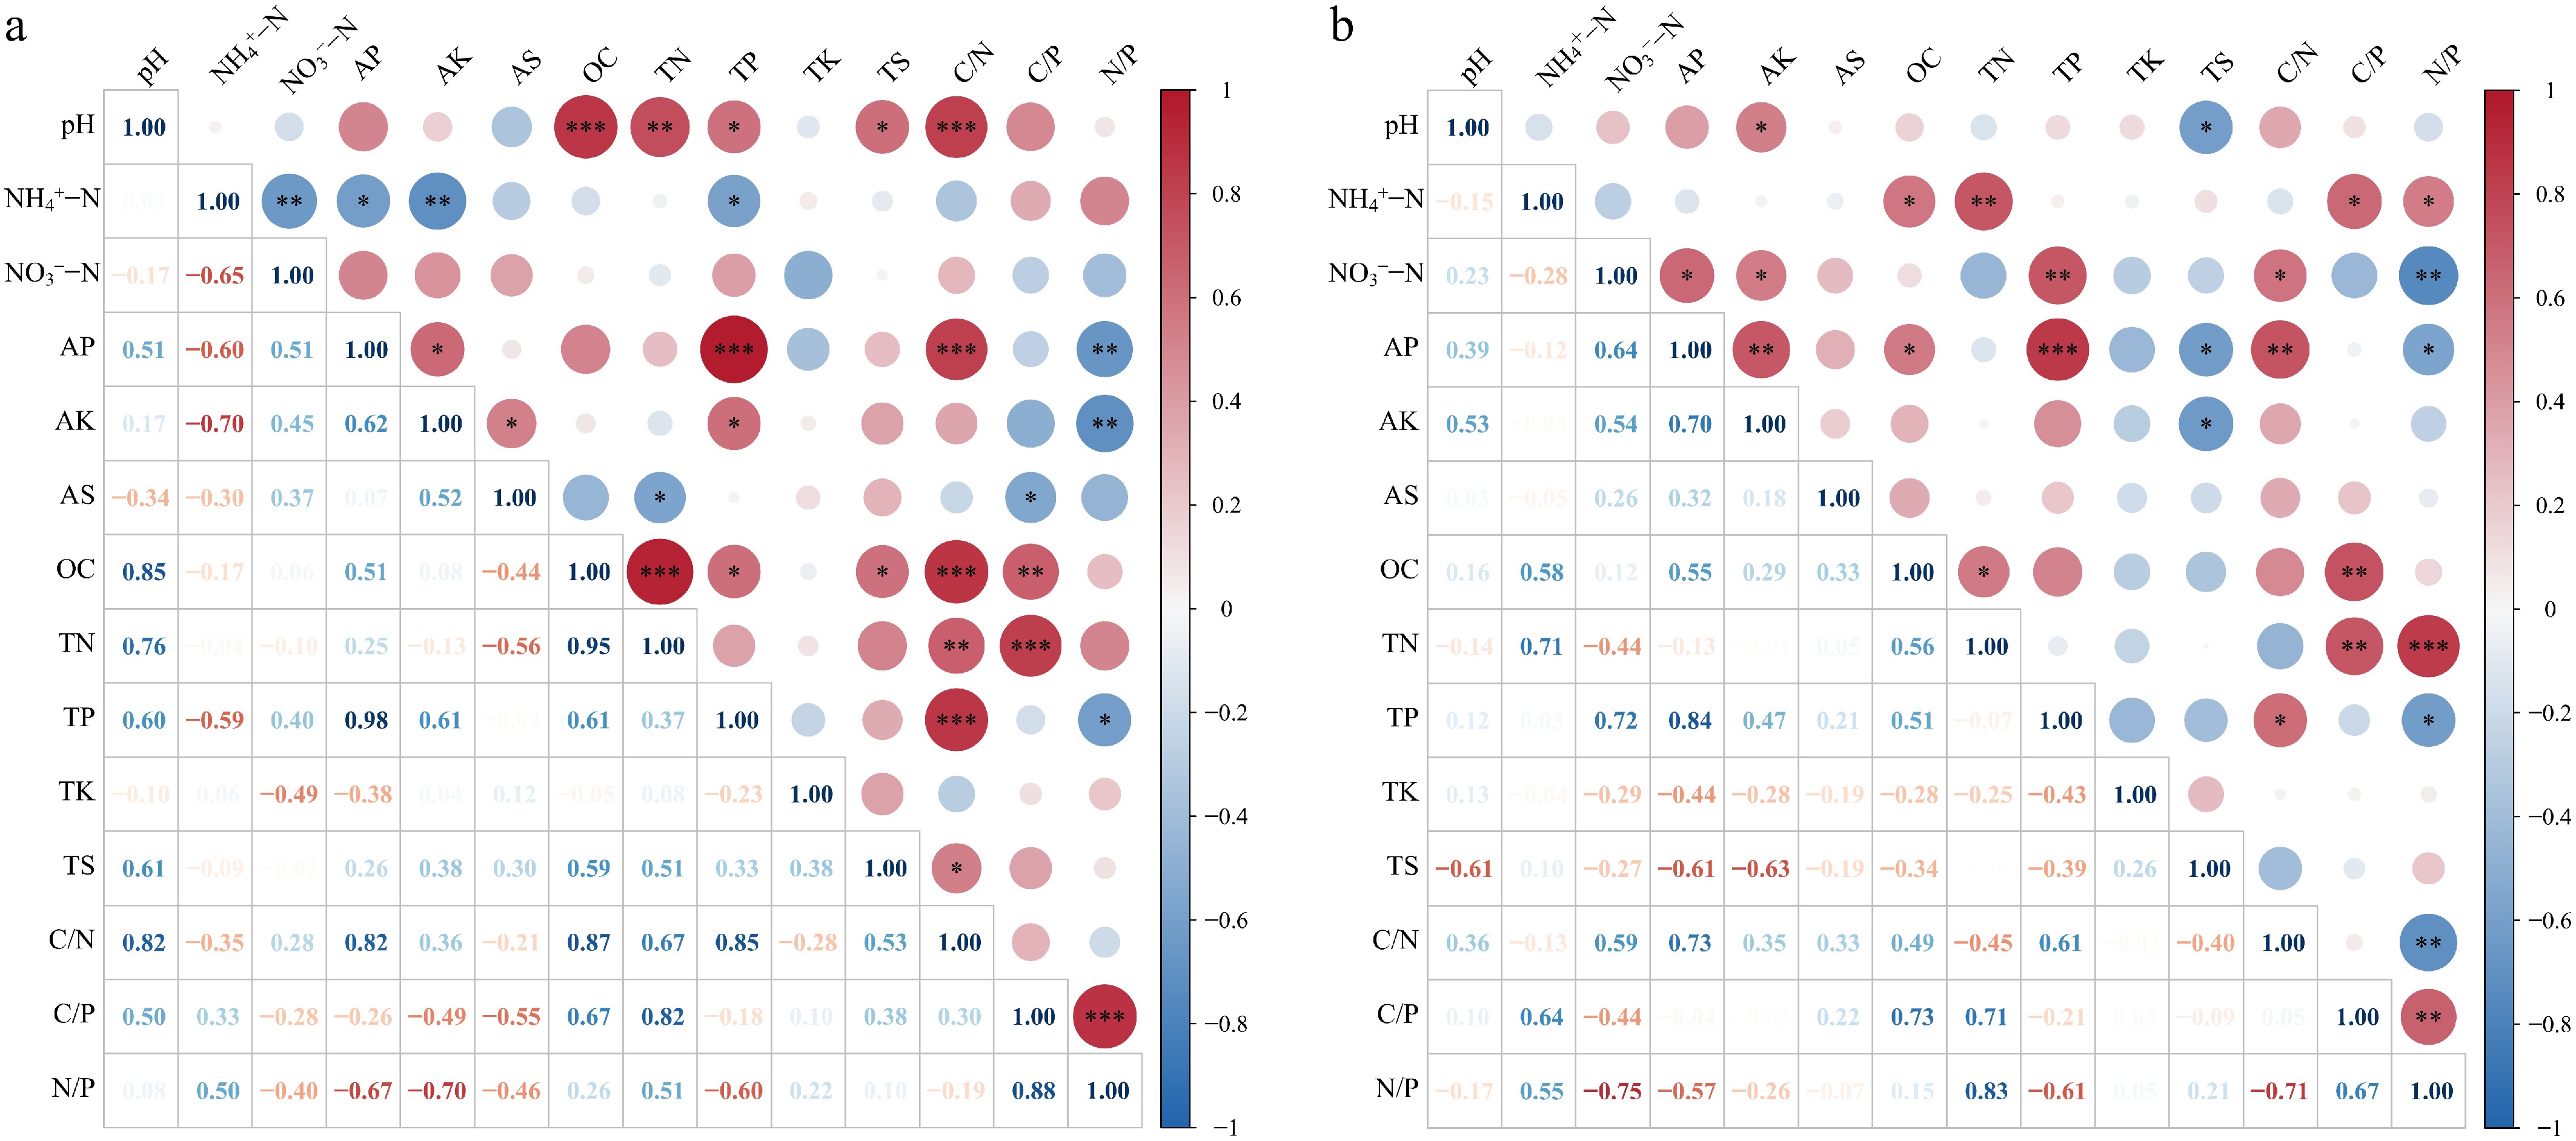
Figure 5.
Comparison of the correlation heatmap of soil nutrient content between wastewater irrigation and control treatment. (a) Correlation heatmap of CK treatment, (b) correlation heatmap of WW treatment; CK is control treatment. Statistical differences between treatment groups were assessed using Pearson correlation analysis, with the significance of correlation coefficients denoted by asterisks (* p < 0.05, ** p < 0.01, *** p < 0.001).
-
Fertility
factorsCK WW Content CV (%) Content CV (%) pH 5.18 ± 0.18 3.00% 4.94 ± 0.16 3.00% SOC (%) 10.49 ± 2.08 19.80% 8.74 ± 0.95 6.50% TN (g/kg) 1.43 ± 0.19 13.10% 1.29 ± 0.09 6.50% TP (g/kg) 0.52 ± 0.08 15.00% 0.47 ± 0.02 4.50% TK (g/kg) 17.84 ± 0.98 5.00% 17.93 ± 0.79 4.30% TS (g/kg) 0.12 ± 0.02 15.60% 0.127 ± 0.01 9.70% AK (mg/kg) 165.24 ± 44.37 27.00% 158.55 ± 32.98 20.09% AS (mg/kg) 8.73 ± 4.62 53.00% 15.33 ± 3.24 20.00% AP (mg/kg) 18.99 ± 20.66 109.00% 8.4 ± 3.85 44.00% WW is wastewater irrigation treatment; CK is control treatment; CV is coefficient of variation. Content data is presented as mean ± standard error (SE, n = 5). Weak variation (CV < 15%), moderate variation (15% ≤ CV < 35%), strong variation (CV ≥ 35%). Table 1.
Soil nutrient content and variation coefficient of different irrigation types in 0–40 cm.
-
Ingredient PC1 PC2 PC3 PC4 Grand total 2.232 2.025 1.229 1.047 Variance percentage (%) 0.356 0.293 0.108 0.078 Accumulation (%) 0.356 0.649 0.757 0.835 pH −0.373 0.049 0.045 0.232 NH4+−N 0.014 0.347 0.186 0.066 NO3−−N 0.026 −0.353 −0.073 −0.526 AP −0.341 −0.286 0.029 0.030 AK −0.142 −0.340 −0.146 0.137 AS 0.244 −0.232 −0.361 −0.243 SOC −0.426 0.108 −0.116 −0.117 TN −0.352 0.241 −0.128 −0.173 TP −0.369 −0.241 0.009 0.093 TK 0.087 0.135 −0.477 0.614 TS −0.008 0.030 −0.723 −0.093 C/N −0.401 −0.107 −0.028 −0.007 C/P −0.232 0.376 −0.119 −0.261 N/P 0.019 0.448 0.099 −0.283 WW is wastewater irrigation treatment; CK is control treatment. Table 2.
Initial eigenvalues and score matrix of principal components.
-
Treatment CK WW Depth (cm) 0−10 10−20 20−40 0−10 10−20 20−40 PC1 −2.712 −0.910 −0.216 1.207 1.216 1.416 PC1 variance percentage 0.356 PC2 0.059 0.214 0.814 0.366 −0.229 −1.225 PC2 variance percentage 0.293 PC3 −0.859 0.915 1.168 −0.818 −0.190 −0.215 PC3 variance percentage 0.108 PC4 0.005 −0.146 0.387 0.548 0.361 0.095 PC4 variance percentage 0.078 Average score per soil layer −1.245 −0.208 0.381 0.588 0.447 0.155 Mean of total scores −0.358 0.397 WW is wastewater irrigation treatment; CK is control treatment. Table 3.
Comprehensive soil scores of different soil layers under different treatments.
Figures
(5)
Tables
(3)