-
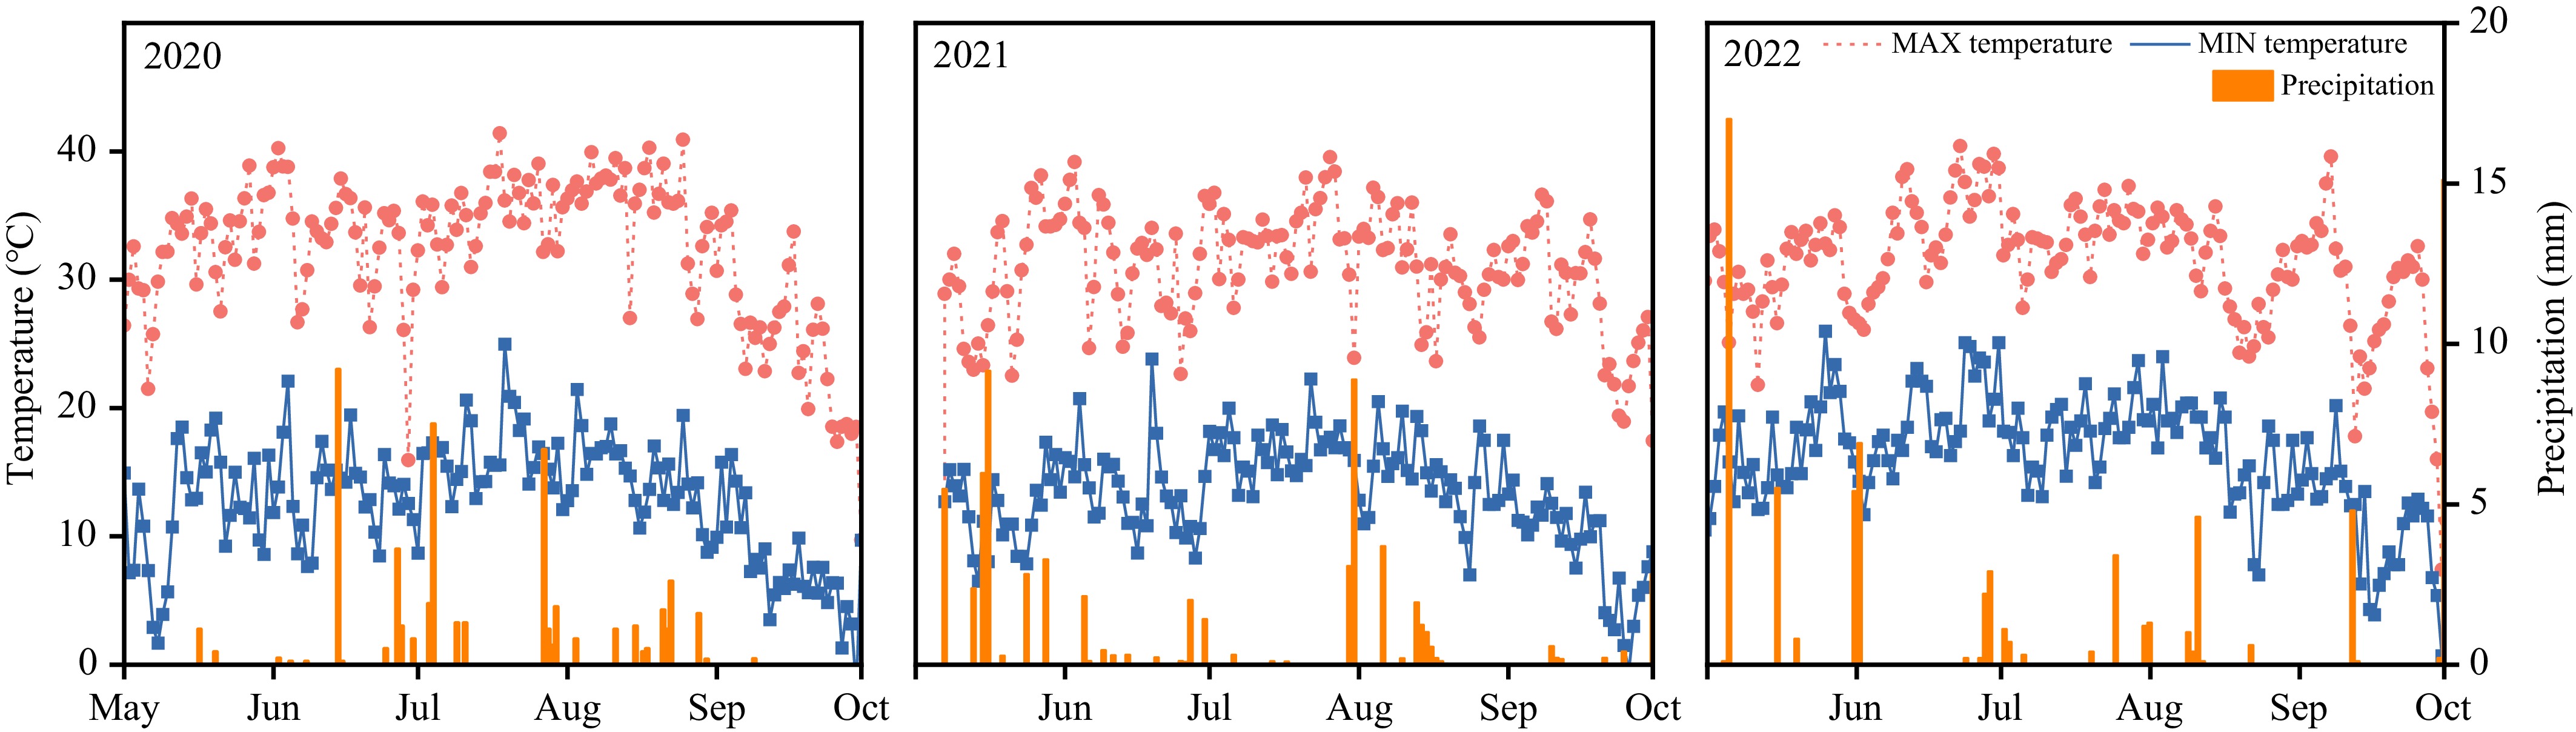
Figure 1.
Temperature and precipitation in the test area from 2020–2022.
-
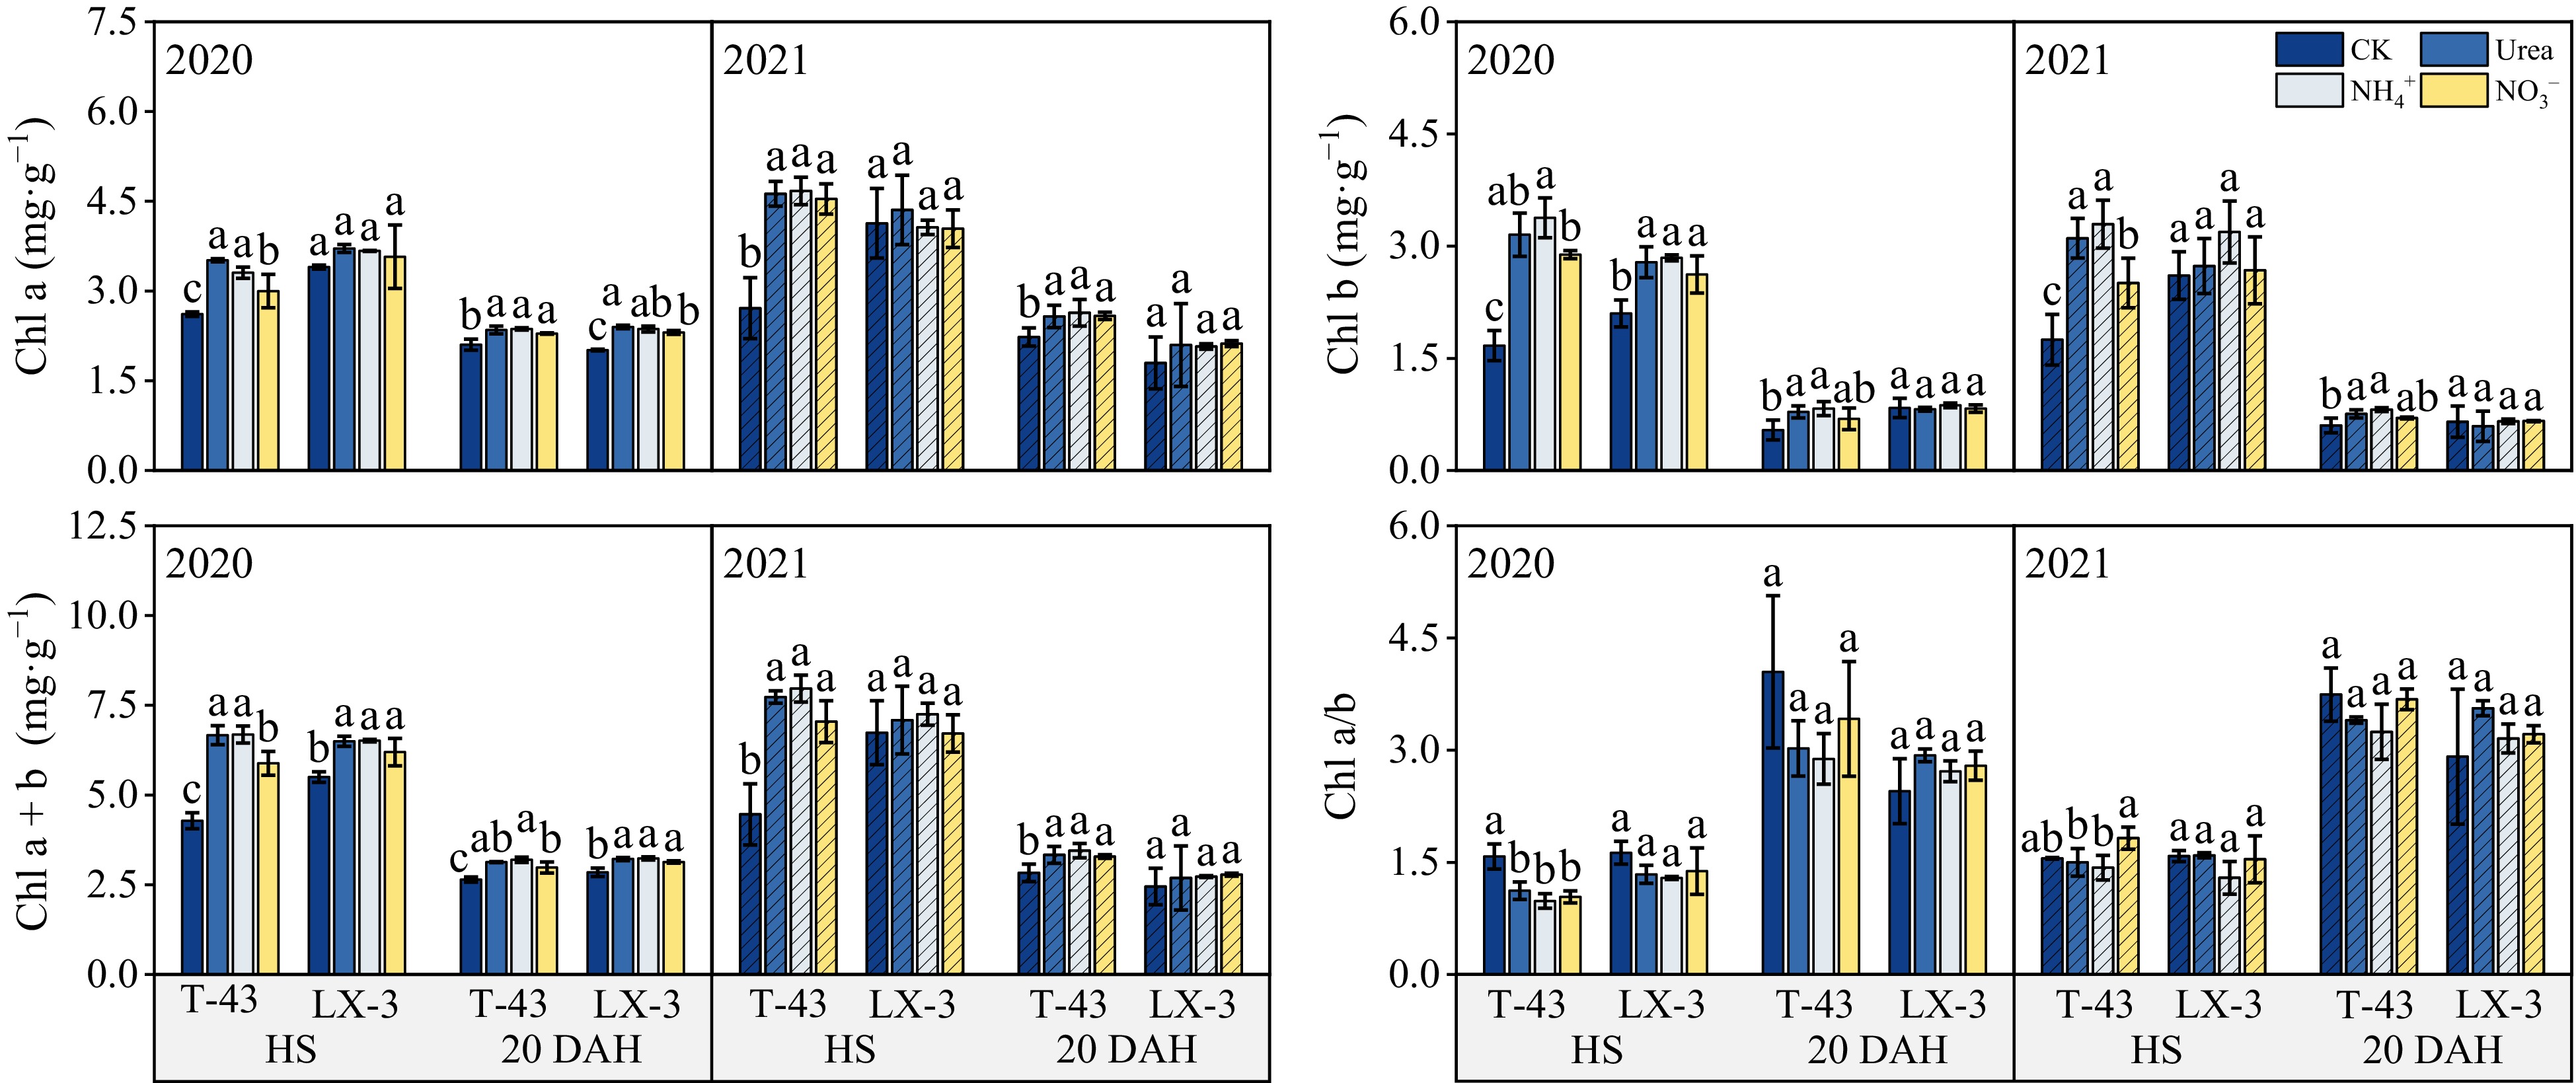
Figure 2.
Effects of N form on the chlorophyll content of drip-irrigated rice leaves. Chl a, chlorophyll a; Chl b, chlorophyll b; Chl a + b, chlorophyll a + b; Chl a/b, chlorophyll a/b. Different letters indicate that the same cultivar is significantly different within the same year (p = 0.05).
-
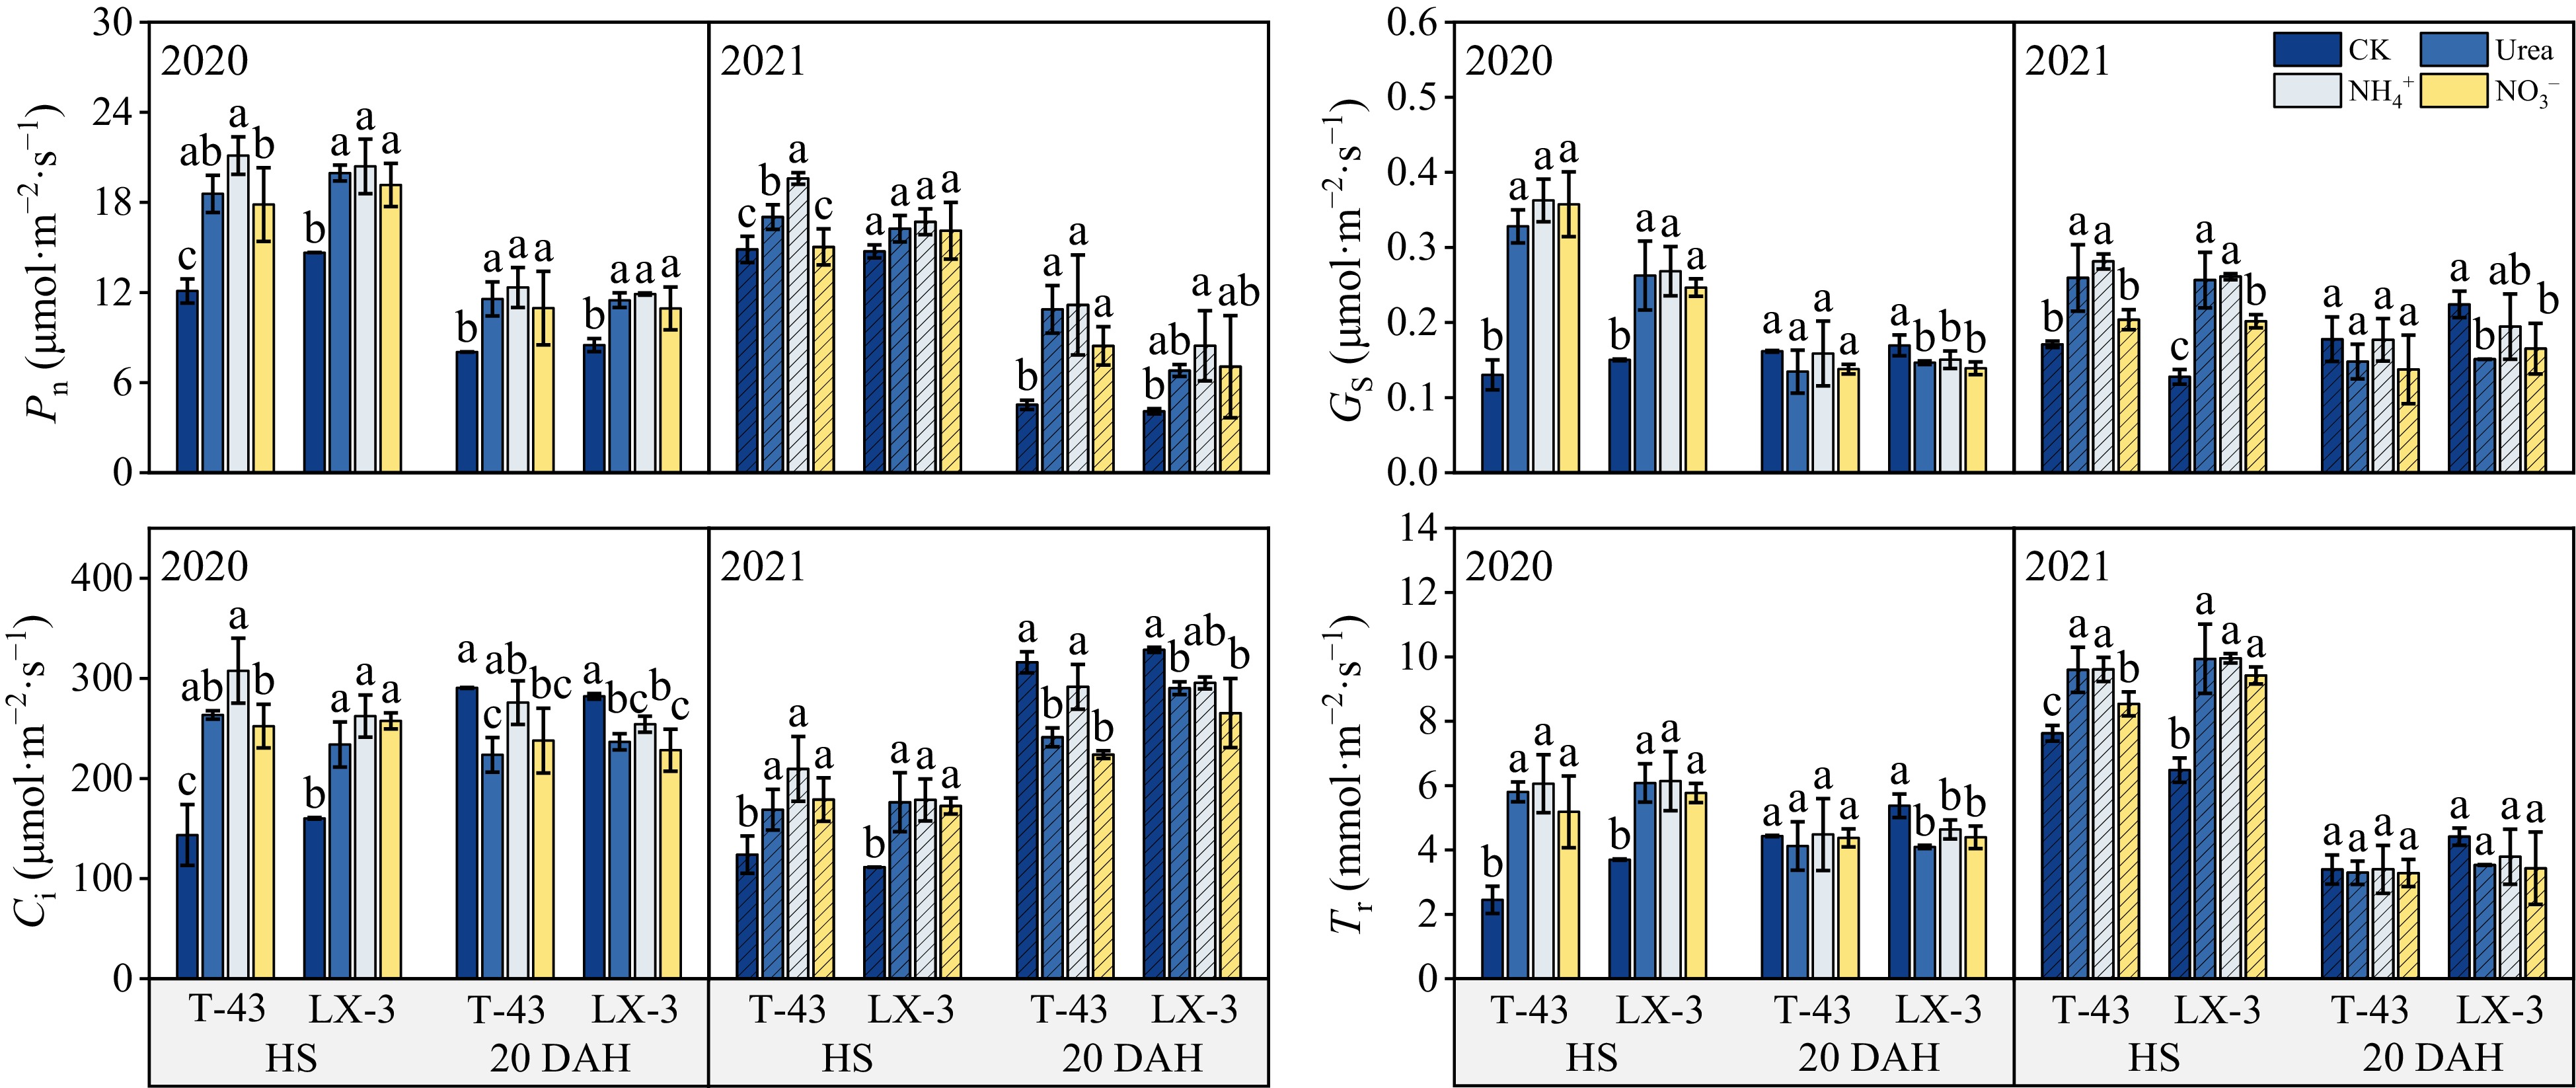
Figure 3.
Effects of N form on the photosynthetic parameters of drip-irrigated rice leaves. Pn, net photosynthetic rate; Gs, stomatal conductance; Ci, intercellular CO2 concentration; Tr, transpiration rate. Different letters indicate that the values for the same cultivar are significantly different within the same year (p = 0.05).
-
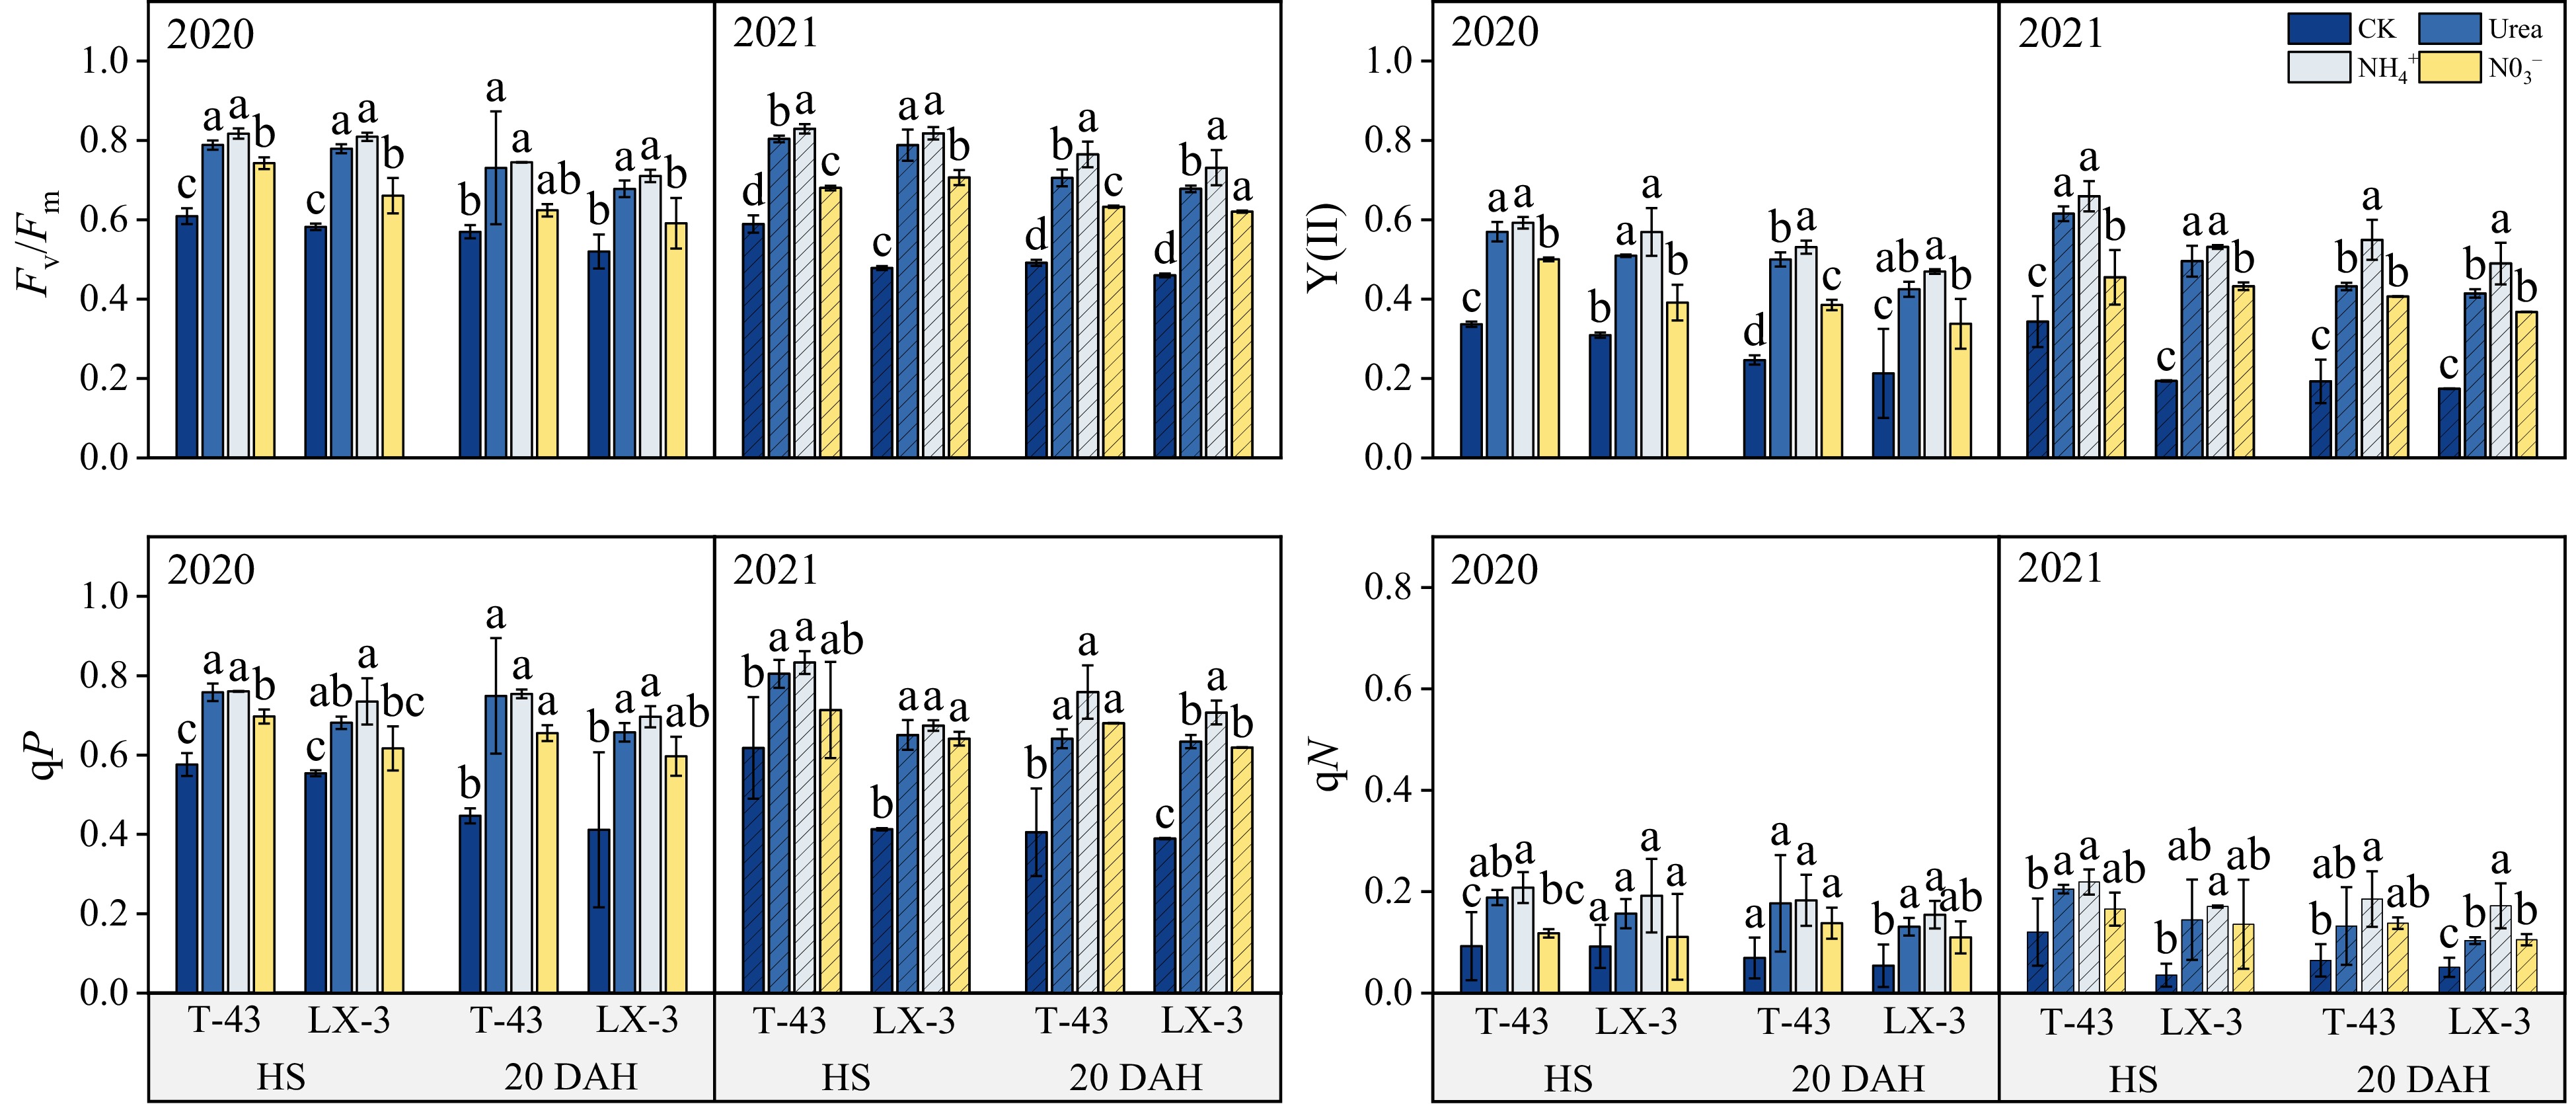
Figure 4.
Effects of N form on chlorophyll fluorescence parameters in drip-irrigated rice leaves. Fv/Fm, maximal photochemical efficiency of photosystem II; Y(II) actual photochemical efficiency of photosystem II; qP, photochemical quenching; and qN, nonphotochemical quenching. Different letters indicate that the values for the same cultivar are significantly different within the same year (p = 0.05).
-
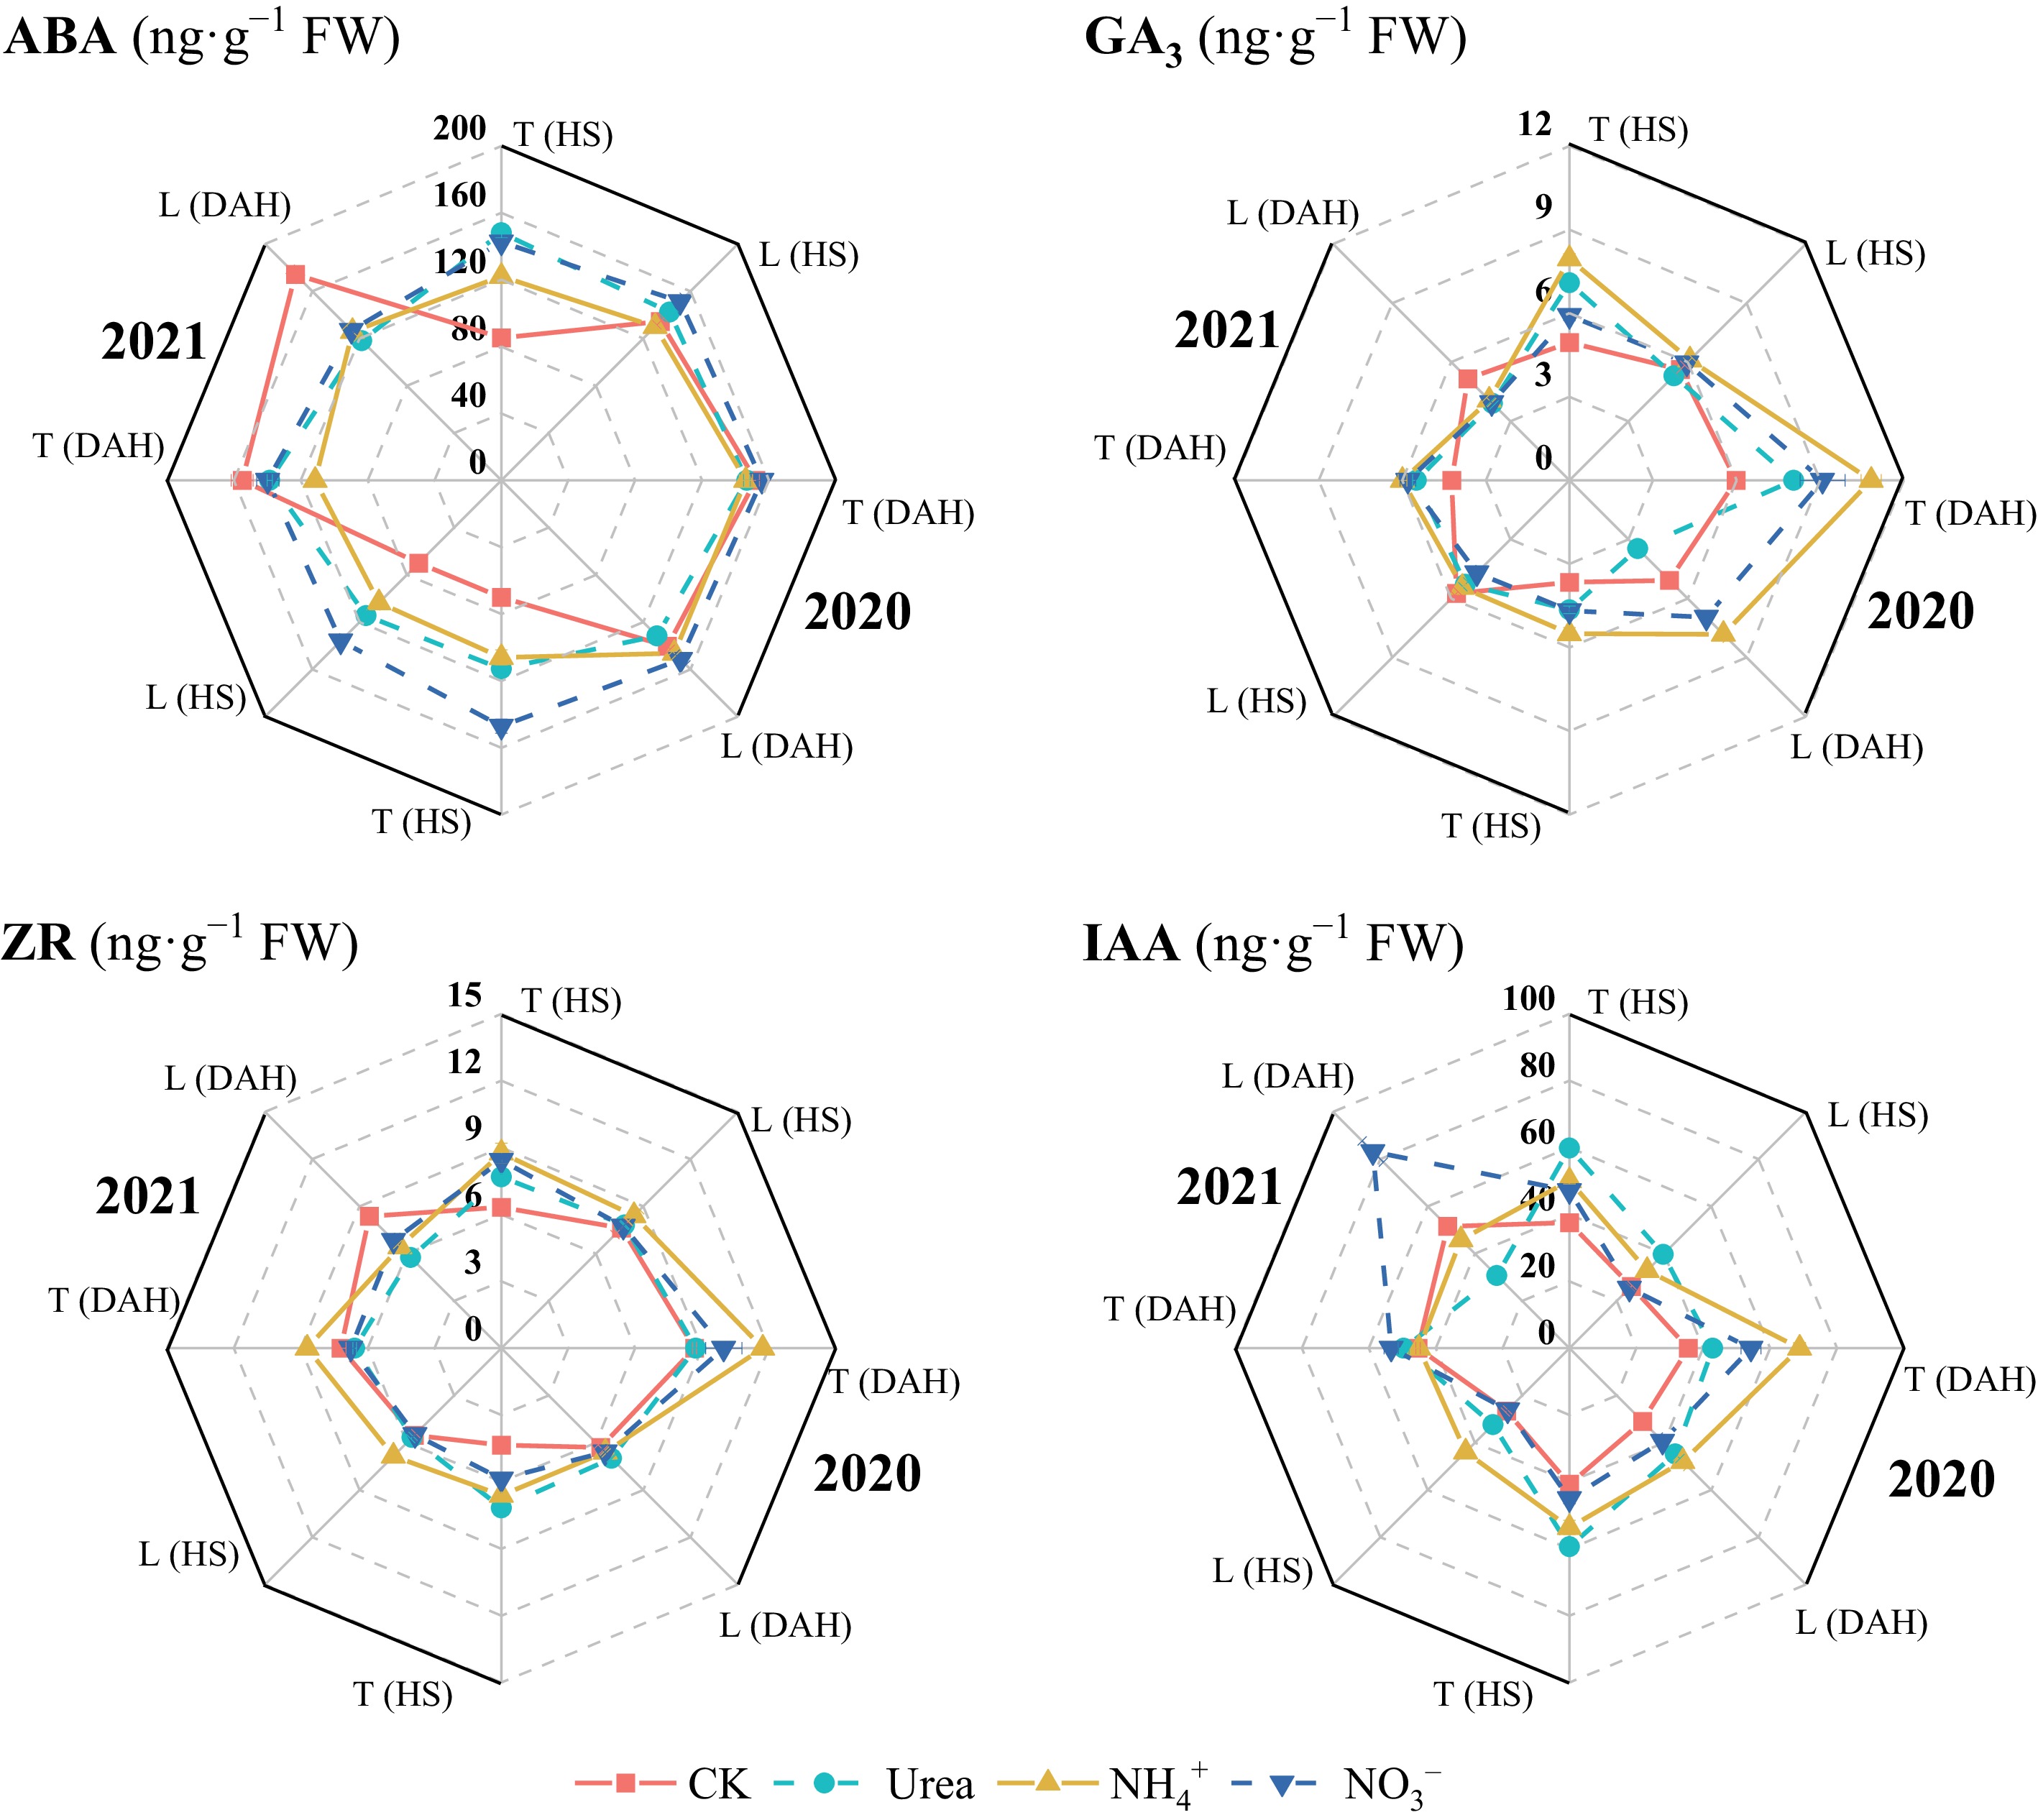
Figure 5.
Effects of N forms on the hormone contents of drip-irrigated rice leaves. HS, heading stage; DAH, 20 d after heading. ABA, abscisic acid; GA3, gibberellin; ZR, zeatin riboside; IAA, indole-3-acetic acid. Different letters indicate that the values for the same cultivar are significantly different within the same year (p = 0.05).
-
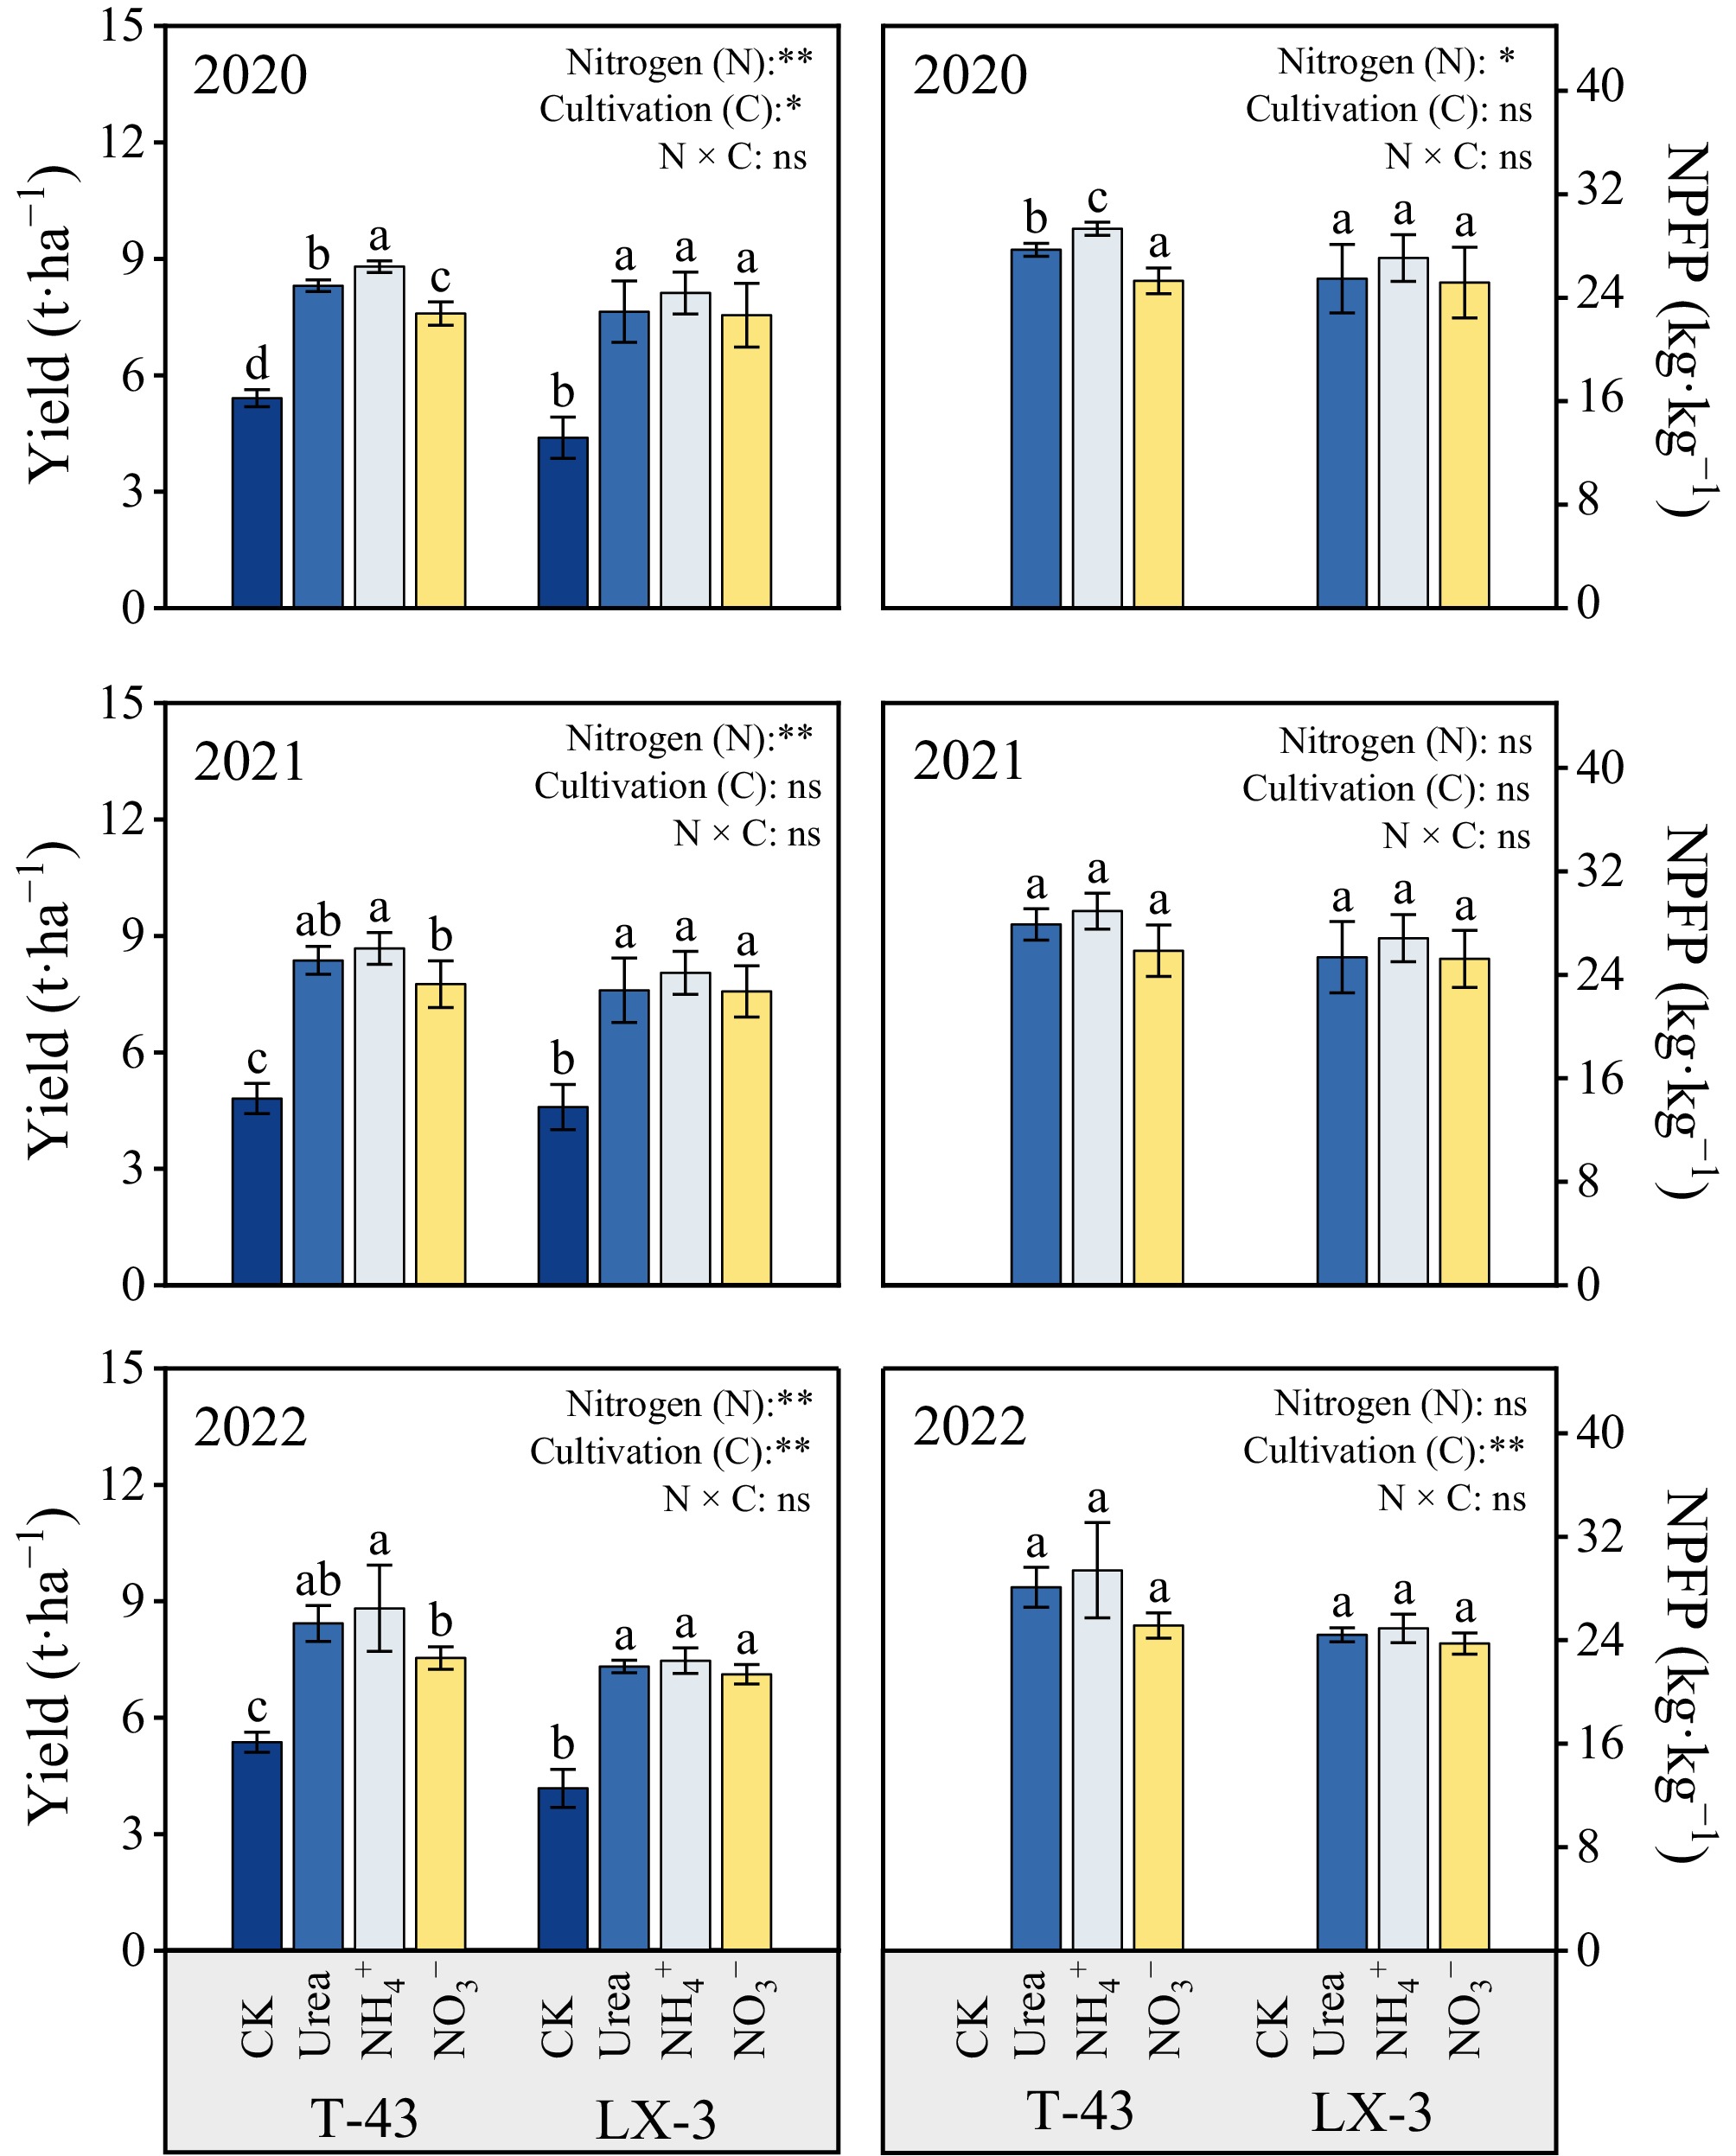
Figure 6.
Effects of N forms on the yield and NPFP of drip-irrigated rice. Different letters indicate that the values for the same cultivar are significantly different within the same year (p = 0.05). * and ** indicate significance at the p = 0.05 and 0.01 levels, respectively, and NS indicates nonsignificance at the p = 0.05 level.
-
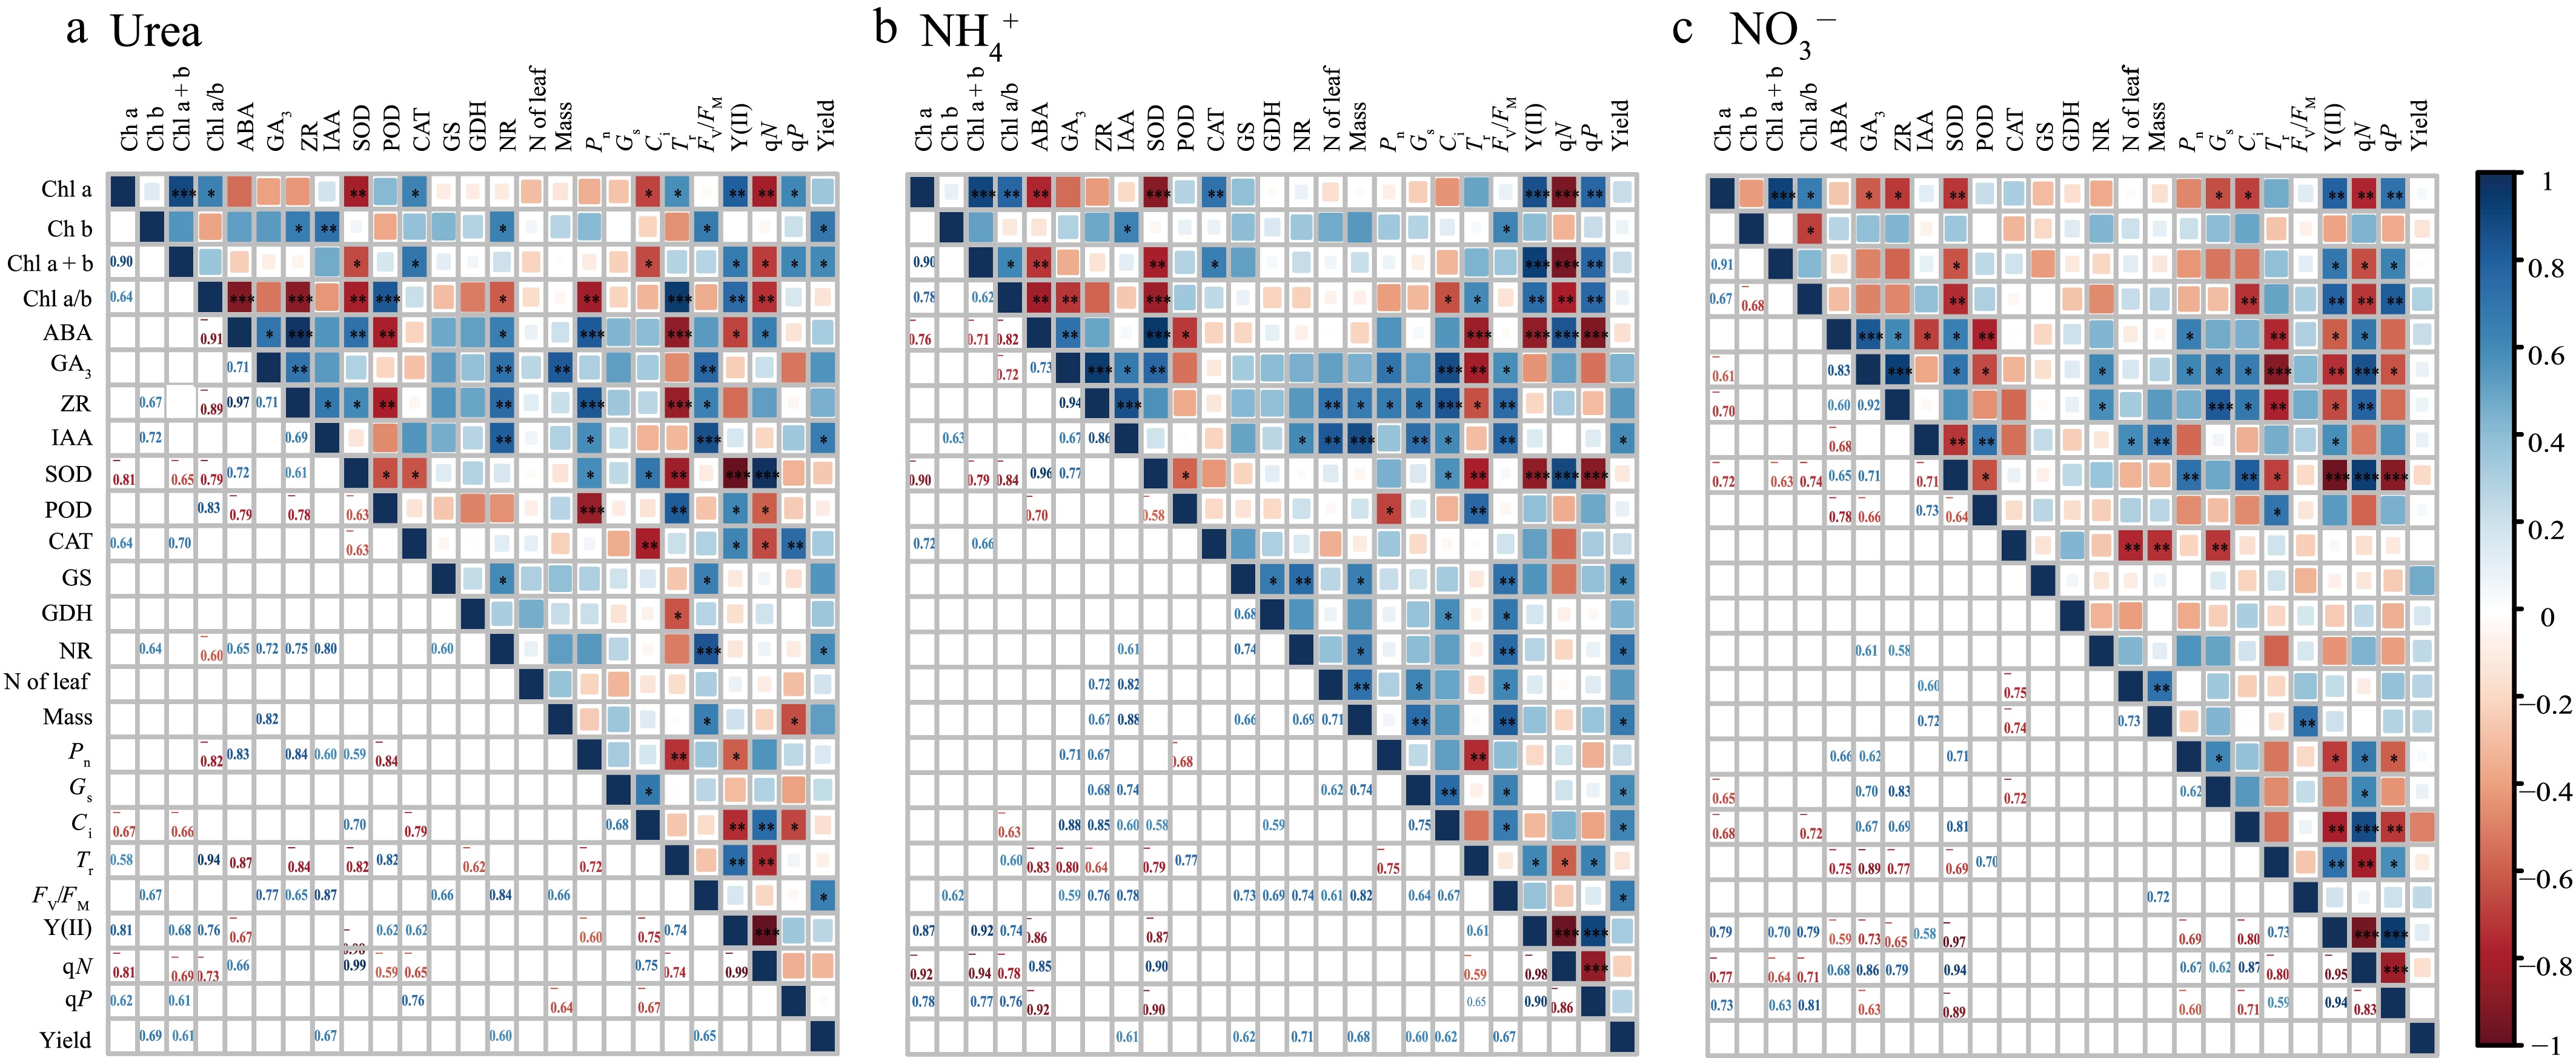
Figure 7.
Correlations between chlorophyll content, chlorophyll fluorescence parameters, gas exchange parameters, antioxidant enzymes and hormones in different N forms. *, ** and *** indicate significance at the p = 0.05, 0.01, and 0.001 levels, respectively.
-
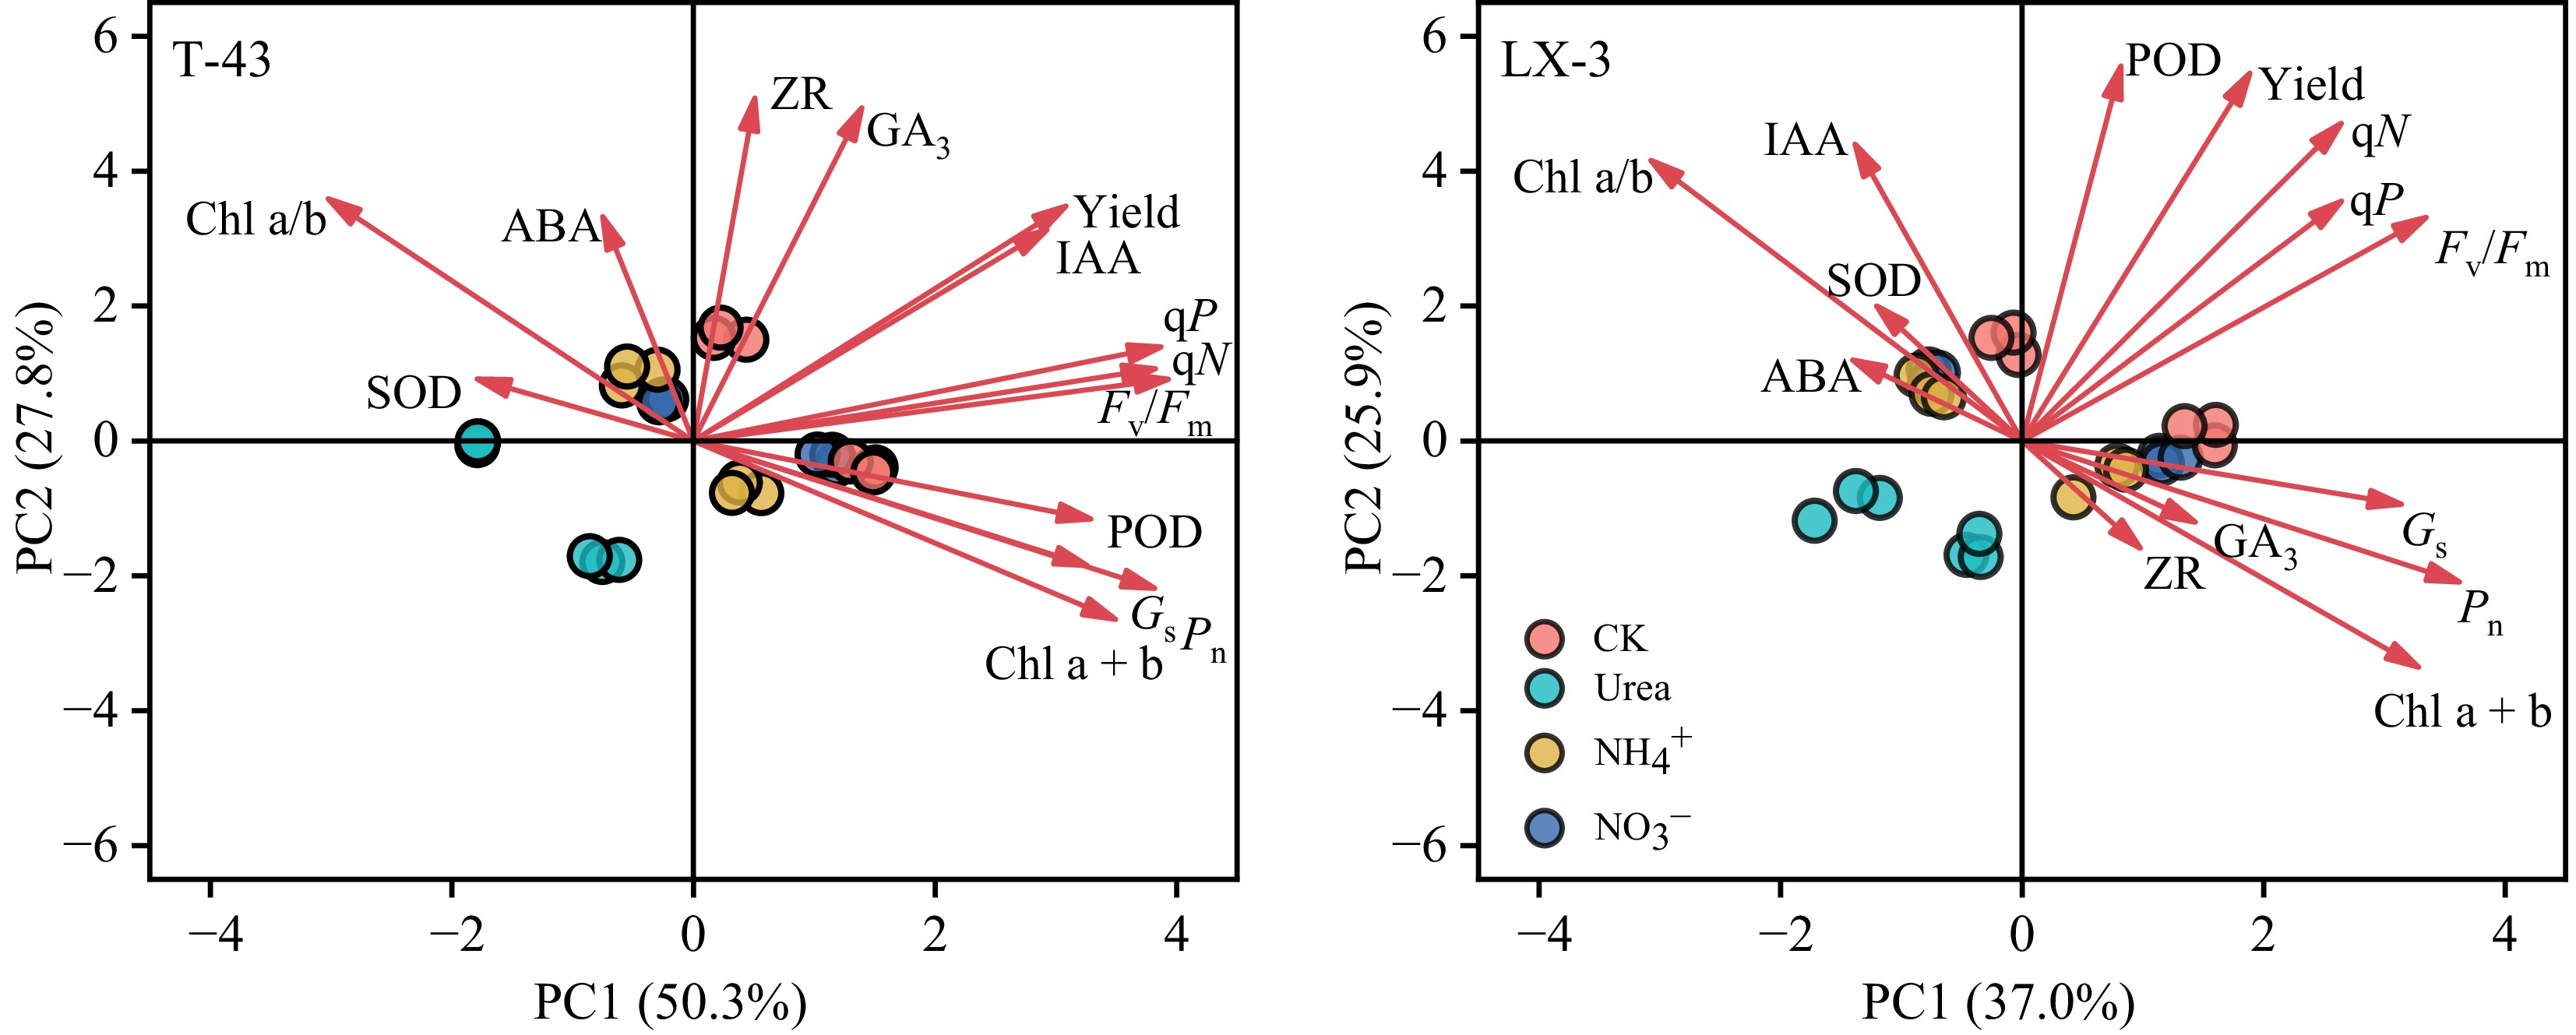
Figure 8.
Principal component analysis of the photosynthetic physiology and leaf photosynthetic yield of different NUE cultivars of drip-irrigated rice cultivated with different N forms. PC1, principal component 1; PC2, principal component 2.
-
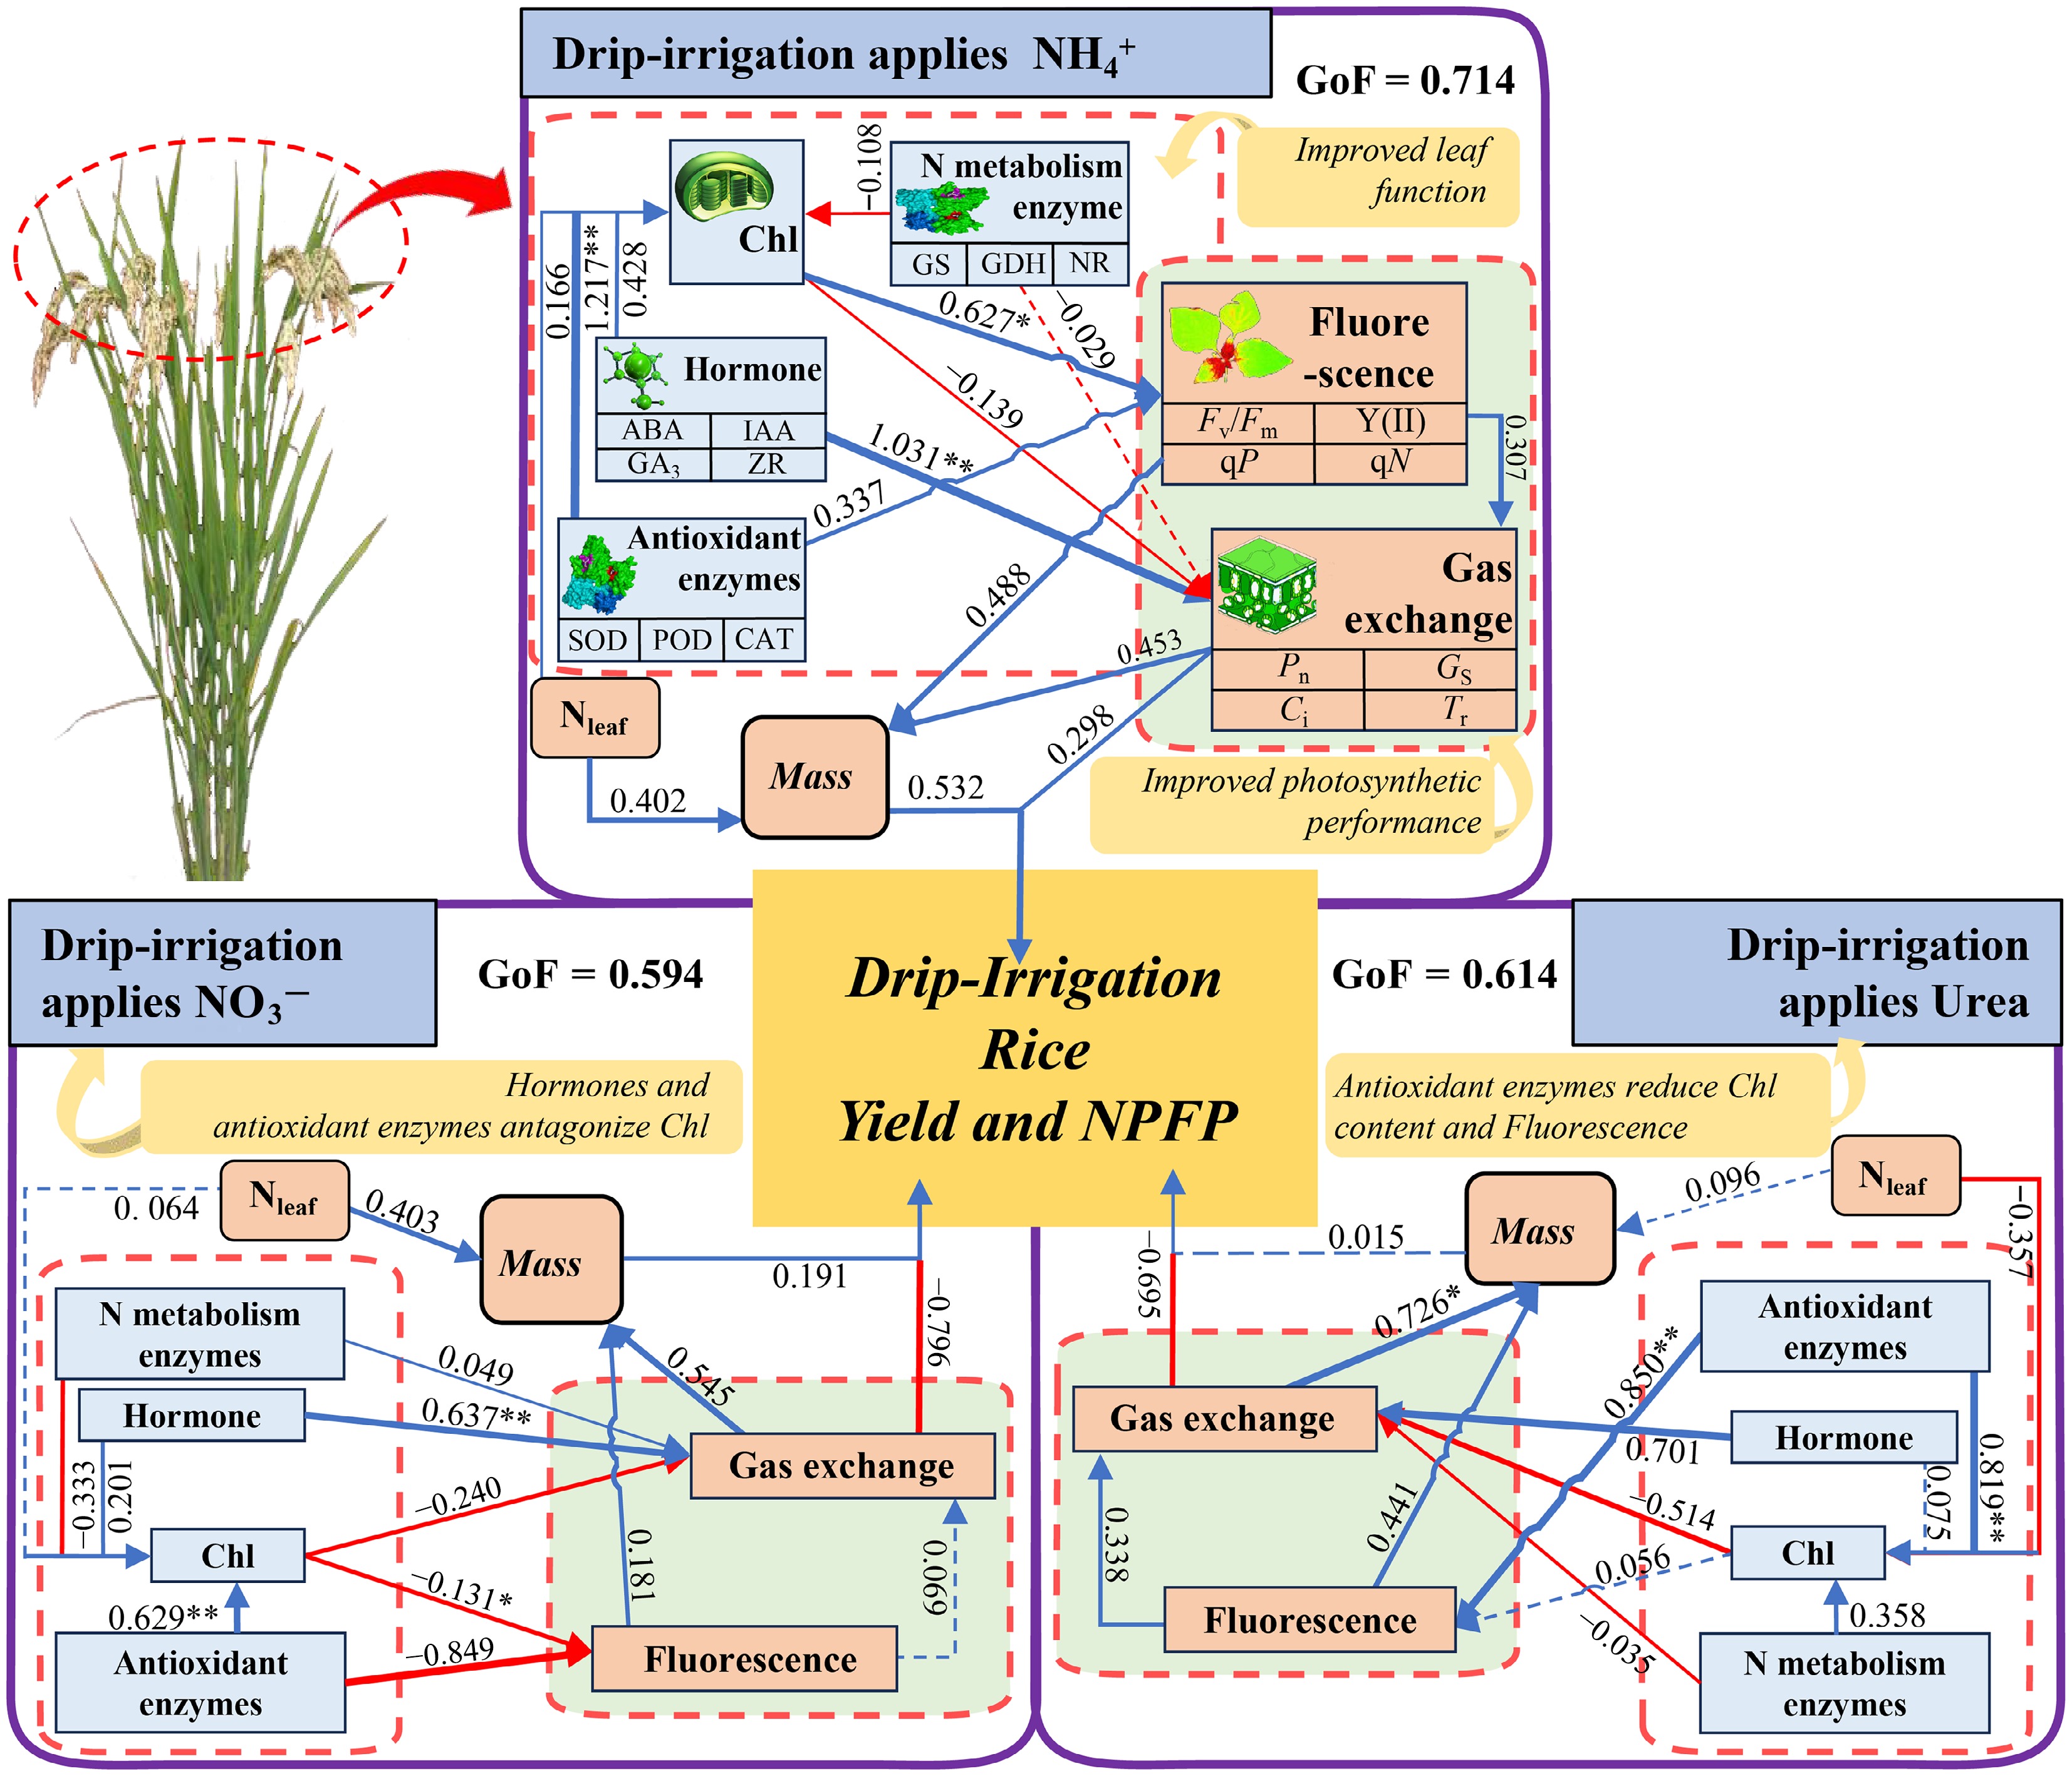
Figure 9.
Partial least squares path model analysis (PLS−PM) of the photosynthetic physiology and yield of leaves in drip-irrigated rice under different N forms. Urea represents the CH4N2O treatment, NH4+ represents the (NH4)2SO4 treatment, and NO3− represents the Ca(NO3)2 treatment. The blue arrows represent facilitation, and the red arrows represent inhibition. GoF, goodness of fit. *, ** and *** indicate significance at the p = 0.05, 0.01, and 0.001 levels, respectively.
-
Year Cultivar Nitrogen forms HS 20 DAH Stem
(t·ha−1)Leaf
(t·ha−1)Panicle
(t·ha−1)Total
(t·ha−1)Stem
(t·ha−1)Leaf
(t·ha−1)Panicle
(t·ha−1)Total
(t·ha−1)2020 T-43 CK 5.48 ± 0.37 c 3.11 ± 0.19 b 1.98 ± 0.12 b 10.56 ± 0.59 b 5.38 ± 0.25 b 2.14 ± 0.14 b 3.67 ± 0.03 b 11.18 ± 0.16 b Urea 6.83 ± 0.19 a 3.57 ± 0.6 ab 2.54 ± 0.45 ab 12.94 ± 0.67 a 7.84 ± 0.17 a 3.45 ± 0.18 a 5.60 ± 0.27 a 16.90 ± 0.00 a NH4+ 6.14 ± 0.27 b 4.28 ± 0.74 a 2.84 ± 0.37 a 13.26 ± 0.10 a 7.61 ± 0.50 a 3.77 ± 0.29 a 5.96 ± 0.32 a 17.33 ± 0.85 a NO3− 6.30 ± 0.35 ab 4.23 ± 0.08 a 2.45 ± 0.05 ab 12.98 ± 0.30 a 7.81 ± 0.30 a 3.42 ± 0.08 a 5.62 ± 0.42 a 16.85 ± 0.46 a LX-3 CK 4.65 ± 0.04 c 2.26 ± 0.04 b 1.35 ± 0.01 b 8.25 ± 0.02 c 4.89 ± 0.25 b 2.02 ± 0.10 b 2.84 ± 0.33 c 9.75 ± 0.52 c Urea 6.43 ± 0.09 a 2.98 ± 0.40 ab 2.08 ± 0.12 a 11.50 ± 0.23 a 6.62 ± 0.07 a 2.65 ± 0.12 a 4.10 ± 0.15 b 13.38 ± 0.11 b NH4+ 5.92 ± 0.13 b 3.20 ± 0.38 a 2.41 ± 0.24 a 11.53 ± 0.25 a 6.43 ± 0.27 a 2.84 ± 0.15 a 4.93 ± 0.25 a 14.20 ± 0.04 a NO3− 5.67 ± 0.26 b 3.16 ± 0.63 a 2.22 ± 0.27 a 11.06 ± 0.18 b 6.43 ± 0.34 a 2.69 ± 0.15 a 4.71 ± 0.37 a 13.82 ± 0.55 ab 2021 T-43 CK 5.55 ± 0.38 b 2.90 ± 0.03 b 1.77 ± 0.08 c 10.23 ± 0.46 b 7.02 ± 0.81 a 2.73 ± 0.19 c 4.62 ± 0.46 b 14.37 ± 1.24 b Urea 6.81 ± 0.56 a 3.19 ± 0.21 a 2.11 ± 0.18 bc 12.11 ± 0.54 a 7.34 ± 0.12 a 3.01 ± 0.16 bc 5.05 ± 0.21 ab 15.40 ± 0.32 ab NH4+ 6.52 ± 0.31 a 3.25 ± 0.23 a 2.63 ± 0.43 a 12.40 ± 0.26 a 7.42 ± 0.34 a 3.49 ± 0.17 a 5.68 ± 0.35 a 16.59 ± 0.68 a NO3− 6.80 ± 0.33 a 2.49 ± 0.17 a 2.39 ± 0.23 ab 11.67 ± 0.42 a 7.60 ± 0.34 a 3.22 ± 0.07 ab 5.42 ± 0.43 a 16.24 ± 0.61 a LX-3 CK 6.66 ± 0.35 a 2.81 ± 0.09 a 1.00 ± 0.13 b 10.47 ± 0.30 a 5.89 ± 0.35 b 2.26 ± 0.08 b 3.59 ± 0.50 b 11.74 ± 0.91 b Urea 7.02 ± 0.18 a 3.02 ± 0.27 a 1.13 ± 0.08 ab 11.17 ± 0.38 a 7.88 ± 0.05 a 3.09 ± 0.30 a 5.59 ± 0.12 a 16.56 ± 0.44 a NH4+ 6.82 ± 0.84 a 3.06 ± 0.06 a 1.37 ± 0.20 a 11.25 ± 0.80 a 7.70 ± 0.27 a 3.17 ± 0.06 a 5.69 ± 0.33 a 16.57 ± 0.04 a NO3− 7.04 ± 0.09 a 2.84 ± 0.06 a 1.08 ± 0.21 ab 10.97 ± 0.30 a 7.63 ± 0.25 a 3.06 ± 0.35 a 5.43 ± 0.42 a 16.12 ± 0.32 a p-Value Cultivar (C) ns ** ** ** ** ** ** ** Nitrogen forms (N) ** * ** ** ** ** ** ** C × N ns ns ns ns ns ns ns ns HS, heading stage; 20 DAH, 20 d after heading. Different letters indicate that the values for the same cultivar were significantly different within the same year (p = 0.05). * and ** indicate significance at the p = 0.05 and 0.01 levels, respectively, and NS indicates nonsignificance at the p = 0.05 level. Table 1.
Effects of N form on the mass of drip-irrigated rice.
Figures
(9)
Tables
(1)