-
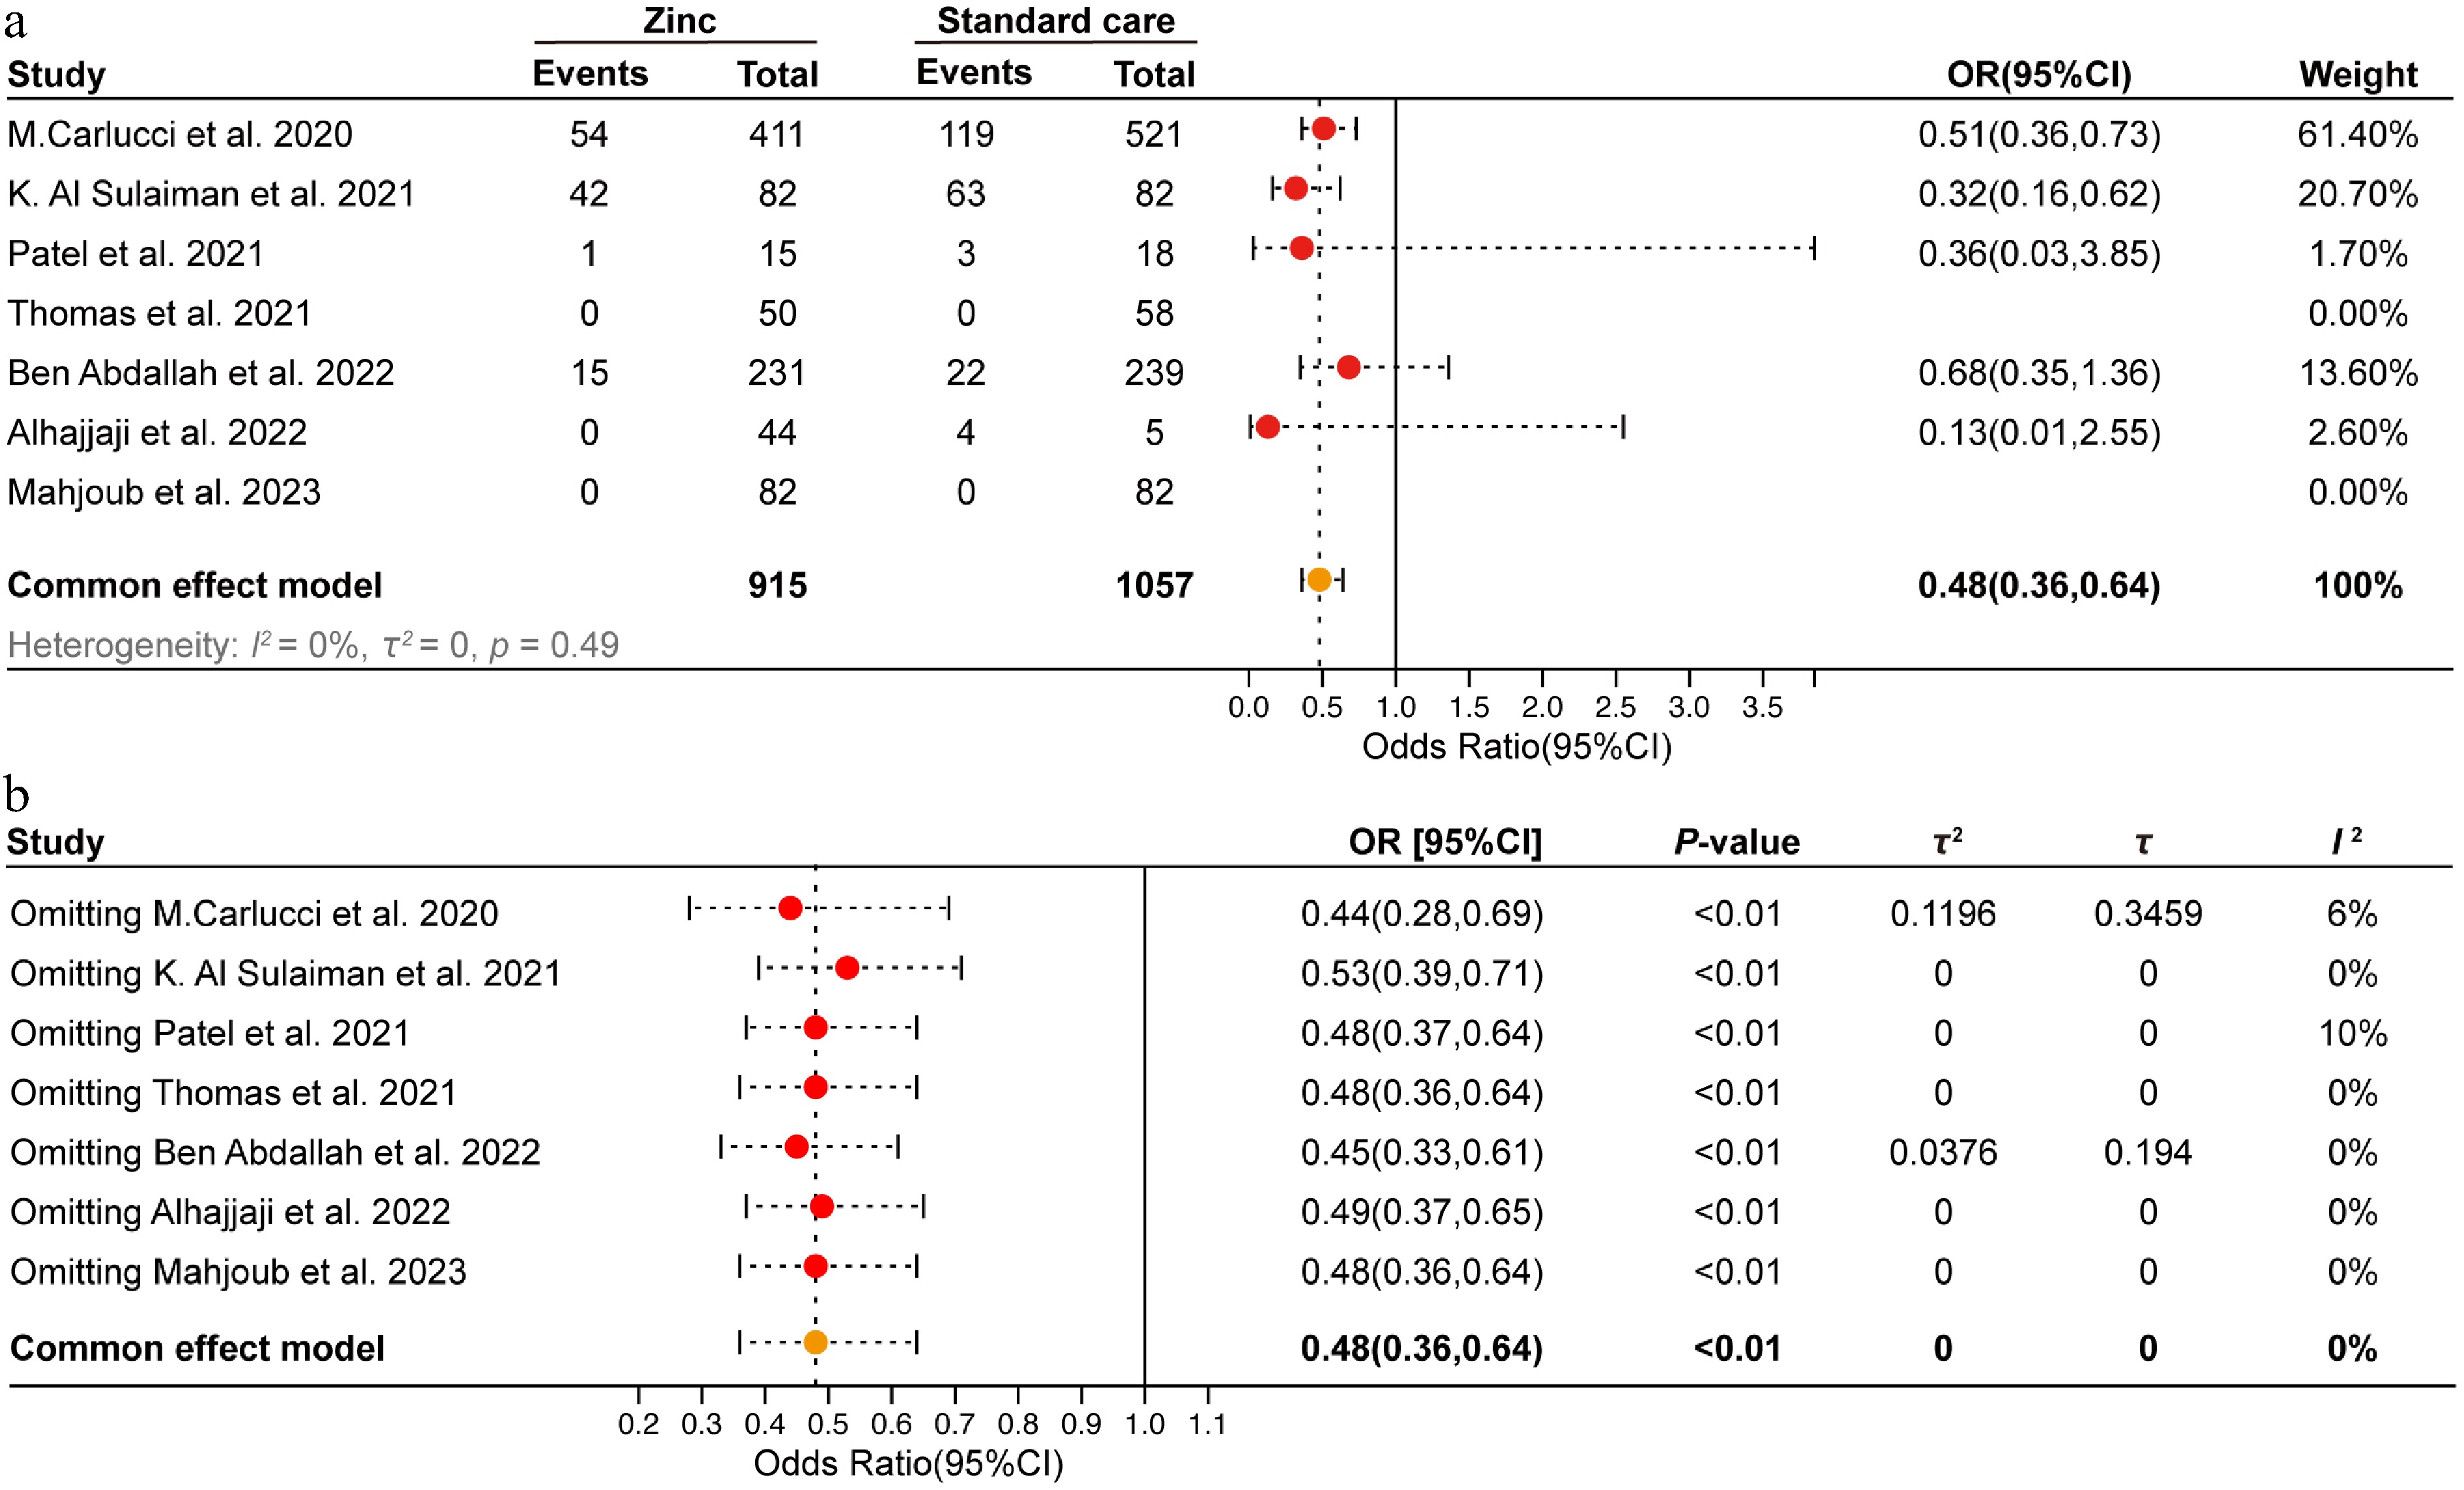
Figure 1.
Meta-analysis of zinc supplementation on in-hospital mortality in COVID-19 patients. (a) Forest plot of in-hospital mortality of zinc supplementation and standard care groups. (b) Sensitivity analysis was conducted by sequentially excluding one study at a time to assess the robustness of the findings.
-
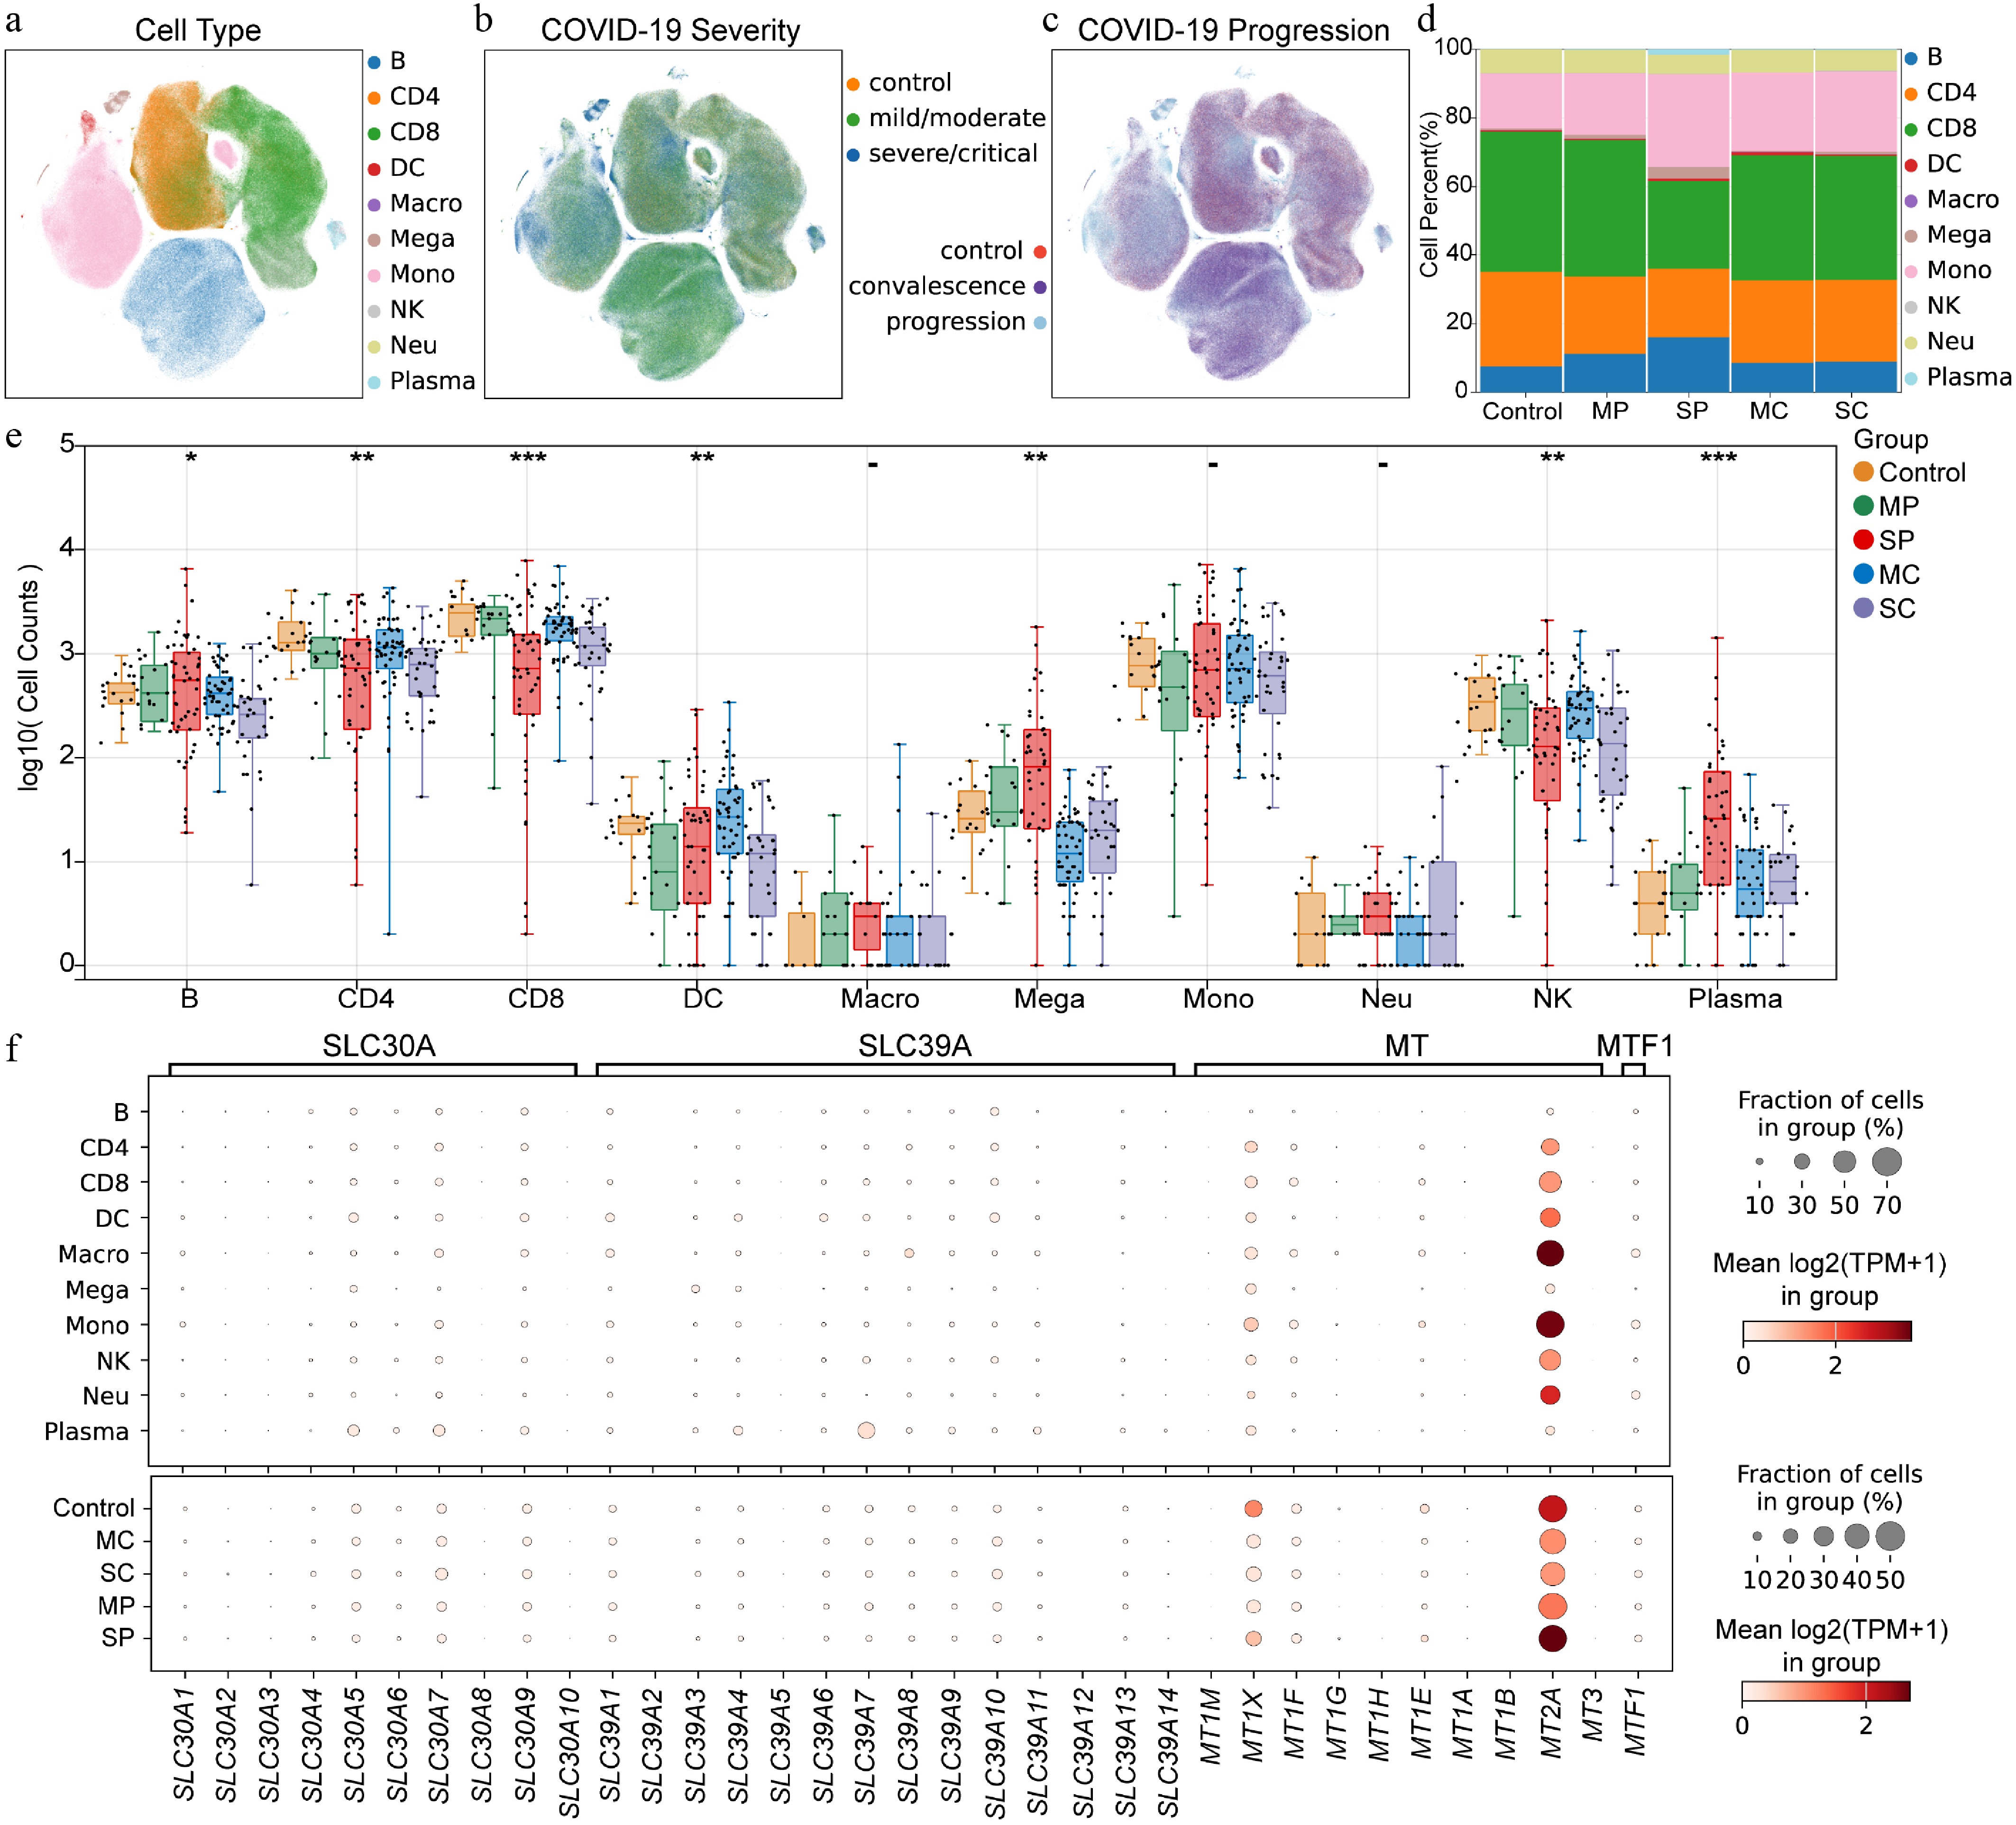
Figure 2.
Expression pattern of zinc homeostasis related genes in PBMCs from patients with COVID-19 at single cell level. (a) Distribution of cell subpopulations. B indicates B cells, CD4 indicates CD4+ T cells, CD8 indicates CD8+ T cells, DC indicates dendritic cells, Macro indicates macrophages, Mega indicates megakaryocytes, Mono indicates monocytes, NK indicates natural killer cells, Neu indicates neutrophils, Plasma indicates plasma cells. (b) Cell distribution of COVID-19 samples with different severity. (c) Cell distribution of COVID-19 samples with disease progression. (d) Cell proportions in different status of COVID-19 patients. MP means mild/moderate progression. SP indicates severe/critical progression. MC indicates mild/moderate recovery. SC indicates severe/critical convalescence. (e) Number of immune cells in PBMC across different disease states of COVID-19 at the individual level. (f) Expression patterns of zinc homeostasis-related genes within different cell subpopulations and across different stages of COVID-19. Asterisks denote Benjamini–Hochberg FDR-adjusted p values (* p < 0.05, ** p < 0.01, *** p < 0.001).
-
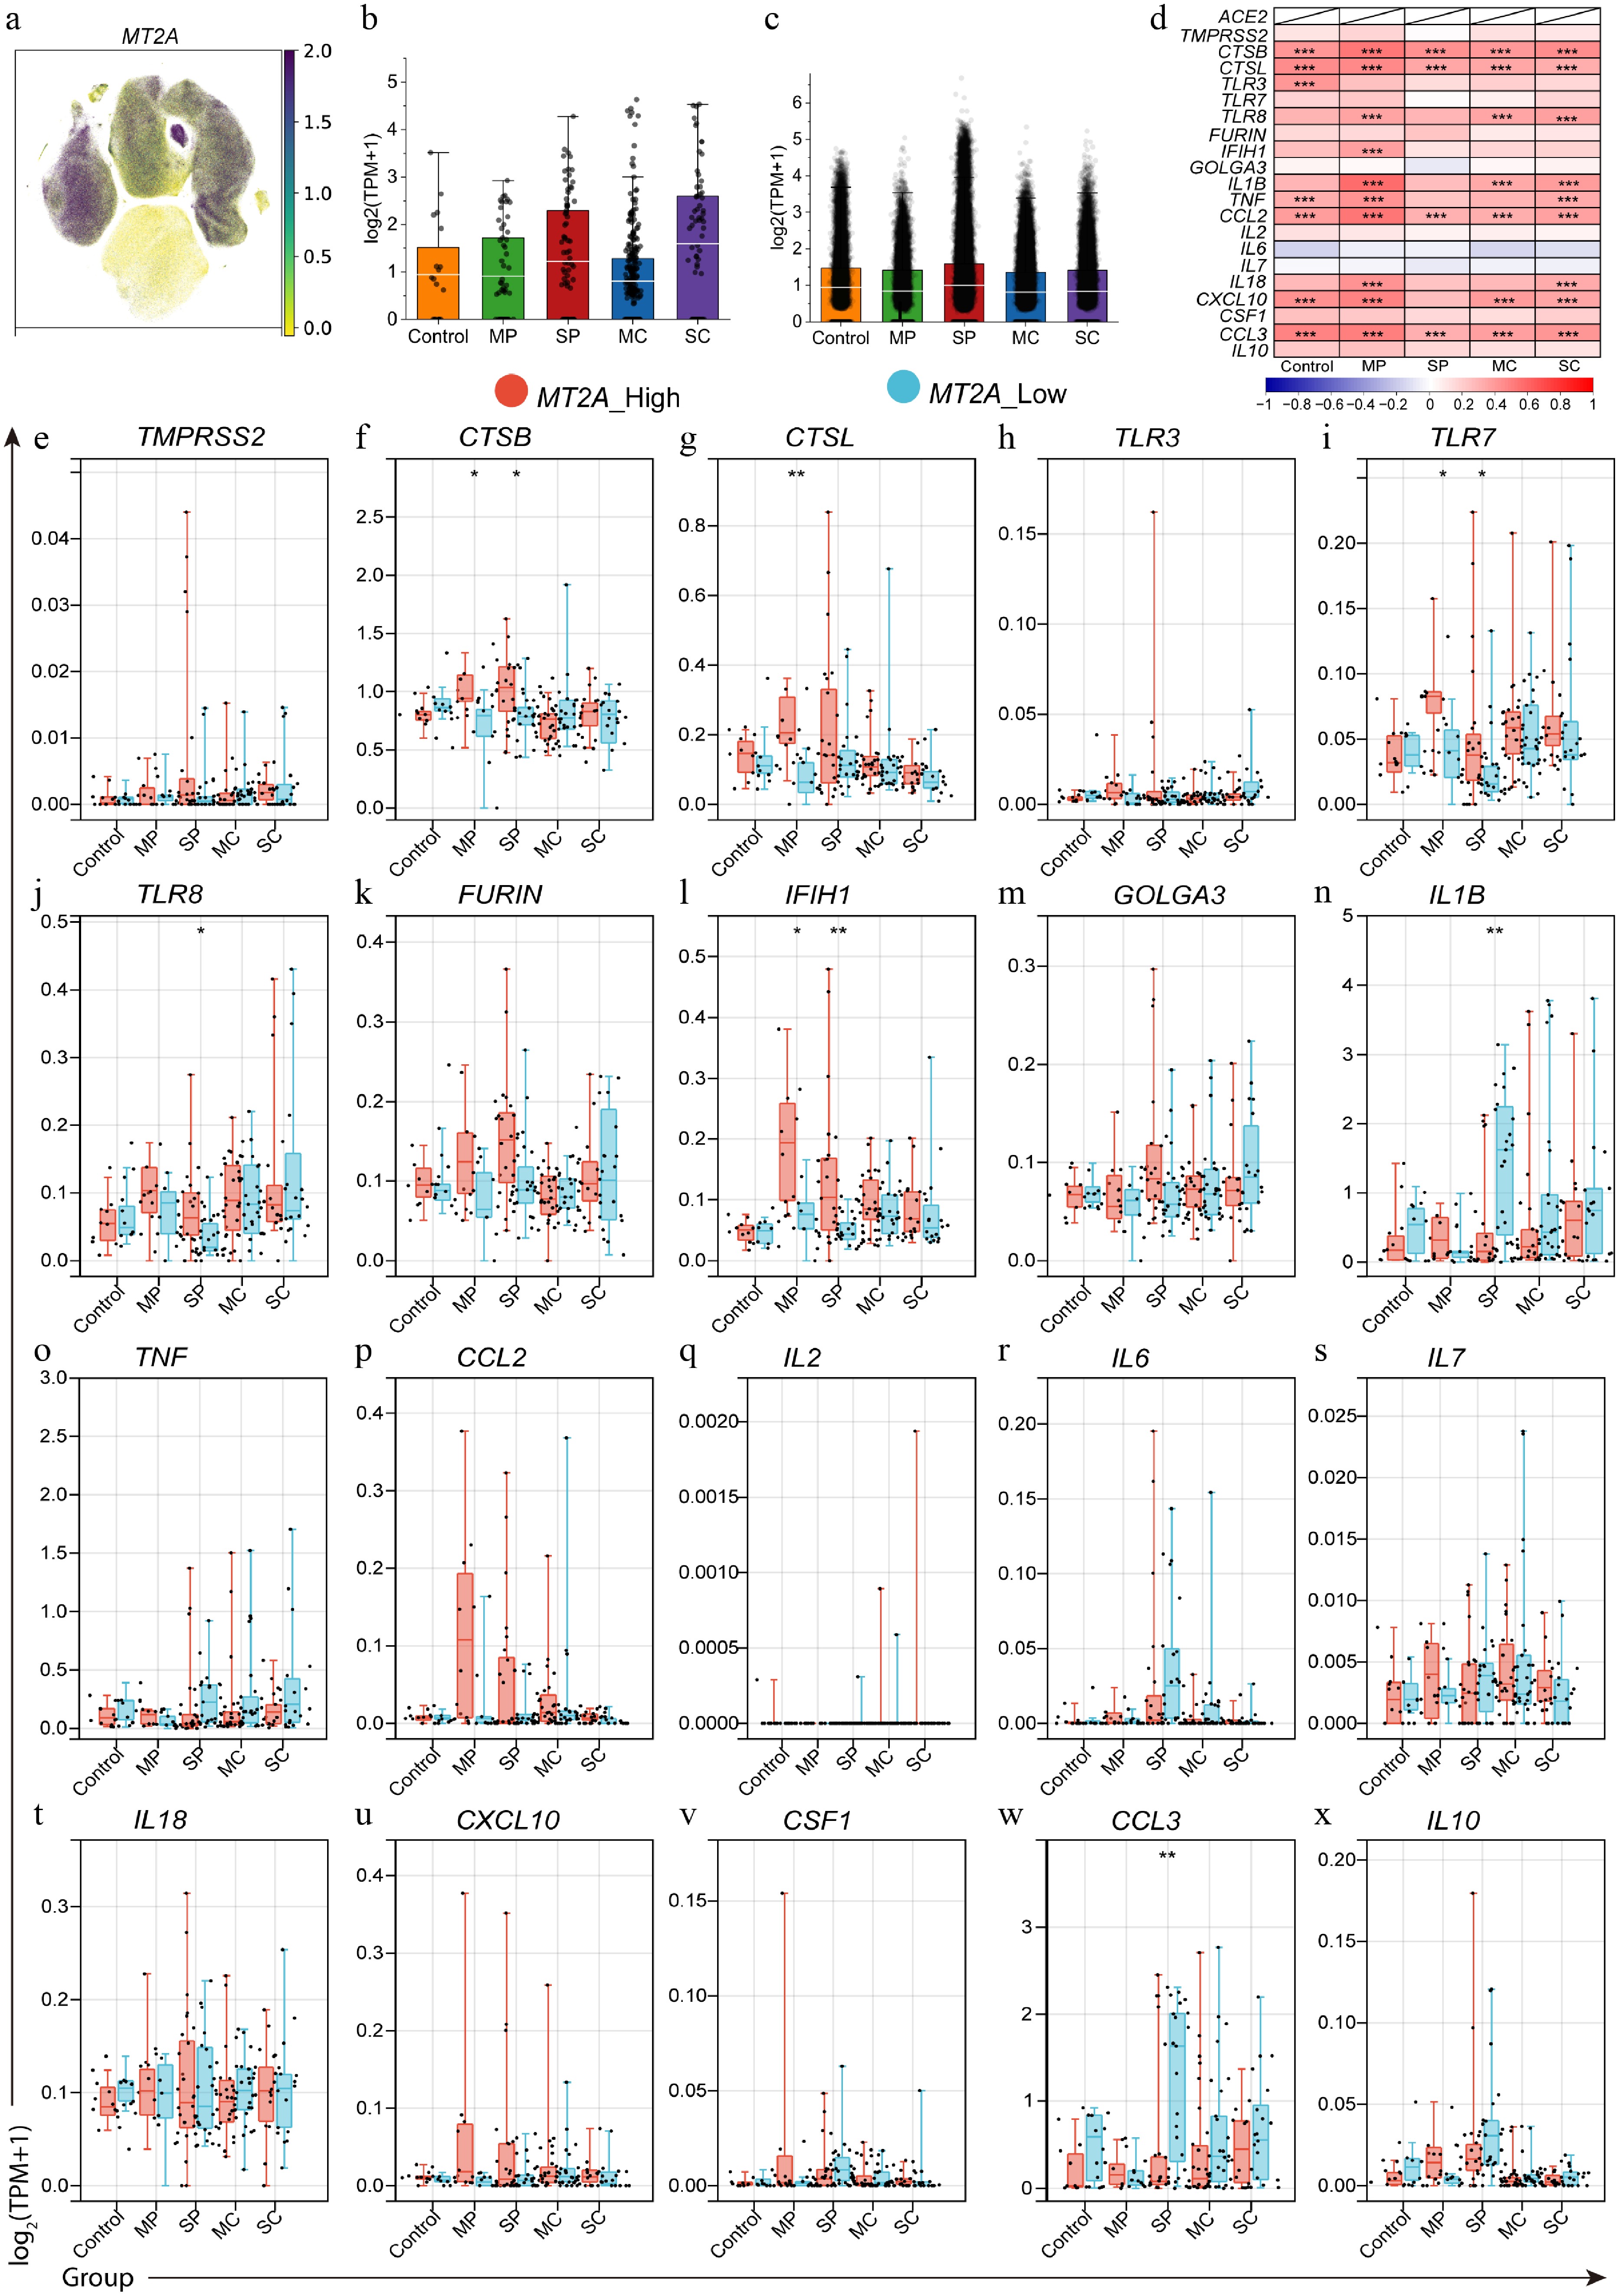
Figure 3.
Differential expression of SARS-CoV-2 infection-related genes between MT2A-high and MT2A-low PBMC samples in different disease states. (a) MT2A expression in different cell types in PBMC samples from COVID-19 patients. MT2A expression levels in (b) macrophages, and (c) monocytes of different COVID-19 status. (d) Expression correlation between MT2A and SARS-CoV-2 infection-related genes in PBMCs of five groups. (e)–(x) The differential expression of various COVID-19-related genes between MT2A-high and MT2A-low monocytes under different disease status. Asterisks denote Benjamini–Hochberg FDR-adjusted p values (* p < 0.05, ** p < 0.01, *** p < 0.001).
-
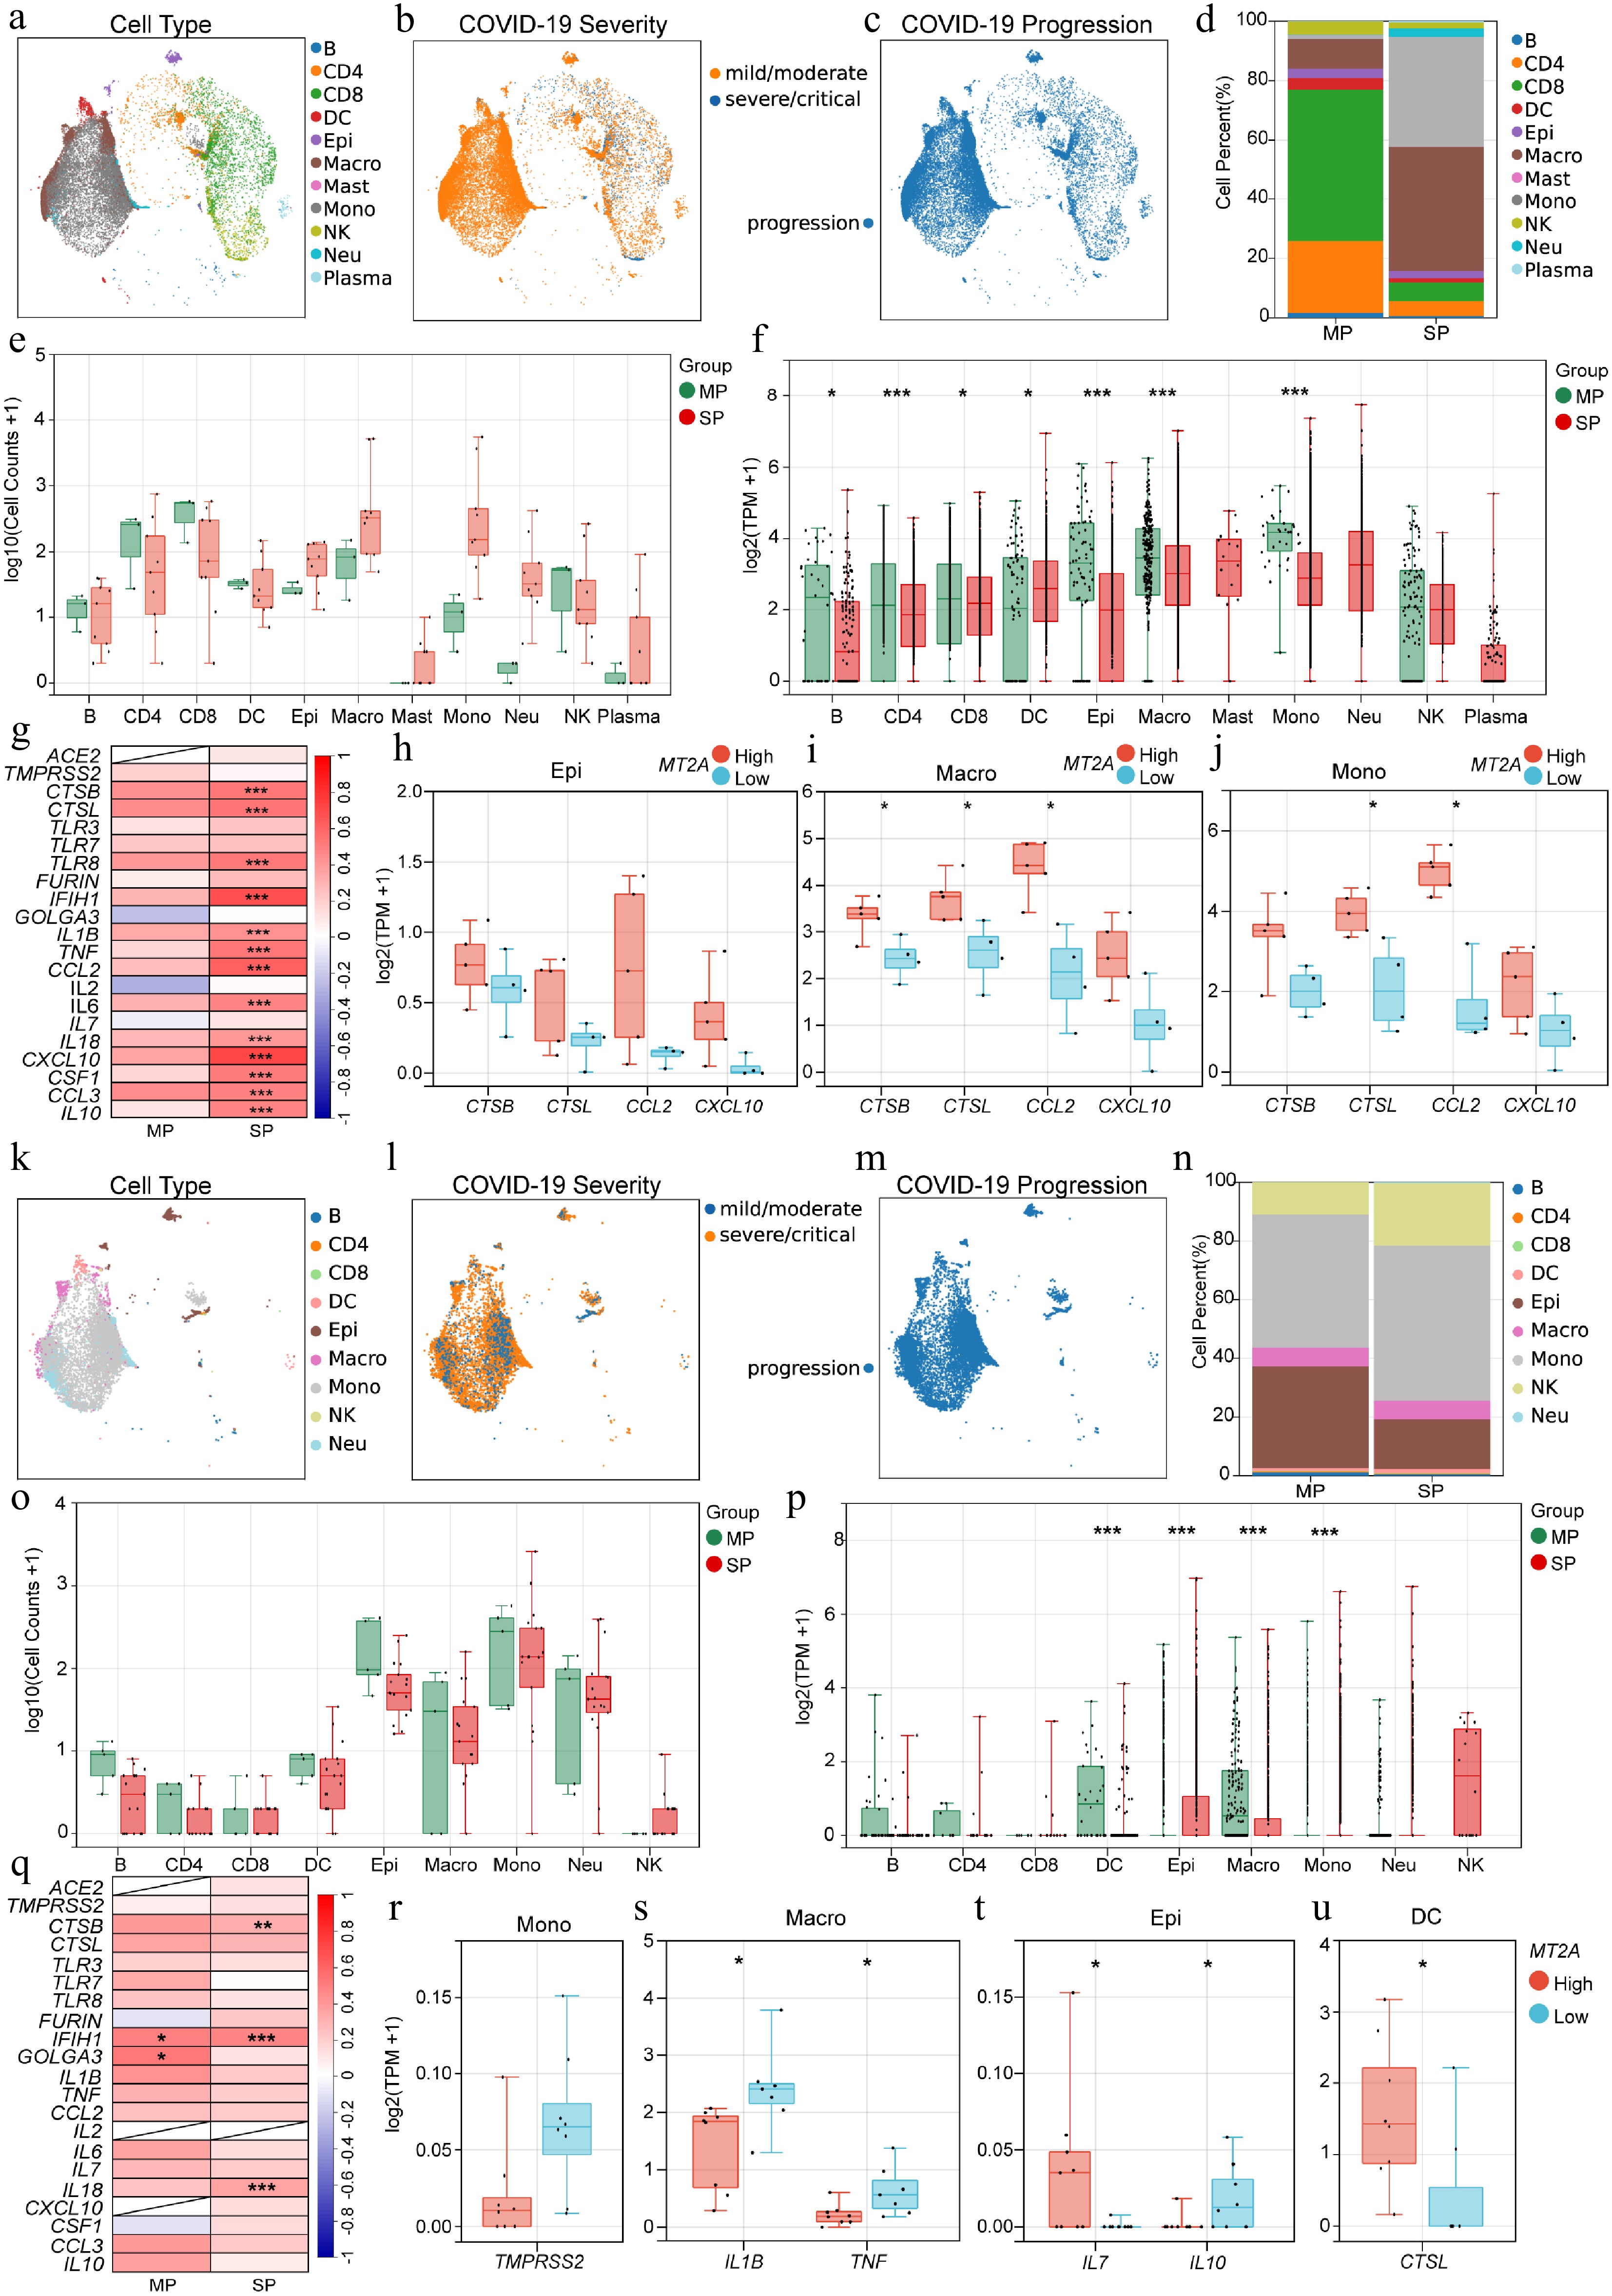
Figure 4.
Association of MT2A and SARS-CoV-2 infection-related genes in BALF and sputum samples. Distribution of (a) immune cell types, (b) disease severity, and (c) progression status of BALF samples from COVID-19 patients. (d) Differential proportions, and (e) cell counts, of various immune cells in BALF between MP and SP groups. (f) MT2A expression in different immune cells between MP and SP groups. (g) Expression correlation between MT2A and SARS-CoV-2 infection-related genes in BALF of MP and SP groups. Differential expression genes between MT2A-high and MT2A-low (h) epithelial cells, (i) macrophages, and (j) monocytes in BALF. (k) Immune cell type distribution, (l) disease severity, and (m) progression status of sputum samples from COVID-19 patients. (n) Different proportions, and (o) cell counts, of different immune cells in sputum samples between MP and SP groups. (p) MT2A expression in different immune cells between MP and SP groups. (q) Expression correlation between MT2A and SARS-CoV-2 infection-related genes in sputum samples of MP and SP groups. Differential expression genes between MT2A-high and MT2A-low (r) monocytes, (s) macrophages, (t) epithelial cells, and (u) DCs in sputum samples. Asterisks denote Benjamini–Hochberg FDR-adjusted p values (* p < 0.05, ** p < 0.01, *** p < 0.001). For correlation analysis, *** means Benjamini–Hochberg FDR-adjusted p < 0.001, and absolute Spearman's correlation coefficient ≥ 0.3. Differential expression was assessed genome-wide within each cell type (MT2A-high vs MT2A-low).
-
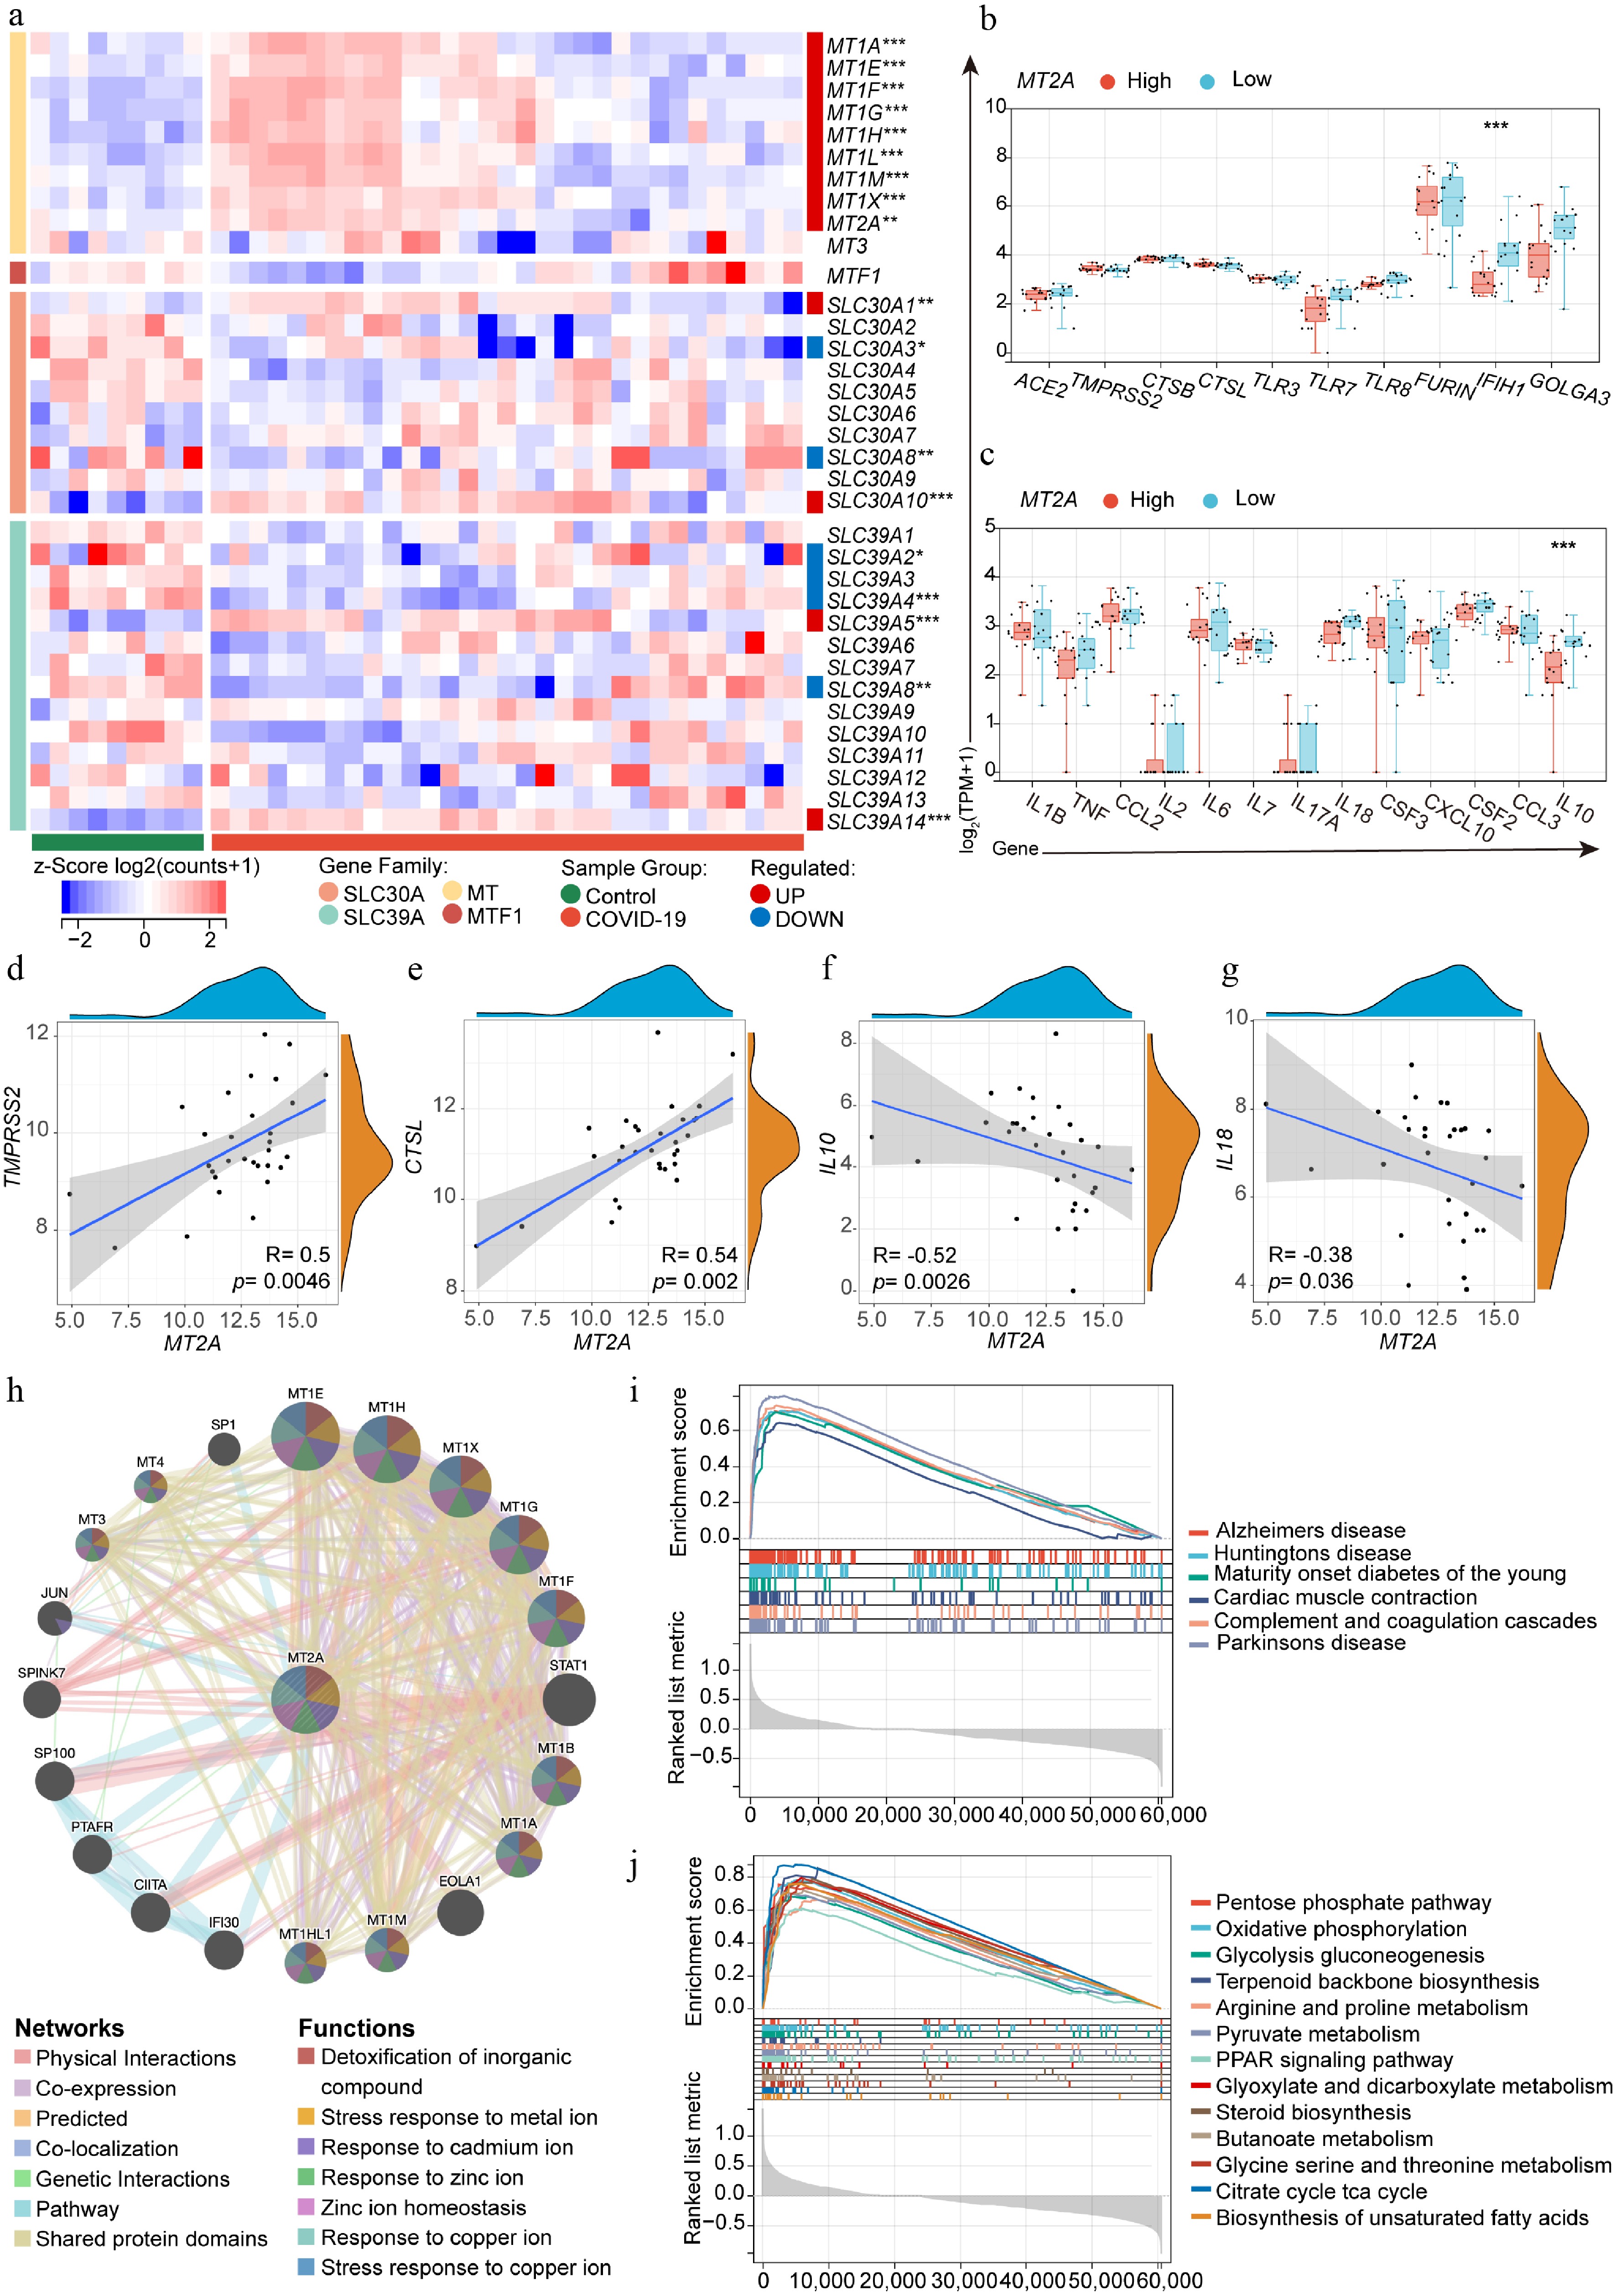
Figure 5.
Lung MT2A expression and its association with SARS-CoV-2 infection-related genes. (a) Differential expression of zinc homeostasis-related genes in lung tissue from deceased COVID-19 patients (n = 31) and normal controls (n = 9). (b), (c) Differential expression of SARS-CoV-2 infection-related genes in MT2A-high and MT2A-low lung tissues from COVID-19 patients. Correlation of MT2A expression with (d) TMPRSS2, (e) CTSL, (f) IL10, and (g) IL18 in the lungs of deceased COVID-19 patients. (h) The protein-protein interaction network centered on MT2A was identified using the STRING database. Lung tissues from COVID-19 patients were classified into MT2A-high and MT2A-low groups using the median expression of MT2A as a cut-off. Using the MT2A-low group as a control, (i) MT2A-associated diseases, and (j) cellular biological processes or pathways, were predicted using GSEA. These results were generated using the GSE183533 dataset from the GEO database. Asterisks denote Benjamini–Hochberg FDR-adjusted p values (* p < 0.05, ** p < 0.01, *** p < 0.001).
-
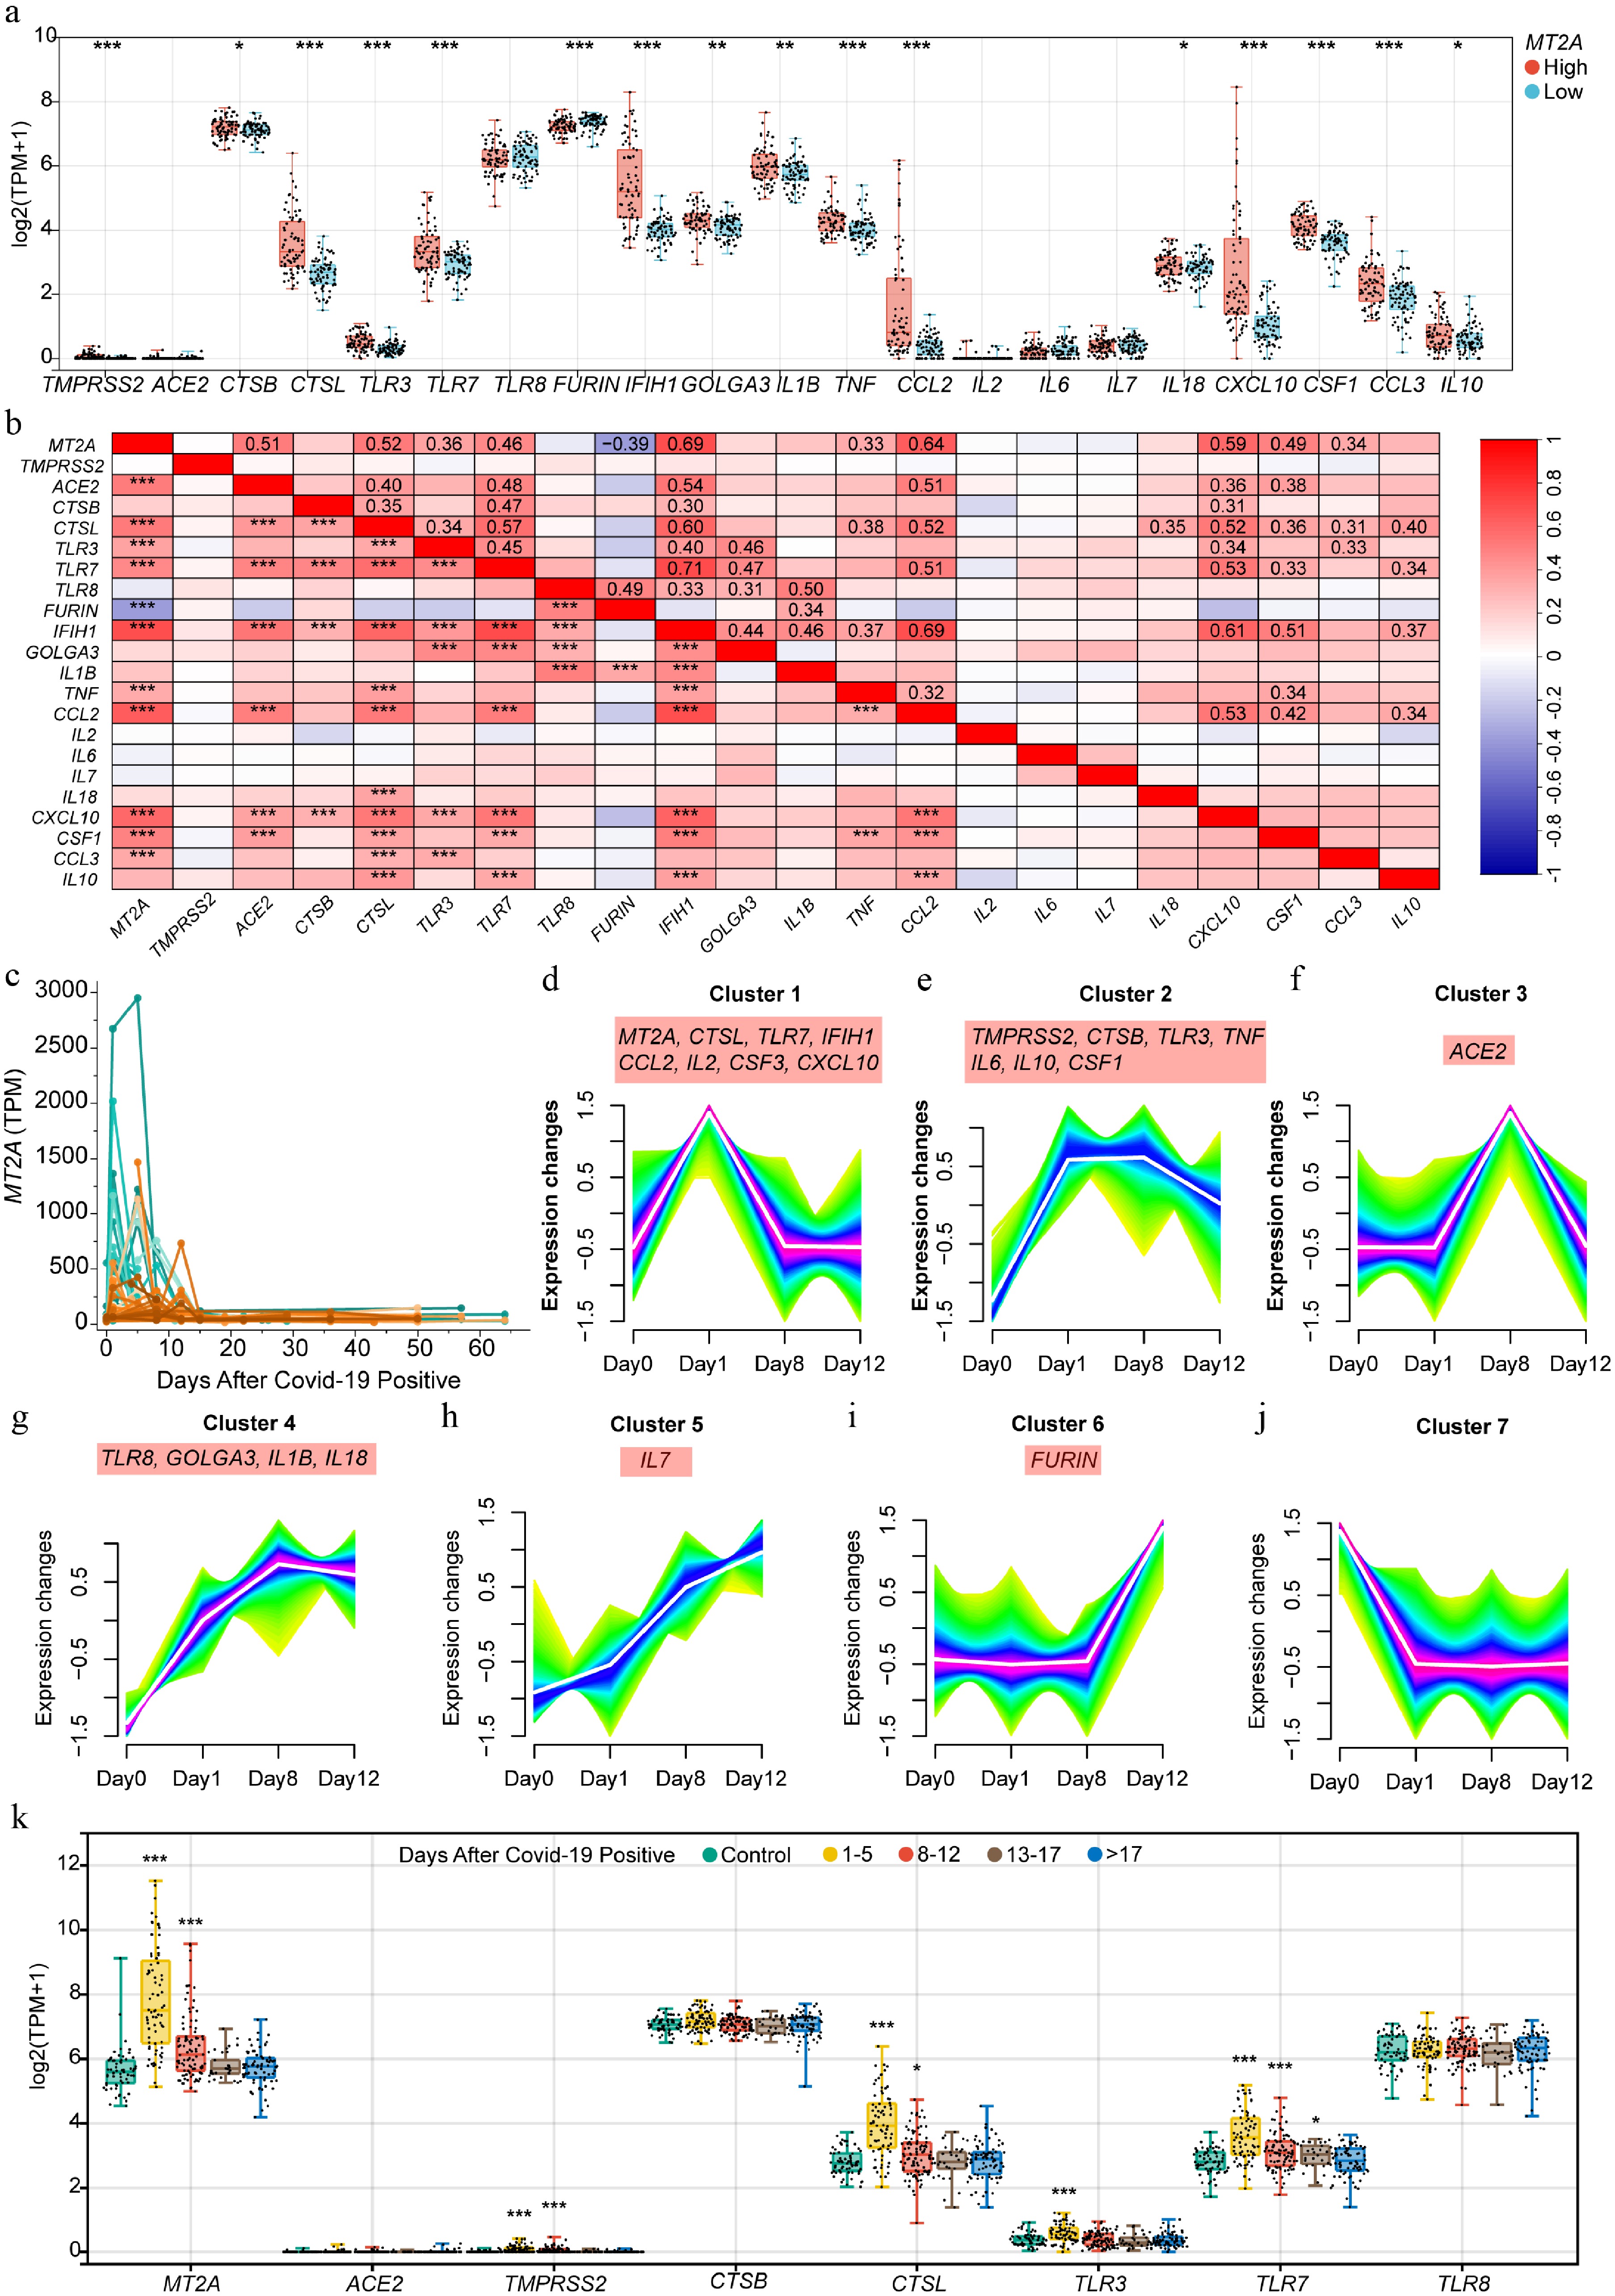
Figure 6.
MT2A expression in peripheral blood and its association with SARS-CoV-2 infection-related genes during infection. (a) Differential expression of COVID-19-related genes between MT2A-high and MT2A-low peripheral blood samples from 338 specimens of 72 COVID-19 patients. (b) Correlation of expression levels of MT2A and SARS-CoV-2 infection-related genes. (c) Changes in peripheral blood MT2A expression levels during the course of infection in 72 COVID-19 patients. Seven gene clusters associated with (d) MT2A, and/or (e)–(j) COVID-19-related key genes based on expression similarity during SARS-CoV-2 infection in nine patients with complete timepoint data. (k) The expression changes of MT2A, ACE2, TMPRSS2, CTSB, CTSL, TLR3, TLR7, and TLR8 in different time periods after SARS-CoV-2 infection. Asterisks denote Benjamini-Hochberg FDR-adjusted p values (* p < 0.05, ** p < 0.01, *** p < 0.001). For correlation analysis, *** means Benjamini–Hochberg FDR-adjusted p < 0.001, and absolute Spearman's correlation coefficient ≥ 0.3.
Figures
(6)
Tables
(0)