-
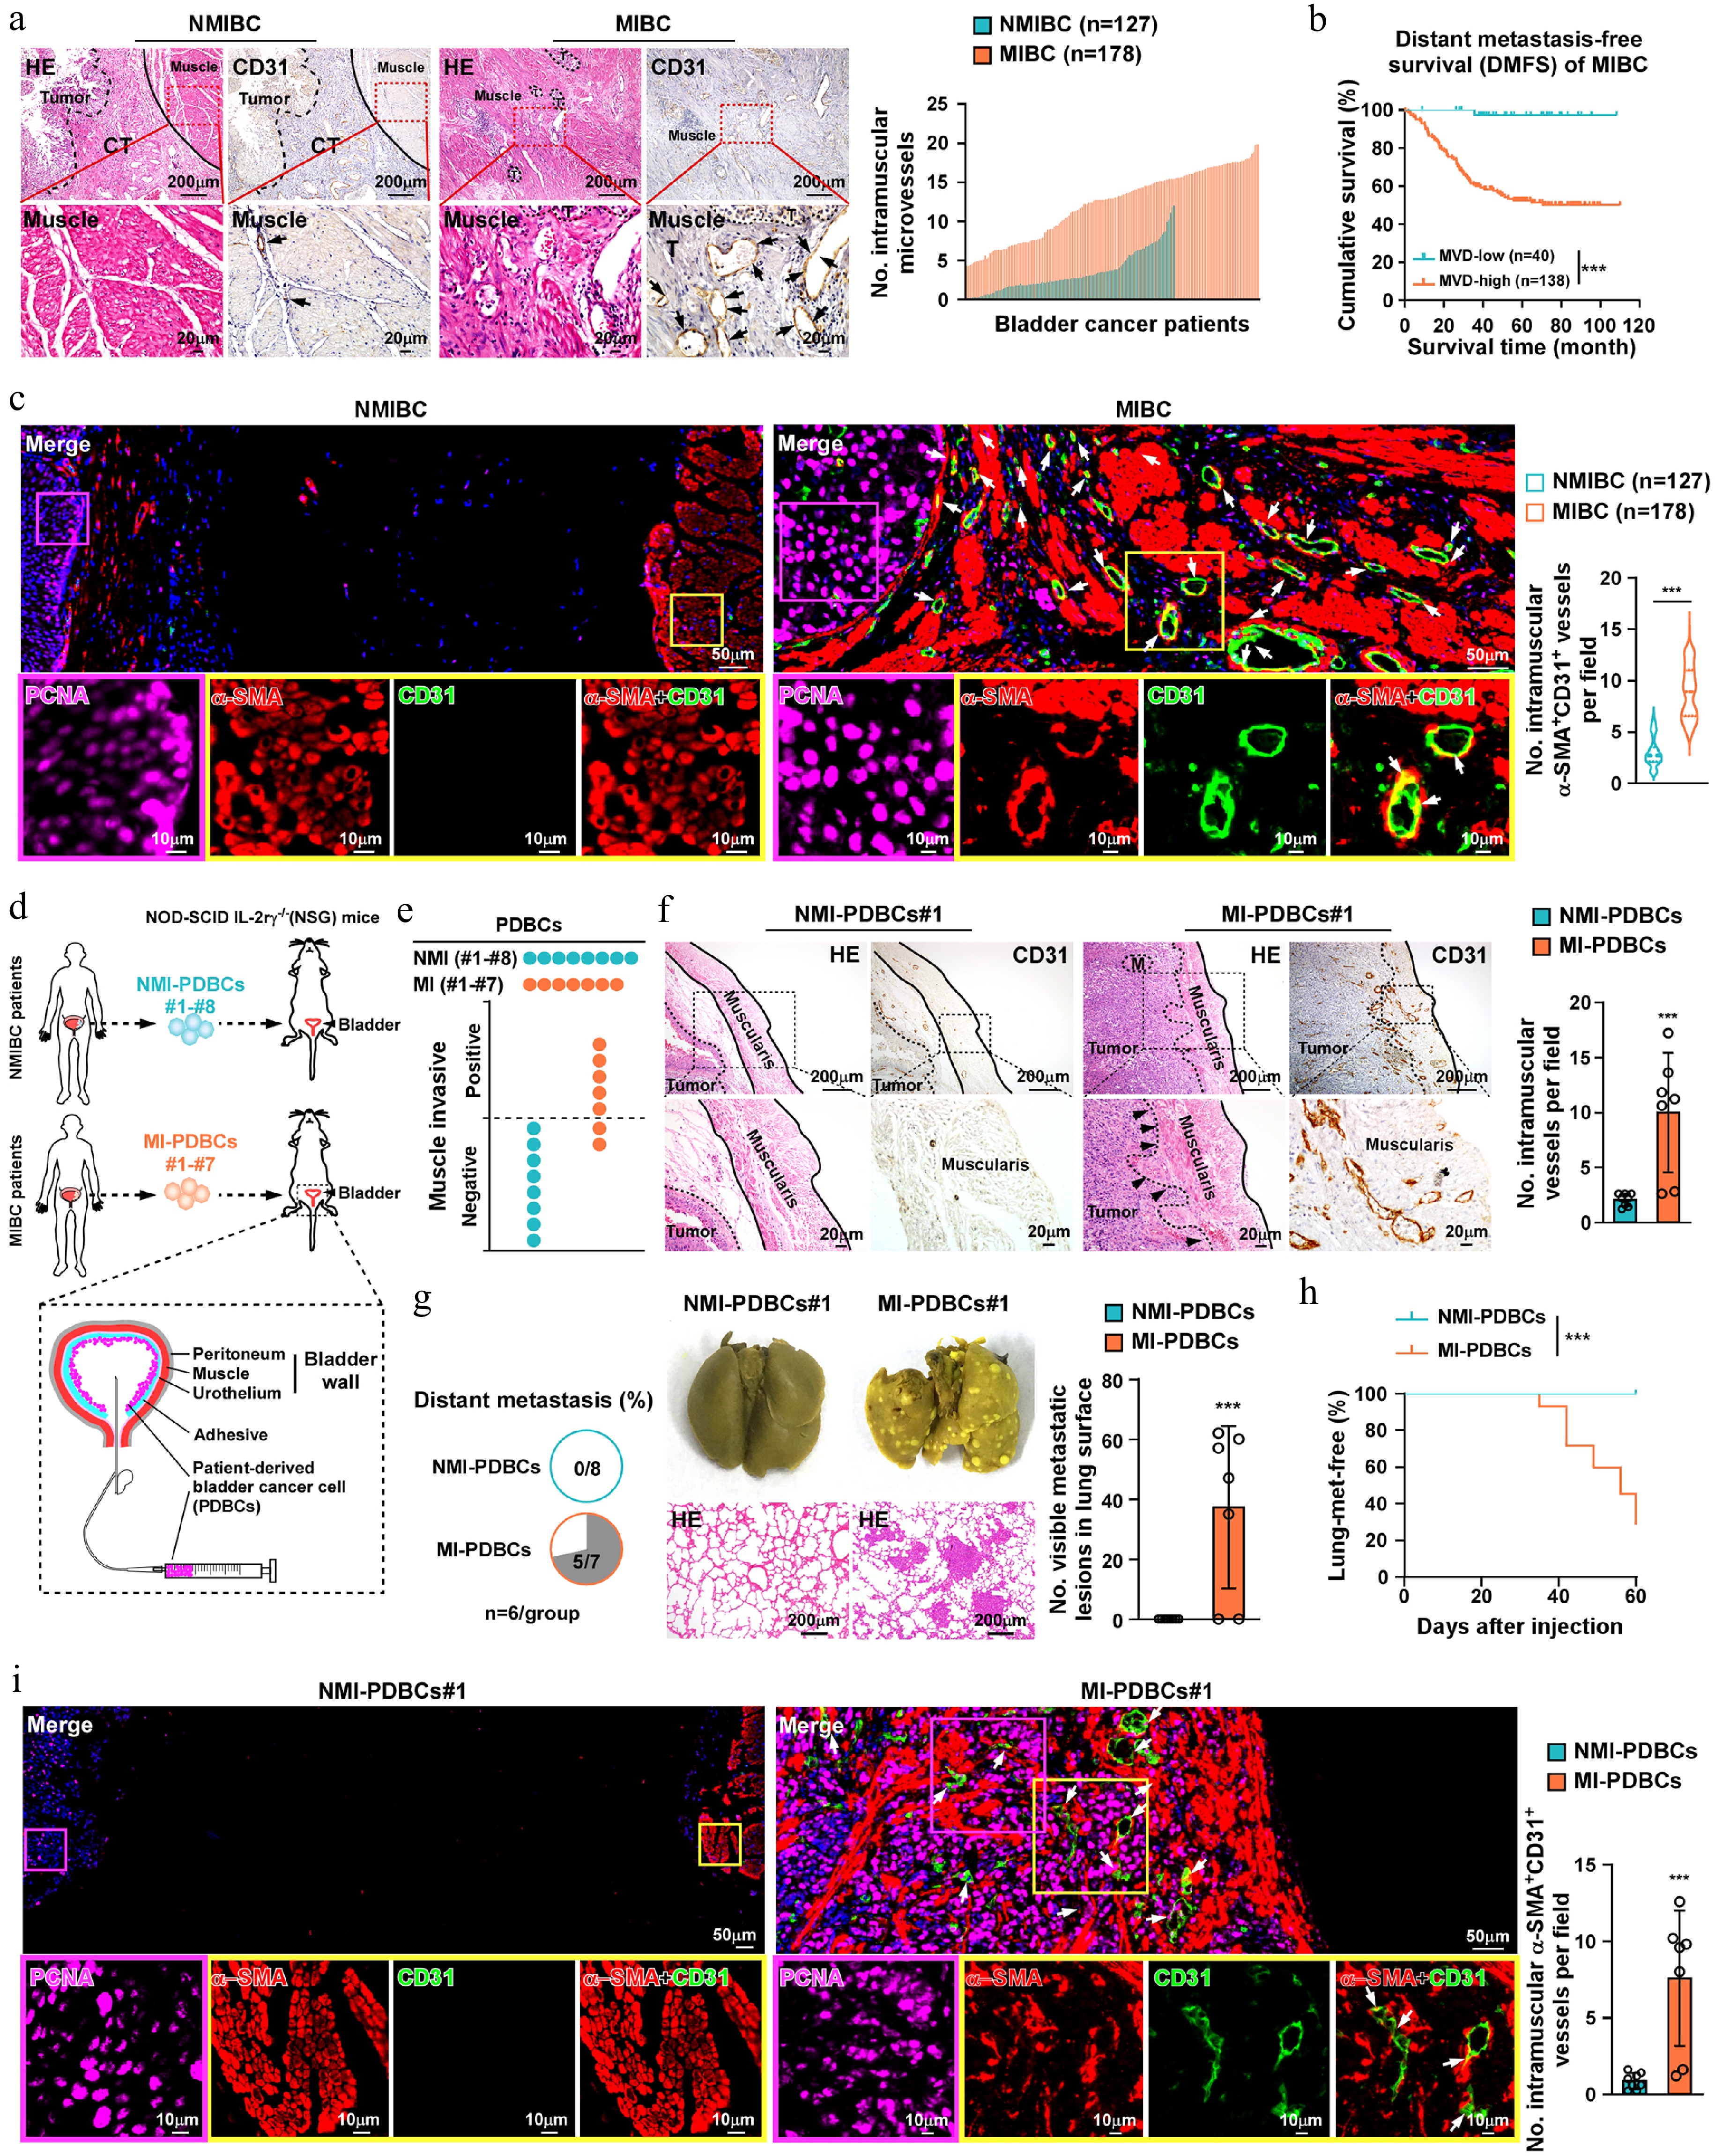
Figure 1.
Increased vessel density within muscularis correlates with distant metastasis in MIBC. (a) The representative histological images (H&E and IHC staining of CD31; left) and the quantification of CD31+ vessels in muscularis (right) among NMIBC (n = 127) and MIBC (n = 178) specimens. Muscle, muscularis layer; Tumor, tumor; CT, connective tissues; and black arrows indicate CD31+ vessels. Scale bars, 200 µm. Scale bars insets, 20 μm. (b) Kaplan-Meier analysis of distant metastasis-free survival in MIBC patients (n = 178) with high or low microvessel density (MVD). (c) Representative images of PCNA, CD31 and α-SMA immunostaining in NMIBC (n = 127) or MIBC samples (n = 178). Arrows indicate α-SMA+/CD31+ vessel in muscularis. Scale bars: 50 µm. Scale bars insets, 10 μm. (d) Schematic of establishing bladder orthotopic xenograft model with primary bladder cancer cells derived from MIBC or NMIBC patients (MI-PDBC or NMI-PDBCs). (e) Quantification of muscularis invasion and (f) representative images of CD31 and H&E in the indicated mice (No.#1–No.#8 for NMI-PDBCs and No.#1–No.#7 for MI-PDBCs). Scale bars, 200 µm. Scale bars insets, 20 μm. n = 6 mice/group. (g) Representative images and pie charts showing the lung metastatic nodules in indicated mice (NMI-PDBCs#1–#8; MI-PDBCs#1–#7). Scale bars, 200 µm. n = 6 mice/group. (h) Kaplan–Meier metastasis-free survival curve of mice from the indicated experimental group. n = 6 mice/group. (i) Representative images of anti-PCNA, anti-CD31, and anti-α-SMA in bladder tumor xenografts from indicated group. White arrows indicate the intramuscular α-SMA+/CD31+ vessel. Scale bars, 50 µm. Scale bars insets, 10 μm. Data are presented as the mean ± SD. Statistical analysis was performed using unpaired two-tailed t tests for (c), (f), (g) and (i), and Kaplan-Meier analysis method for (b) and (h). ** p < 0.01; *** p < 0.001; ns, not significant.
-
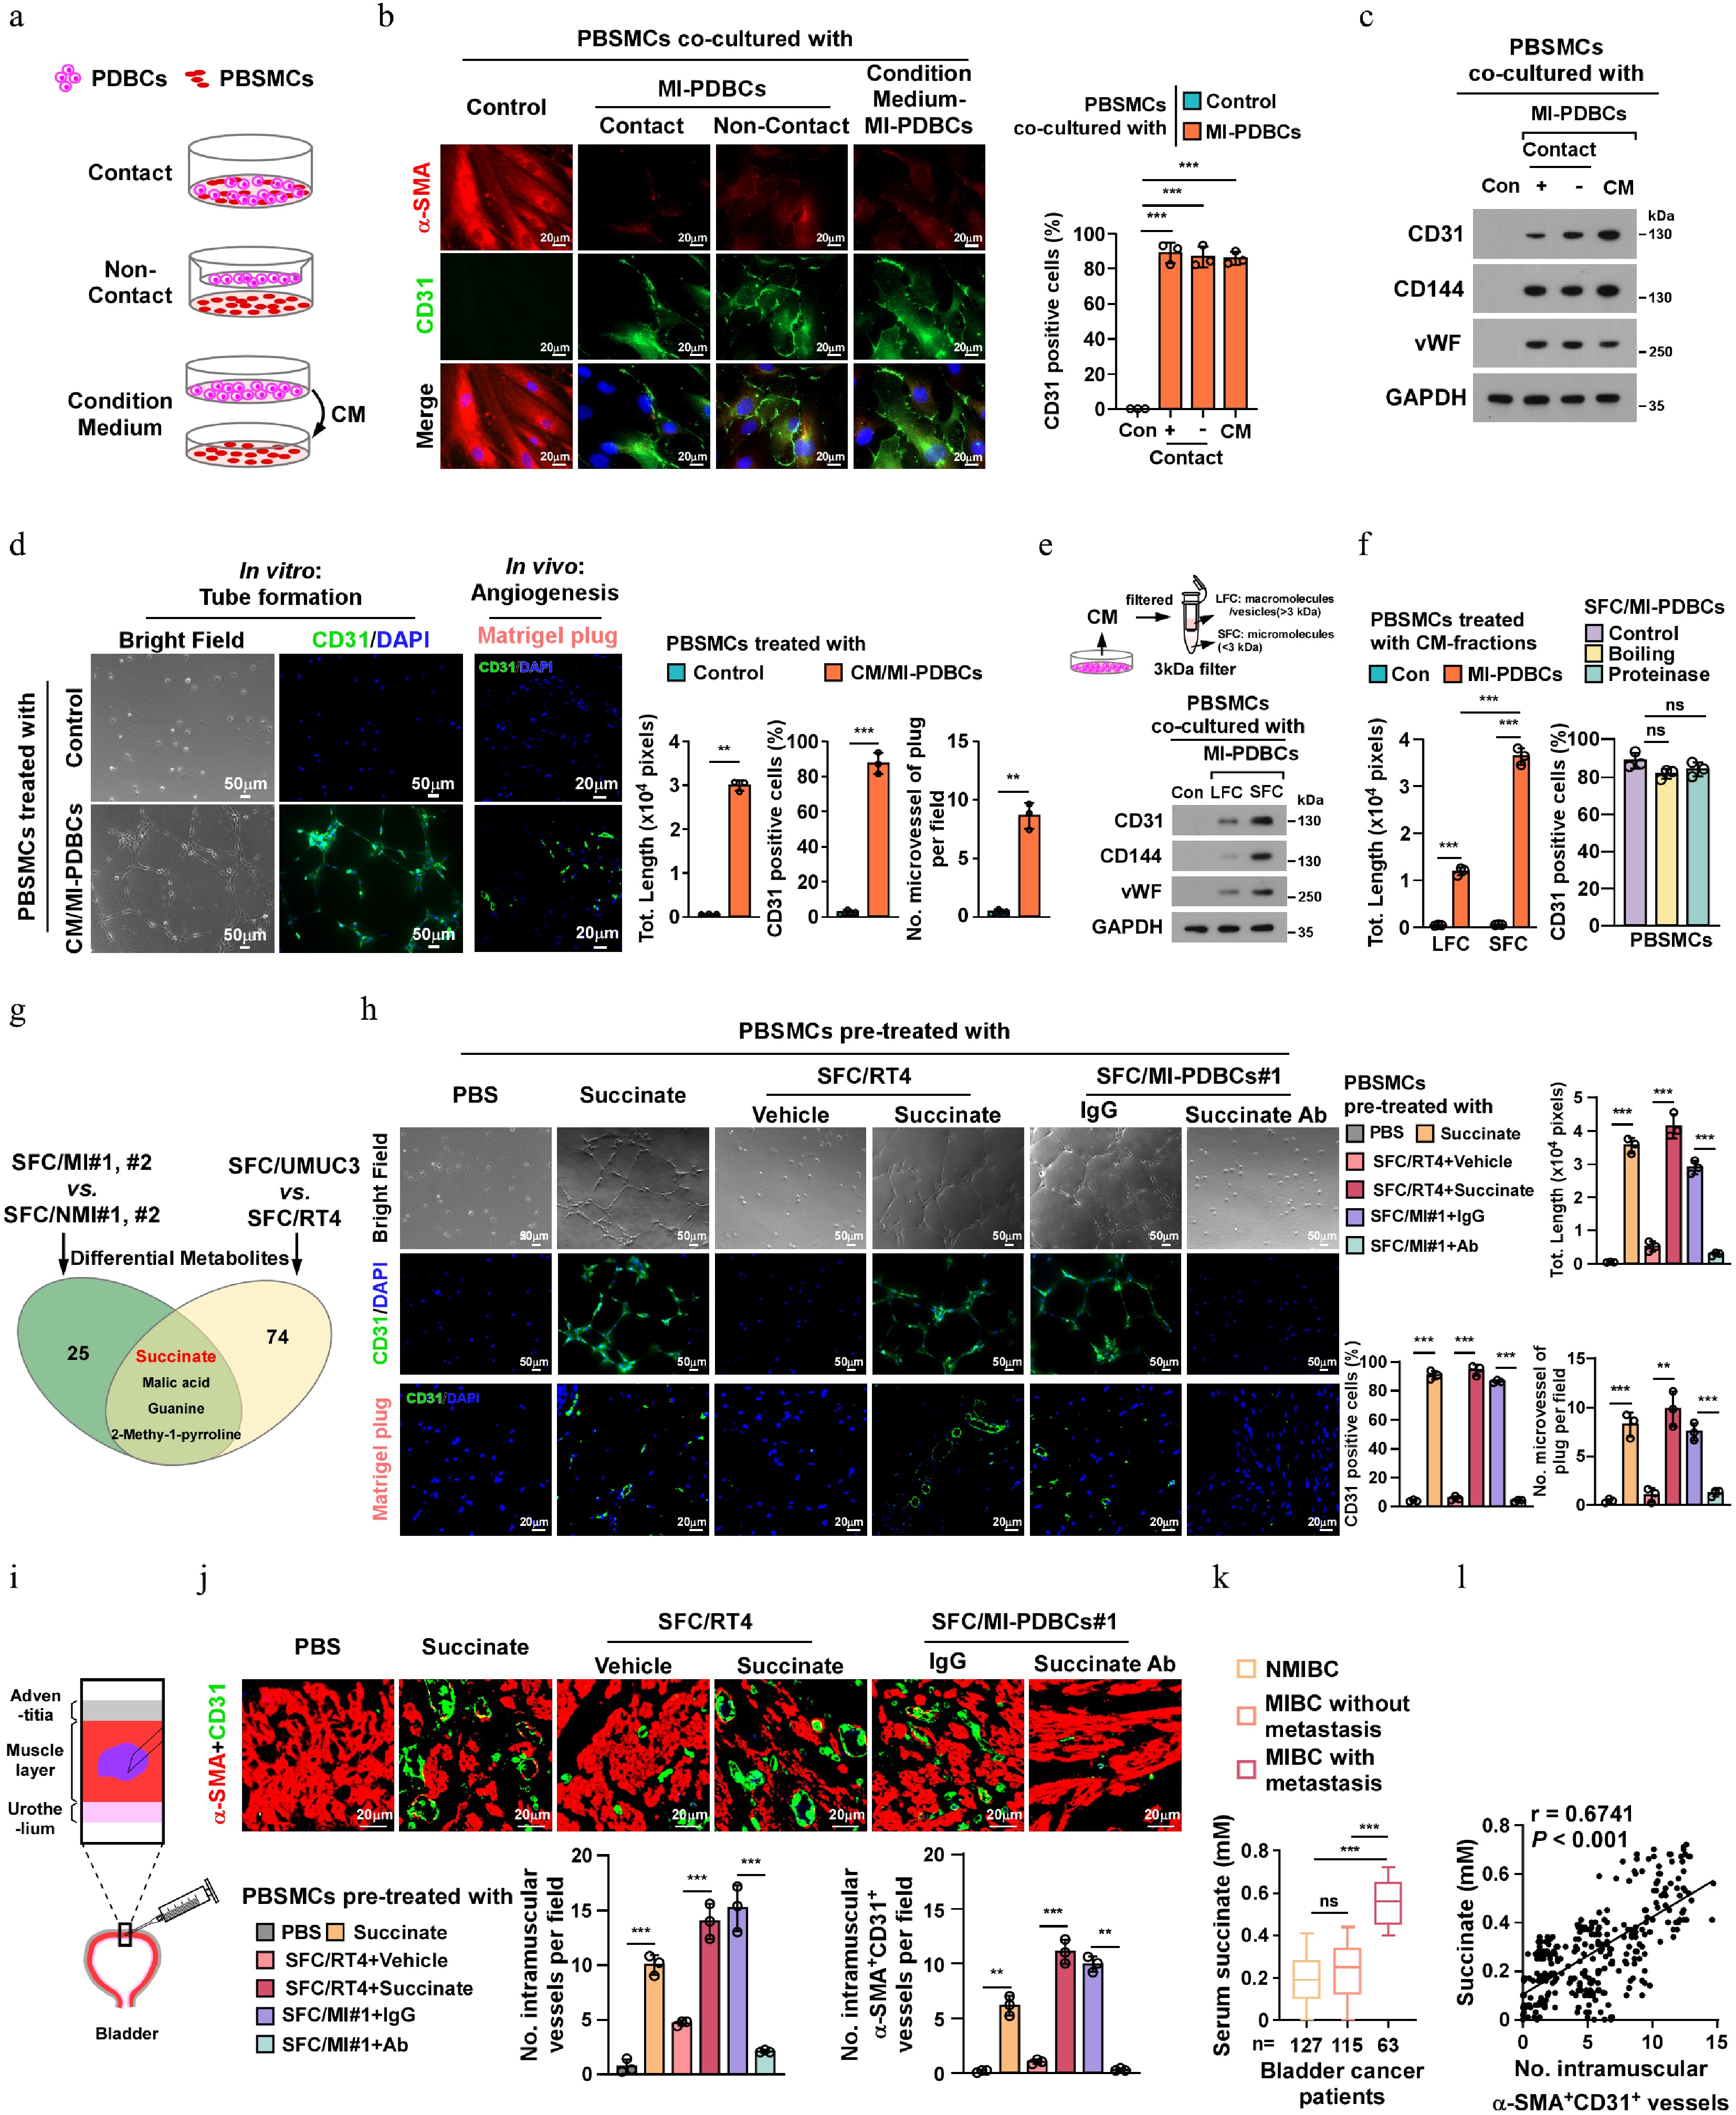
Figure 2.
MIBC-derived succinate induces SMCs transdifferentiation into ELCs. (a) Schematic diagram for contact and non-contact co-cultured model of primary human bladder smooth muscle cells (PBSMCs) with PDBCs, or treatment with conditioned medium (CM) derived from PDBCs in PBSMCs. (b) Representative immunofluorescence (IF) staining images, and (c) protein expression of endothelial signature in PBSMCs co-cultured with the indicated MI/PDBCs or CM-MI/PDBCs. Scale bars, 20 µm. GAPDH served as a loading control. (d) In vitro tube formation assay was performed with PBSMCs pre-educated with CM from control or MI/PDBCs, followed by CD31-staining in the tube forming cells (Scale bars, 50 µm); and the angiogenesis capability of PBSMCs were quantified by in vivo Matrigel plug assay (Scale bars, 20 µm). (e) MI/PDBCs-CM were fractionated into SFC with micromolecular (< 3 kDa) and LFC with macromolecules (> 3 kDa). IB analysis of expression of endothelial specific marker in PBSMCs co-cultured with control or MIBC-derived SFC or LFC. GAPDH served as a loading control. (f) Left: in vitro tube formation capability of PBSMCs co-cultured with NMI-PDBCs- or MI-PDBCs-derived SFC or LFC. Right: quantification of CD31+ cells of PBSMCs co-cultured with protease- or boiling-pretreated MI/PDBCs-SFC. (g) The Venn diagram illustrates the overlap and distinct sets of differentially abundant metabolites in MI-PDBCs#1,#2-SFC vs NMI-PDBCs#1,#2-SFC or UMUC3-SFC vs RT4-SFC. (h) In vitro tube formation assay and further IF staining (the top two panels; Scale bars, 50 µm), and in vivo Matrigel plug assays (the bottom panel; Scale bars, 20 µm) were performed in PBSMCs with the indicated treatments. (i) Schematic of intramuscular injection in mouse bladder detrusor muscle. (j) Representative IF images (upper; Scale bars, 20 µm), and quantification of intramuscular CD31+ or α-SMA+/CD31+ vessels (bottom) in mice following intramuscular injections of PBSMCs pre-educated with succinate, SFC/RT4, SFC/MI-PDBCs#1 accompanied with anti-succinate antibody or control IgG treatment, respectively. (k) Serum succinate level in NMIBC patients (n = 127), and MIBC patients with (n = 115) or without (n = 63) metastasis. (l) The serum succinate level was linearly correlated with intramuscular α-SMA+/CD31+ vessels in bladder cancer patients. Each error bar in (b), (d), (f), (h), and (j) represent the mean ± SD of three independent experiments. Statistical analysis was performed using two-way ANOVA with Šídák's multiple comparisons test for (b), (f), (h), and (j), unpaired two-tailed t tests for (d), one-way ANOVA with Dunnett's multiple comparison tests for (f) and (k), and Spearman's correlation for (l). ** p < 0.01; *** p < 0.001; ns, not significant.
-
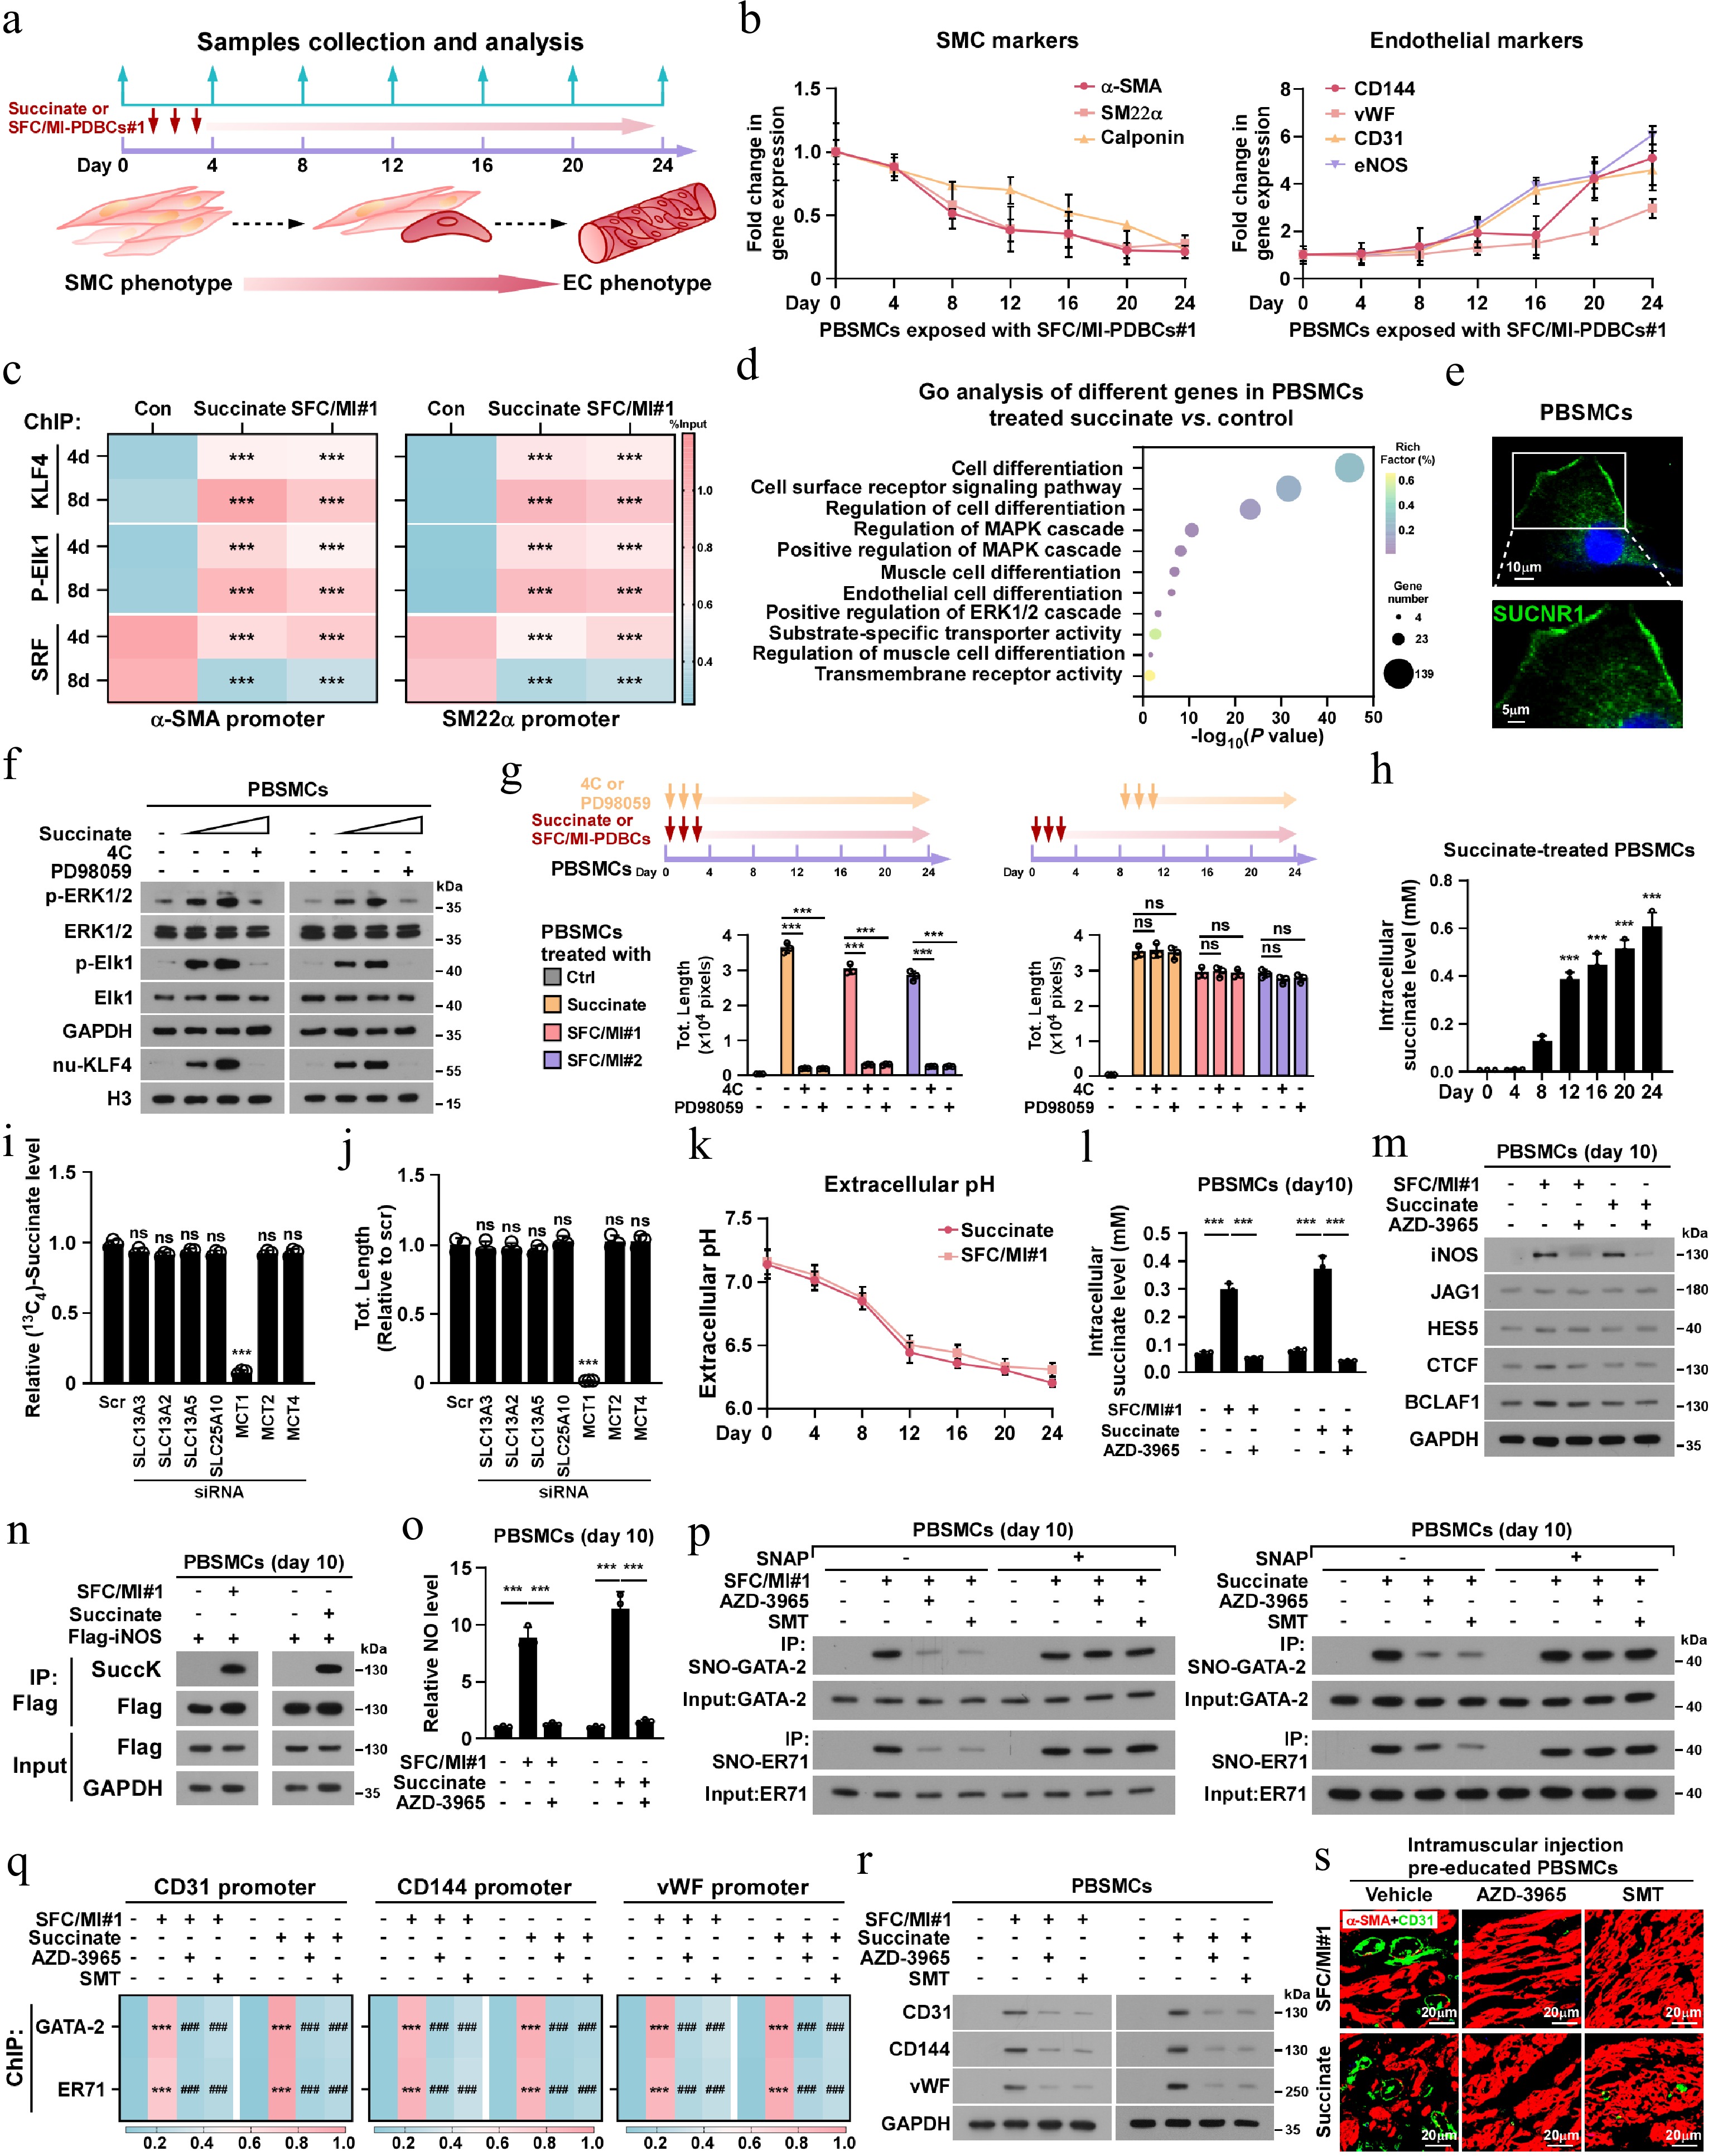
Figure 3.
Succinate induces dedifferentiation programme and endothelialization in SMCs. (a) Schematic diagram illustrating the experimental workflow for supplementation of succinate and SFC/MI-PDBCs#1 in PBSMCs-to-ELCs transdifferentiation model. (b) The mRNA expression of SMCs marker (α-SMA, SM22α, Calponin) and endothelial marker (CD144, vWF, CD31, eNOS) in the indicated times after SFC/MI-PDBCs#1 treatment. GAPDH served as the internal control. (c) ChIP assay analysis of KLF4, p-Elk1 and SRF enrichment on the α-SMA or SM22α promoter followed by SFC/MI-PDBCs#1 and succinate treatment, respectively. (d) Gene ontology (GO) enrichment analysis of dysregulated genes identified in 0.5 mM succinate- or control- treated PBSMCs on day 8. (e) Representative IF images of SUCNR1 in PBSMCs. Scale bars, 20 µm. (f) IB analysis of p-ERK1/2, ERK1/2, p-Elk1, Elk1, and KLF4 in PBSMCs following 8-d pharmacological intervention with succinate (0.5 mM), or SUCNR1 antagonist 4C (5 μM) or MAPK/ERK inhibitor PD98059 (10 μM). GAPDH served as the loading control and Histone H3 served as the nuclear loading control. (g) In vitro tube formation assays were performed in PBSMCs with the indicated treatments. (h) The intracellular succinate level in the indicated times after succinate treatments. (i) 13C4-succinate uptake, and (j) in vitro tube formation capability was monitored in PBSMCs transduced with the indicated siRNAs, respectively. (k) The extracellular pH was measured in the indicated times after succinate or SFC/MI-PDBCs#1 treatment. (l) Intracellular succinate level, and (m) IB analysis of expression of iNOS, JAG1, HES5, CTCF, and BCLAF1 was measured in PBSMCs (pretreated with succinate for 10 d) following treatment with control, succinate (0.5 mM) or SFC/MI-PDBCs#1, in the presence or absence of the MCT1 inhibitor AZD-3965 (10 μM). GAPDH served as the loading control. (n) Co-IP/IB analysis of succinylated-iNOS in the cells treated with SFC/MI-PDBCs#1 or succinate. (o) Left: the NO level in the PBSMCs (pretreated with succinate for 10 d) following treatment with succinate (0.5 mM) or SFC/MI-PDBCs#1, with or without MCT1 inhibitor AZD-3965 (10 μM). (p) Co-IP/IB analysis of S-nitrosylated-GATA-2, and -ER71 in the indicated cells. (q) ChIP assay analysis of GATA-2 and ER71 enrichment on the CD31, or CD144, or vWF promoter followed by the indicated treatment. *** p < 0.001 for vs control, ### p < 0.001 for vs SFC/MI#1 or succinate group. (r) IB analysis of expression of CD31, CD144, and vWF in the PBSMCs treated with control, succinate, or SFC/MI-PDBCs#1, with or without MCT1 inhibitor AZD-3965 or iNOS inhibitor SMT. (s) Representative IF images of intramuscular α-SMA+/CD31+ vessels in the mice intramuscularly injected with pre-educated PBSMCs. Scale bars, 20 µm. Each error bar in (b), (h), (i), (j), (k), and (o) represent the mean ± SD of three independent experiments. Statistical analysis was performed using two-way ANOVA with Šídák's multiple comparisons test for (c), (g), and (q), and one-way ANOVA with Dunnett's multiple comparison tests for (h), (i), (k), and (o). ** p < 0.01; *** p < 0.001; ns, not significant.
-
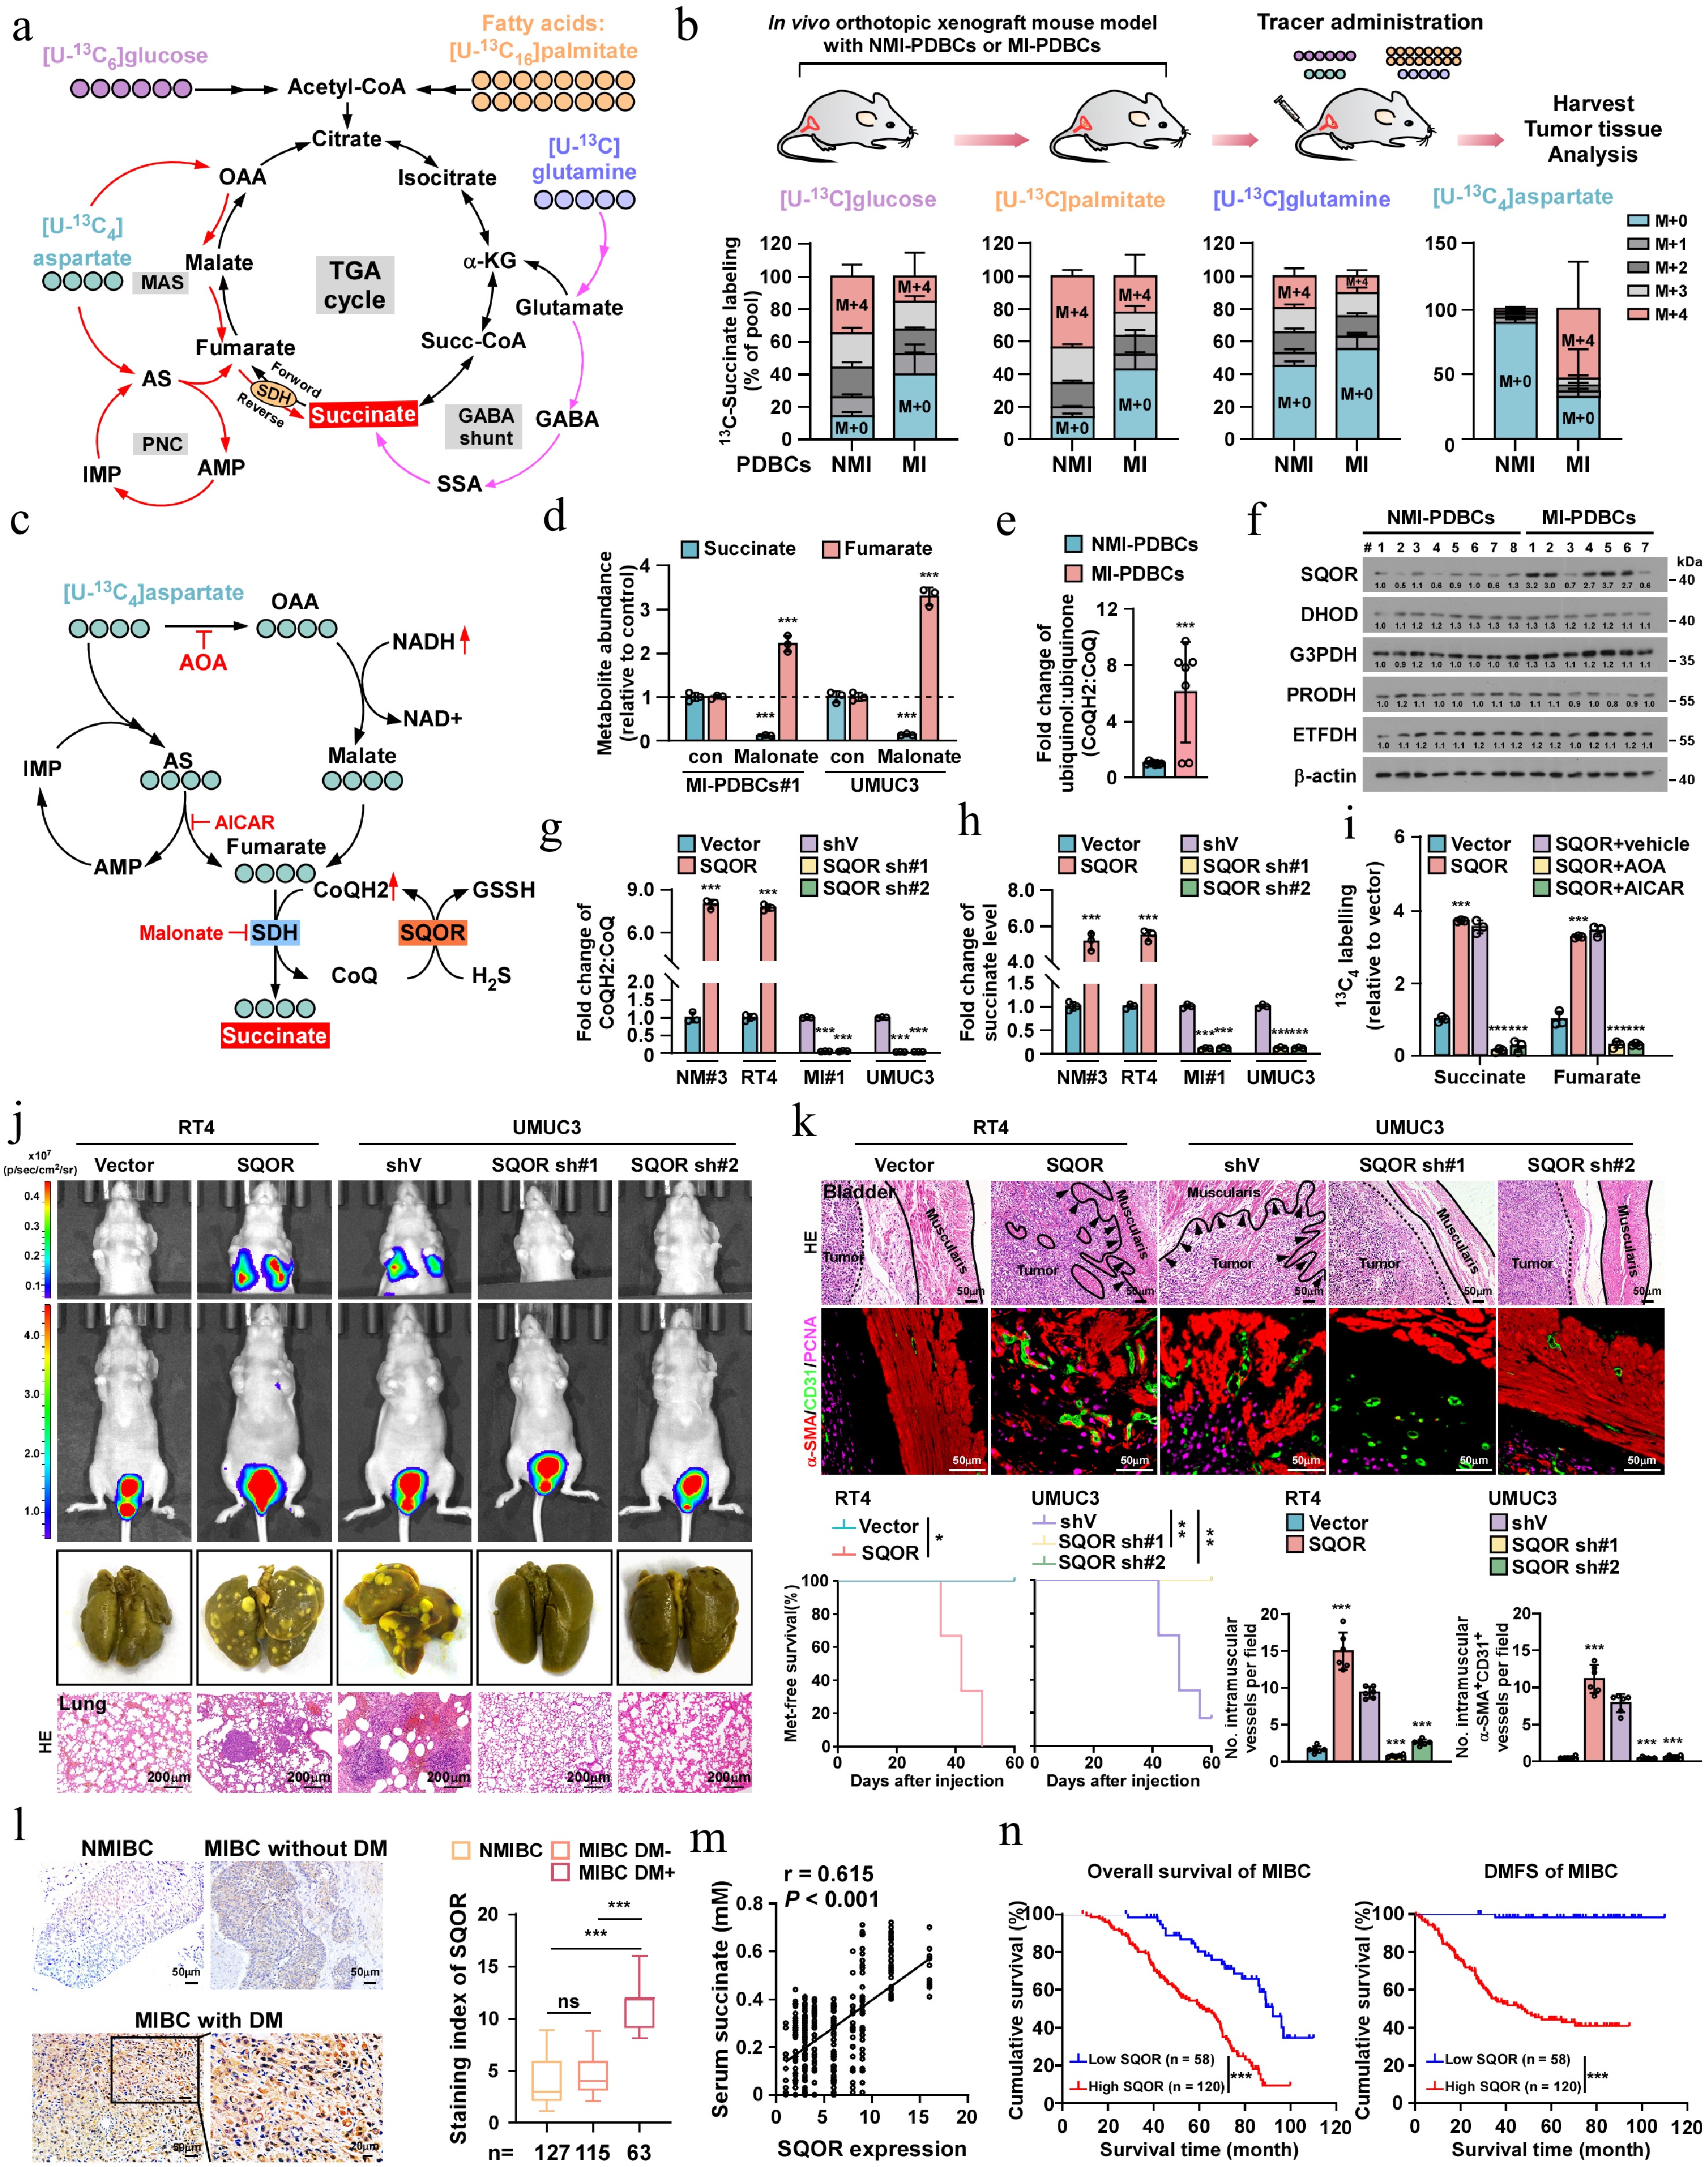
Figure 4.
SQOR-mediated SDH reversal induces succinate accumulation and SMCs-to-ELCs transdifferentiation. (a) Scheme illustrating the possible mechanism for succinate production: from α-ketoglutarate produced by the TCA cycle, derived from glycolysis, fatty acid oxidation, and glutaminolysis (black lines), from GABA shunt (purple lines), and from fumarate produced from the malate-aspartate shuttle (MAS) and purine nucleotide cycle (PNC) via the reversal of SDH (red lines). 13C-metabolite labeling strategy was employed to measure the contribution of these carbon sources to the build-up of succinate. (b) 13C-isotopologue profiles of succinate (M + 0 to M + 4 denoting the number of 13C-labeled carbons per molecule) in tumors formed by NMI-PDBCs (n = 8) or MI-PDBCs (n = 7) following infusion of 13C-labeled glucose, palmitate, glutamine, and aspartate. (c) Scheme illustrating the fumarate production from aspartate in MAS and PNC pathway, and succinate accumulation from fumarate reduction via a reductive shift in the CoQH2/CoQ pools induced by SQOR. AOA, aminooxyacetate; AS, adenylosuccinate; IMP, inosine5'-monophosphate; OAA, oxaloacetate. (d) Effect of SDH inhibition by dimethyl malonate on succinate and fumarate production. (e) The relative ubiquinol/ubiquinone (CoQH2/CoQ) ratio (group) in MI-PDBCs (n = 7) compared with NMI-PDBCs (n = 8). (f) IB analysis of expression of SQOR, DHOD, G3PDH, PRODH, ETFDH in the indicated cells. β-actin served as the loading control. (g) The relative CoQH2/CoQ ratio, and (h) succinate concentration in the indicated cells. (i) The relative incorporation of 13C-aspartate to the succinate and fumarate in SQOR-overexpressed cells (compared with the vector group); and effect on that abundance in the SQOR-overexpressed cells that blocking aspartate entry into the TCA through aspartate aminotransferase inhibitor AOA, or blocking PNC by adenylosuccinate lyase inhibitor AICAR. (j) Representative bioluminescence images, picric staining and H&E staining of pulmonary metastatic nodules in the indicated mice bearing orthotopic bladder tumor. Scale bars, 200 µm. n = 6 mice/group. (k) Upper: representative H&E images of muscularis invasion, IF images, and quantification of intramuscular CD31+ or α-SMA+CD31+ vessels in the indicated mice. Bottom: Kaplan–Meier metastasis-free survival curves of mice from the indicated experimental group. n = 6 mice/group. (l) Representative images and quantification of SQOR expression in bladder cancer patients without muscle invasion (n = 127), and muscle-invasive bladder cancer with (n = 115) or without metastasis (n = 63). Scale bar, 50 µm. Scale bars insets, 20 μm. (m) The correlation between the SQOR expression and serum succinate levels in the clinical bladder cancer patients. (n) Kaplan–Meier curves analysis of survival in bladder cancer patients with low- (n = 58) or high-SQOR expression (n = 120). Each error bar in (b), (d), (e), (g), (h), and (i) represent the mean ± SD of three independent experiments. Statistical analysis was performed using one-way ANOVA with Dunnett's multiple comparison tests for (k) and (l), two-way ANOVA with Šídák's multiple comparisons test for (b), (d), (g), (h), and (i), unpaired two-tailed t tests for (e), Spearman's correlation for (m), and Kaplan–Meier analysis method for (k) and (n). * p < 0.05; ** p < 0.01; *** p < 0.001; ns, not significant.
-
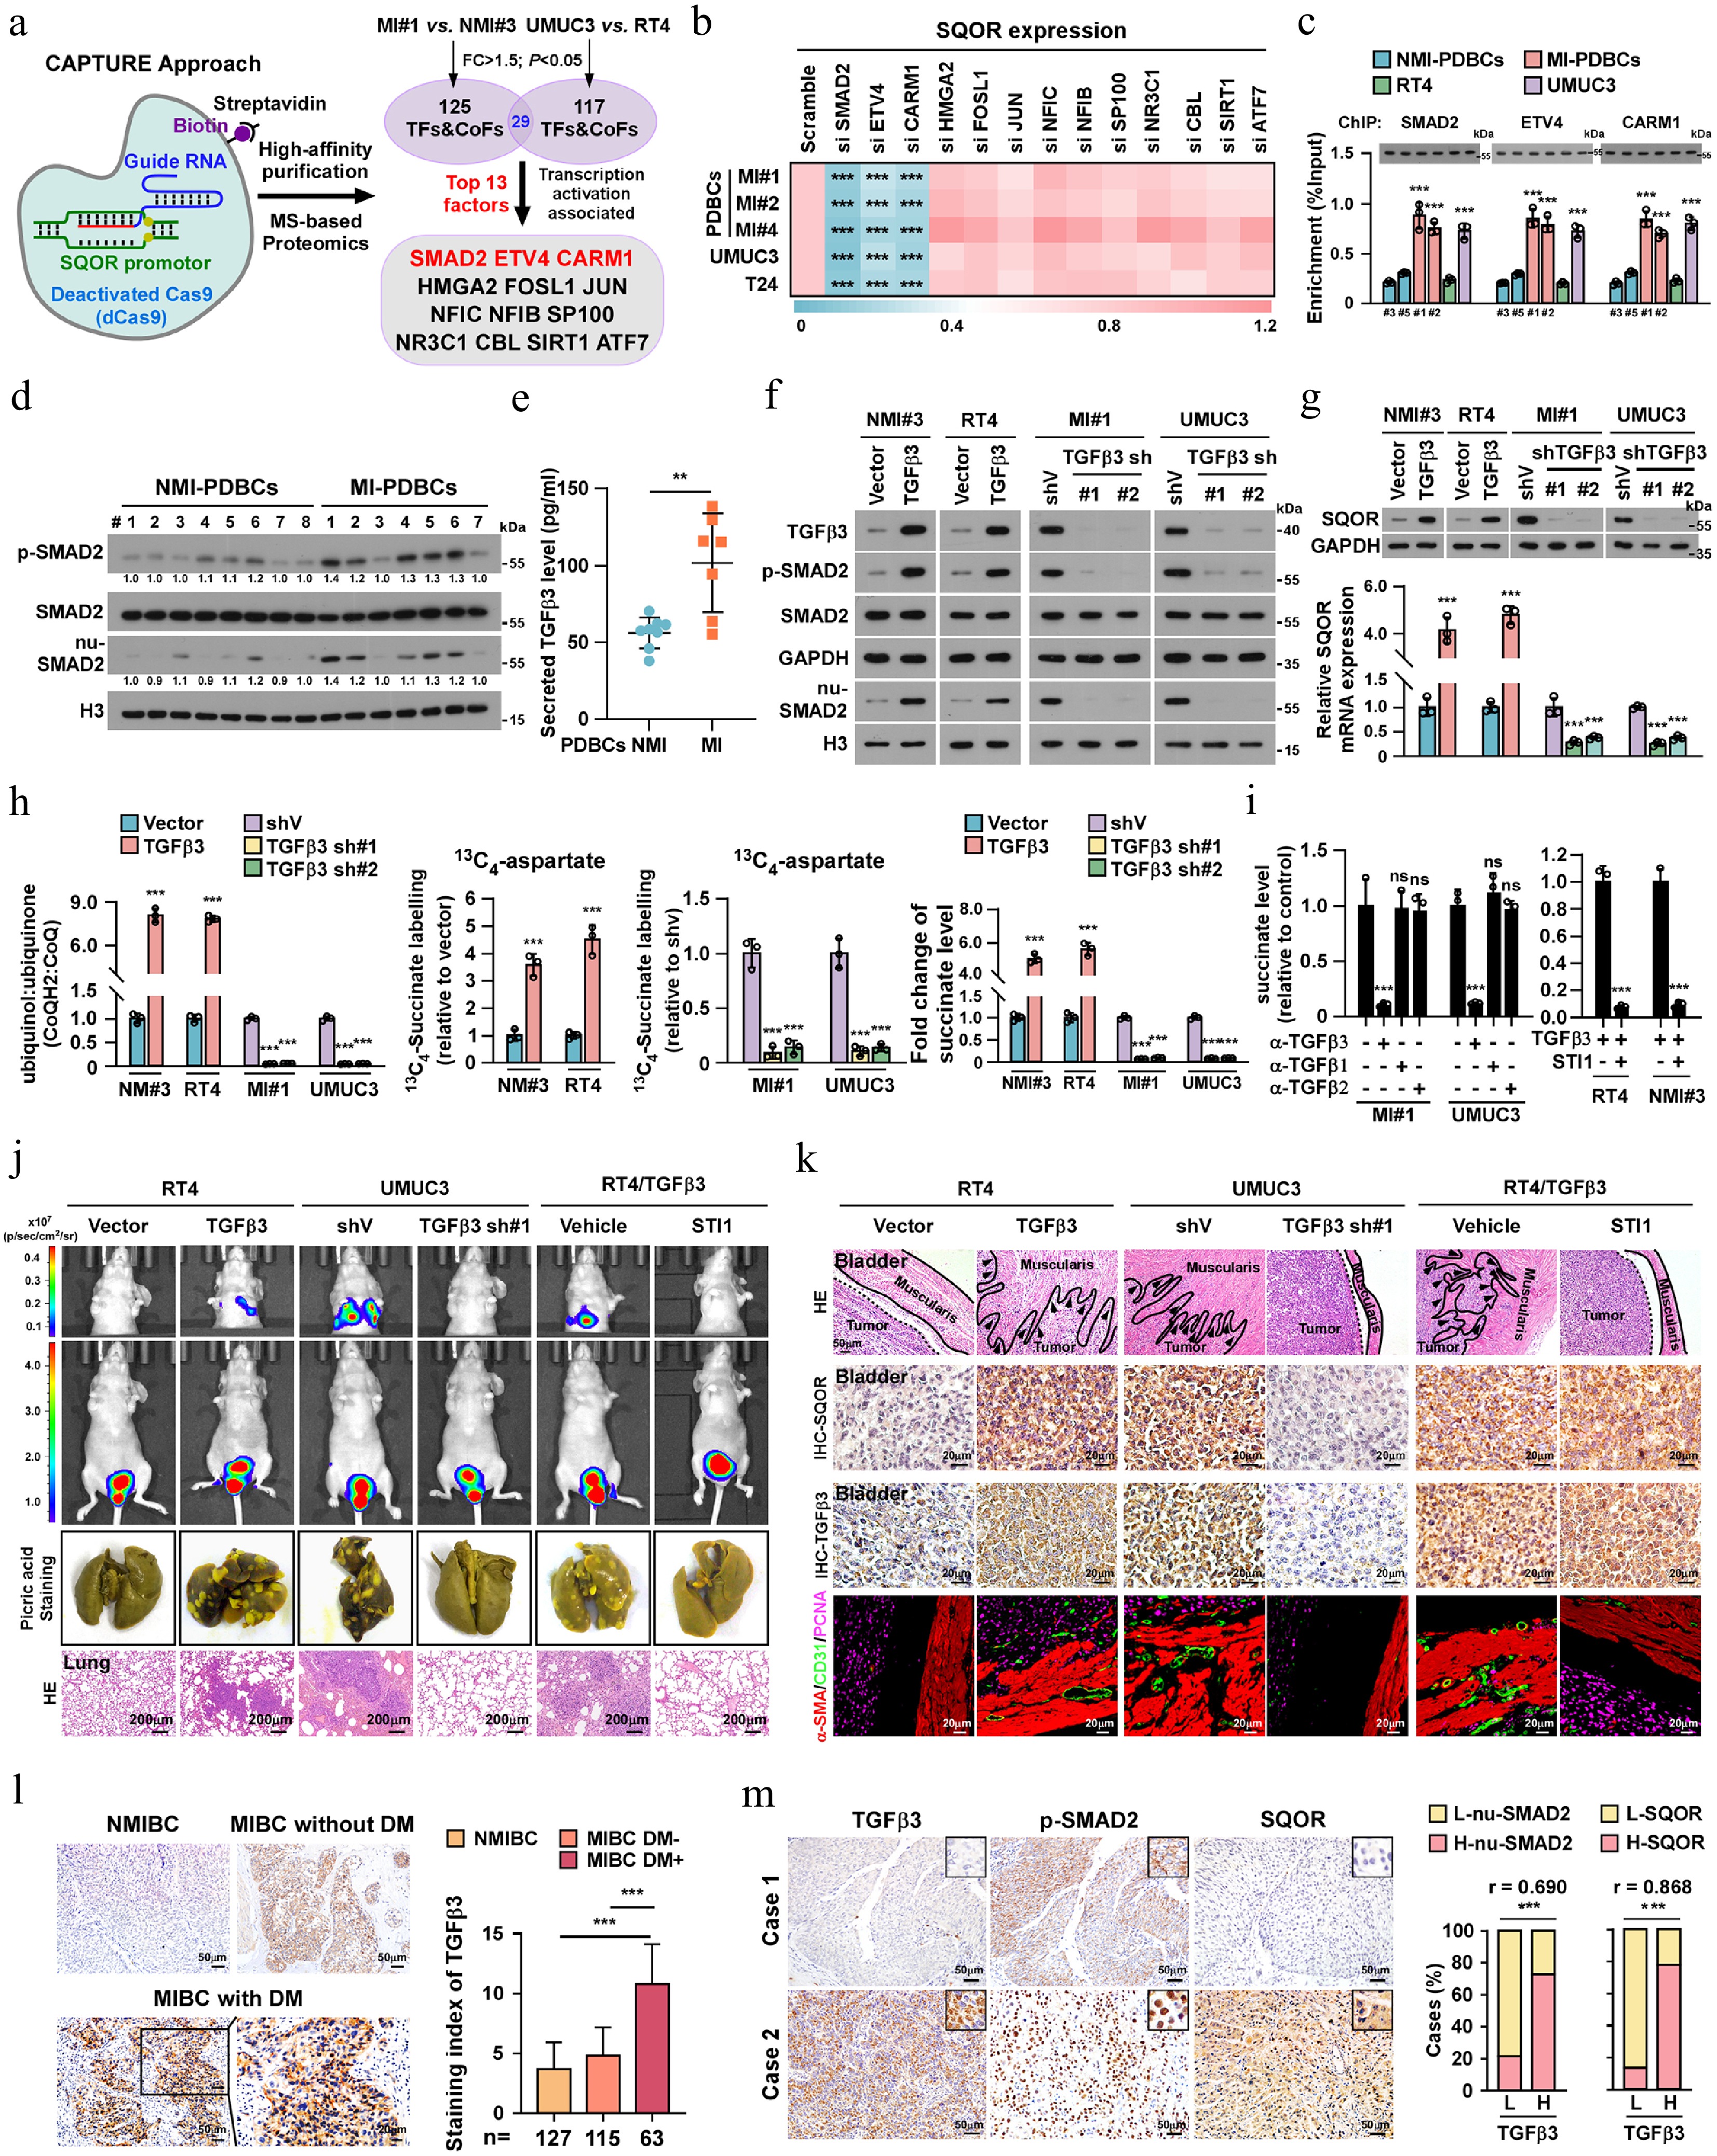
Figure 5.
TGFβ3/SMAD2 pathway contributes to SMCs-to-ELCs transdifferentiation in MIBC. (a) A schematic of dCas9-mediated capture of SQOR promoter using sequence-specific sgRNAs and mass spectrometry (MS) analysis of trans-regulatory factors targeting SQOR promoter. (b) Heatmap represented by pseudocolors was generated using the SQOR mRNA expression in the indicated cells. (c) ChIP assay analysis of SMAD2, ETV4 and CARM1 enrichment on the SQOR promoter in the indicated cells. (d) IB analysis of expression of p-SMAD2, SMAD2 and nuclear-SMAD2 in the indicated cells. GAPDH served as the loading control for total protein. H3 served as the loading control for nuclear protein. (e) ELISA analysis of level of TGFβ3 secreted form NMI-PDBCs (n = 7) or MI-PDBCs (n = 8) cells. (f) IB analysis of expression of TGFβ3, p-SMAD2, SMAD2 and nuclear-SMAD2 in the TGFβ3-overexpressed, TGFβ3-silenced cells and control cells. GAPDH served as the loading control for total protein. H3 served as the loading control for nuclear protein. (g) The protein and mRNA level of SQOR in the indicated TGFβ3-overexpressed, TGFβ3-silenced cells and control cells. (h) The relative CoQH2/CoQ ratio, incorporation of 13C-aspartate to succinate and succinate level in the indicated TGFβ3-overexpressed, TGFβ3-silenced and control cells. (i) The succinate level in MI-PDBCs#1 and UMUC3 treated with anti-TGFβ1, anti-TGFβ2 and anti-TGFβ3 antibody, or in RT4 and NMI-PDBCs#3 treated with TGFβ3, with or without SQOR inhibitor STI1. (j) Representative bioluminescence images, picric staining and H&E staining of pulmonary metastatic nodules in the indicated mice bearing orthotopic bladder tumor. Scale bars, 200 µm. n = 6 mice/group. (k) Representative H&E images of muscle infiltration (Scale bars, 50 µm), IHC images of SQOR and TGFβ3 (scale bars, 20 µm), IF images of intramuscular CD31+ or α-SMA+/CD31+ vessels (scale bars, 20 µm) in the indicated mice. n = 6 mice/group. (l) Left: representative images and quantification of TGFβ3 level in NMIBC (n = 127), MIBC with (n = 115), or without (n = 63) distant metastasis. Scale bars, 50 µm. Scale bars insets, 20 μm. (m) Percentages of specimens showing a correlation between TGFβ3 expression, and the levels of SMAD2 and SQOR in MIBC patients. Each error bar in (b), (c), (e), (g), (h), and (i) represent the mean ± SD of three independent experiments. Statistical analysis was performed using one-way ANOVA with Dunnett's multiple comparison tests for (l), two-way ANOVA with Šídák's multiple comparisons test for (c), (g), (h), and (i), unpaired two-tailed t tests for (e), Spearman's correlation for (m). * p < 0.05; ** p < 0.01; *** p < 0.001; ns, not significant.
-
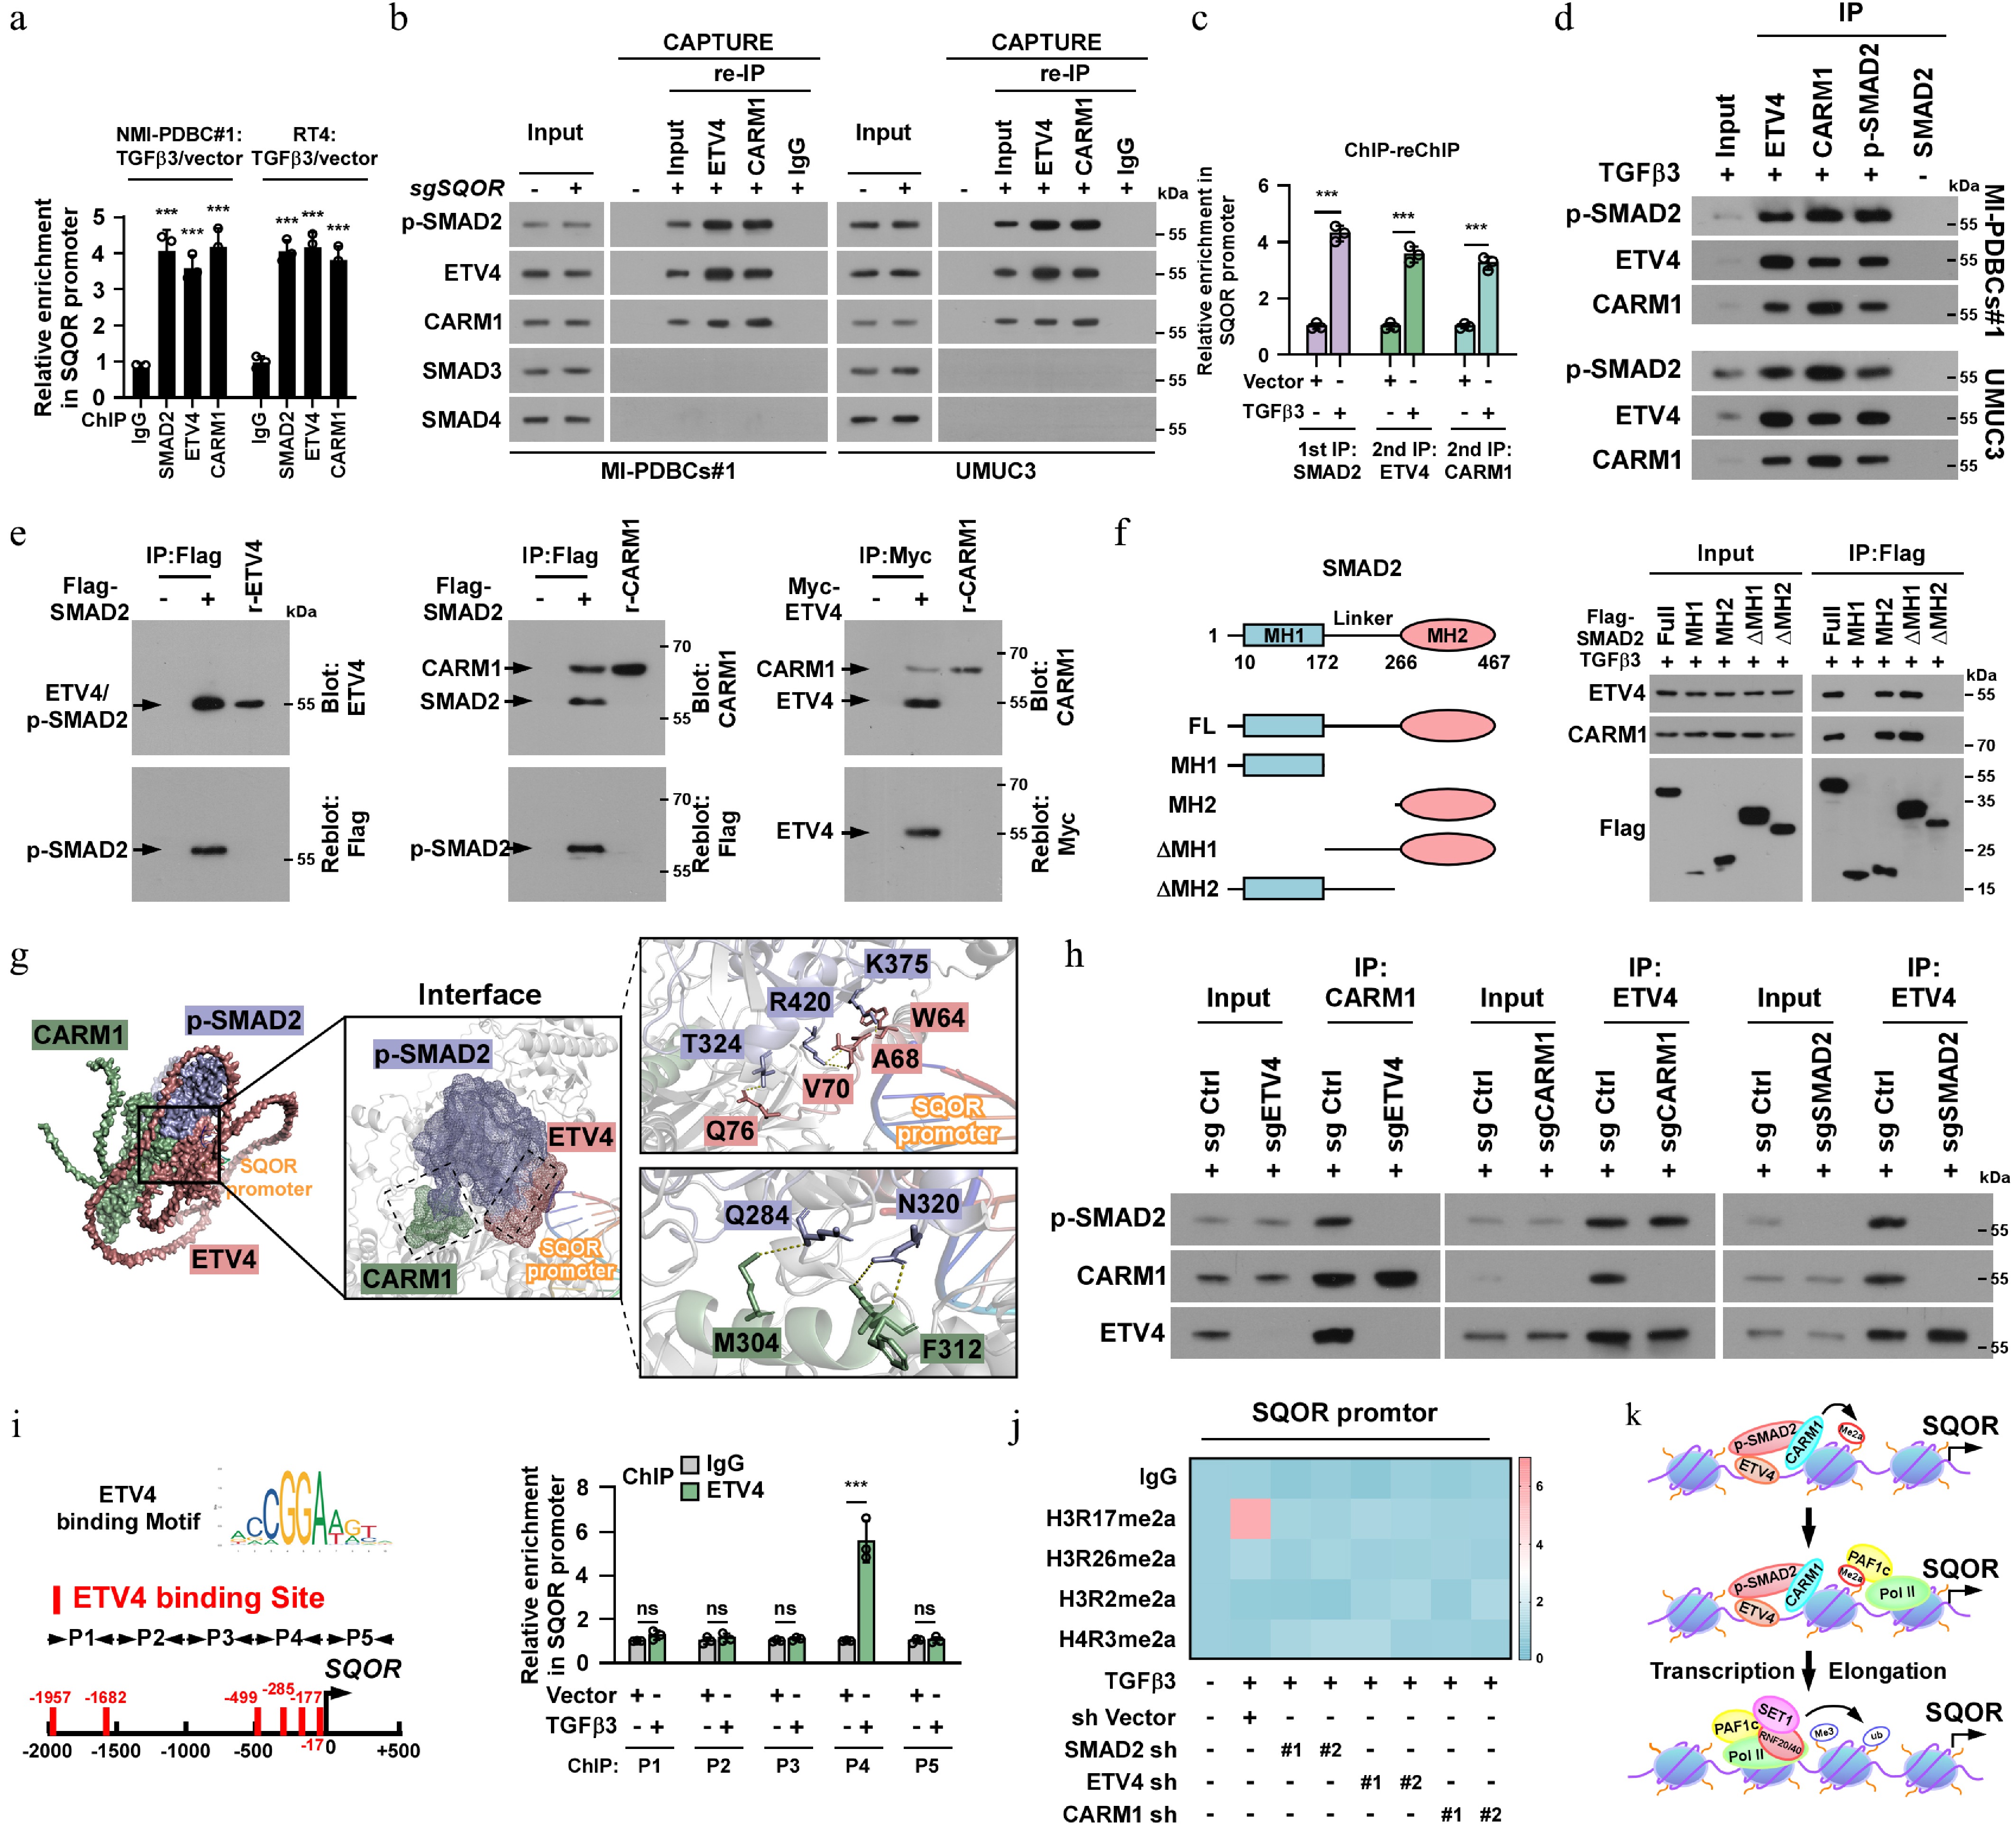
Figure 6.
TGFβ3-SMAD2/ETV4/CARM1 trimer axis epigenetically promoted SQOR transcription via SMAD3/4-independent manner. (a) ChIP assay analysis of enrichment of SMAD2, ETV4 and CARM1 on the SQOR promoter in the indicated cells. (b) CAPTURE/IB assays showing that only SMAD2, ETV4, and CARM1, but not SMAD3 or SMAD4, was associated with SQOR promoter. (c) Sequential ChIP experiments were first performed with an anti-SMAD2 antibody followed by re-ChIP using either an anti-ETV4 or anti-CARM1 antibody. (d) IP assays revealing that p-SMAD2 formed a complex with ETV4 and CARM1 in TGFβ3 treated cells. (e) Far-western blotting analysis was performed using indicated antibodies. (f) Schematic illustration of the wild-type and truncated SMAD2 protein (left) and co-IP assays were performed using anti-Flag antibody in the indicated cells (right). (g) AlphaFold3 analysis of 3D structure of the tetramer formed by p-SMAD2, ETV4, CARM1, and SQOR promoter DNA. (h) Co-IP assays were performed using anti-ETV4, or anti-SMAD2, or anti-CARM1 antibody in the indicated cells. (i) Left: Schematic illustration of ETV4 binding site at SQOR promoter. Right: ChIP assay analysis of ETV4 enrichment on the SQOR promoter in the indicated cells. (j) Heatmap represented by pseudocolors was generated using the ChIP-qPCR values that represented the enrichment of H3R17me2a, H3R26me2a, H3R2me2a and H4R3me2a on the SQOR promoter in the indicated cells. (k) A model depicting that CARM1 deposits H3R17me2a at the promoter of SQOR, which leads to the PAF1 recruitment, consequently resulting in H2BK120ub and H3K4me3 deposition and transcriptional elongation via RNAPII. Each error bar in (a), (f), and (l) represents the mean ± SD of three independent experiments. Statistical analysis was performed using two-way ANOVA with Šídák's multiple comparisons test for (a), unpaired two-tailed t tests for (c) and (i). * p < 0.05; ** p < 0.01; *** p < 0.001; ns, not significant.
-
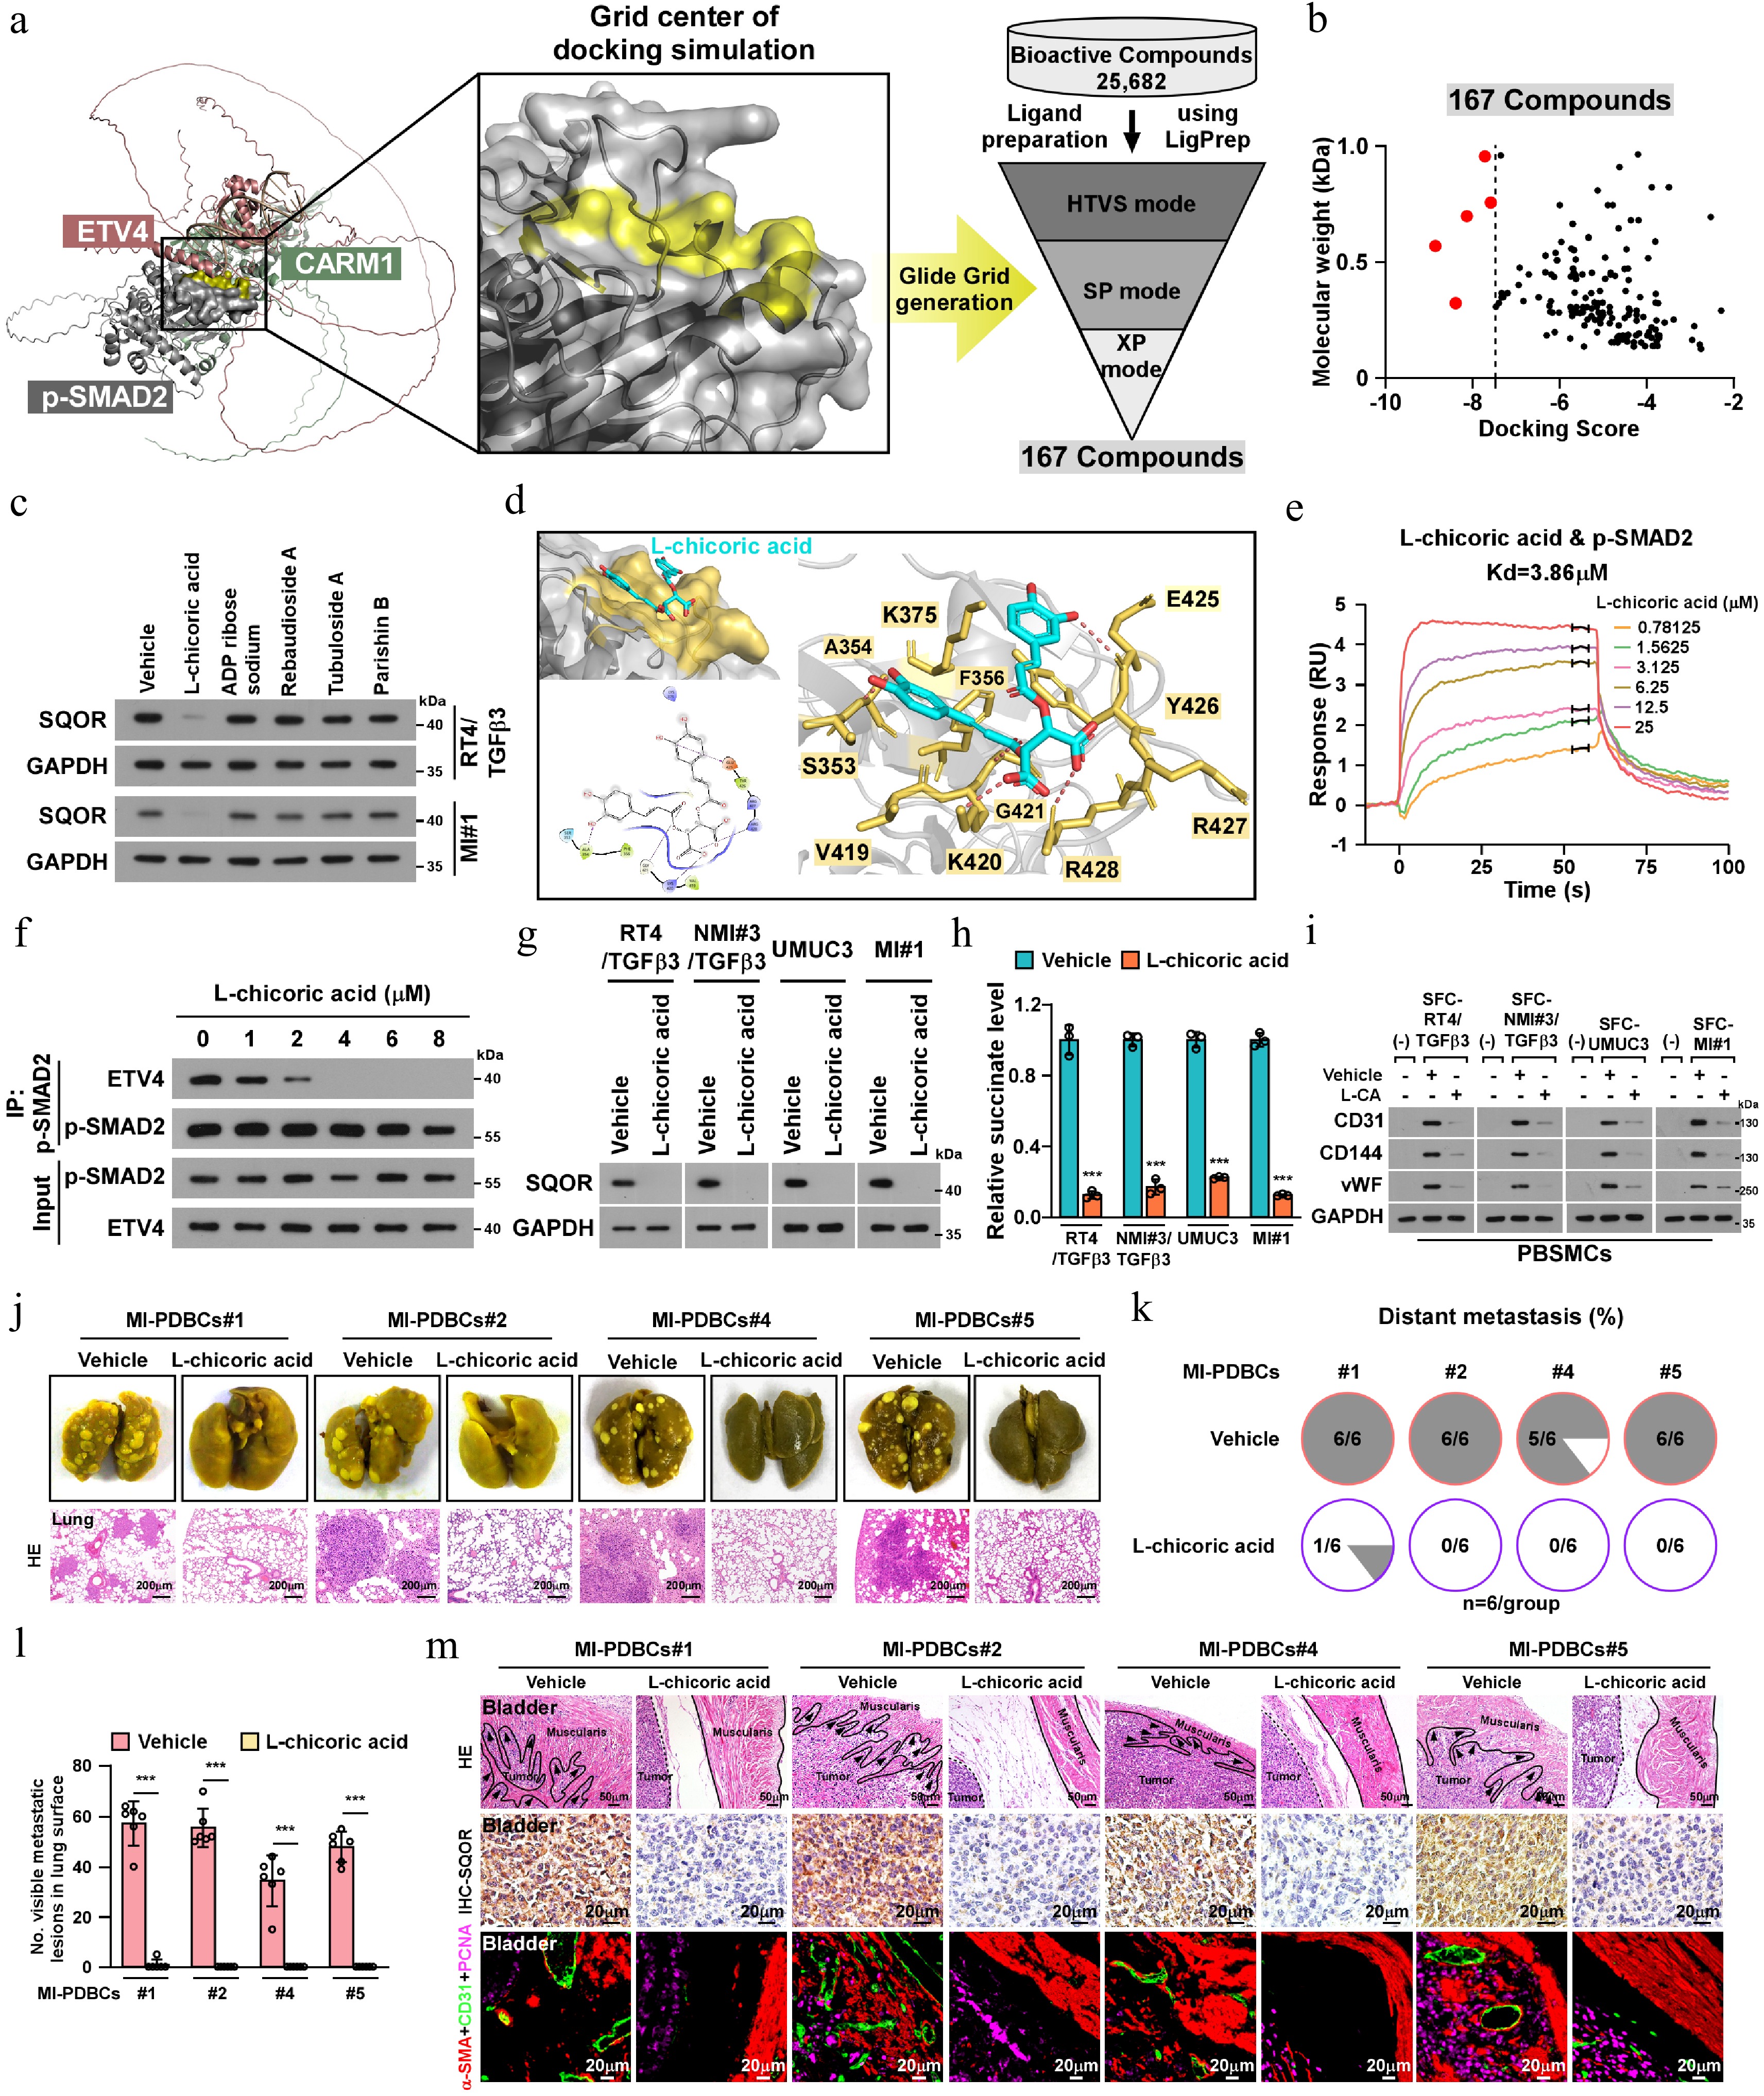
Figure 7.
Blocking SMAD2-ETV4 binding inhibited SMCs-to-ELCs transdifferentiation in MIBC. (a) Left: PDBiPISA and PyMOL software tool visualized that the core center of p-SMAD2 is required for the p-SMAD2-ETV4 interaction, as indicated by AlphaFold3-predicted 3D structure of the tetramer. Right: the Virtual Screening Workflow module in Schodinger software (
www.schrodinger.com ) showed that 167 small molecule, screened from a bioactive compound library consisting of 25,682 compounds, were identified as potential inhibitor binding to pocket of p-SMAD2. (b) Among these 167 small molecule, five candidates with high binding scores to the p-SMAD2 pocket were highlighted in red. (c) IB analysis of SQOR expression in RT4/TGFβ3 and MI-PDBCs cells treated with abovementioned five small molecules exposure for 48 h. GAPDH serve as a loading control. (d) Left upper: overview of pocket on p-SMAD2 bound to L-chicoric acid. Pocket on p-SMAD2 as indicated by yellow surface, and L-chicoric acid as indicated by blue sticks. Left bottom: two-dimensional ligand-interaction maps of co-crystals of p-SMAD2 bound with L-chicoric acid were generated using Schodinger software Computational model and interactions of L-chicoric acid and p-SMAD2. Polar interactions are shown as purple arrow and purple line. Right: Architecture of p-SMAD2 and L-chicoric acid showing interacting amino acids of p-SMAD2 (yellow). (e) SPR assay with Biacore diagram analysis of saturation curve of L-chicoric acid binding to p-SMAD2. (f) IP assays using anti-p-SMAD2 antibody in L-chicoric acid-treated UMUC3 cells and IB analysis of expression of p-SMAD2 and ETV4. (g) IB analysis of SQOR expression in the indicated cells treated with 1 µM L-chicoric acid. GAPDH serve as the loading control. (h) Succinate level in the indicated cells treated with or without L-chicoric acid (4 µM). (i) IB analysis of endothelial specific marker in PBSMCs that co-cultured with the indicated cells derived SFC treated with or without L-chicoric acid (4 µM). (j) Representative staining images showing the lung metastatic nodules in the indicated mice. Scale bars, 200 µm. n = 6 mice/group. (k) Kaplan−Meier curves analysis of metastasis-free survival in mice bearing the indicated orthotopic bladder tumors. n = 6 mice/group. (l) The quantification of pulmonary metastatic nodules in the indicated mice. n = 6 mice/group. (m) Representative staining images of muscle infiltration (scale bars, 50 µm), SQOR expression, and intramuscular CD31+ or α-SMA+CD31+ vessels in the indicated mice (scale bars, 20 µm). n = 6 mice/group. Error bar in (h) represents the mean ± SD of three independent experiments. Statistical analysis was performed using one-way ANOVA with Dunnett's multiple comparison tests for (h) and (l). *** p < 0.001. -
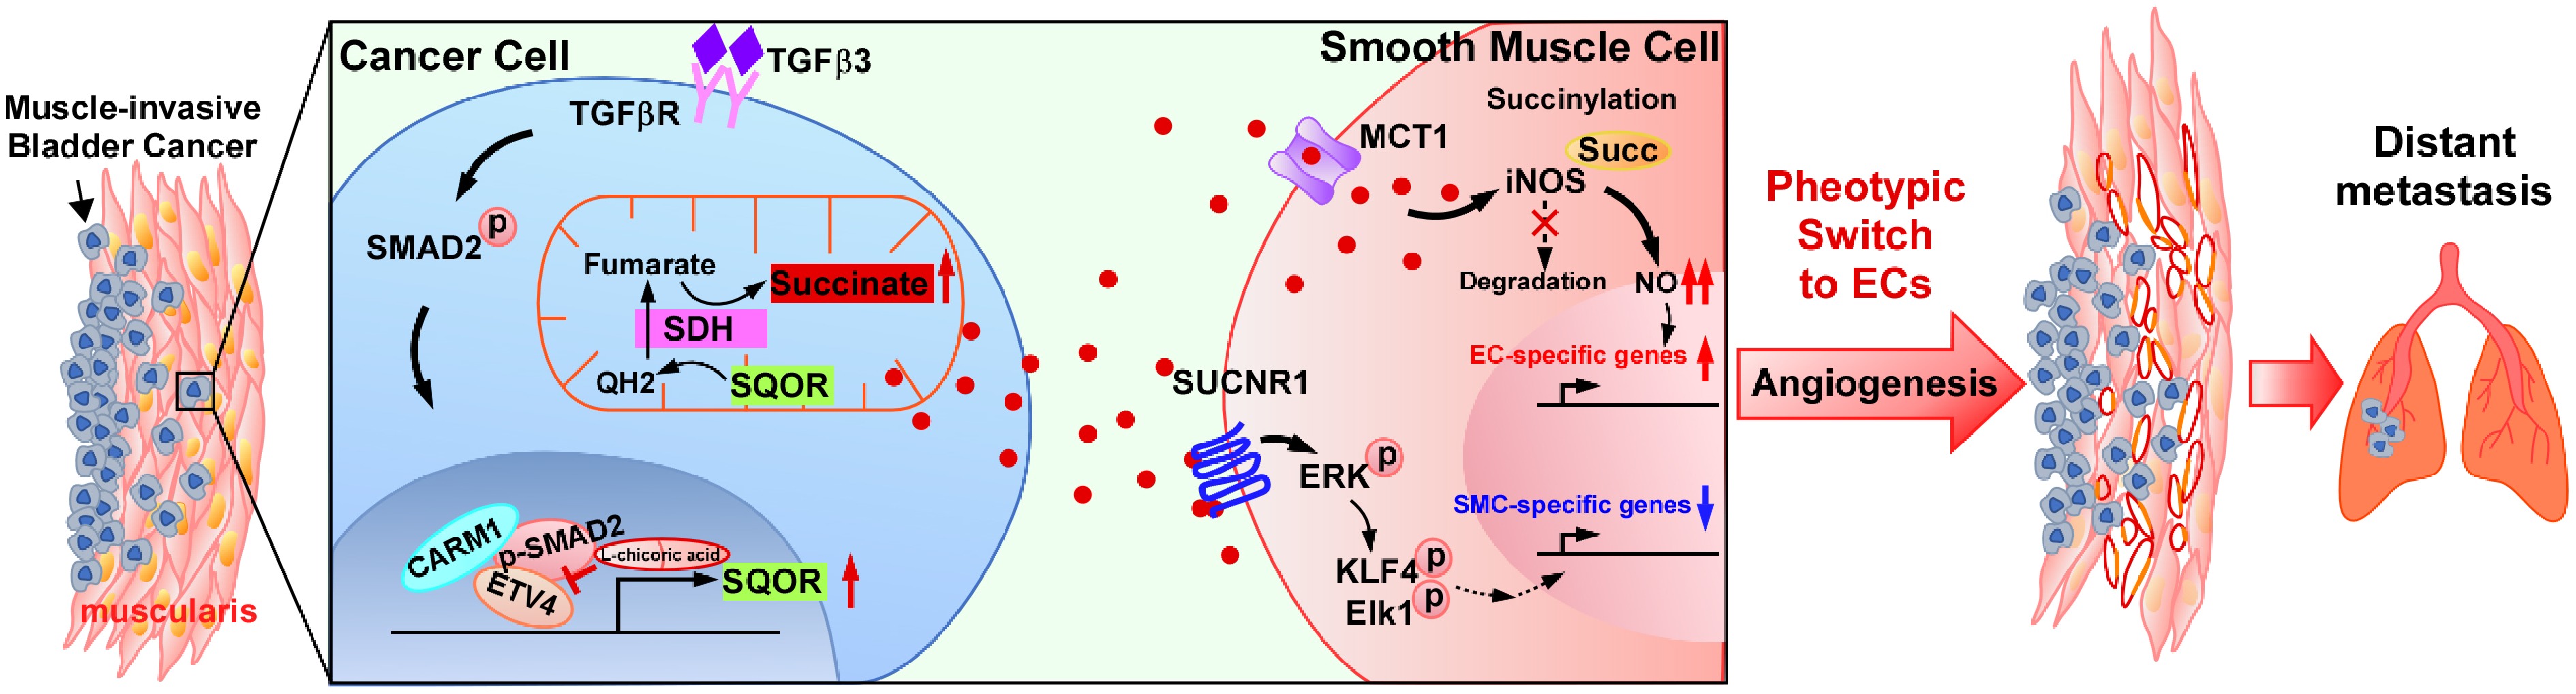
Figure 8.
A working model of bladder cancer-derived succinate promotes distant metastasis by driving SMCs-to-ELCs transdifferentiation. Briefly, MIBC cells infiltrating into the muscularis secrete succinate to trigger early-stage SMCs dedifferentiation by activating succinate receptor SUCNR1 signaling, and drives late-stage endothelial specification through succinate uptake-mediated iNOS succinylation. Isotope tracing revealed that accumulated succinate originates from reversed succinate dehydrogenase (SDH) activity, a process facilitated by sulfide quinone oxidoreductase (SQOR)-mediated overflow of ubiquinol. Mechanically, the TGFβ3-induced formation of SMAD2/ETV4/CARM1 transcriptional complex, via SMAD3/4-independent mechanism, epigenetically upregulates SQOR, enabling retrograde SDH flux and succinate accumulation. Virtual screening targeting the AlphaFold-predicted SMAD2-ETV4 interface identified L-chicoric acid as a potent inhibitor that effectively suppresses SMCs-ELCs transdifferentiation and MIBC metastasis.
Figures
(8)
Tables
(0)