-
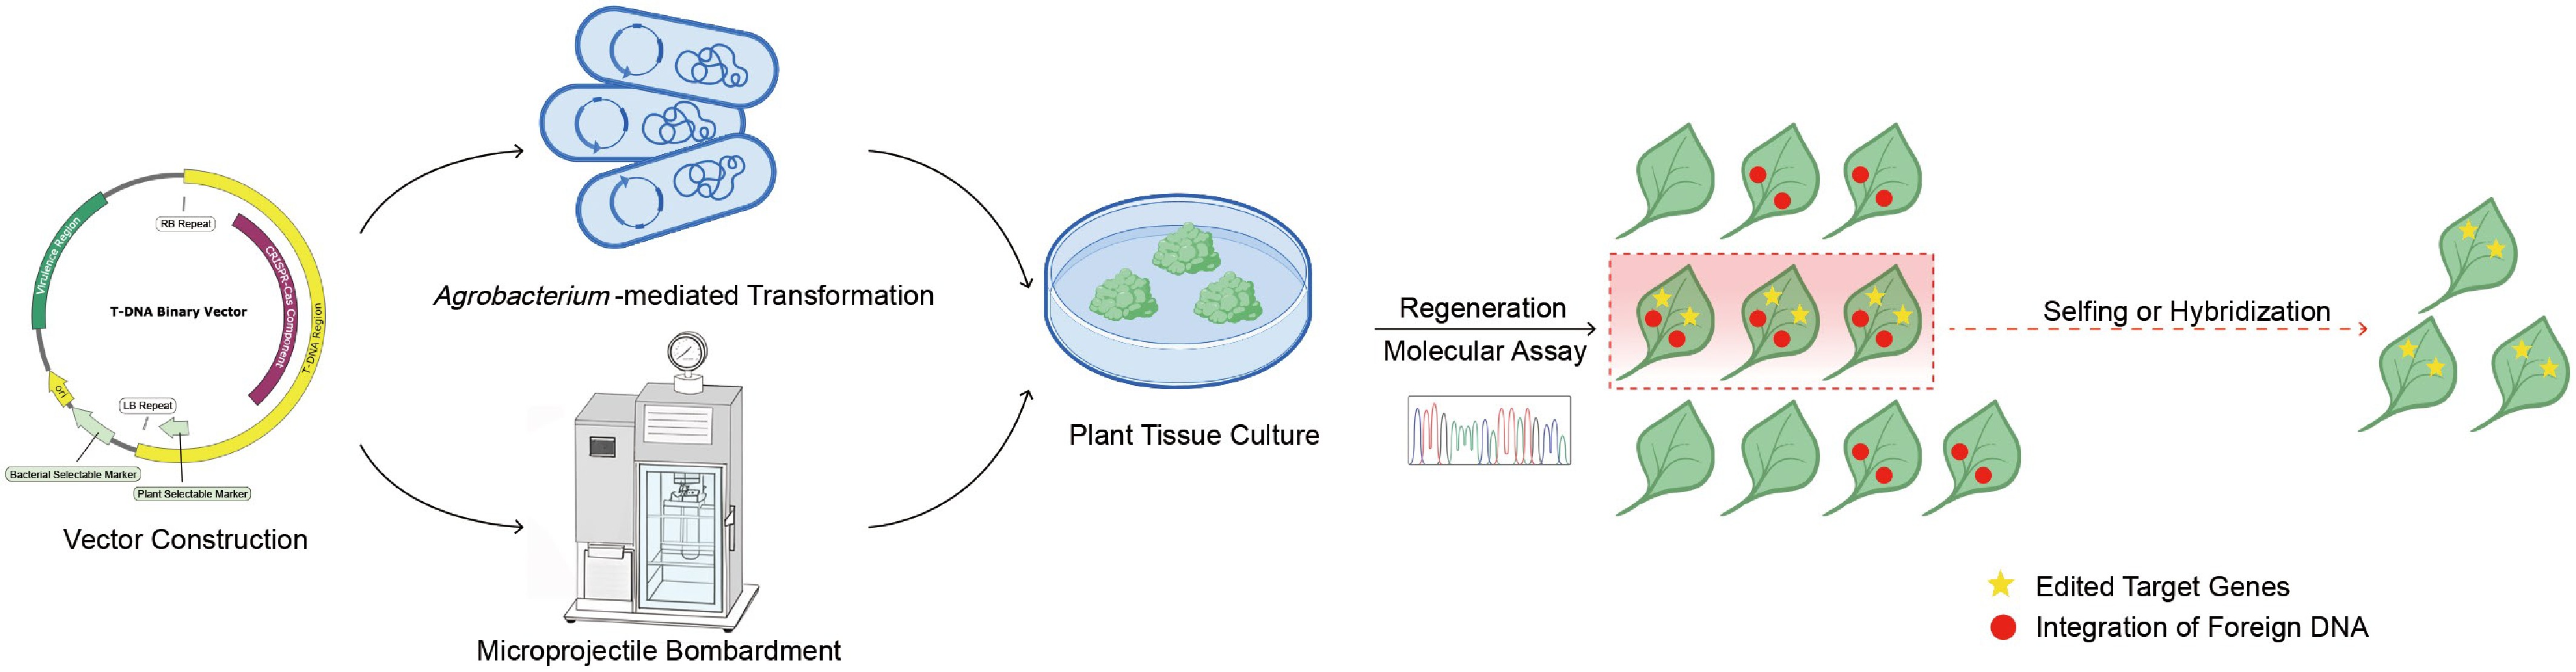
Figure 1.
Schematic overview of conventional CRISPR/Cas9-mediated gene editing in plants.
-
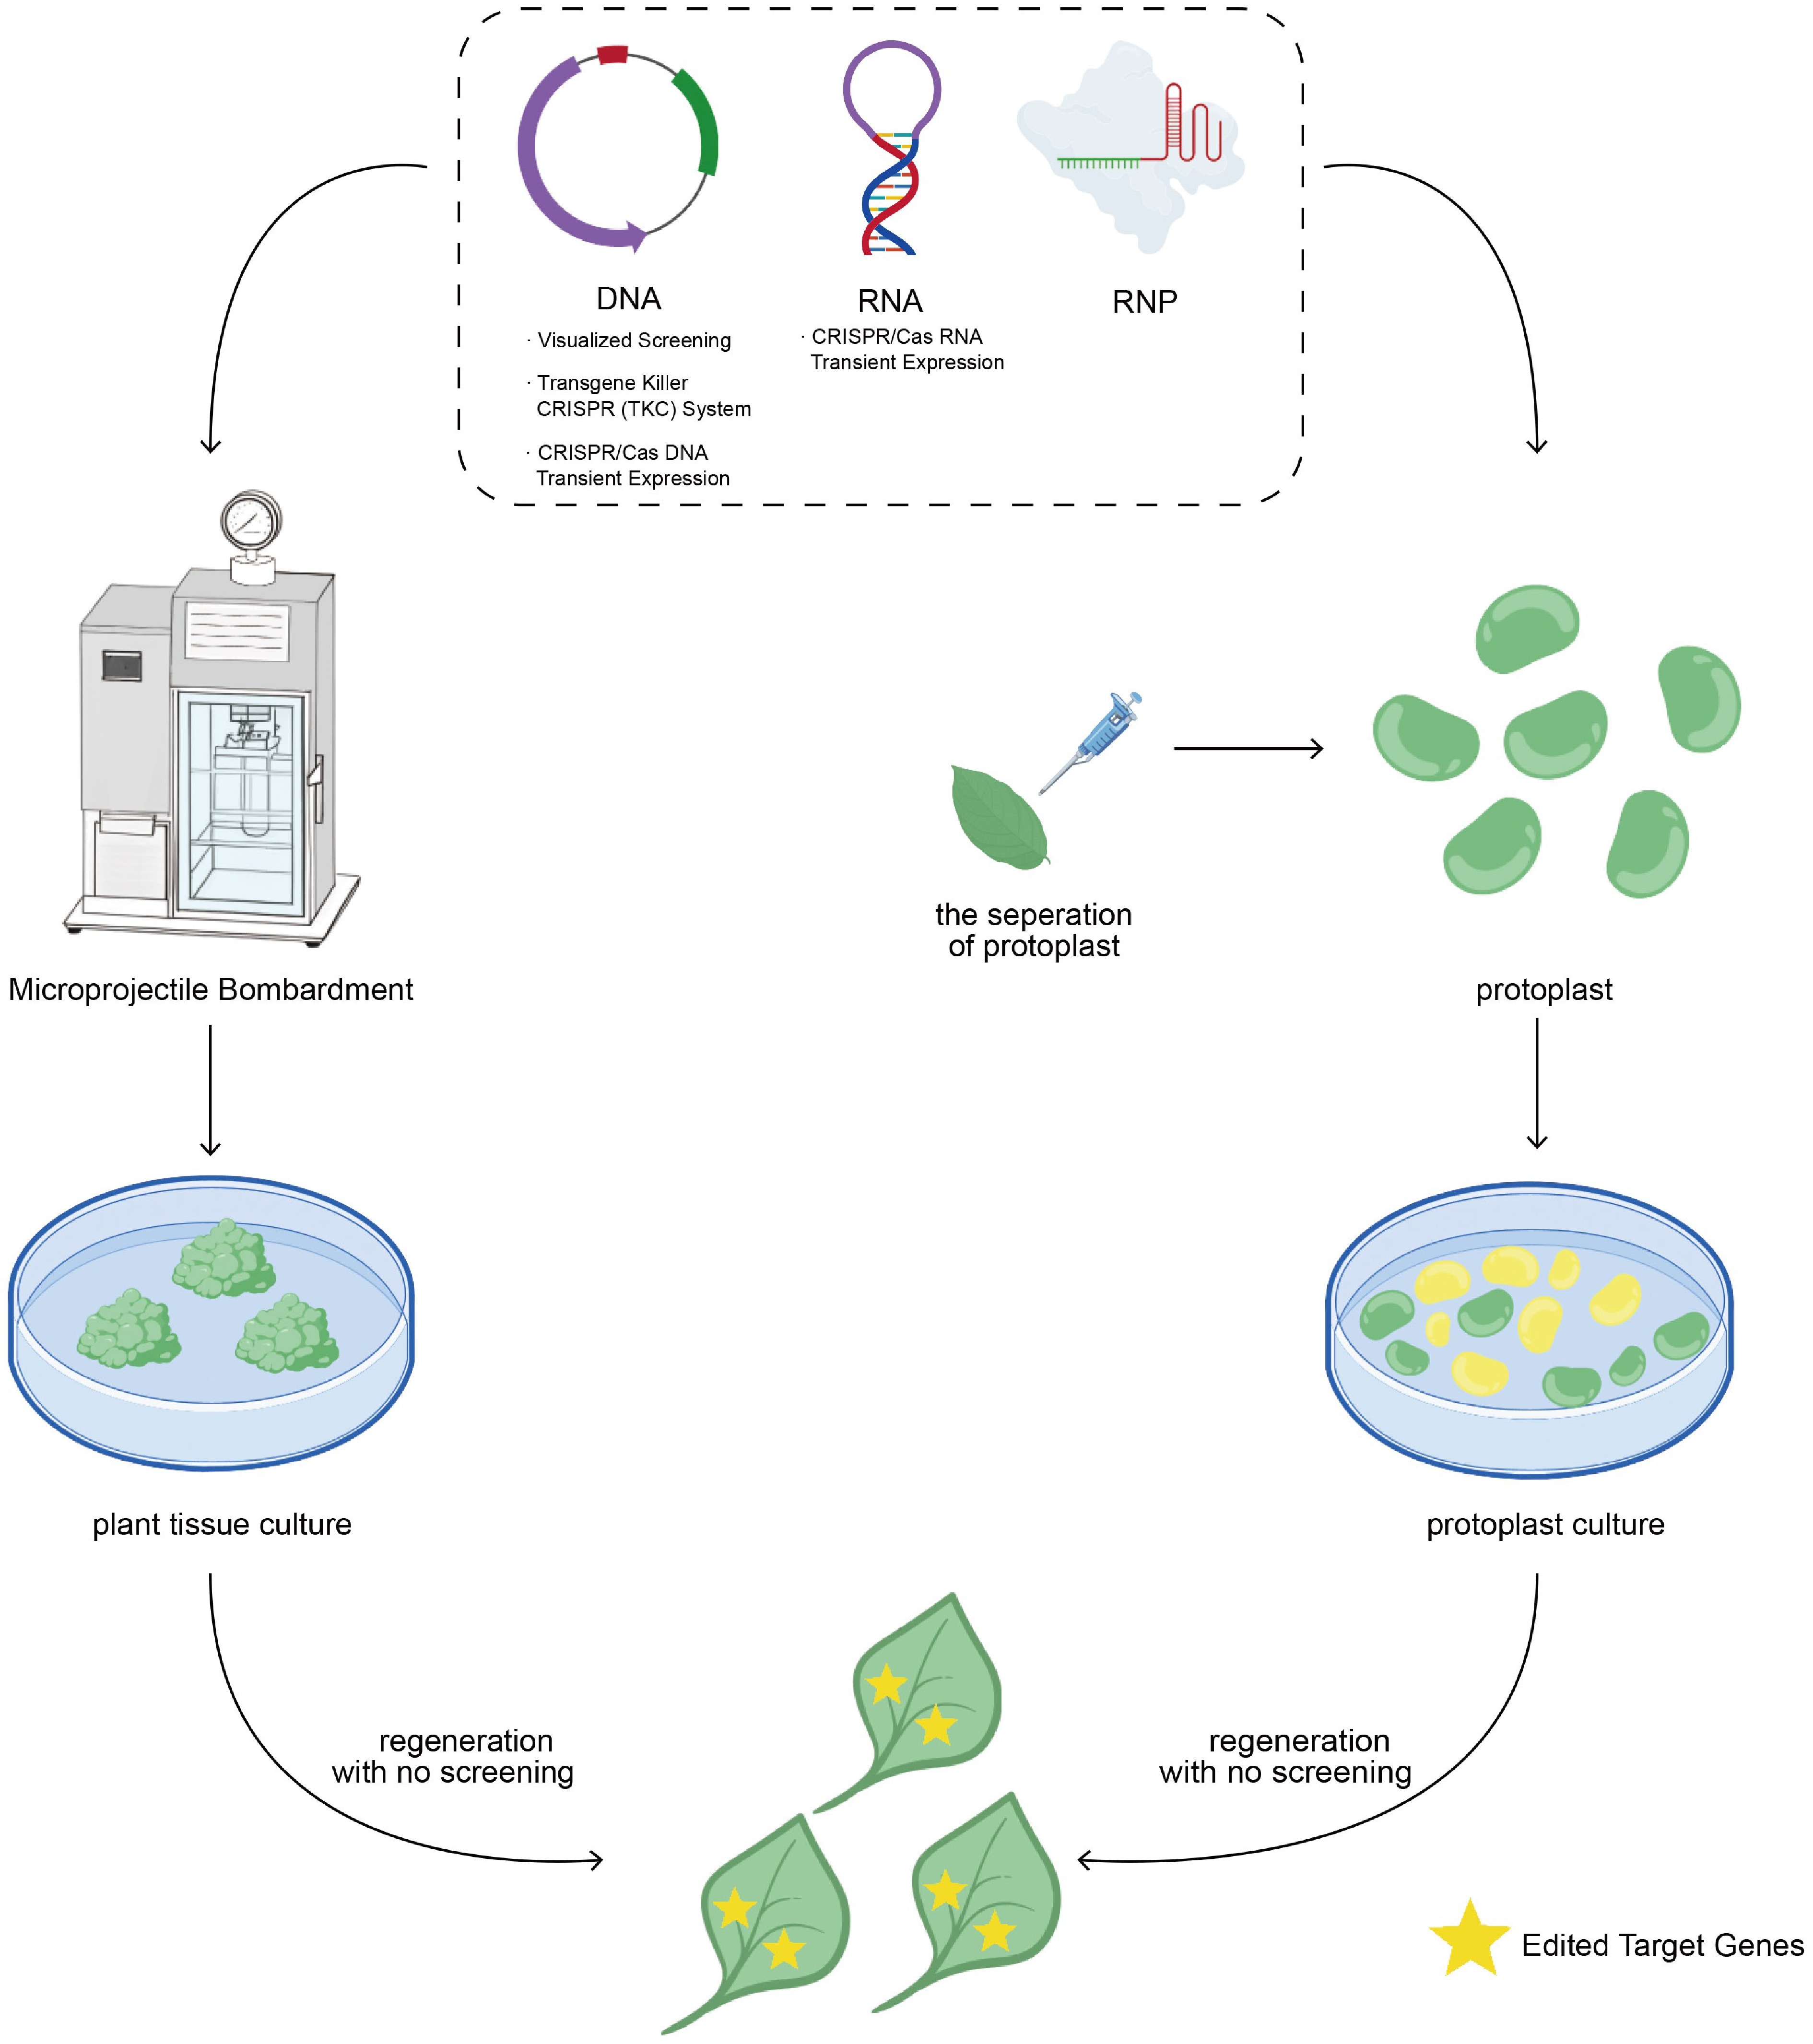
Figure 2.
Schematic representation of CRISPR/Cas delivery and regeneration of T-DNA-free, genome-edited plants.
-
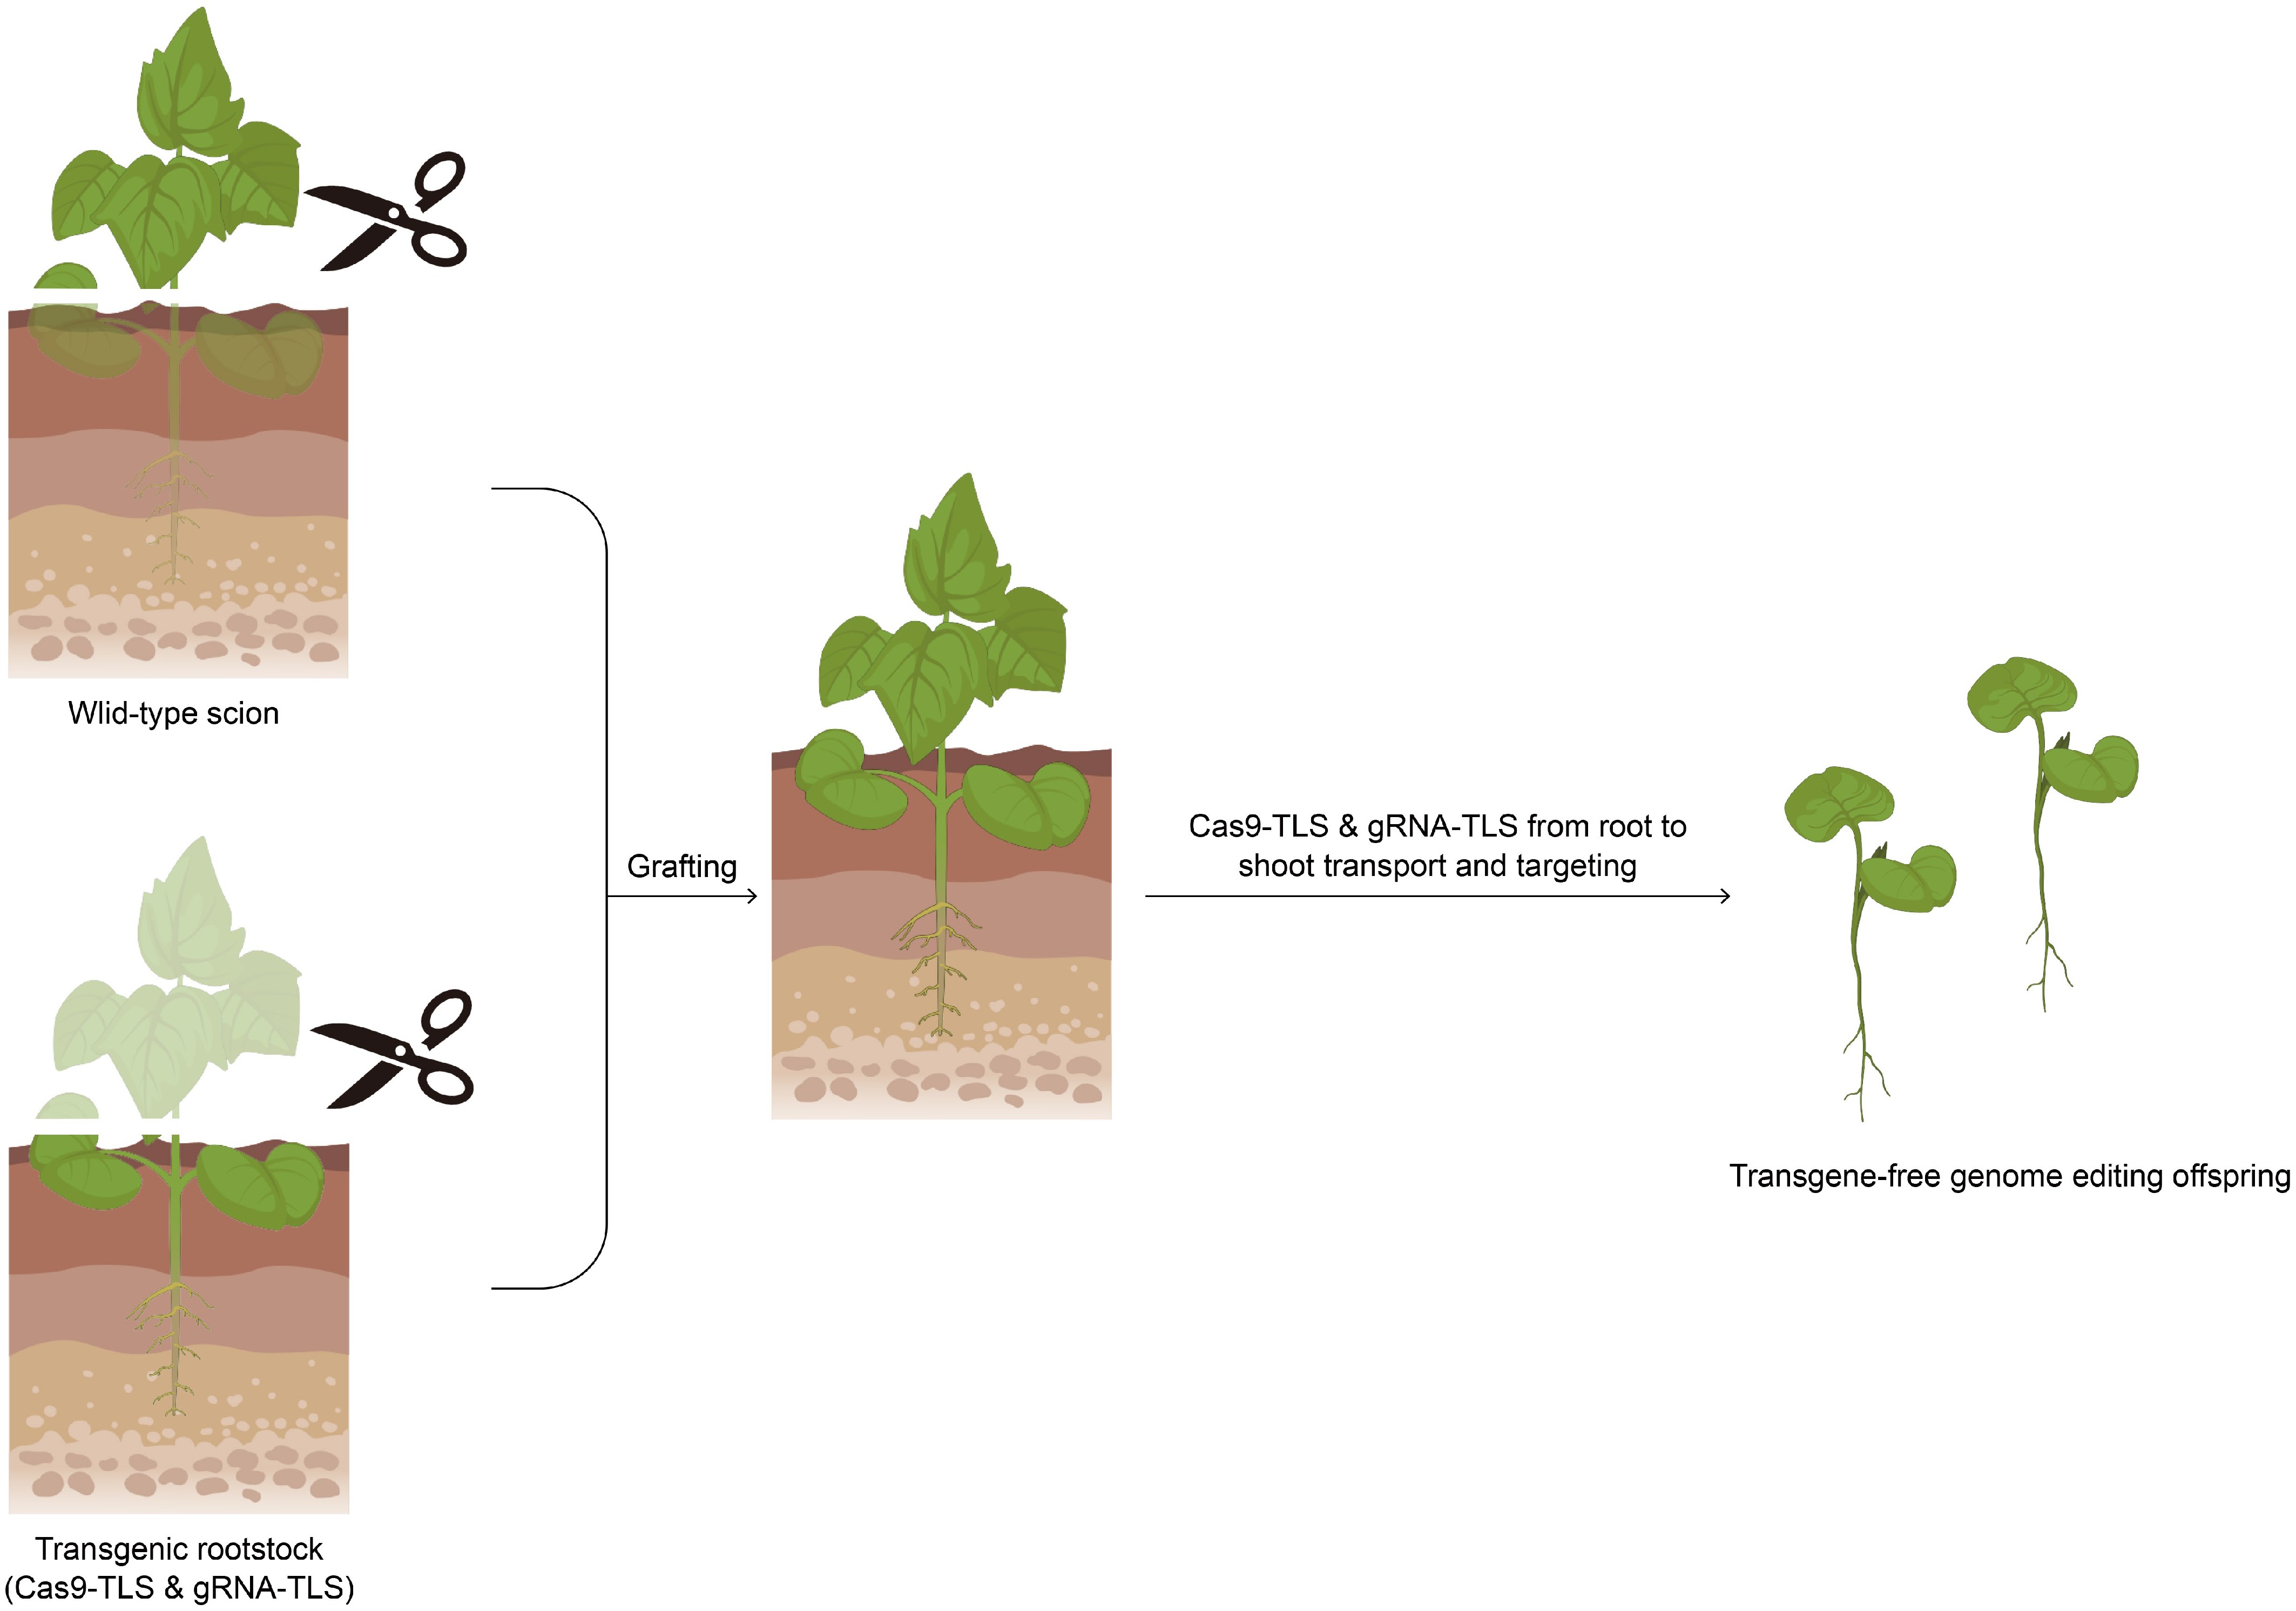
Figure 3.
Schematic diagram of graft-mobile-mediated editing.
-
Techniques Species Target genes Efficiency of T-DNA-free gene editing Ref. Visualized screening Arabidopsis thaliana AtABP1 About 50% [33] Rice IAMT 64.5% [35] Tomato 37.9% Arabidopsis thaliana 19.6% Transgene Killer CRISPR
(TKC) systemRice OsLAZY1 100% [37] OsCLE 66.67%–95.37% [38] Rice OsSE5 100% [39] OsYSA 100% 84K poplar GLK1 and GLK2 54.5% [40] Transient expression of DNA Wheat TaGASR7 2.19% (Bobwhite); 1.61% (Kenong199) [41] TaGW2 Unidentified TaDEP1 1.08% TaNAC2 1.50% TaPIN1 0.625% TaLOX2 8.24% TdGASR7 0.76% (Shimai11); 0.87% (Yumai4) Tobacco NtPDS 8.20% [42] Transient expression of RNA Wheat TaGW2 1.10% [41] Tomato SlALS1; SlER; SlRbohD; SlDMR6; SlINVINH1 12%–36.3% [43] Tobacco NtALS 1.9% Potato StDMR6 Unidentified Citrus CsLOB1 1.9% Lettuce LsFT Up to 50.0% [44] LsALS With the treatment of benazolin, up to 96.4% (callus), and 51.2% (regenerated plants) LsPDS Up to 3.53% Ribonucleoprotein (RNP)-mediated editing Arabidopsis thaliana AtBRI1 44% [45] AtPHYB 16%–19% Lettuce LsBIN2 46% (callus); 13.5% (regenerated plants) Rice OsAOC 8.4% OsDWD1 17% Tomato SlP450 19%–23% Wheat TaGASR7 1.8% [50] TaLOX2 33.6% TaCER9 23.8% Maize ZmLIG 9.7% [48] ZmALS2 Unidentified ZmMS26 2.4% ZmMS45 3.7% Soybean Gly m Bd 30K 0.4%–4.6% [52] Virus-mediated editing Tobacco NbPDS 43%–61% [53] Tobacco NbPDS 56% (inoculated leaves) [54] NbPCNA 30% (systematic leaves) Tobacco NbPDS 65% [55] NbAG 89% Arabidopsis thaliana AtPDS3 2.9% and 38% [57] AtCHLI1 14.8% and 2.1% Tobacco NbPDS; NbTOM1; NbAG; NbFLS2 0.8%–13.2% [58] Tobacco NbPDS Over 90% [59] NbRDR6 90% NbSGS3 100% NbGFP 77% and 91% Tobacco PDS 26.4%–78.2% [60] Tomato FucT Pepper DCL2 Peanut RDR6 Physalis alkekengi SGS3;BBLd; ER; AHAS1 Wheat TaPDS 65.2% [61] Pollen-mediated editing Maize ZmVLHP 12.5% [63] ZmGW2 6.25% Wheat TaGT1 16.9% Arabidopsis thaliana AtGL1 Up to 16.9% Cole crops BoFAD2 1.89%–12.11% [65] Brassica napus BnFAD2 12.92%–12.97% Graft-mobile-mediated editing Brassica napus BrNIA1 0.57%–0.50% (TLS1 and TLS2) [66] Table 1.
Cases of T-DNA-free genome editing in plants.
Figures
(3)
Tables
(1)