-
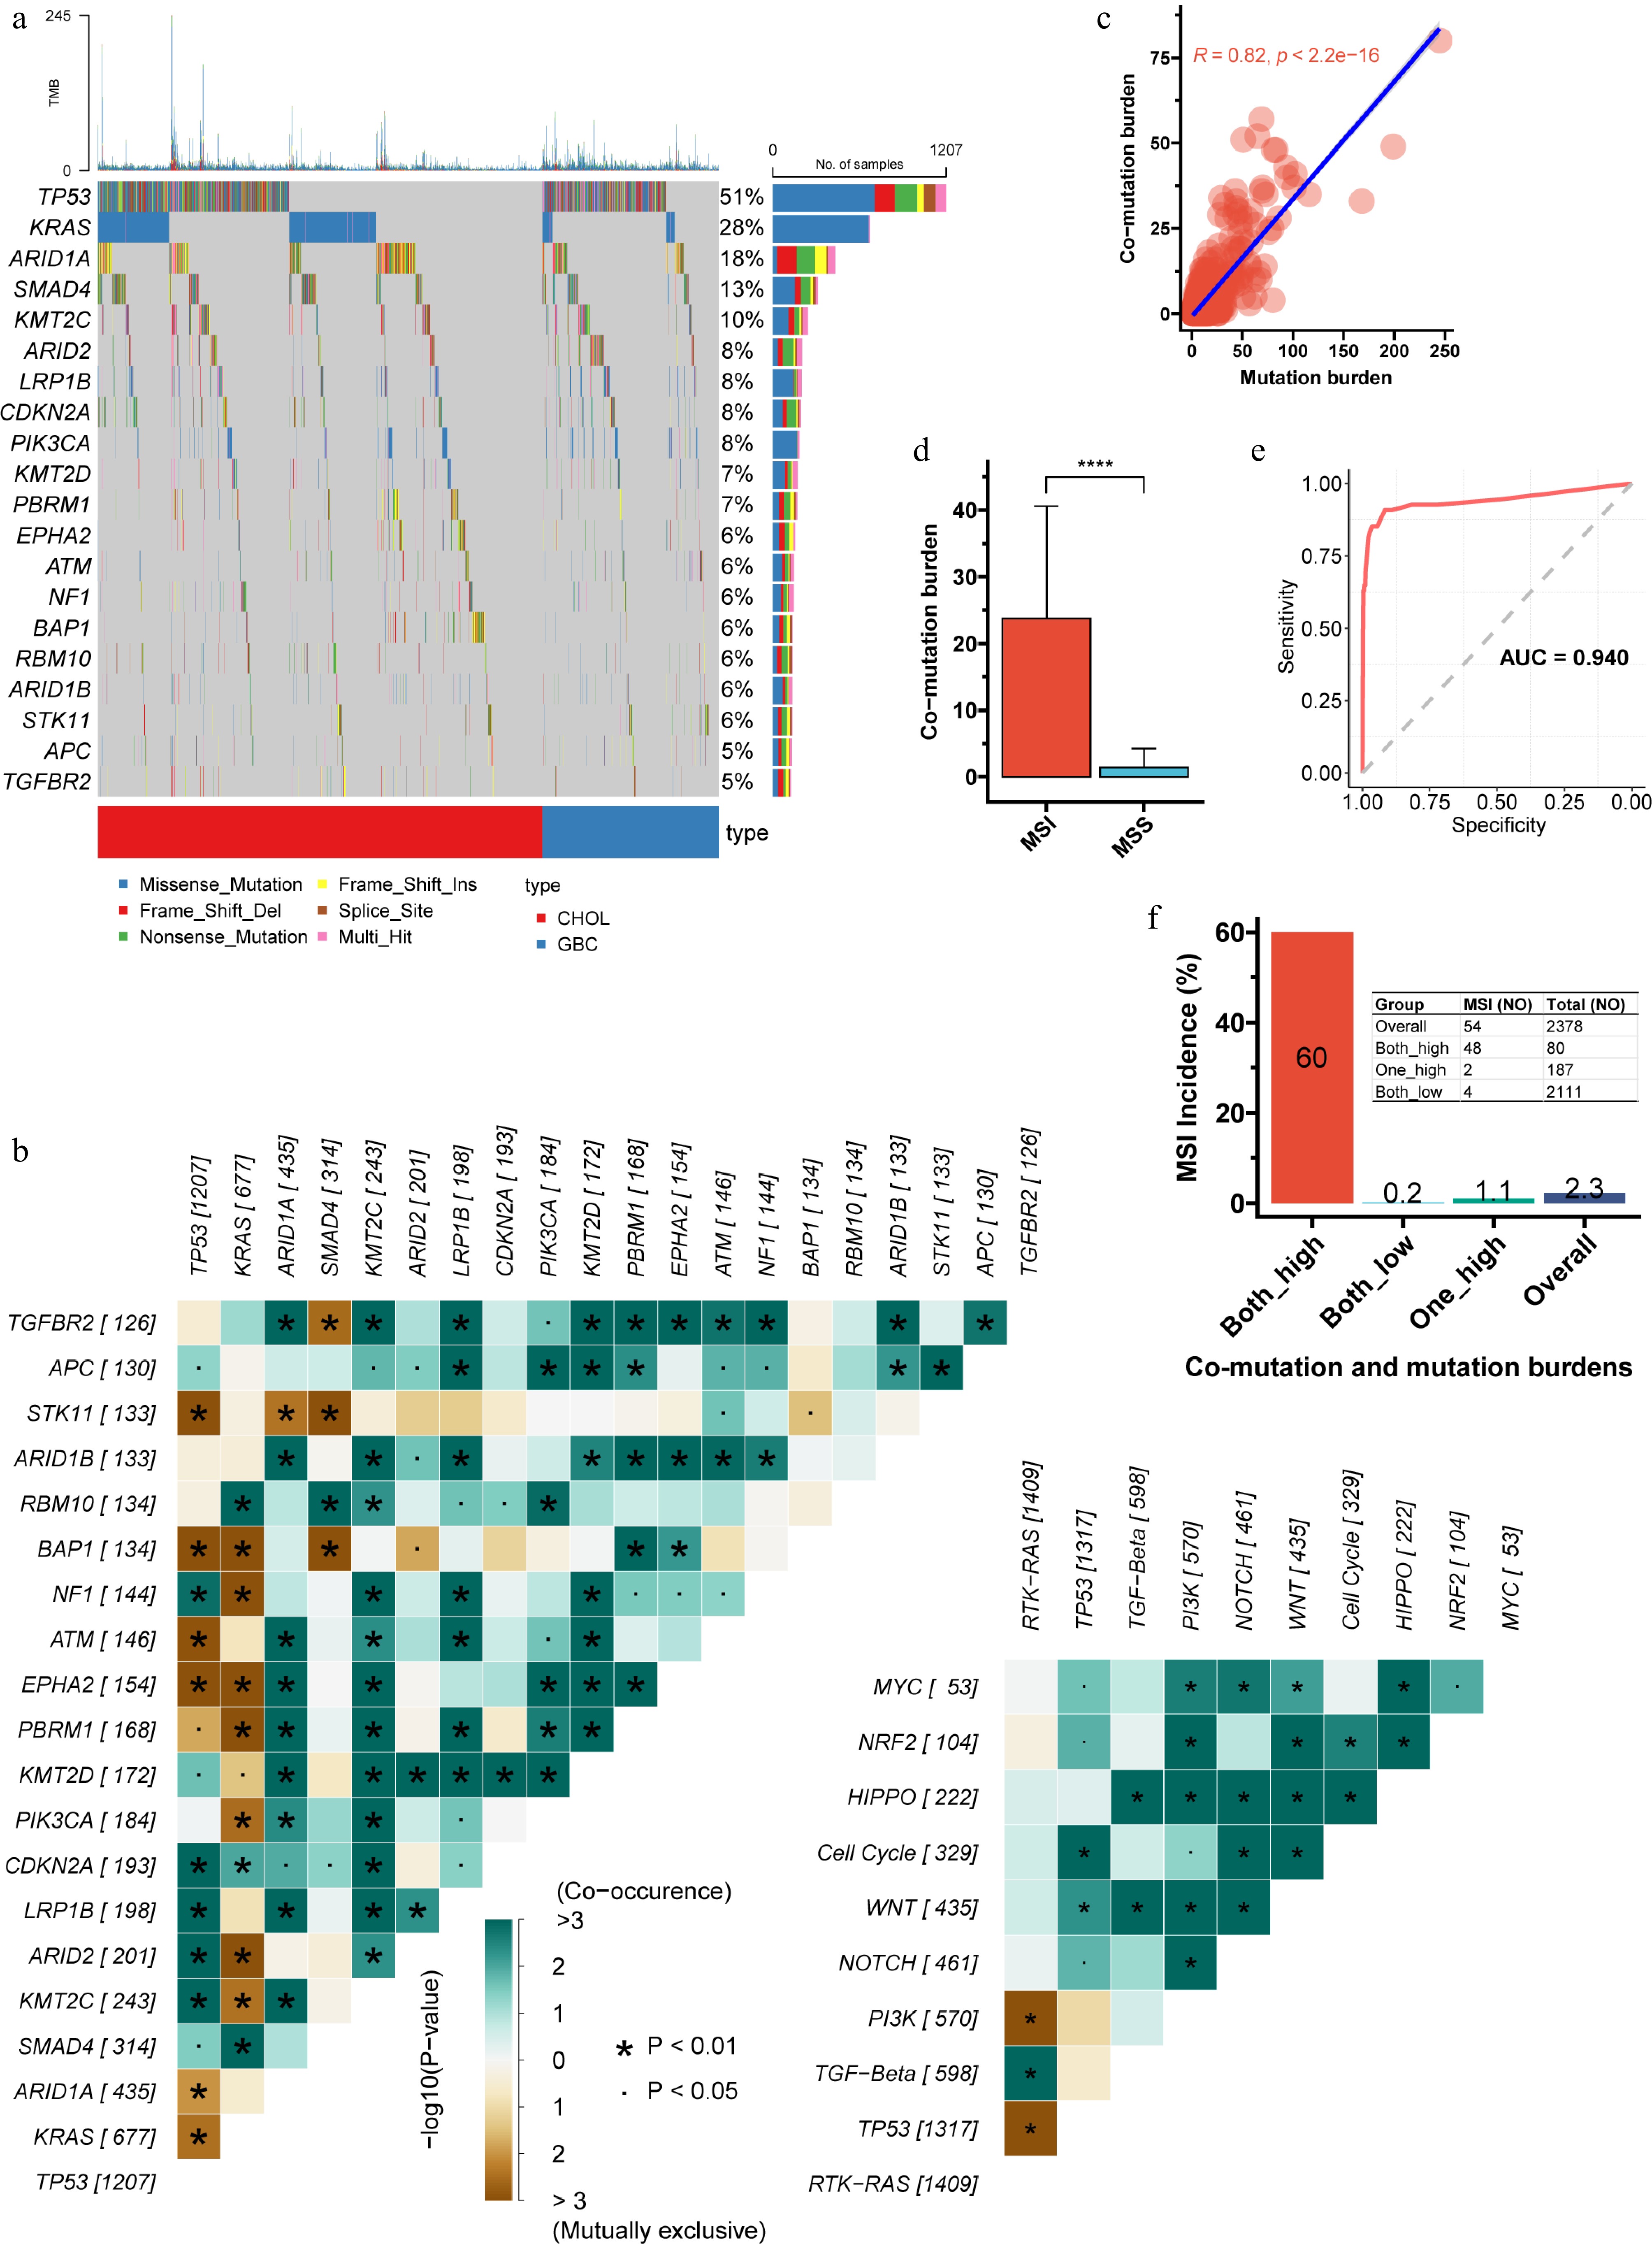
Figure 1.
Characteristics of co-mutations in the discovery cohort. (a) Waterfall plot illustrating the frequency and distribution of the top 20 most frequent mutations. (b) Analysis of mutual exclusivity and co-occurrence among the top 20 mutations, including their relationships within 10 major oncogenic signaling pathways. TP53 displayed frequent co-mutations and mutual exclusivity, while KRAS showed the highest number of mutually exclusive events. (c) Pearson correlation between co-mutation burden and total mutation burden (p < 2.2e-16). (d), Comparison of co-mutation burden between microsatellite-instable (MSI) and microsatellite-stable (MSS) tumors. (e), Receiver operating characteristic (ROC) curve and area under the curve (AUC) for predicting MSI status based on co-mutation burden (the Youden index is 4.5). (f) Using the Youden index derived from the ROC curve, both co-mutation and total mutation burdens were dichotomized into high and low groups. The incidence of MSI across the resulting combined subgroups is shown. The double-high group had an MSI frequency of 60%, significantly higher than the 1.1% observed when only one metric was high. CHOL, cholangiocarcinoma; GBC, gallbladder cancer; ROC, receiver operating characteristic; AUC, area under the curve.
-

Figure 2.
Actionable alterations and their mutual exclusivity and co-occurrence patterns. (a) Waterfall plot displaying the frequency and spectrum of actionable alterations. (b) Comparison of actionable alteration frequencies between CHOL and GBC. The actionable landscapes of CHOL and GBC differed significantly. Patterns of mutual exclusivity and co-occurrence among actionable alterations in (c) CHOL, and (d) GBC, respectively. In CHOL, KRAS mutation showed negative selection, being significantly mutually exclusive with most other actionable alterations. In contrast, GBC was characterized by PIK3CA and IDH2 mutations co-occurring with multiple other actionable lesions. AMPL, amplification; FS, fusion; RA, rearrangement.
-

Figure 3.
Prognostic impact of co-mutations. (a) Univariate Cox regression analysis identifying co-mutations significantly associated with prognosis (top 20 shown). (b) Selection of detrimental co-mutations (DCMs) with the strongest prognostic influence using LASSO regression. (c) Kaplan-Meier survival curves comparing patients with versus without DCMs. (d) Multivariate Cox regression evaluating the independent prognostic value of DCMs confirmed that DCMs were an independent predictor of poor OS. (e) Objective response rate (ORR) among 33 patients with available treatment-response data, stratified by the presence of DCMs. The ORR was only 25% in the DCM subgroup, significantly lower than the 58.6% in those without DCMs. mOS, median overall survival; HR, hazard ratio; CI, confidence interval; RW, real-world; 1st, first-line; 2nd, second-line. LASSO: Least absolute shrinkage and selection operator.
-

Figure 4.
Genomic subtyping based on integrated DSMs and DCMs. (a) Survival analysis stratified by the number of detrimental single mutations (DSMs). A strong dose-response relationship was observed between the number of DSMs and outcome. (b) Survival analysis according to the proposed genomic subtypes. Outcomes differed significantly among the three groups: WT tumors had the best survival, SH intermediate, and MH the worst. (c) Stratified analysis confirmed that MH status remained a robust adverse factor across all clinically relevant subgroups. (d) ORR across genomic subtypes. WT, wild-type; SH, single-hit; MH, multi-hit.
-
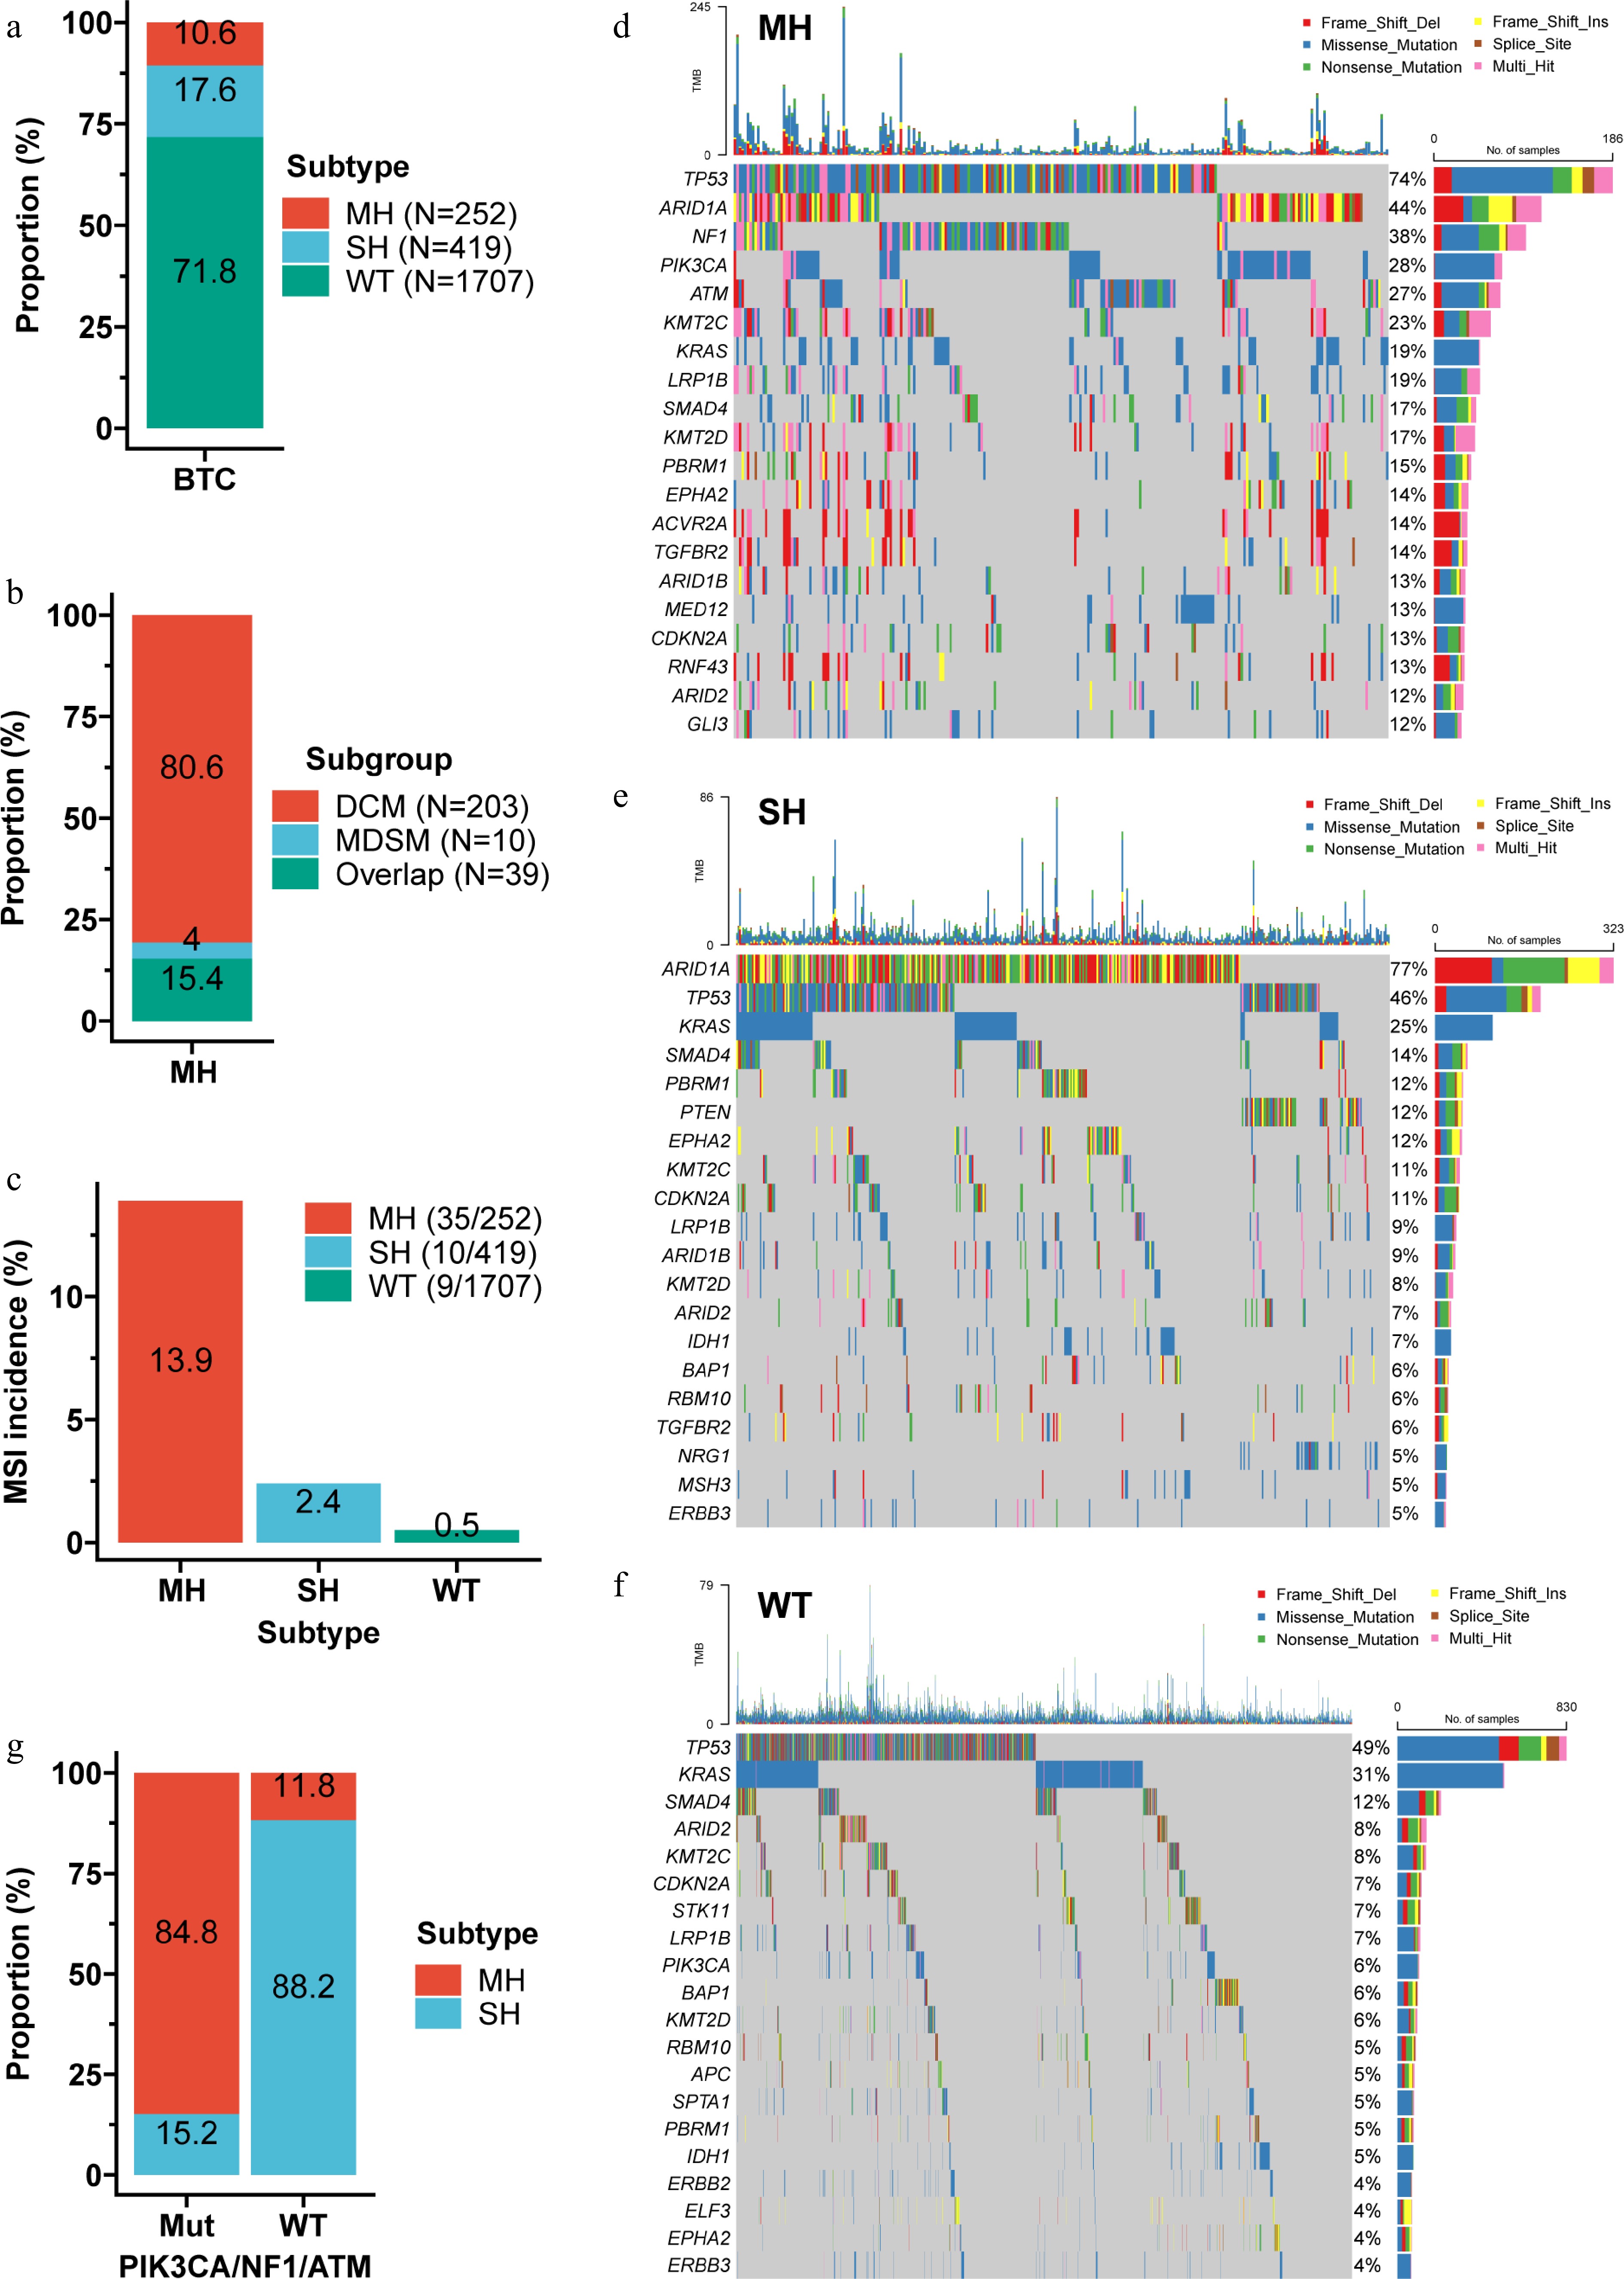
Figure 5.
Characteristics of the genomic subtypes. (a) Distribution of the three subtypes within the discovery cohort. (b) Composition of the MH subtype. (c) Prevalence of MSI across the three subtypes. MH tumors had the highest MSI rate (13.9%), followed by SH (2.4%), and WT (0.5%). Waterfall plots showing the top 20 mutations in the MH (d), SH (e), and WT (f) subtypes. (g) Proportion of MH and SH subtypes among tumors with PIK3CA/NF1/ATM mutations versus wild-type. Combining mutation status of PIK3CA, NF1, and ATM correctly distinguished > 84% of MH from SH cases. MDSM, multiple DSMs.
-
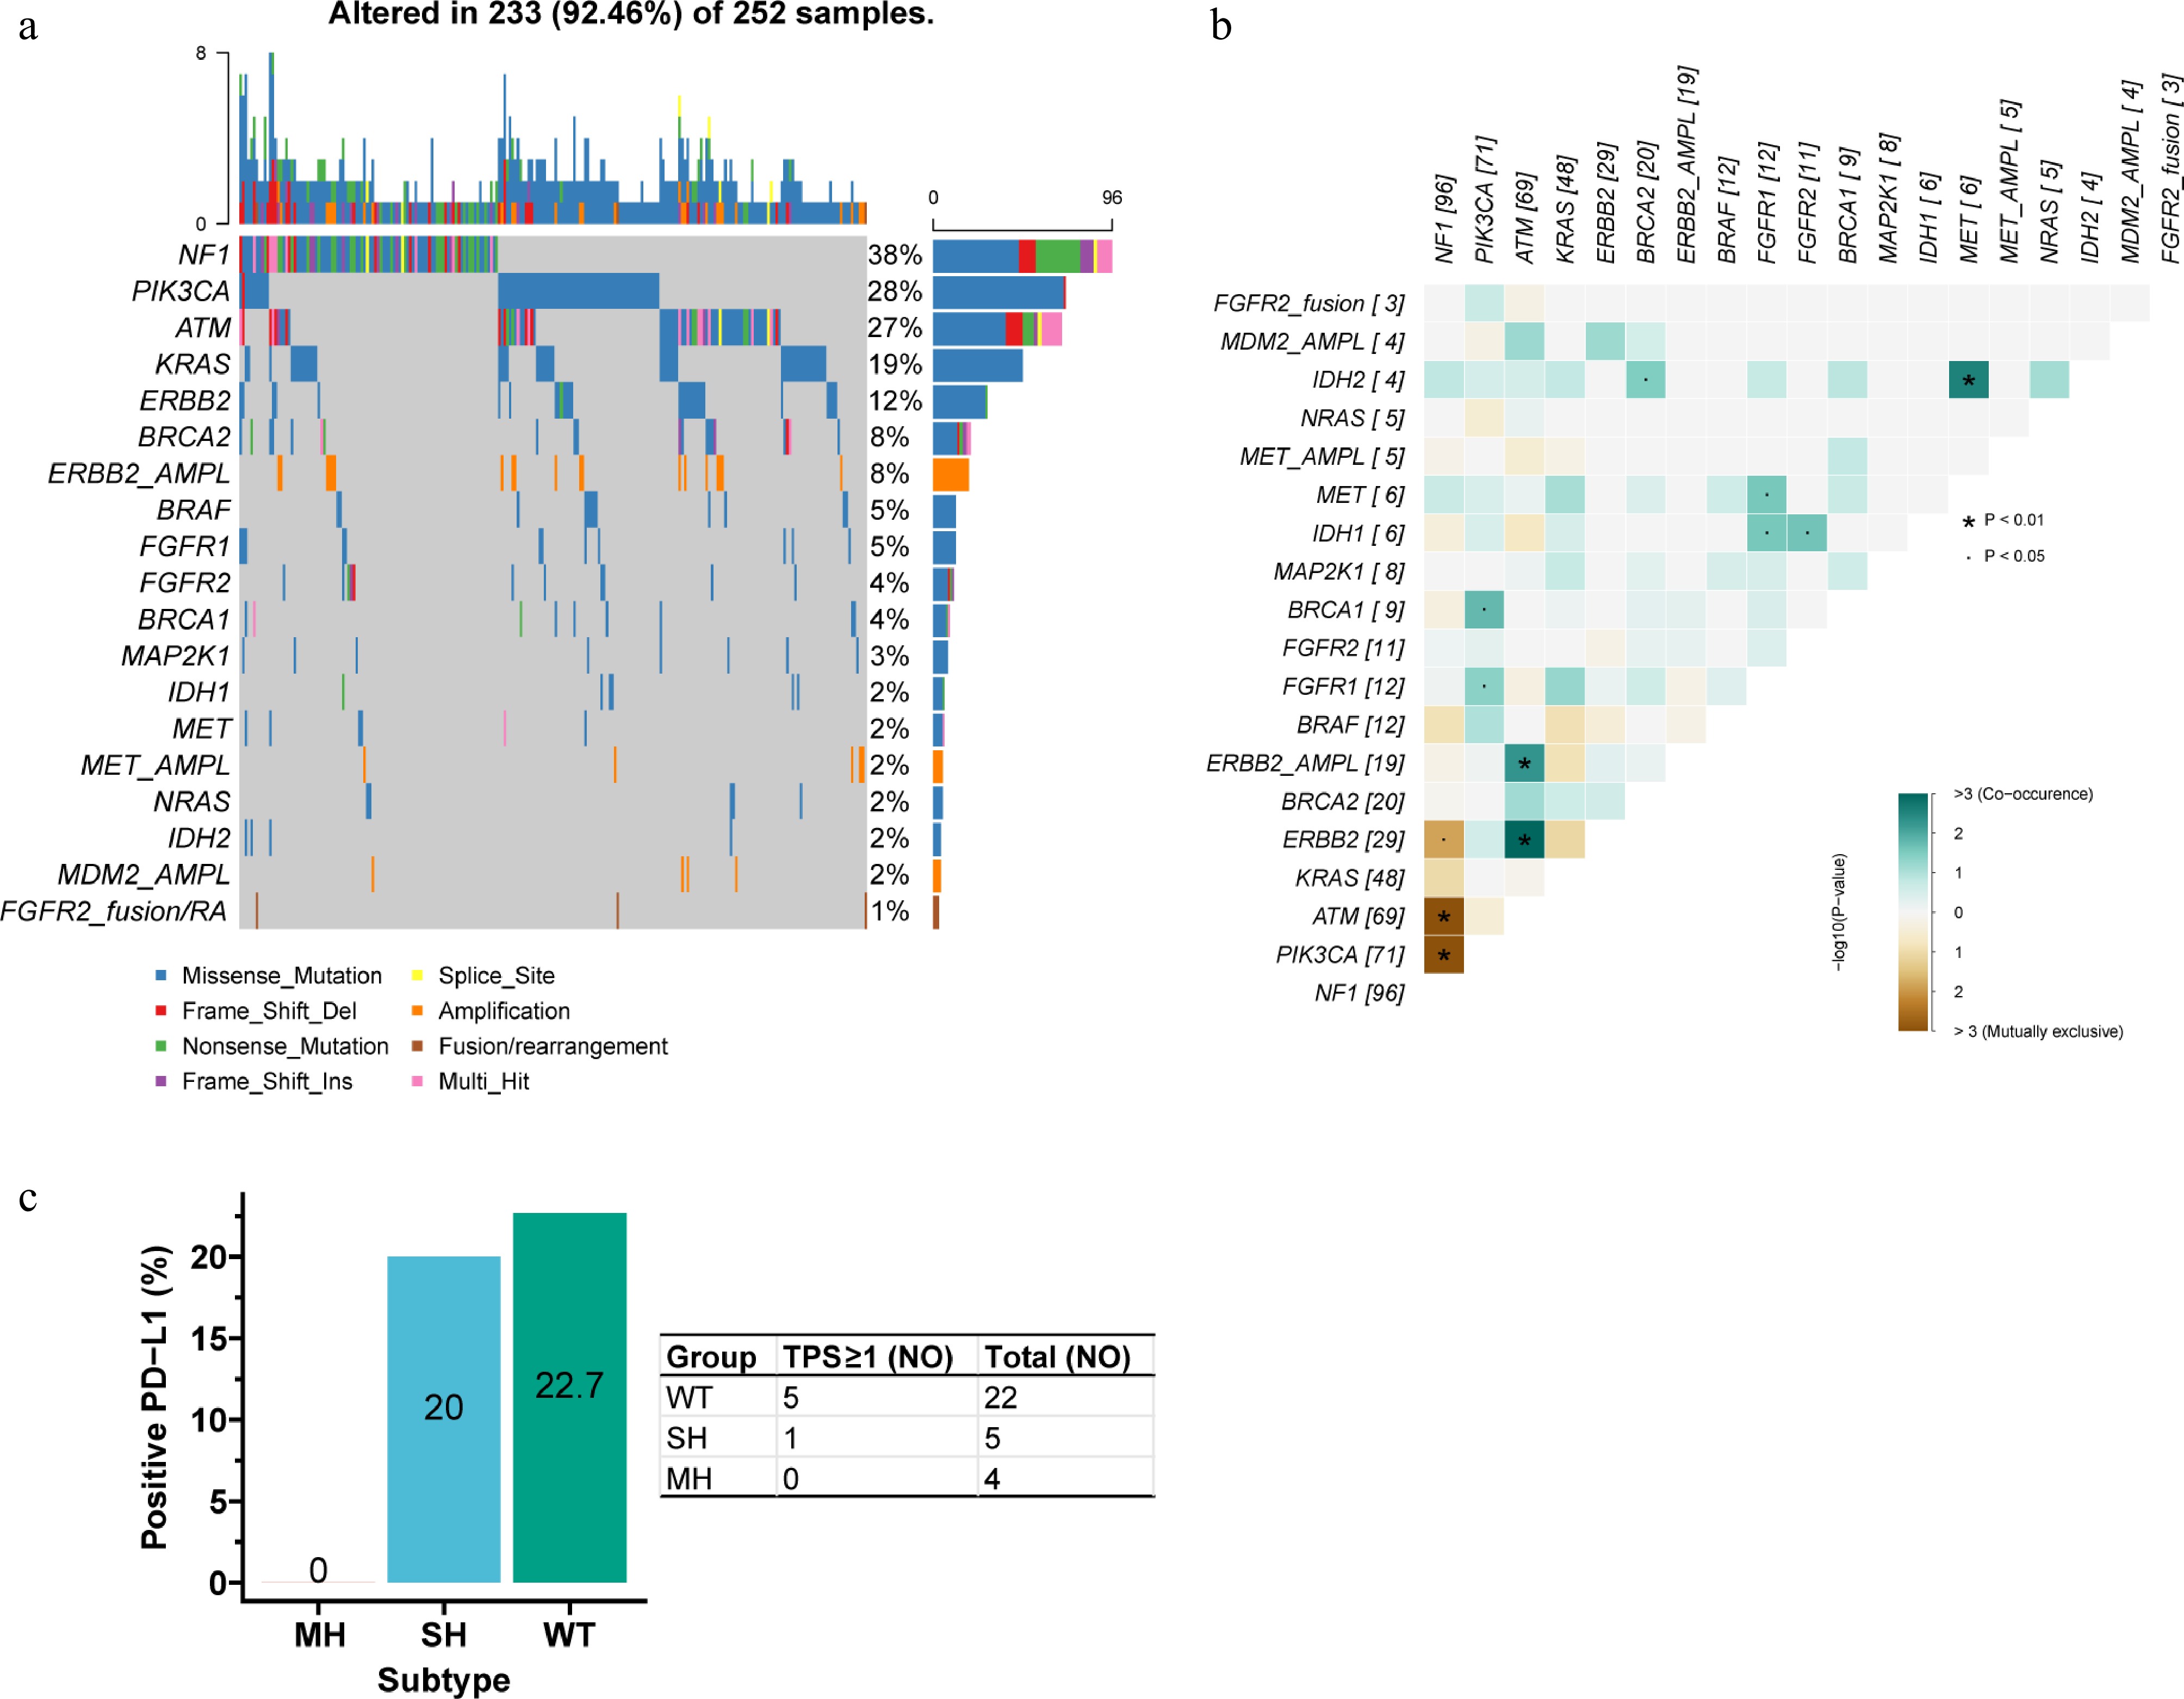
Figure 6.
Actionable alterations in the MH subtype. (a) Waterfall plot of actionable alterations. (b) Mutual exclusivity and co-occurrence among actionable alterations. NF1 mutation was mutually exclusive with ERBB2, ATM, and PIK3CA mutations. ATM mutation/amplification co-occurred with ERBB2 mutation/amplification, and IDH2 mutation co-occurred with MET mutation. (c) PD-L1 positivity rates across the three subtypes. The positivity rate (TPS ≥ 1) was 0% in MH, markedly lower than in SH (20.0%), and WT (22.7%).
-
Gene Genotype Subtype p-Value WT (%) SH (%) MH (%) ATM WT 1,650 (96.7) 399 (95.2) 183 (72.6) < 0.001 Mut 57 (3.3) 20 (4.8) 69 (27.4) BRAF WT 1,659 (97.2) 401 (95.7) 240 (95.2) 0.117 Mut 48 (2.8) 18 (4.3) 12 (4.8) BRCA1* WT 1,698 (99.5) 414 (98.8) 243 (96.4) < 0.001 Mut 9 (0.5) 5 (1.2) 9 (3.6) BRCA2 WT 1,663 (97.4) 399 (95.2) 232 (92.1) < 0.001 Mut 44 (2.6) 20 (4.8) 20 (7.9) ERBB2 Norm 1,594 (93.4) 406 (96.9) 231 (91.7) 0.009 AMPL 113 (6.6) 13 (3.1) 21 (8.3) ERBB2 WT 1,636 (95.8) 405 (96.7) 223 (88.5) < 0.001 Mut 71 (4.2) 14 (3.3) 29 (11.5) FGFR1* WT 1,699 (99.5) 415 (99.0) 240 (95.2) < 0.001 Mut 8 (0.5) 4 (1.0) 12 (4.8) FGFR2* WT 1,684 (98.7) 414 (98.8) 241 (95.6) 0.006 Mut 23 (1.3) 5 (1.2) 11 (4.4) FGFR2* Norm 1,699 (99.5) 416 (99.3) 252 (100.0) 0.411 AMPL 8 (0.5) 3 (0.7) 0 (0.0) FGFR2 Norm 1,652 (96.8) 413 (98.6) 249 (98.8) 0.038 FS/RA 55 (3.2) 6 (1.4) 3 (1.2) IDH1 WT 1,630 (95.5) 390 (93.1) 246 (97.6) 0.021 Mut 77 (4.5) 29 (6.9) 6 (2.4) IDH2* WT 1,684 (98.7) 416 (99.3) 248 (98.4) 0.572 Mut 23 (1.3) 3 (0.7) 4 (1.6) KRAS WT 1,182 (69.2) 315 (75.2) 204 (81.0) < 0.001 Mut 525 (30.8) 104 (24.8) 48 (19.0) MAP2K1* WT 1,695 (99.3) 415 (99.0) 244 (96.8) 0.004 Mut 12 (0.7) 4 (1.0) 8 (3.2) MDM2 Norm 1,597 (93.6) 400 (95.5) 248 (98.4) 0.004 AMPL 110 (6.4) 19 (4.5) 4 (1.6) MET* WT 1,690 (99.0) 413 (98.6) 246 (97.6) 0.154 Mut 17 (1.0) 6 (1.4) 6 (2.4) MET Norm 1,671 (97.9) 409 (97.6) 247 (98.0) 0.924 AMPL 36 (2.1) 10 (2.4) 5 (2.0) NF1 WT 1,671 (97.9) 407 (97.1) 156 (61.9) < 0.001 Mut 36 (2.1) 12 (2.9) 96 (38.1) NRAS WT 1,670 (97.8) 409 (97.6) 247 (98.0) 0.937 Mut 37 (2.2) 10 (2.4) 5 (2.0) PIK3CA WT 1,601 (93.8) 412 (98.3) 181 (71.8) < 0.001 Mut 106 (6.2) 7 (1.7) 71 (28.2) *Fisher's exact test. WT: wildtype; Mut: mutation; SH: single-hit; MH: Multi-hit; AMPL: amplification; Norm: normal. Table 1.
Actionable alterations among subtypes.
Figures
(6)
Tables
(1)