-
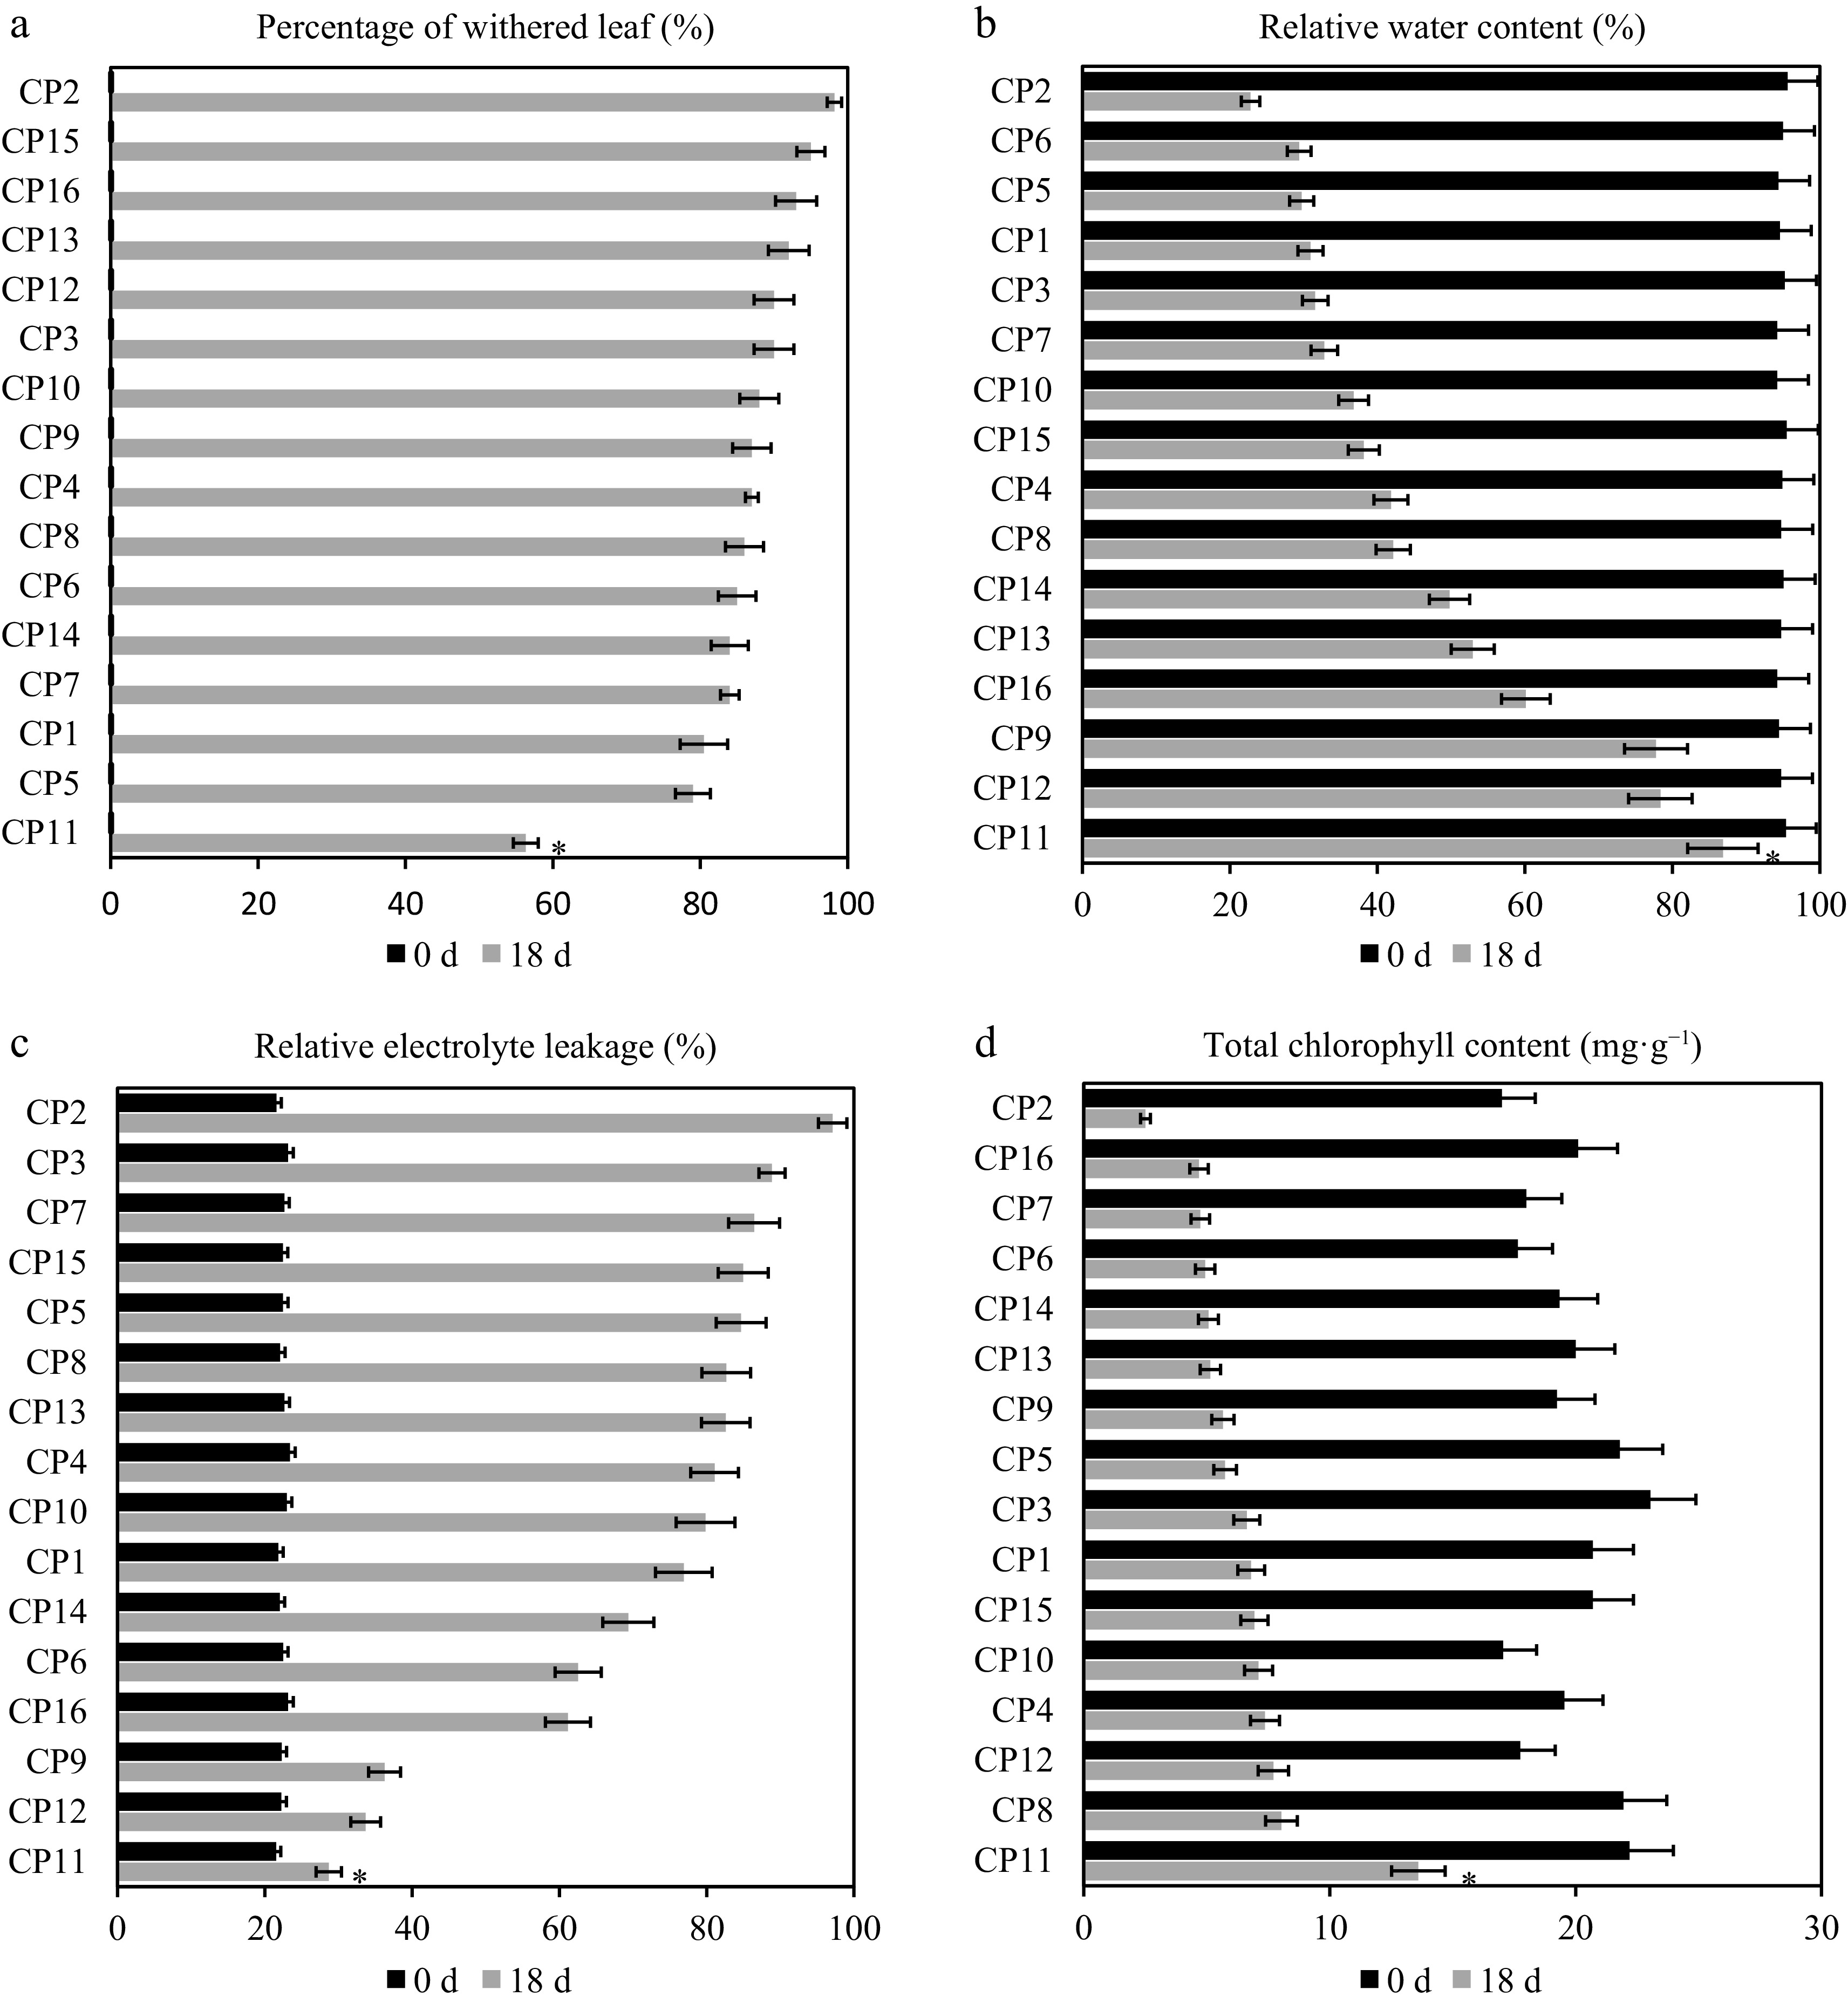
Figure 1.
Physiological responses of 16 centipedegrass genotypes to the 99% shade treatment after 18 d. Comparison of physiological responses across 16 centipedegrass genotypes (CP1–CP16) under the control (full light, 0 d) and 99% shade (18 d) conditions. (a) Leaf wilting rate (%), (b) relative water content (RWC, %), (c) relative conductivity (RC, %), (d) total chlorophyll content (mg·g−1). The shade-tolerant genotype CP11 exhibits the lowest wilting rate (56.33%), the highest RWC (86.85%), the lowest RC (28.68%), and the highest chlorophyll retention (13.61 mg·g−1 total), whereas the shade-sensitive CP2 shows the highest wilting rate (98.2%), the lowest RWC (22.8%), the highest RC (97.12%), and the lowest chlorophyll content (2.51 mg·g−1 total). Data represent the means of three biological replicates. An asterisk indicates a significant difference between CP2 and CP11 on Day 18 (p < 0.05).
-
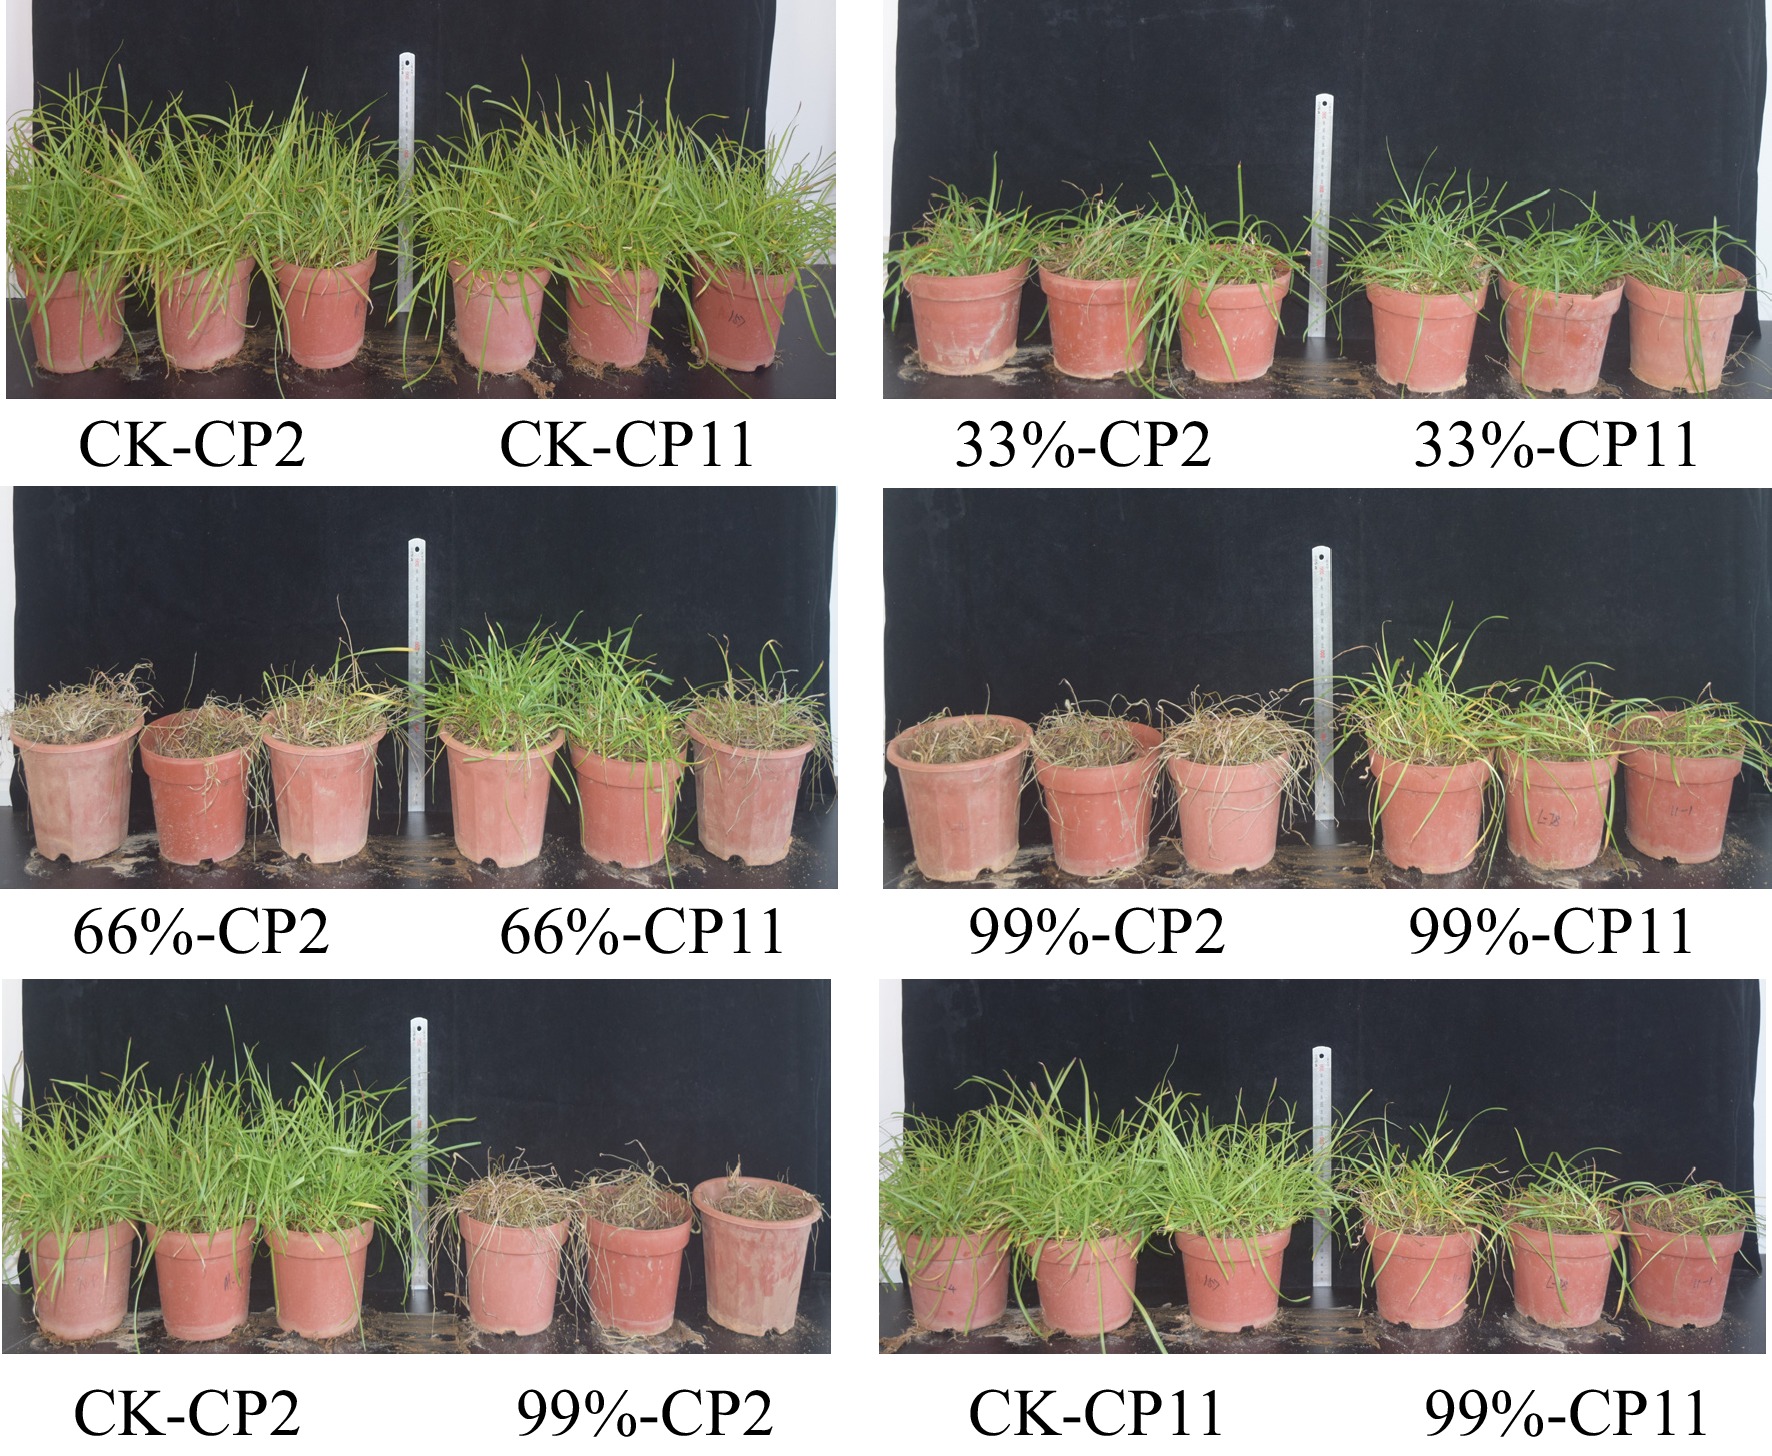
Figure 2.
Effects of 18-d shading treatments on the phenotypes of two centipedegrass genotypes under different shading levels. Treatments include the control (CK, full light), 33% shade, 66% shade, and 99% shade. CP11 exhibits minimal leaf yellowing and upright growth, whereas CP2 shows extensive yellowing, curling, and wilting, particularly under 99% shade.
-
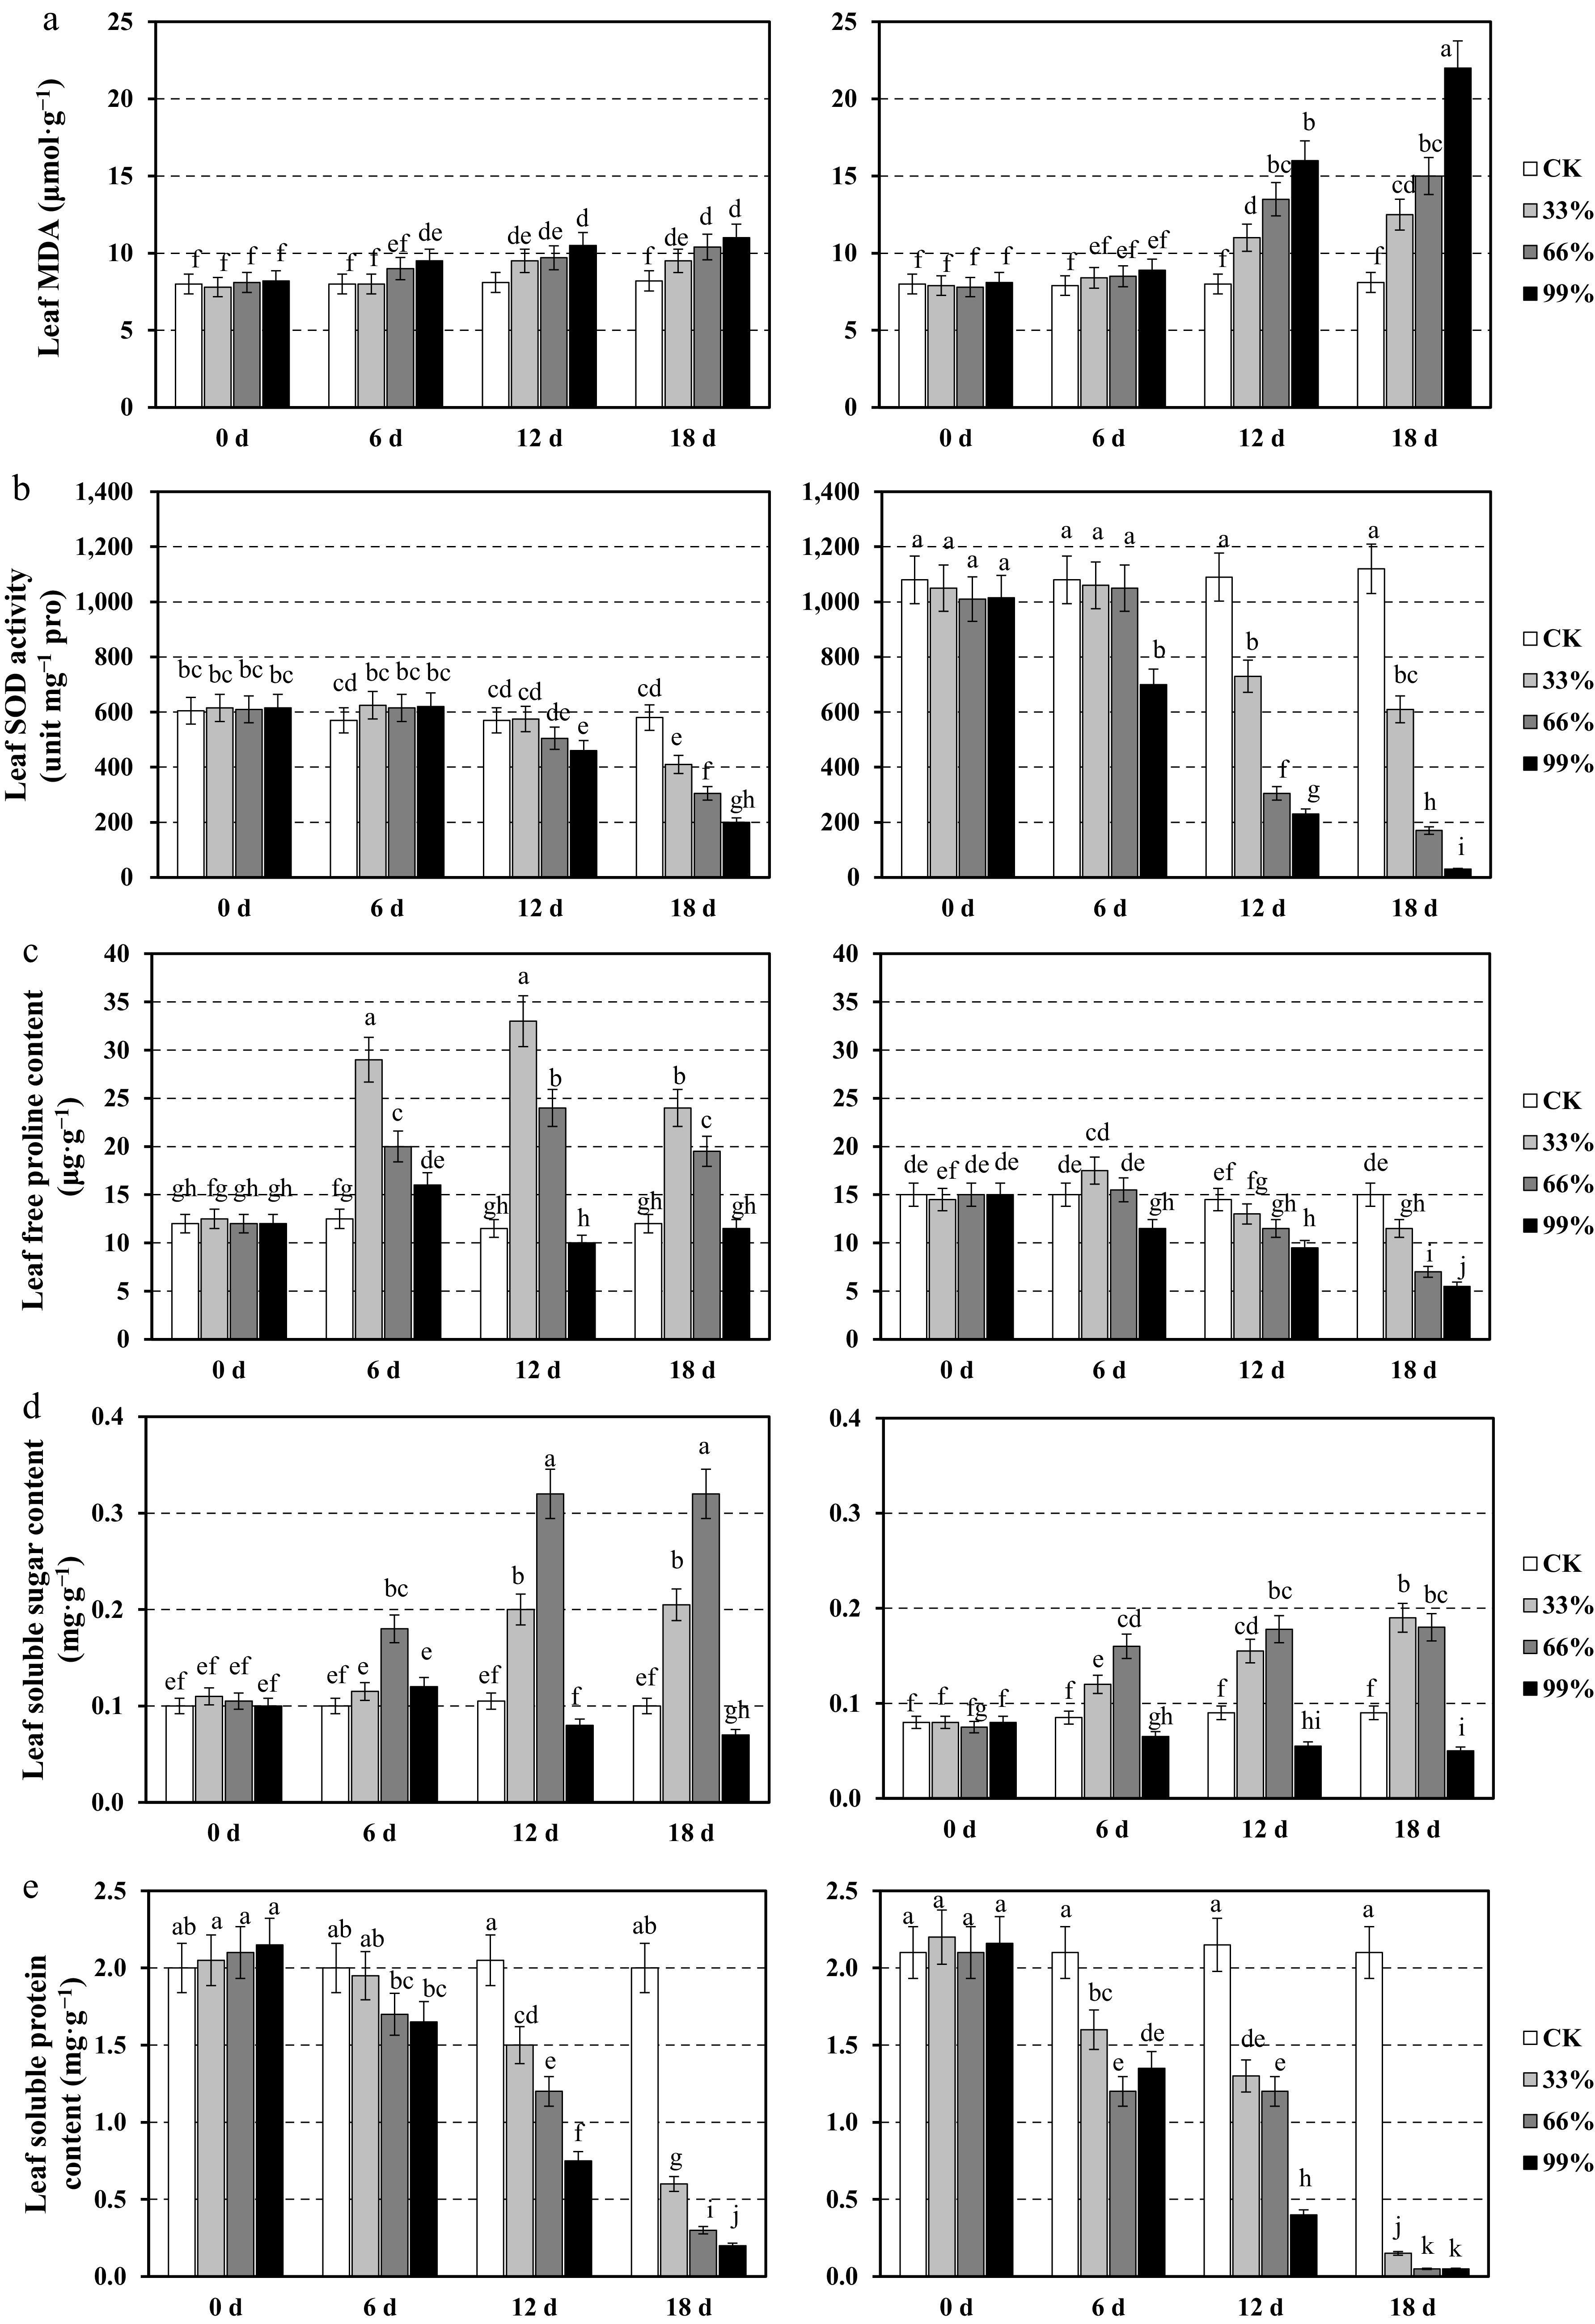
Figure 3.
Physiological responses of the leaves in two centipedegrass genotypes, CP11 (left panels) and CP2 (right panels), under different shading levels (CK [control], 33%, 66%, and 99%) over a time course of 0, 6, 12, and 18 d. Data are shown for (a) malondialdehyde (MDA) content (μmol·g−1), (b) superoxide dismutase (SOD) activity (unit mg−1 proline), (c) free proline content (μg·g−1), (d) soluble sugar content (mg·g−1), and (e) soluble protein content (mg·g−1). Values represent the means ± standard error (SE) (n = 3). Different letters indicate statistically significant differences (p < 0.05) according to analysis of variance (ANOVA) followed by post hoc tests.
-
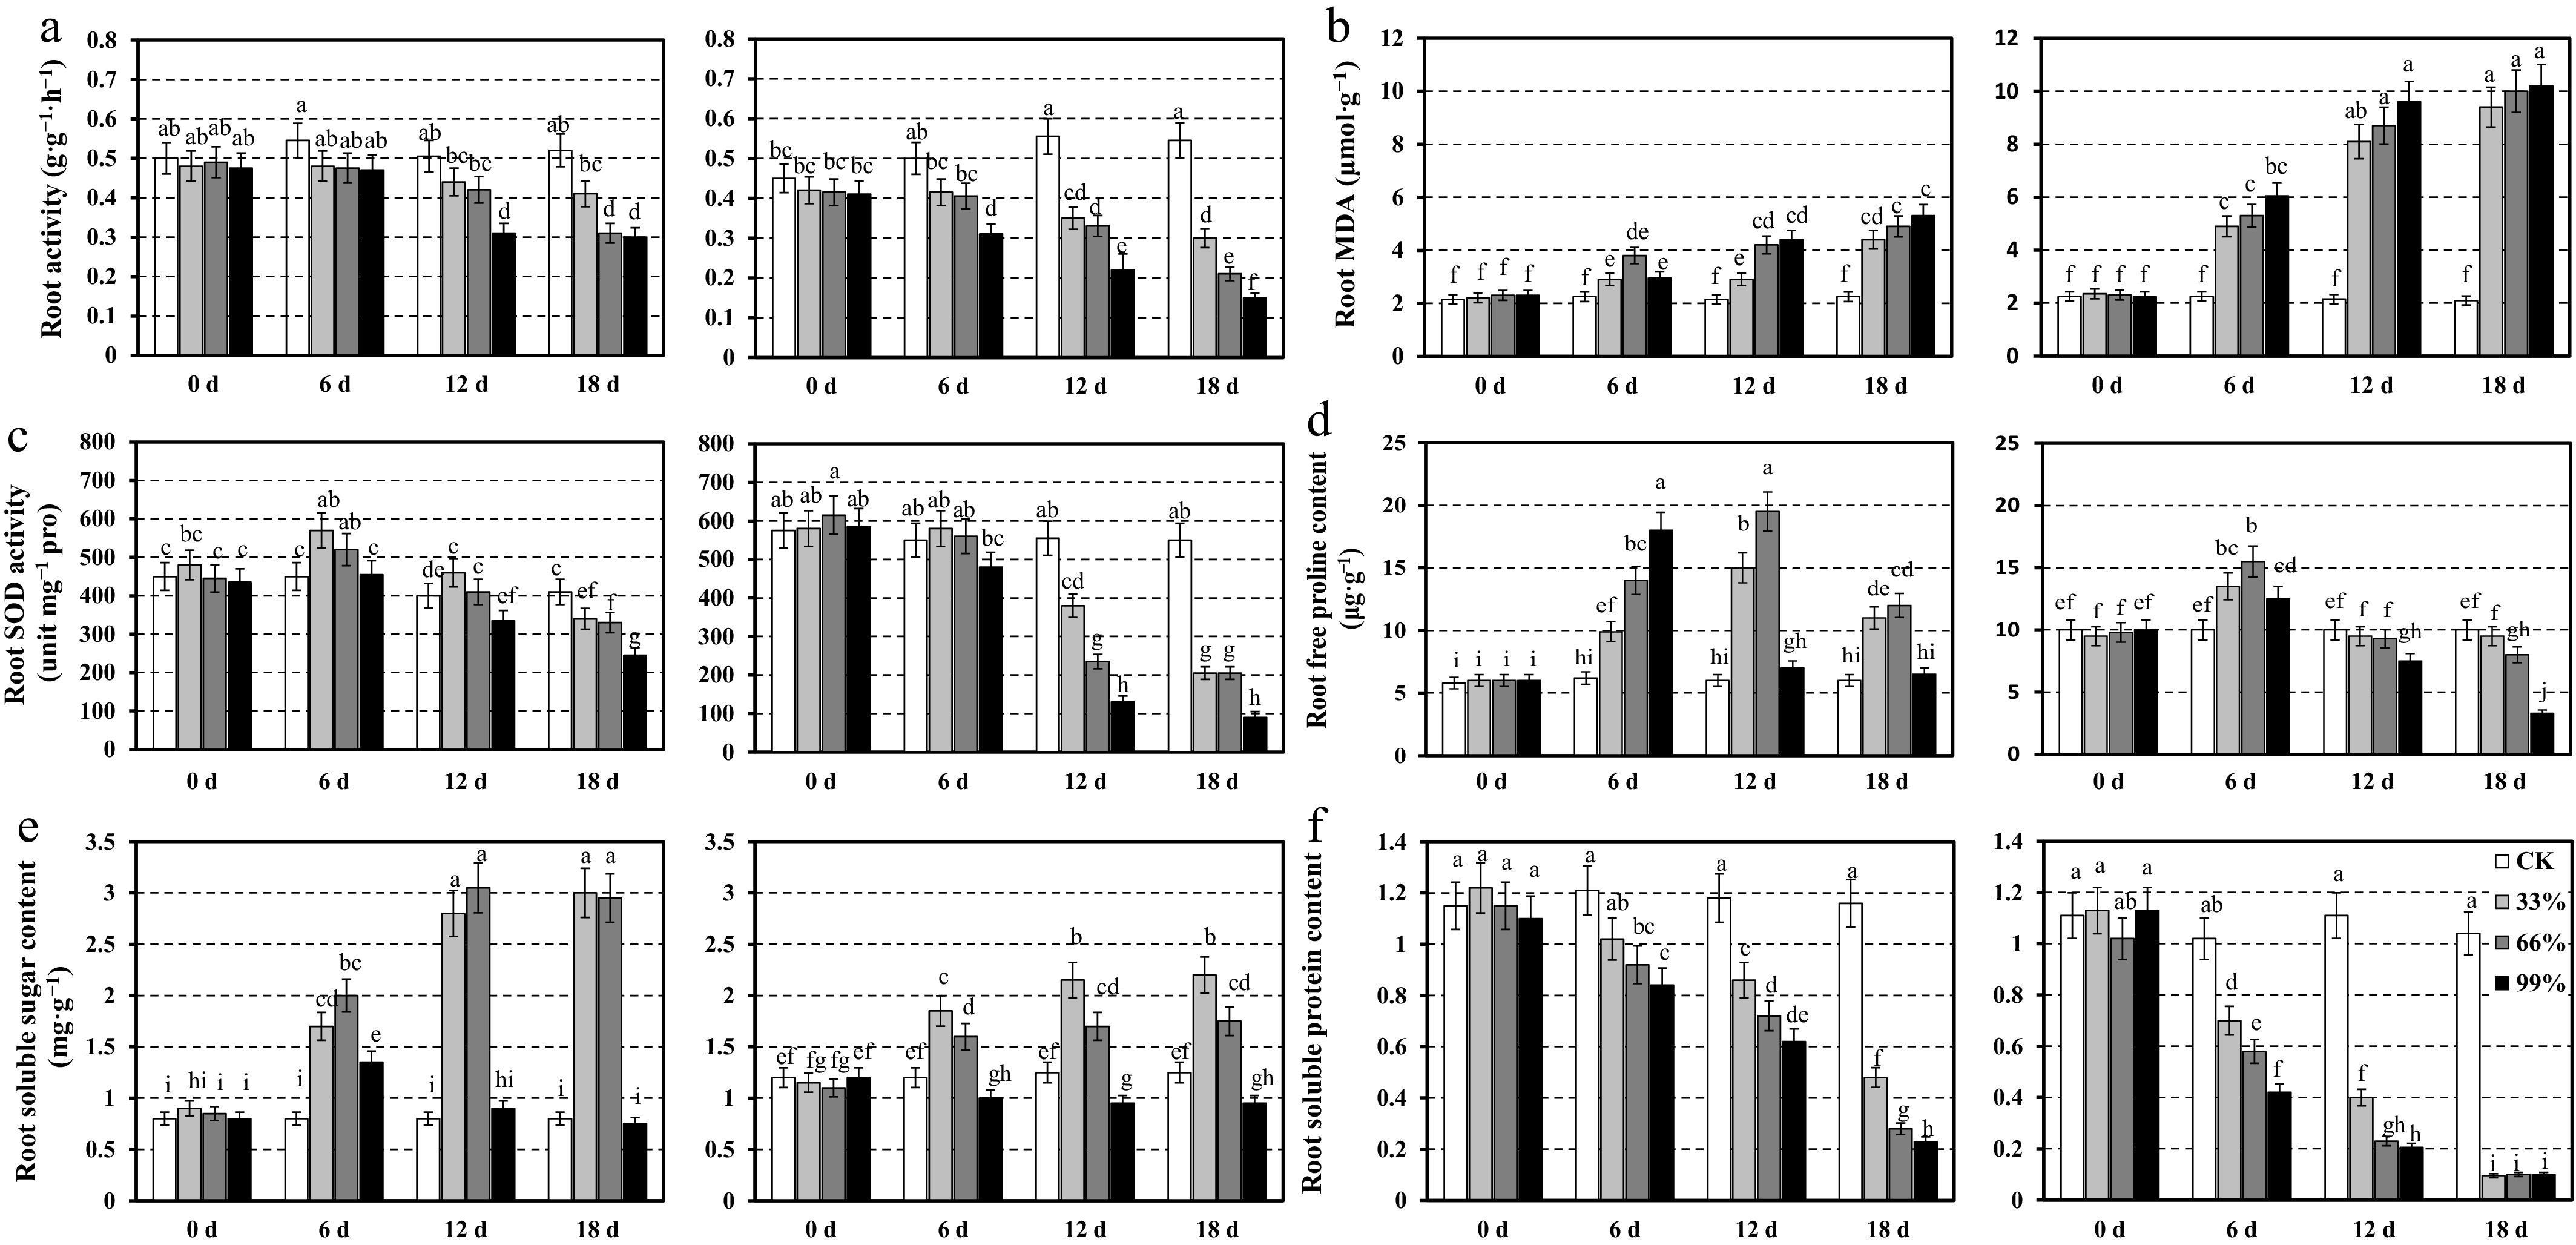
Figure 4.
Root physiological responses of two centipedegrass genotypes, CP11 (left panels) and CP2 (right panels), under different shading levels (CK [control], 33%, 66%, and 99%) over a time course of 0, 6, 12, and 18 d. Data are shown for (a) root activity (g·g−1·h−1), (b) MDA content (μmol·g−1), (c) SOD activity (unit mg−1 proline), (d) free proline content (μg·g−1), (e) soluble sugar content (mg·g−1), and (f) soluble protein content (mg·g−1). Values represent the means ± SE (n = 3). Different letters indicate statistically significant differences (p < 0.05) according to ANOVA followed by post hoc tests.
-
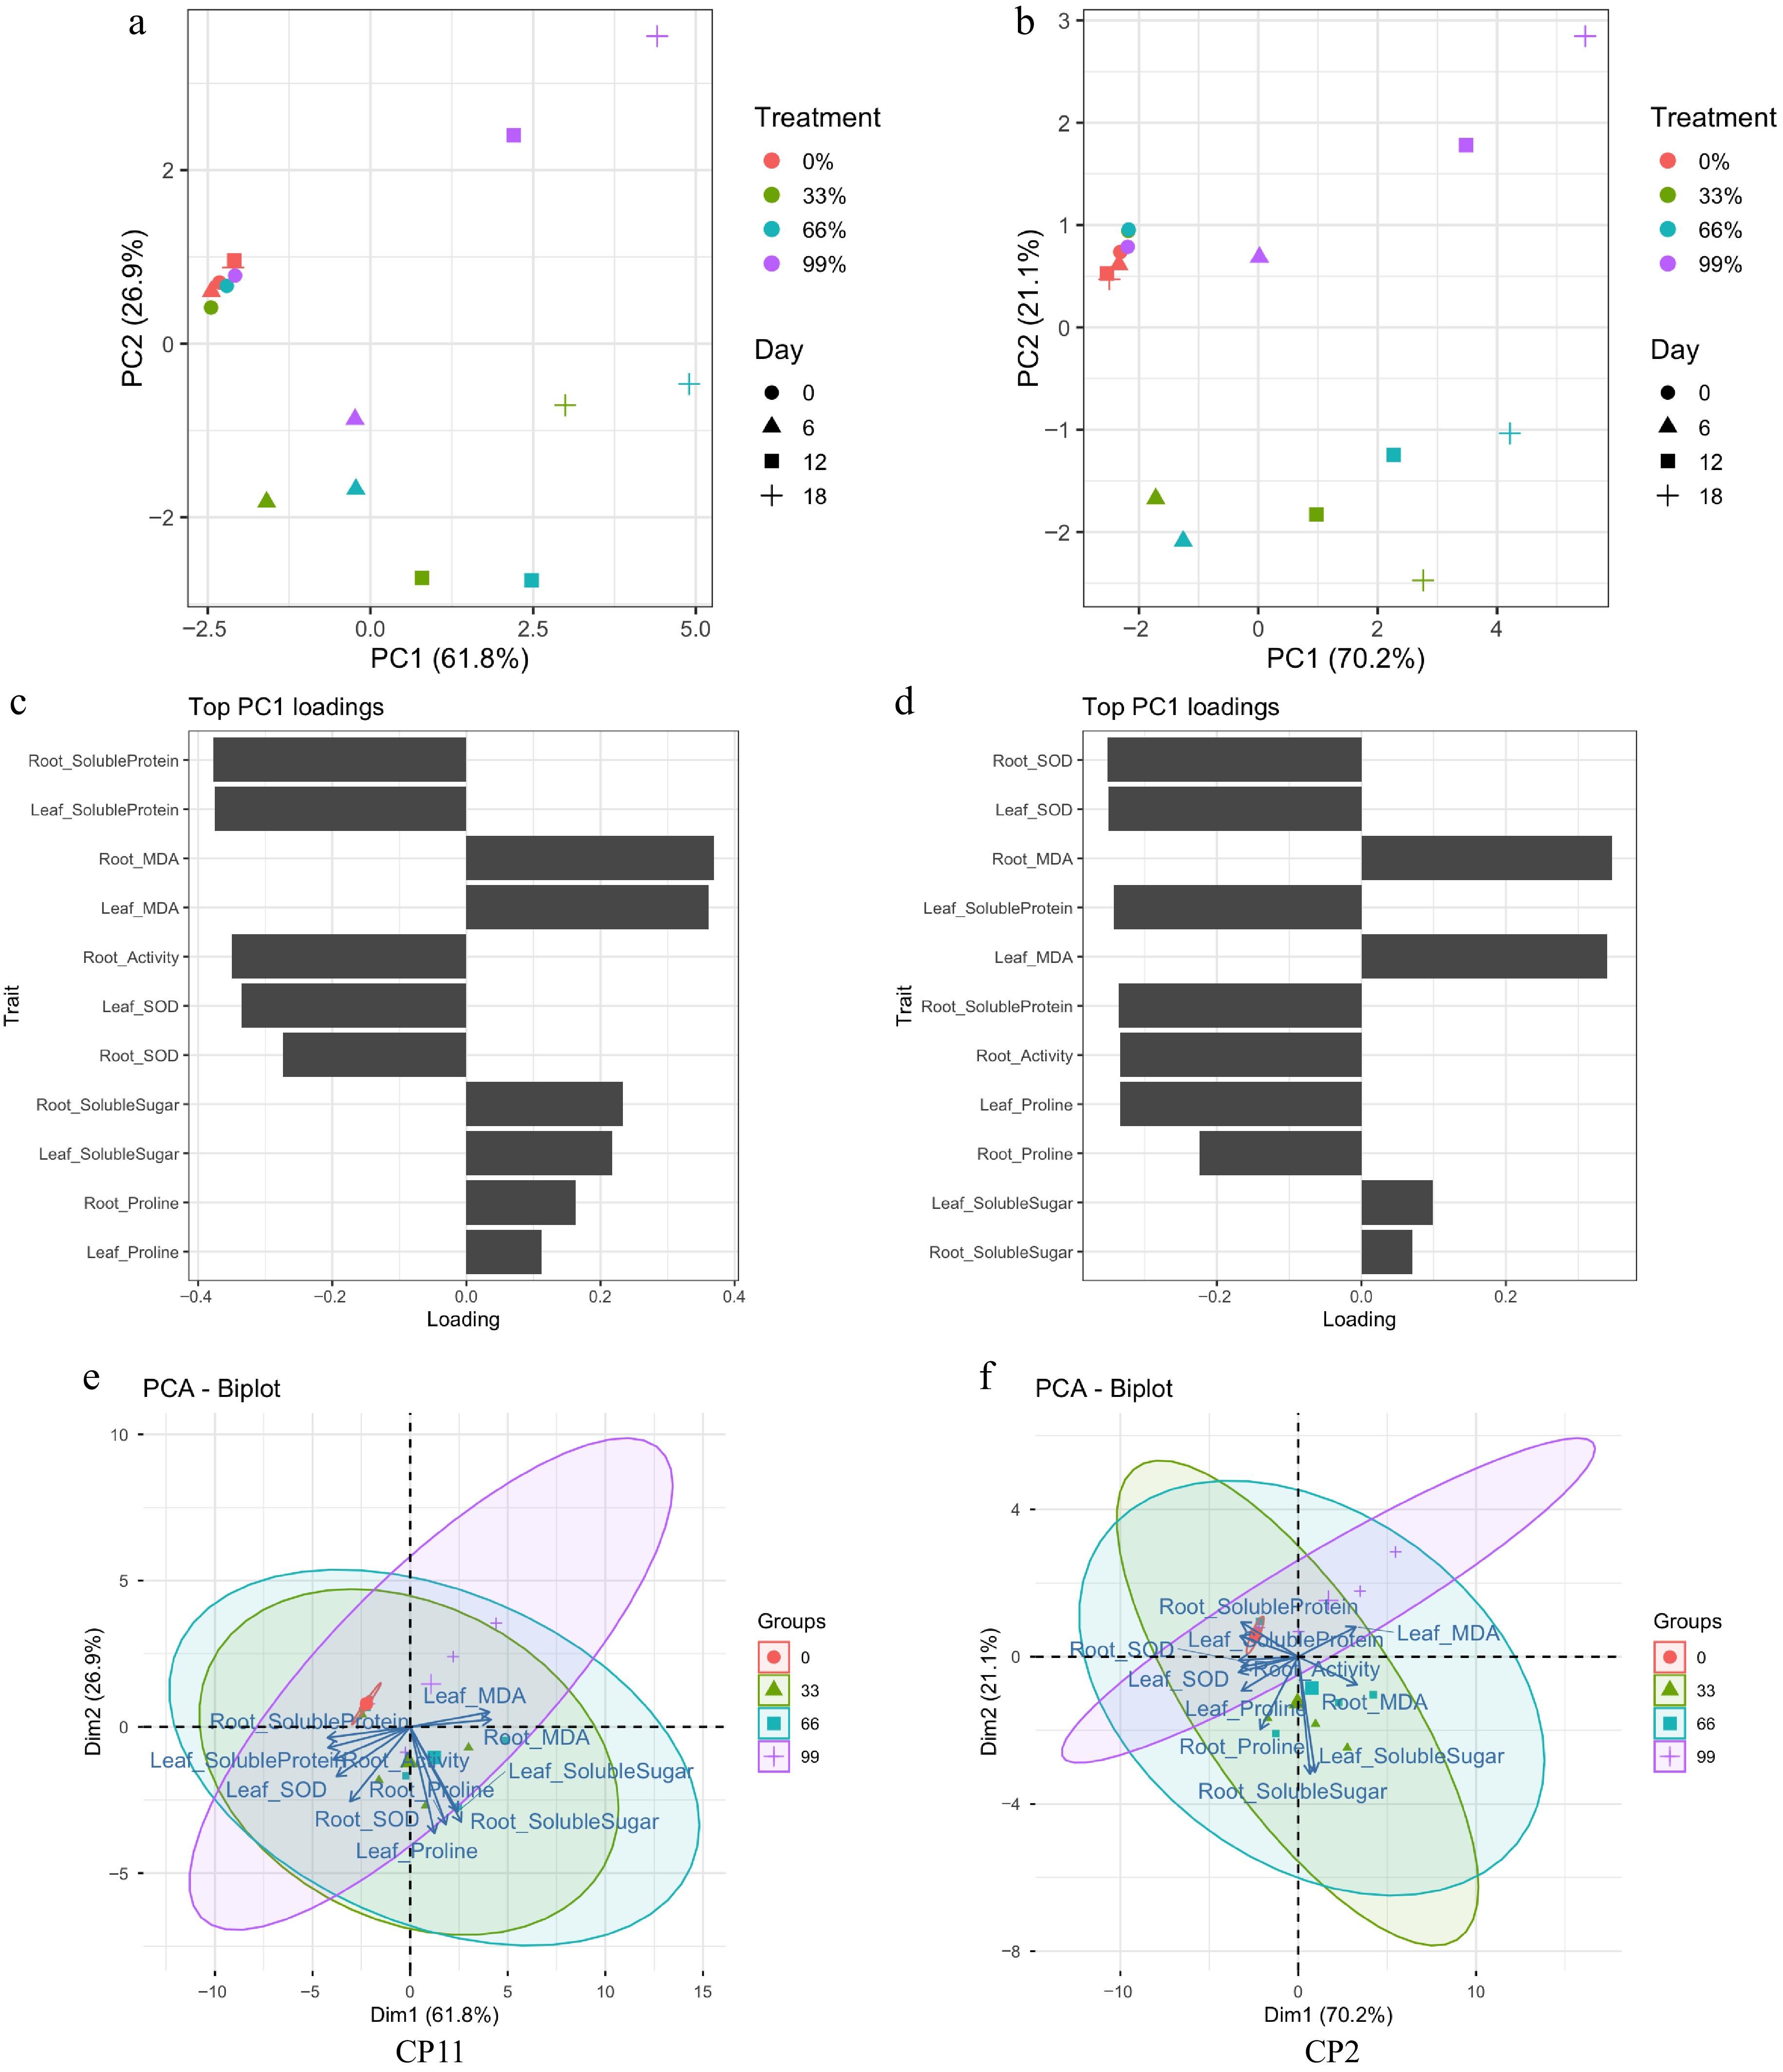
Figure 5.
Principal component analysis (PCA) of physiological traits under shading treatments in CP11 and CP2 genotypes. (a, b) PCA score plots showing the separation of treatments and time points. Treatments (0%, 33%, 66%, and 99% shading) are indicated by colors, wherease the sampling days (0, 6, 12, and 18) are indicated by different shapes. (a) CP11; (b) CP2. (c, d) Contribution of the top 11 traits to PC1. Bars represent loading values, indicating the relative importance of each physiological trait to the variation explained by PC1. (c) CP11; (d) CP2. (e, f) PCA biplots visualizing the relationships among treatments, days, and traits. Arrows represent trait loadings, and ellipses indicate 95% confidence intervals around the treatment groups. (e) CP11; (f) CP2.
-
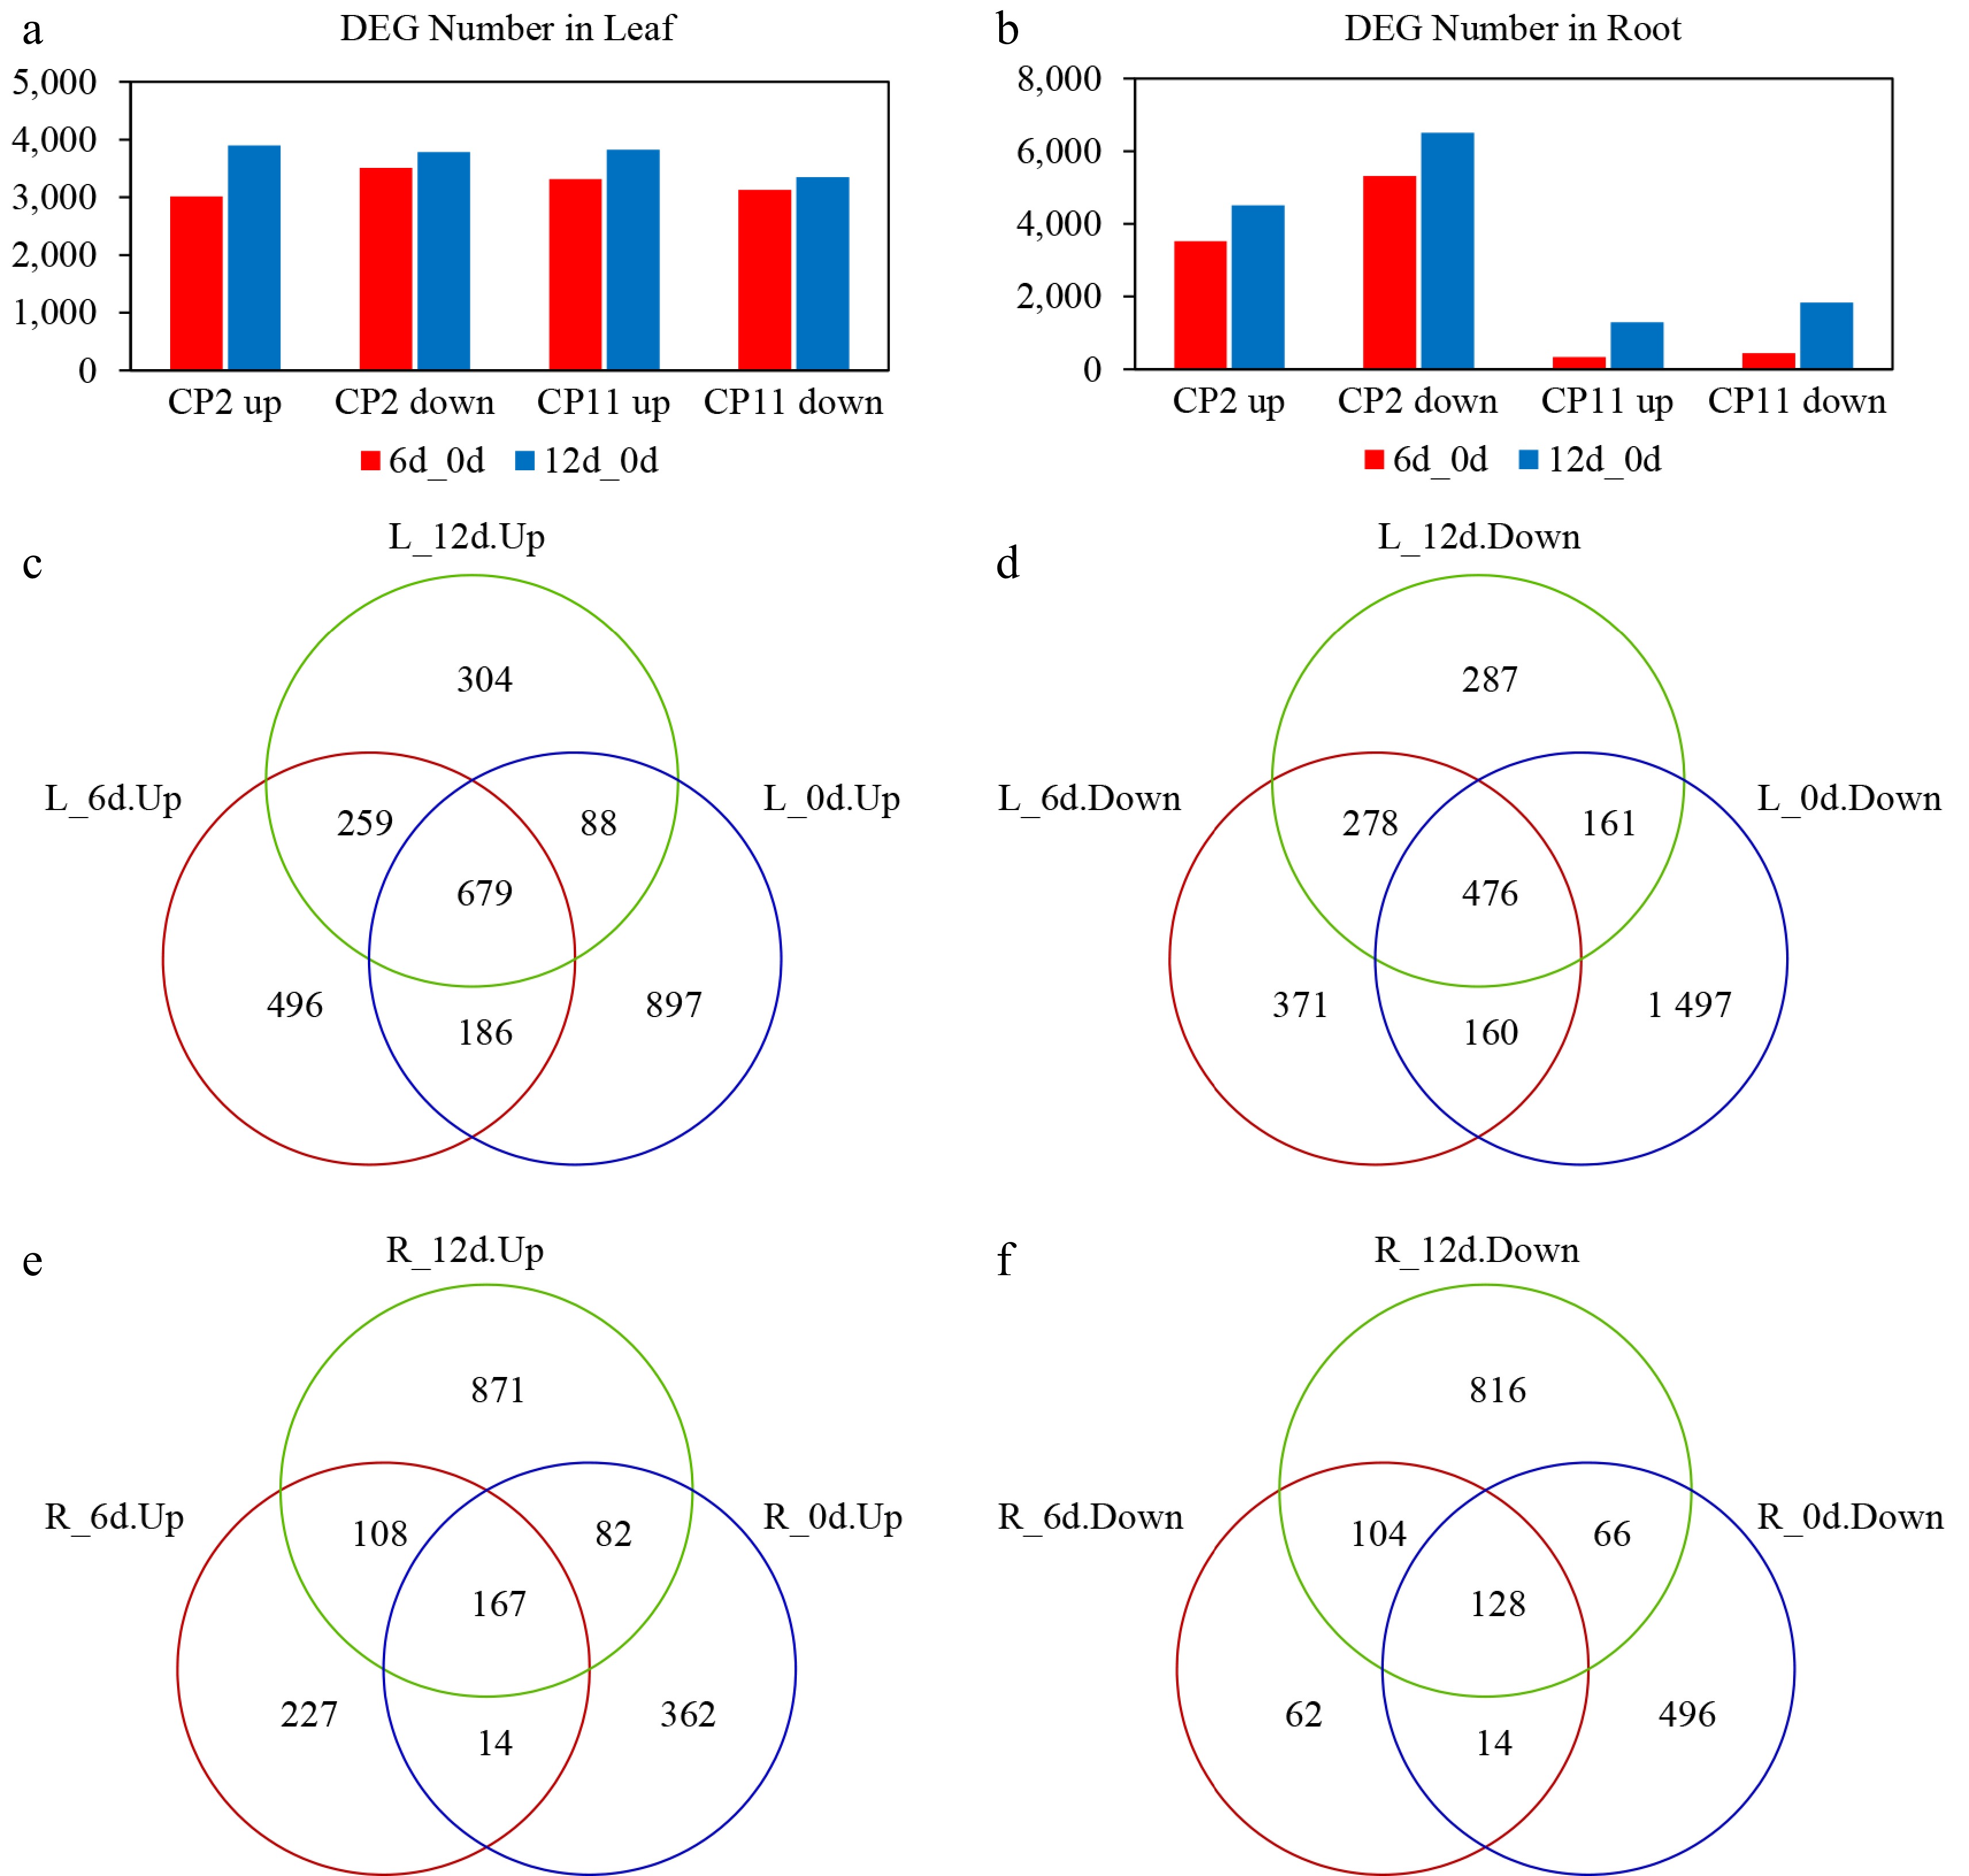
Figure 6.
Transcriptional changes in the genes of the roots and leaves of two centipedegrass genotypes, CP2 and CP11, under the 99% shading treatment. (a, b) Number of DEGs in the leaves (a) and roots (b) identified from pairwise comparisons: CP2 on Day 6 vs Day 0, CP2 on Day 12 vs Day 0, CP11 on Day 6 vs Day 0, and CP11 on Day 12 vs Day 0. (c–f) Identification of consistently up- and downregulated DEGs between CP11 and CP2 genotypes in the roots and leaves under 99% shading stress. Up- and down-regulated DEGs were analyzed separately. (c) Consistently upregulated DEGs in the leaves were identified by overlapping genes upregulated in the comparisons of CP11 on Day 6 vs CP2 on Day 6 and CP11 on Day 12 vs CP2 on Day 12, excluding those already upregulated on Day 0 (CP11 vs CP2). (d) Downregulated DEGs in the leaves were identified by intersecting genes downregulated on both Day 6 and Day 12, after removing those already downregulated on Day 0. (e) and (f) represent the consistently (e) upregulated and (f) downregulated DEGs in the roots, identified using the same strategy based on pairwise comparisons of CP11 and CP2 transcriptomes under shading conditions.
-
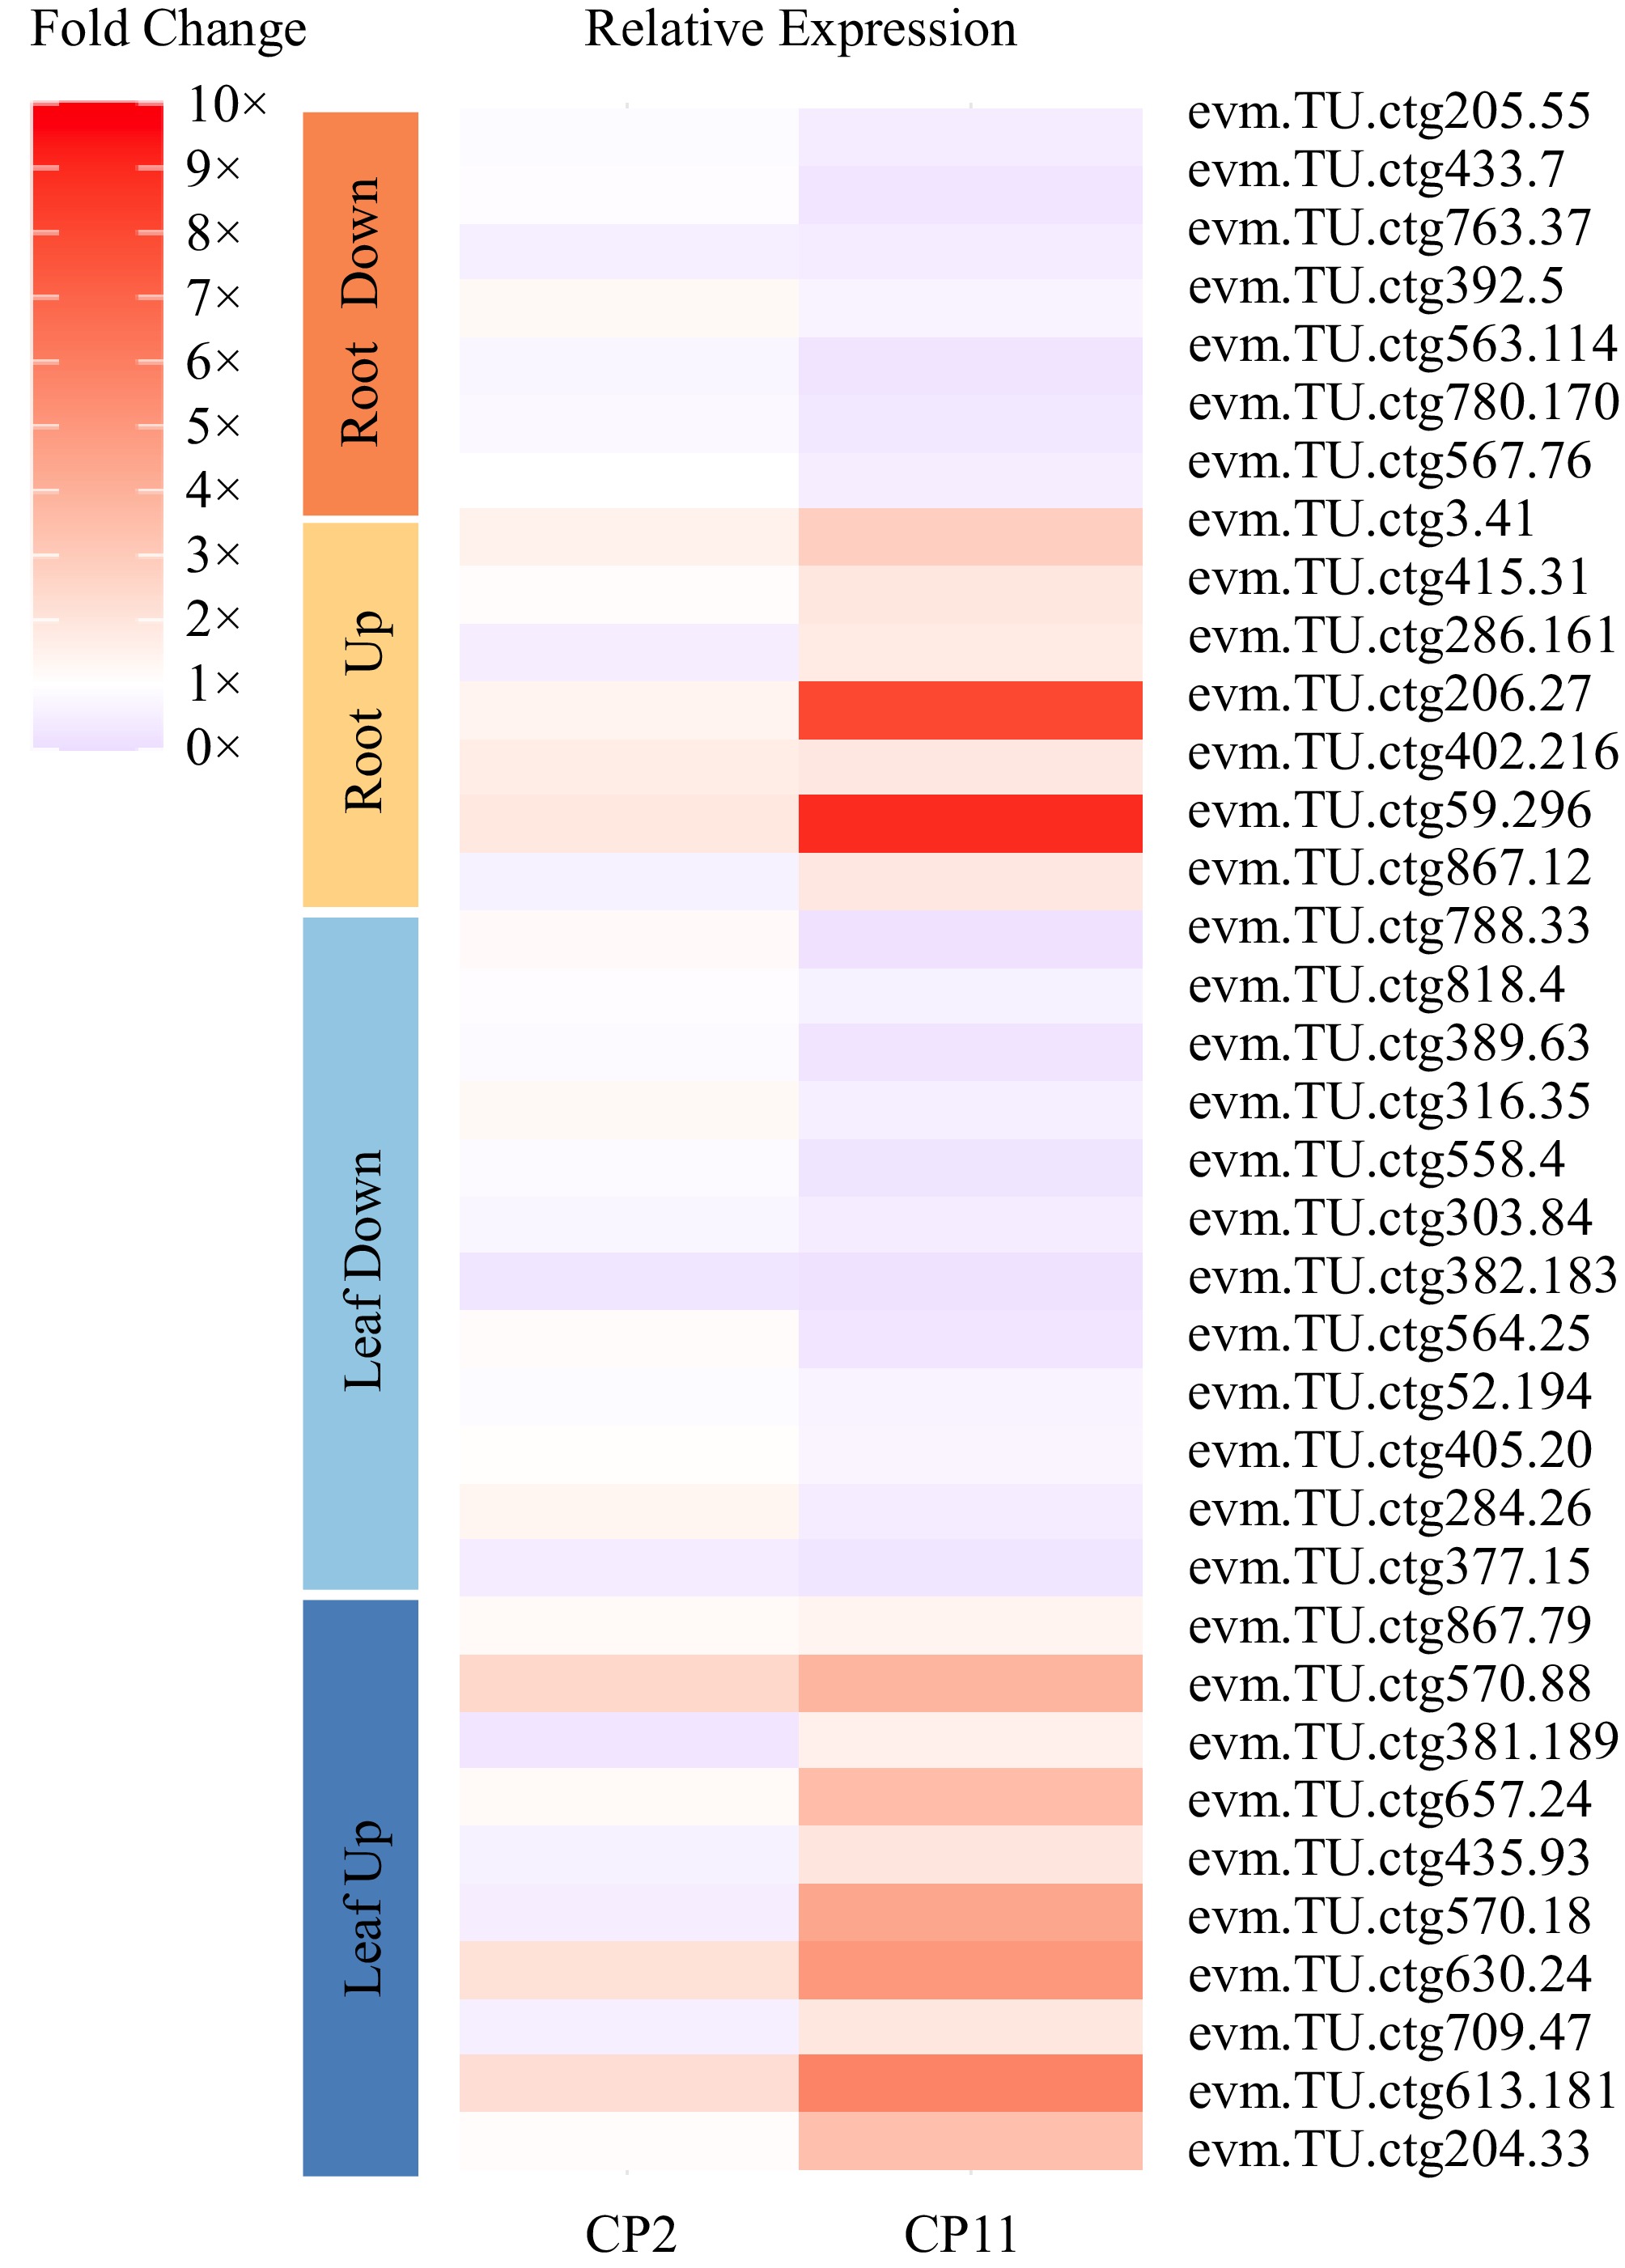
Figure 7.
Heatmap illustrating qRT-PCR validation of DEGs in leves and roots of CP2 and CP11 under 99% shading conditions. The analysis includes 10 upregulated genes in the leaves (dark blue), 10 upregulated genes in the leaves (light blue), 12 downregulated genes in the leaves (yellow), 7 upregulated genes in the roots, and 7 downregulated genes in the roots (orange), selected on the basis of consistent differential expression in the RNA-seq data for CP11 vs CP2 under 6-d and 12-d 99% shading treatments. Fold change values were calculated using the 2−ΔCᴛ method relative to the Actin gene, with three replicates.
-
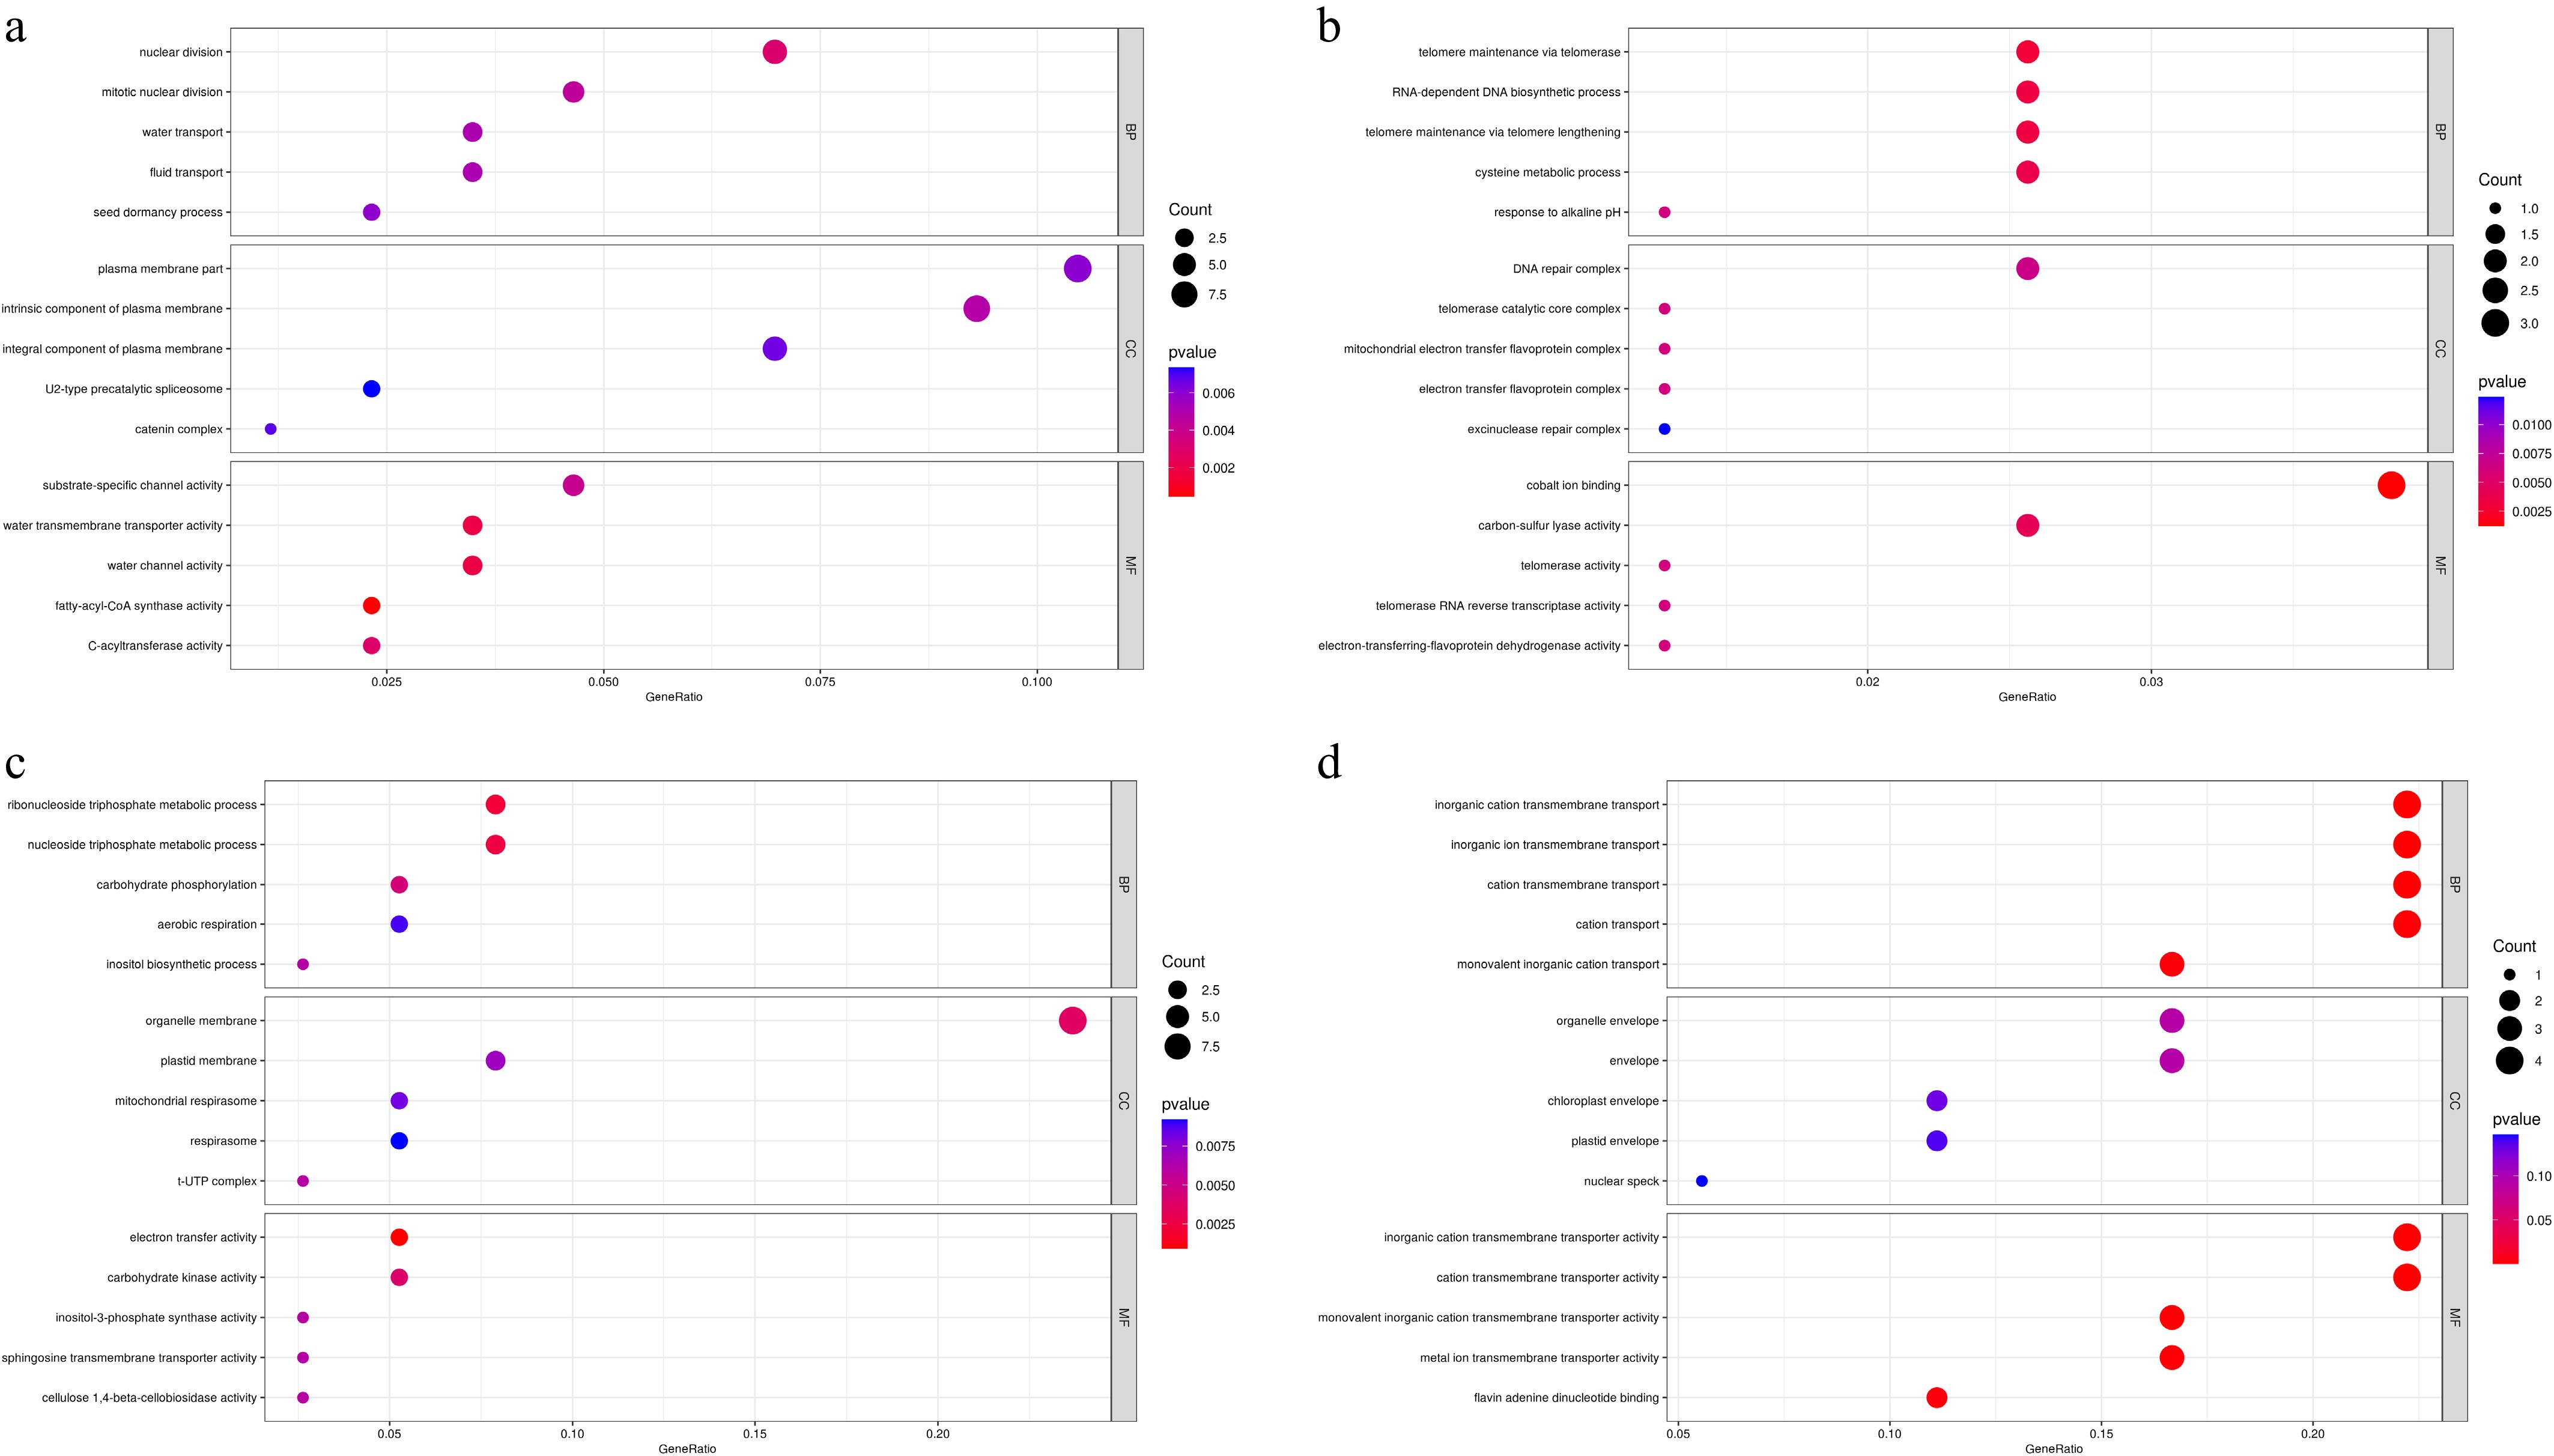
Figure 8.
Gene Ontology enrichment analysis of DEGs between CP11 and CP2 genotypes under 99% shading stress. GO analysis was performed for the sets of DEGs identified in Fig. 6c–f. (a) Significantly enriched GO terms for upregulated DEGs in the leaves (corresponding to Fig. 6c). (b) Significantly enriched GO terms for downregulated DEGs in the leaves (corresponding to Fig. 6d). (c) Significantly enriched GO terms for upregulated DEGs in the roots (corresponding to Fig. 6e). (d) Significantly enriched GO terms for downregulated DEGs in the roots (corresponding to Fig. 6f). GO terms are categorized as biological process (BP), molecular function (MF), and cellular component (CC) and are shown with their significance levels (e.g., –log10p-value or adjusted p-value).
-
Serial number Sampling location Longitude (E) Latitude (N) Altitude (m) CP1 Fangchenggang City, Guangxi 108.28° 21.50° 0 CP2 Jiangcheng District, Yangjiang City, Guangdong Province 111.58° 21.38° 0 CP3 Xiajiang County, Jiangxi Province 115.19° 27.34° 50.6 CP4 Boluo County, Huizhou City, Guangdong Province 114.28° 23.18° 26.2 CP5 Hepu County, Beihai City, Guangxi 109.44° 21.29° 35 CP6 Tieshangang District, Beihai City, Guangxi 109.31° 21.38° 10 CP7 Dongxing City, Fangchenggang City, Guangxi 108.90° 21.31° 0 CP8 Changsha City, Hunan Province 113.08° 28.26° 53.6 CP9 Provided by Jiangsu Academy of Agricultural Sciences − − − CP10 Yifeng County, Pingxiang City, Jiangxi Province 114.14° 27.35° 589 CP11 Wuyishan City, Nanping City, Fujian Province 117.58° 27.37° 197.2 CP12 Jiangning District, Jiangsu Province 119.04° 32.03° 73 CP13 Provided by Jiangsu Academy of Agricultural Sciences − − − CP14 Xinfeng County, Ganzhou City, Jiangxi Province 114.55° 25.07° 170.4 CP15 Hepu County, Beihai City, Guangxi 109.12° 21.39° 53.9 CP16 Nanchang City, Jiangxi Province 115.51° 28.50° 35.3 Table 1.
Sources of tested centipedegrass ecotypes and their geographical information.
Figures
(8)
Tables
(1)