-
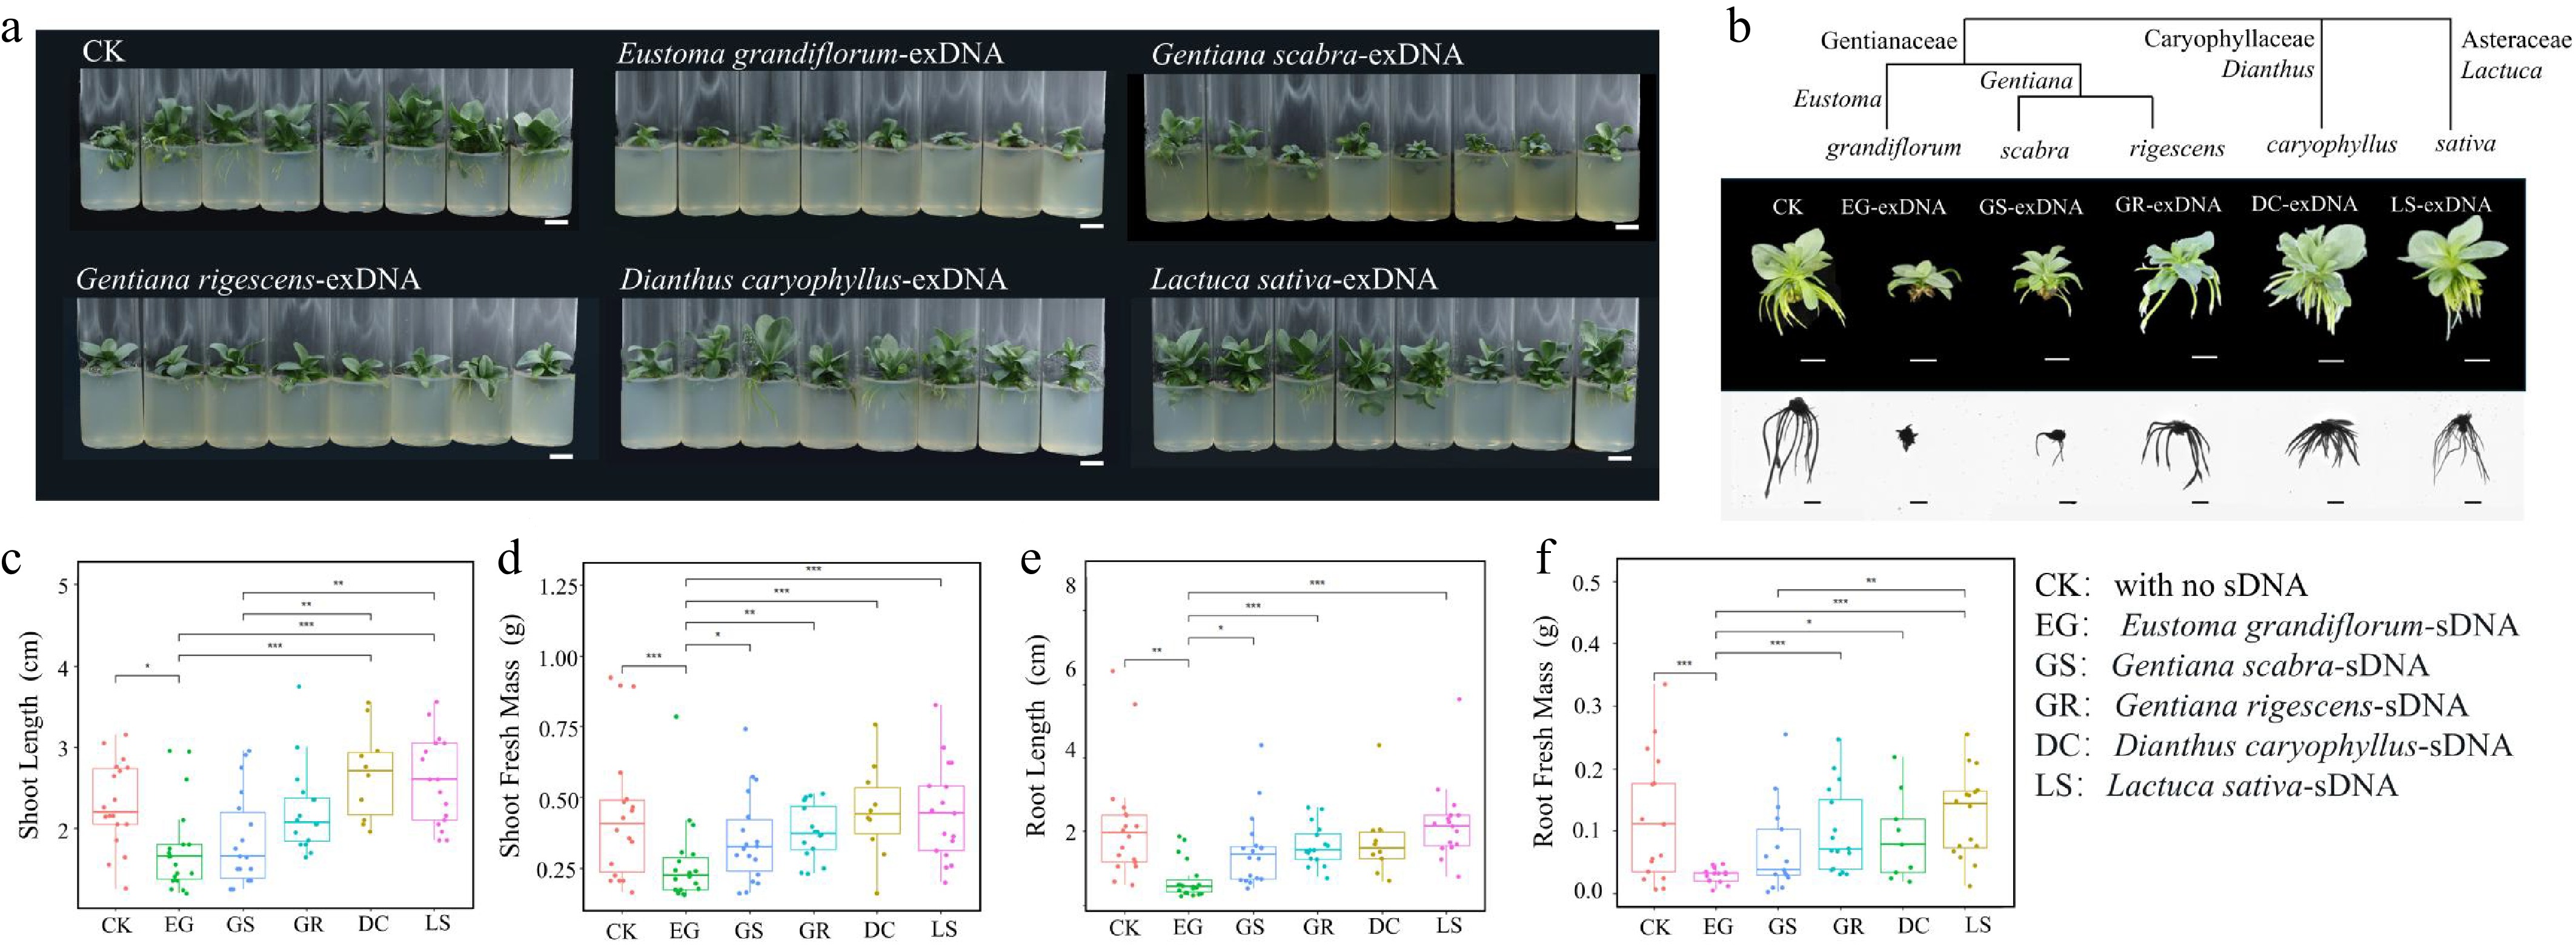
Figure 1.
Examination of species-specific inhibition of extracellular fragmented DNA (exDNA) in lisianthus plants. (a) Overall growth of lisianthus plants after 3 week exposure with 200 μg/mL exDNA from different species: Control with no exDNA addition (CK), Eustoma grandiflorum (EG), Gentiana scabra (GS), Gentiana rigescens (GR), Dianthus caryophyllus (DC), and Lactuca sativa (LS). (b)Phenotypic differences of individual plants from six groups along with the species phylogenetic relatedness. And morphological comparisons (mean ± SE, n = 12) in above- and below-ground traits among the six groups. (c) Shoot length. (d) Shoot fresh mass. (e) Root length. (f) Root fresh mass. Different symbols above the error bars indicated significant differences among the six groups based on Tukey multiple comparison test (n = 10, p < 0.05). * Indicated p-value < 0.05, ** indicated p-value < 0.01, *** indicated p-value < 0.001.
-
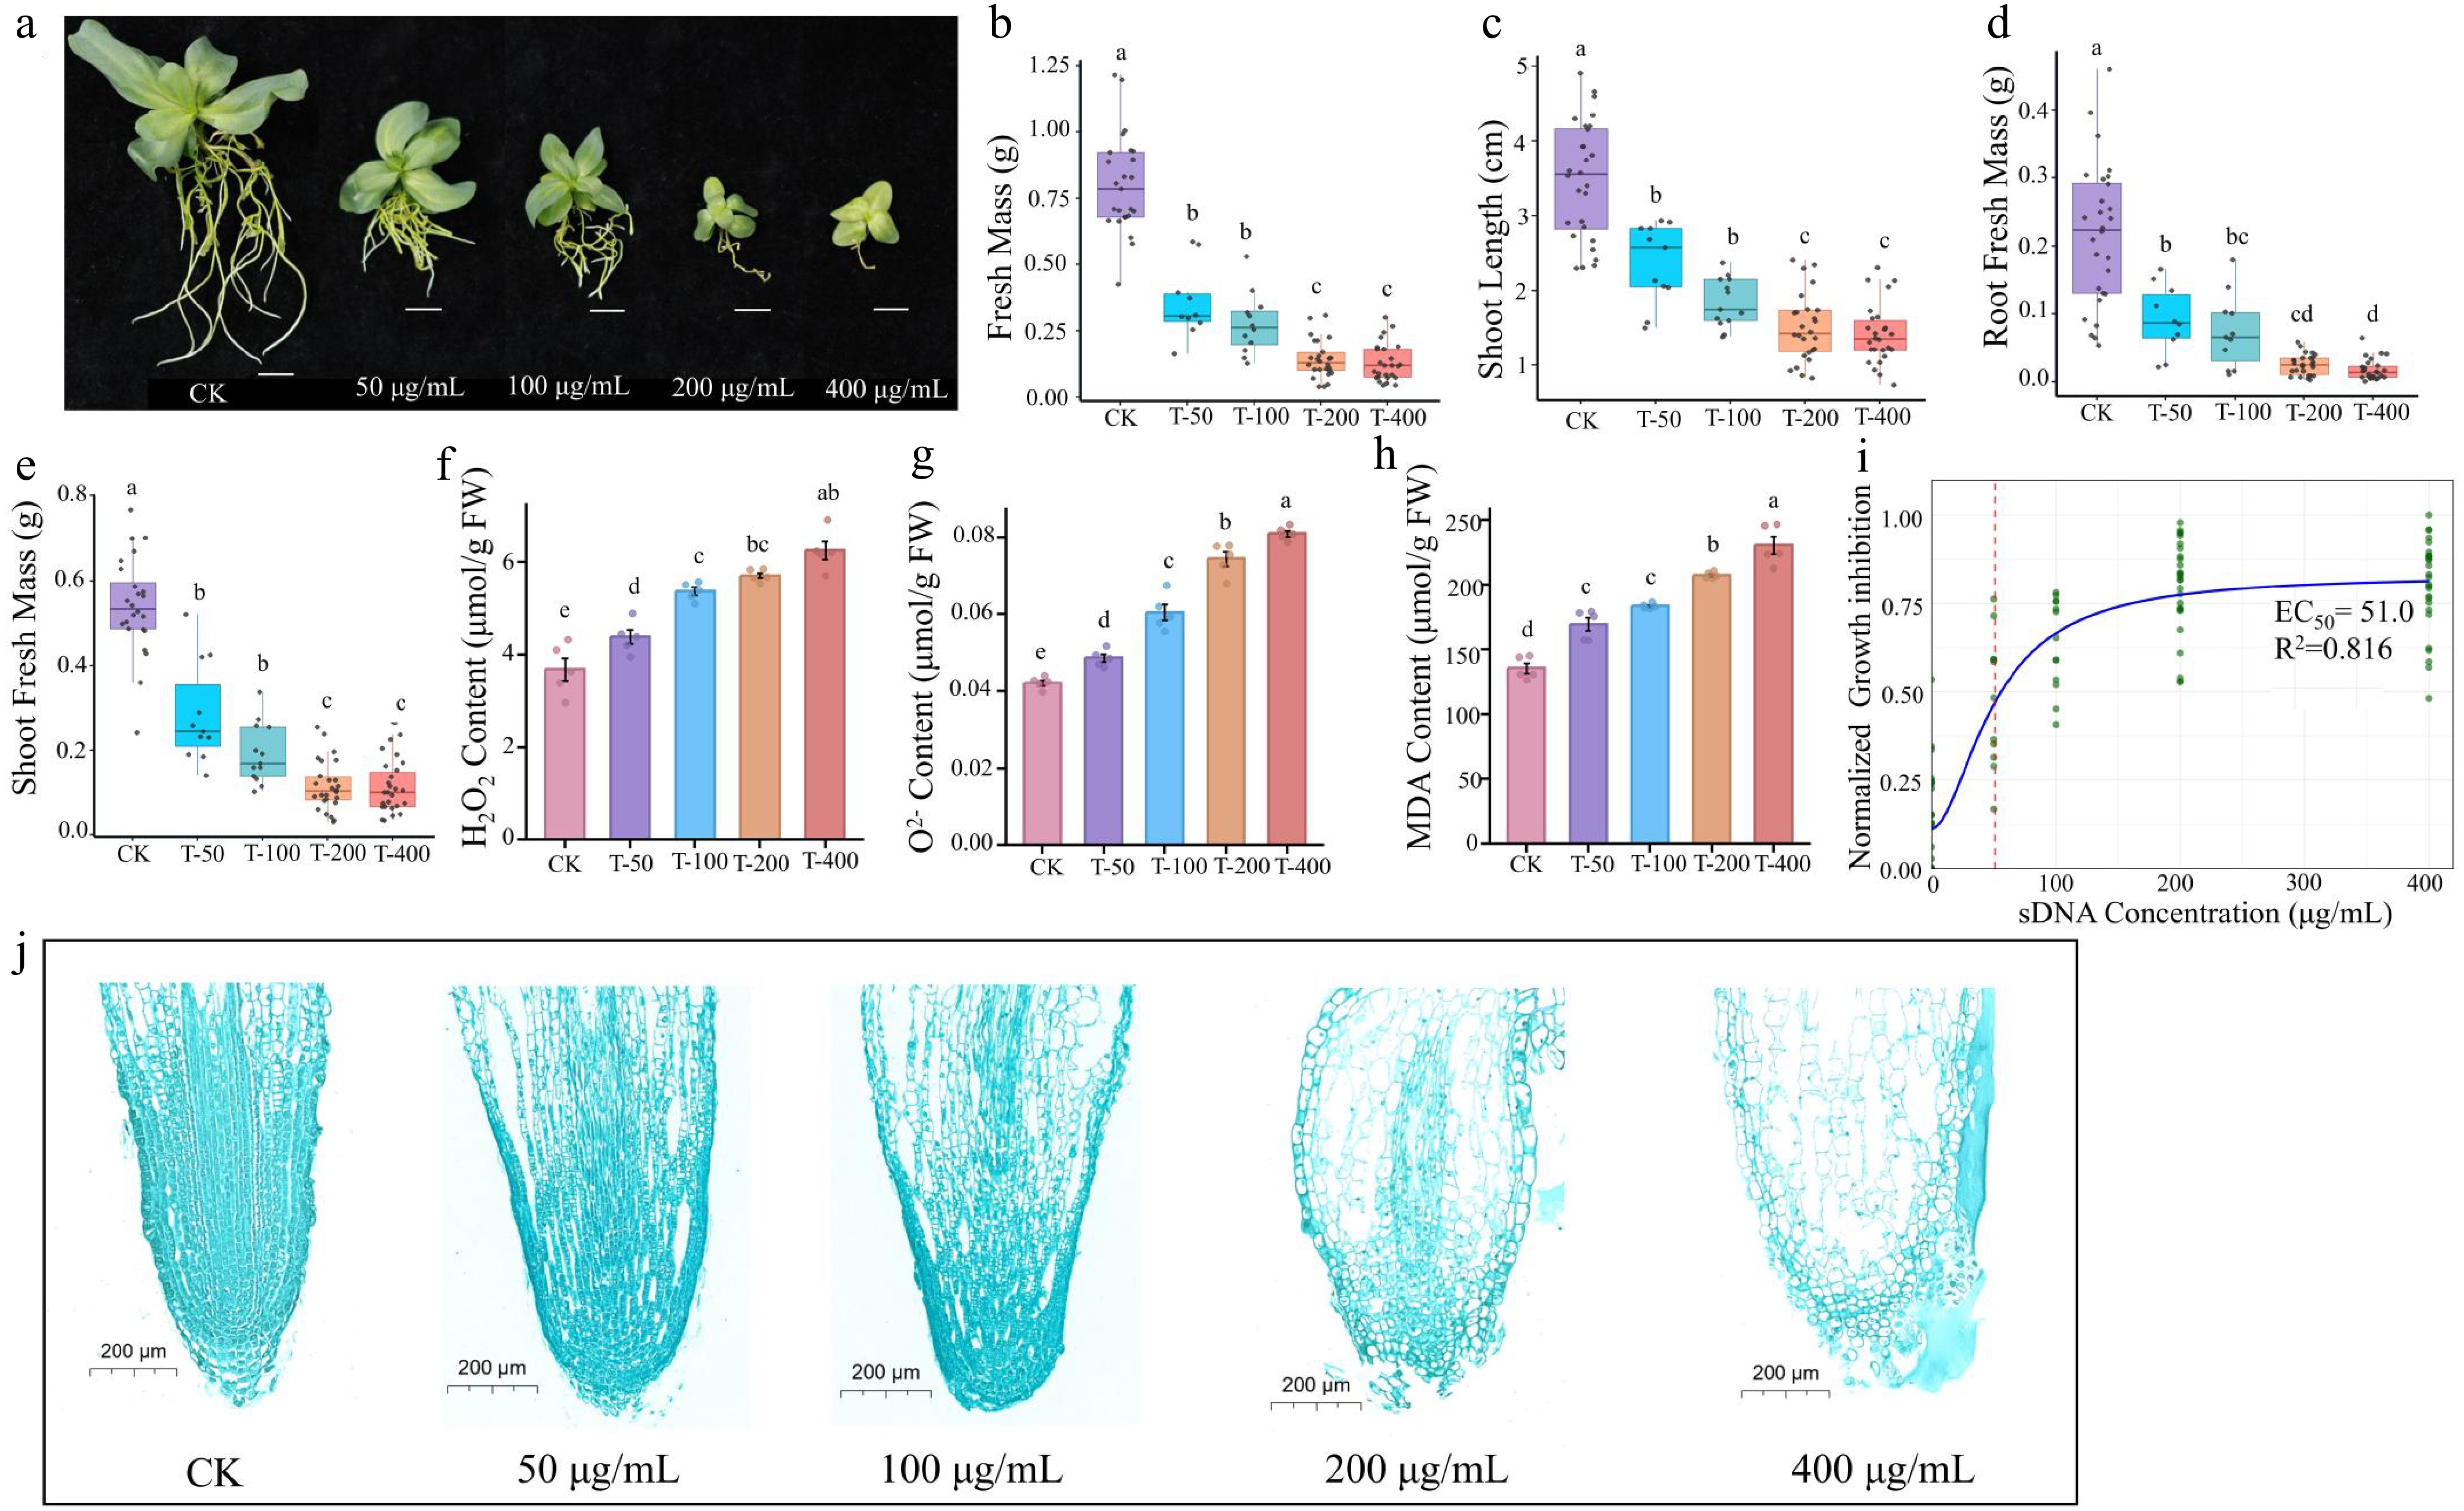
Figure 2.
Ecotoxicity effect of sDNA ranging from 0, 50,100 to 200 and 400 μg/mL on lisianthus. (a) Phenotypic images of seedlings under different sDNA treatments. From left to right: CK, T-50, T-100, T-200, T-400 treatment groups (scale bar = 1 cm). The growth inhibition and physiological responses with increasing concentration included (b) shoot length, (c) shoot fresh biomass, (d) root fresh biomass, (e) total fresh mass, (f) hydrogen peroxide (H2O2) content, (g) superoxide anion (O2−) concentration, and (h) malondialdehyde (MDA) accumulation. Different lowercase letters (a, b, c, d) above bars indicate significant differences among treatment groups (n = 10, p < 0.05, one-way ANOVA followed by Duncan's multiple range test). 'CK' represents the control group without sDNA treatment; 'T-50', 'T-100', 'T-200', and 'T-400' denote treatment groups with final sDNA concentrations of 50, 100, 200, and 400 μg/mL, respectively. (i) Dose-response curve of sDNA on growth inhibition. The y-axis indicates the normalized growth inhibition (0–1 range, processed using min-max normalization with negative values set to 0). Green dots represent normalized experimental data points, and the blue solid line denotes the fitted curve. The red dashed line marks the EC50 position (51.0 µg/mL). Microstructure of root tip stained with safranin and fast green (scale bar = 200 μm) from different exposure concentrations were shown in (j).
-
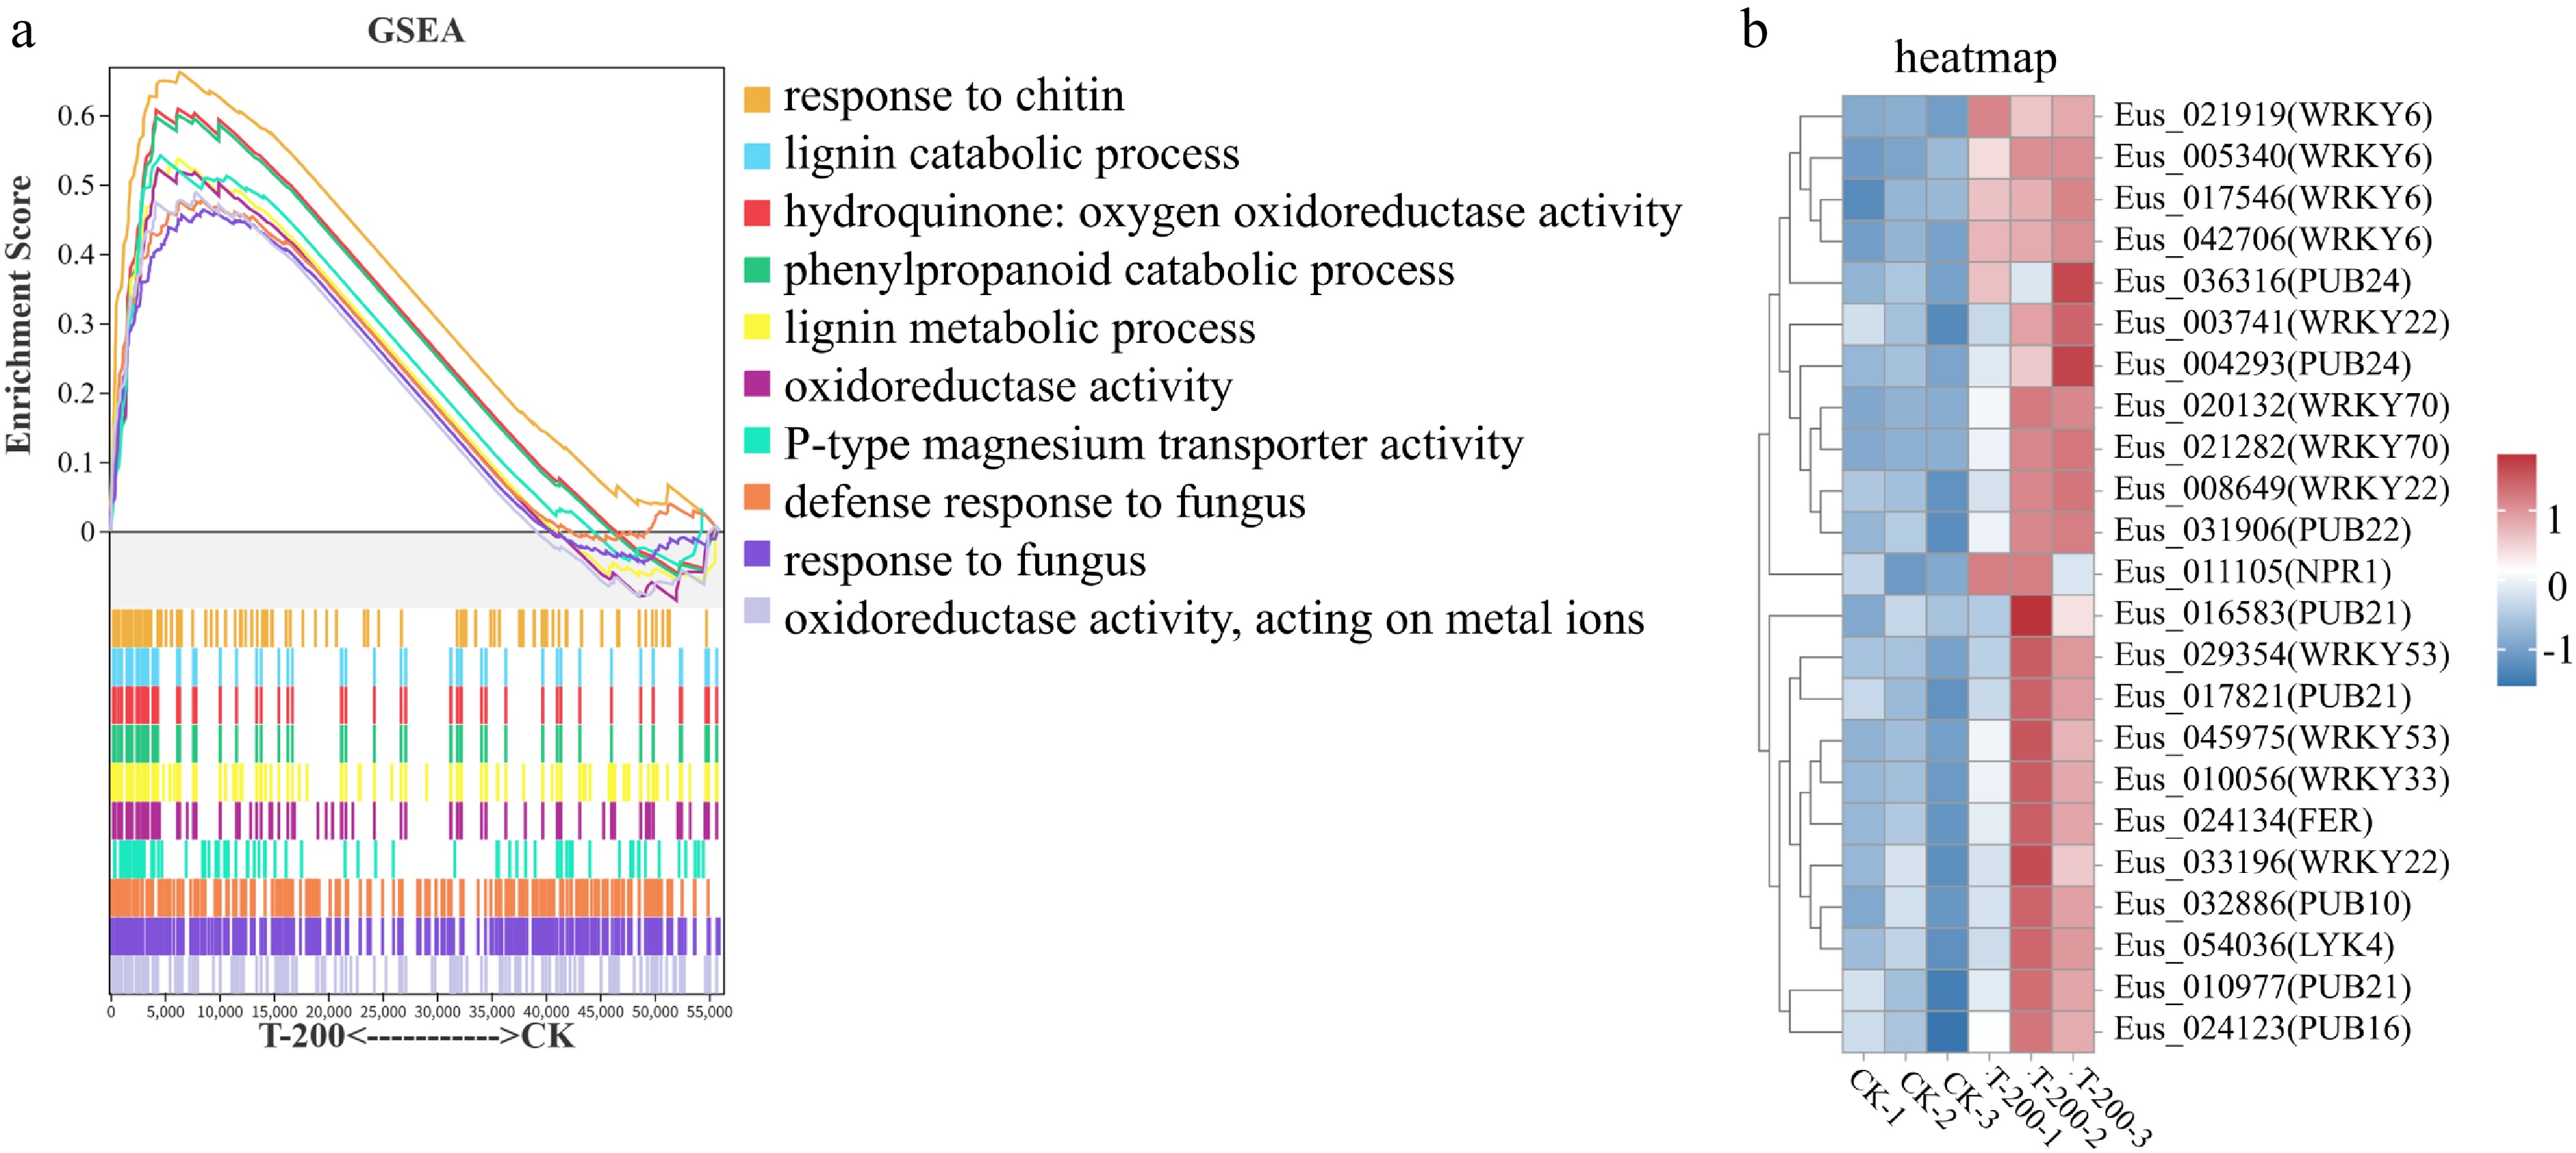
Figure 3.
Gene Set Enrichment Analysis (GSEA) and expression analysis of defense-related genes in response to sDNA treatment. (a) GSEA plot of significantly enriched up-regulated gene sets in the T-200 treatment group compared to the control group. Significantly enriched gene sets were identified with the criteria: |Normalized Enrichment Score (NES)| > 1, number of genes in the set > 50, nominal p-value < 0.05, and FDR < 0.25. The top ten significantly enriched gene sets are shown. The upper part of the plot shows the enrichment score profile for each gene set (y-axis: Enrichment Score, 0−0.6; x-axis: rank in ordered gene list). The lower part presents a heatmap indicating the position of each member gene within the ranked list. Curve colors correspond to the listed gene set names. (b) Heatmap of the expression patterns for key defense-related genes identified from the enriched GSEA pathways. The expression levels of selected WRKY transcription factors and PUB E3 ubiquitin ligase genes are shown, highlighting their concerted upregulation under sDNA treatment, which underpins the activated immune response observed in the GSEA.
-
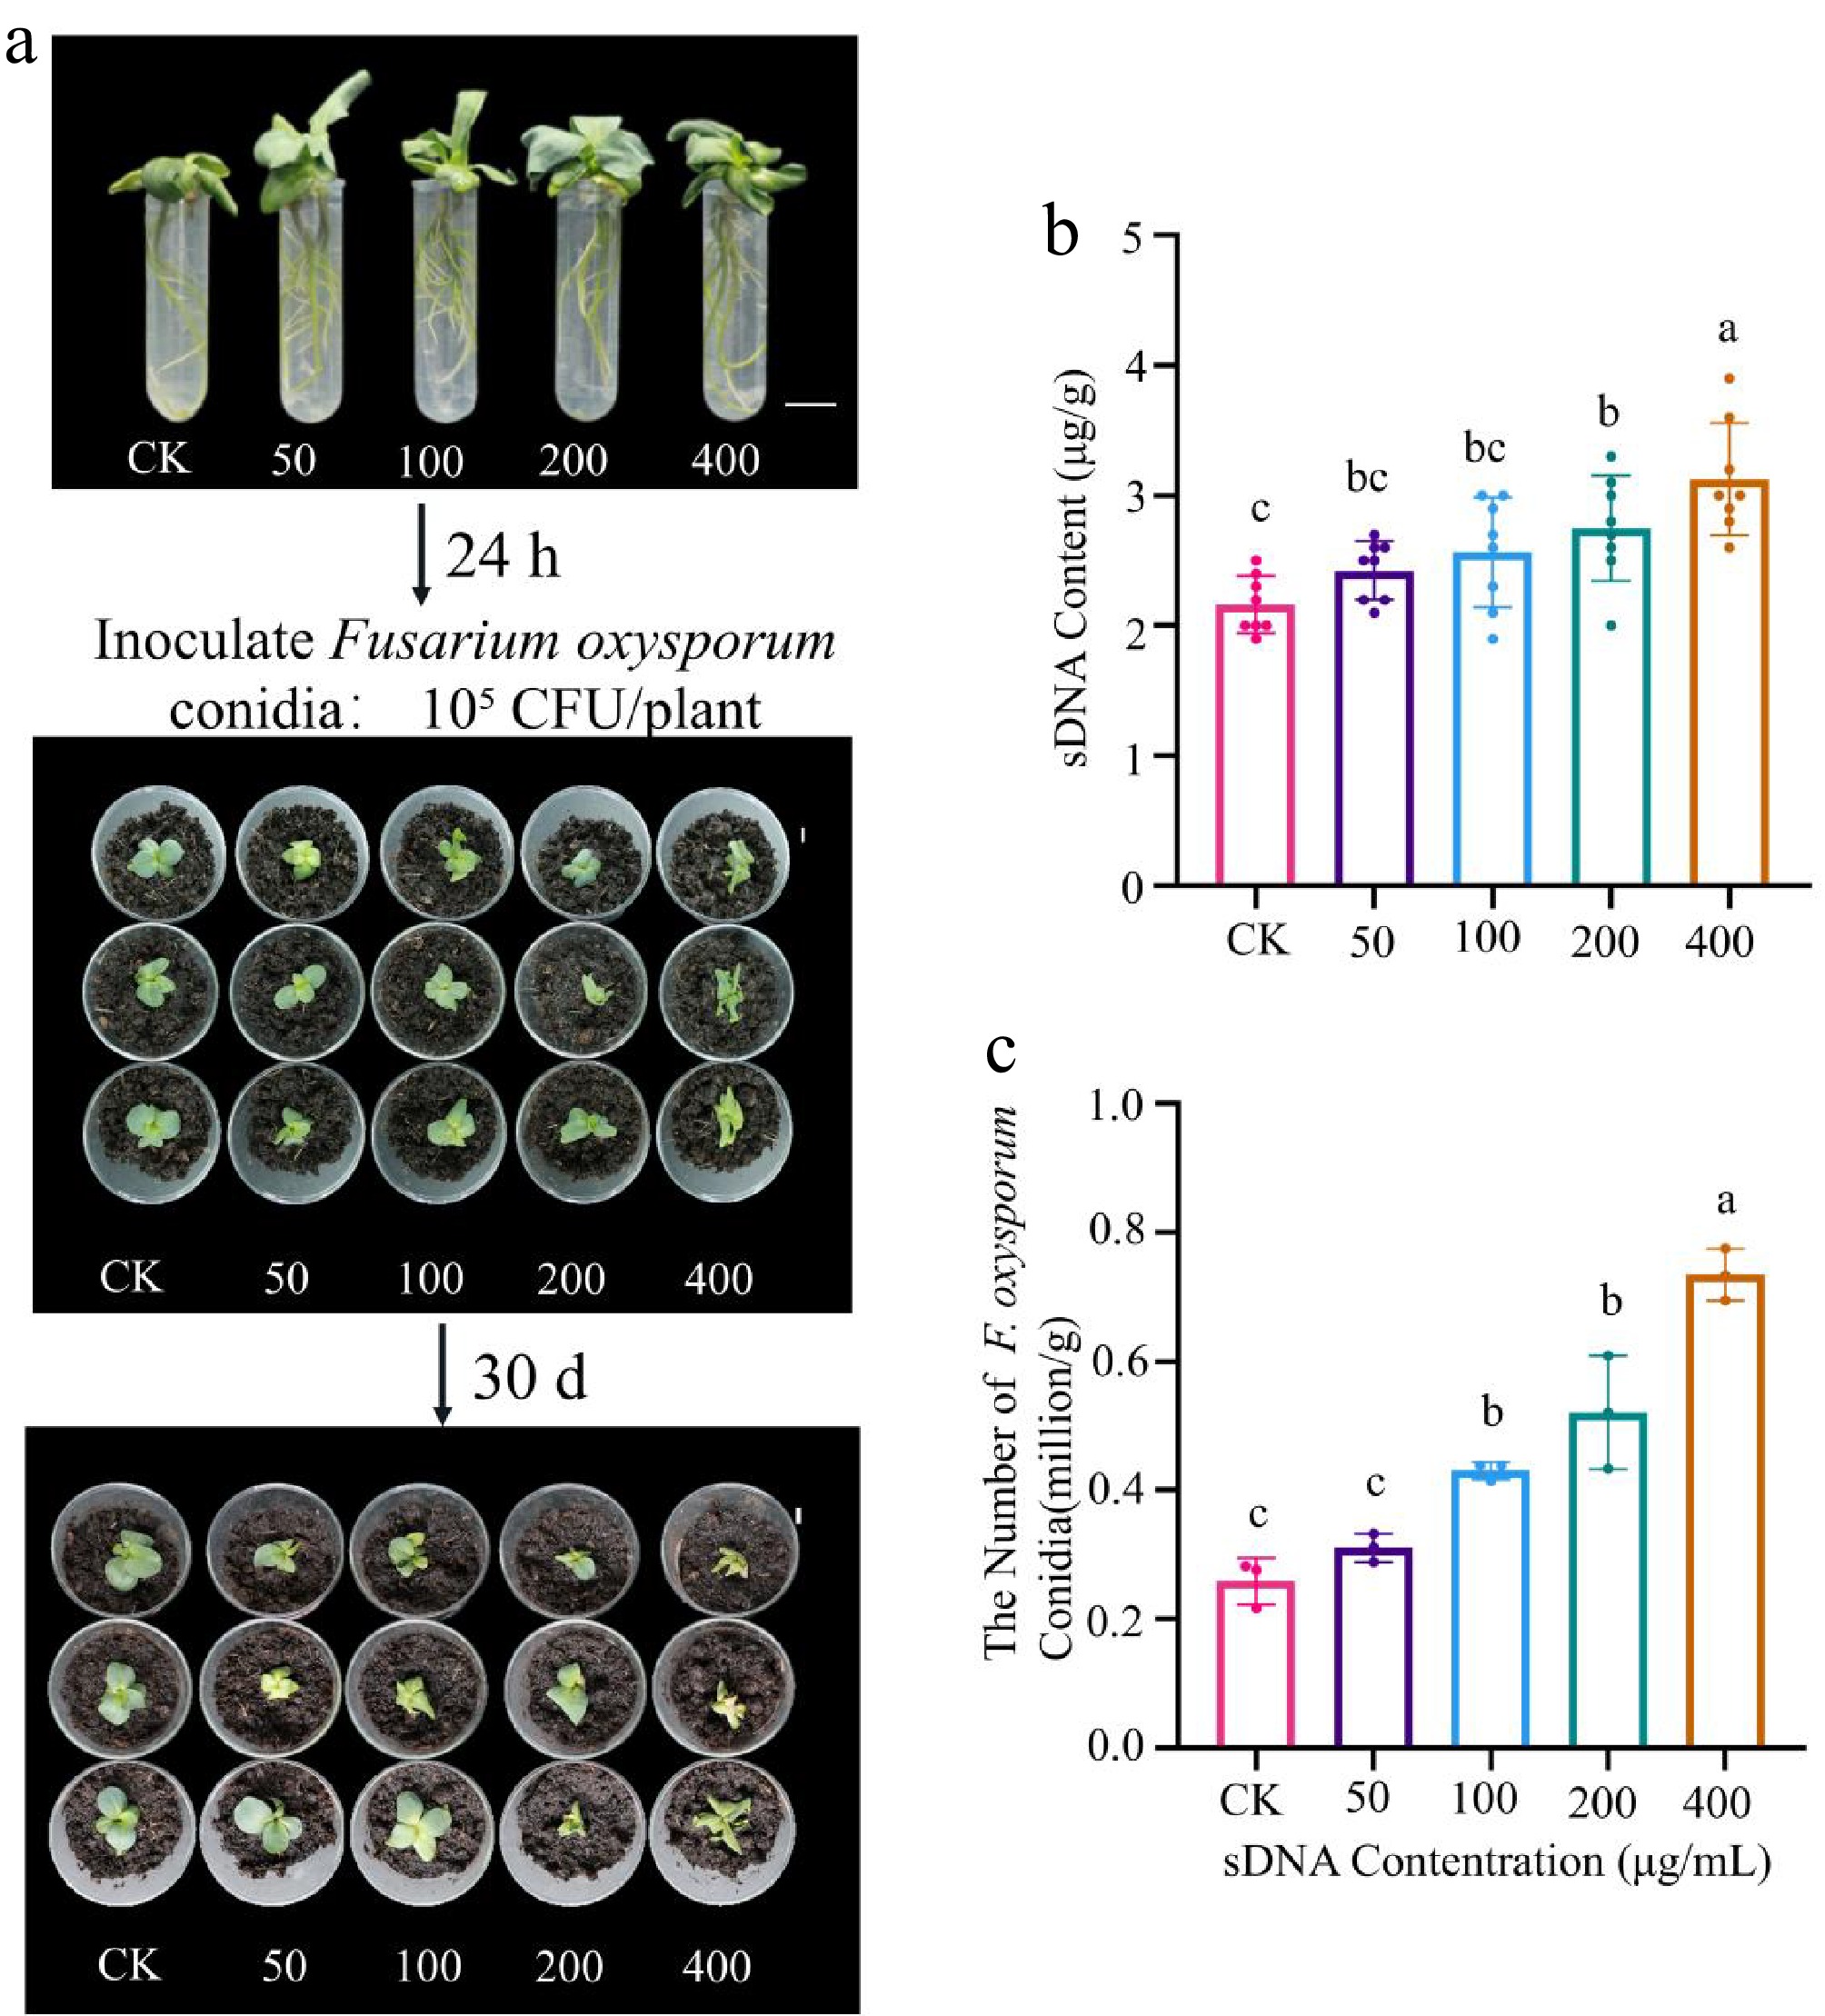
Figure 4.
Effect of sDNA pretreatment on the lisianthus - Fusarium oxysporum interaction. (a) Lisianthus seedlings were treated with sDNA (0, 50, 100, 200, 400 μg/mL); after 24 h, they were transplanted into a peat-based substrate and inoculated with F. oxysporum conidia (105 CFU/plant); the photograph shows representative disease symptoms across treatment groups (CK, T-50, T-100, T-200, T-400) at 30 d post-inoculation. The numbers 0 to 4 above the samples indicate the treatment groups corresponding to sDNA concentrations of 0 (CK), 50, 100, 200, and 400 μg/mL, respectively (scale bar = 1 cm). (b) Detection of extracellular DNA content in rhizosphere soil (n = 3). Different lowercase letters indicate significant differences between groups (p < 0.05, Duncan's test). (c) Quantitative analysis of F. oxysporum conidial abundance in rhizosphere soil (n = 8). The T-100 and T-400 treatments showed a 2-fold and 3-fold increase, respectively, compared to the control group.
-
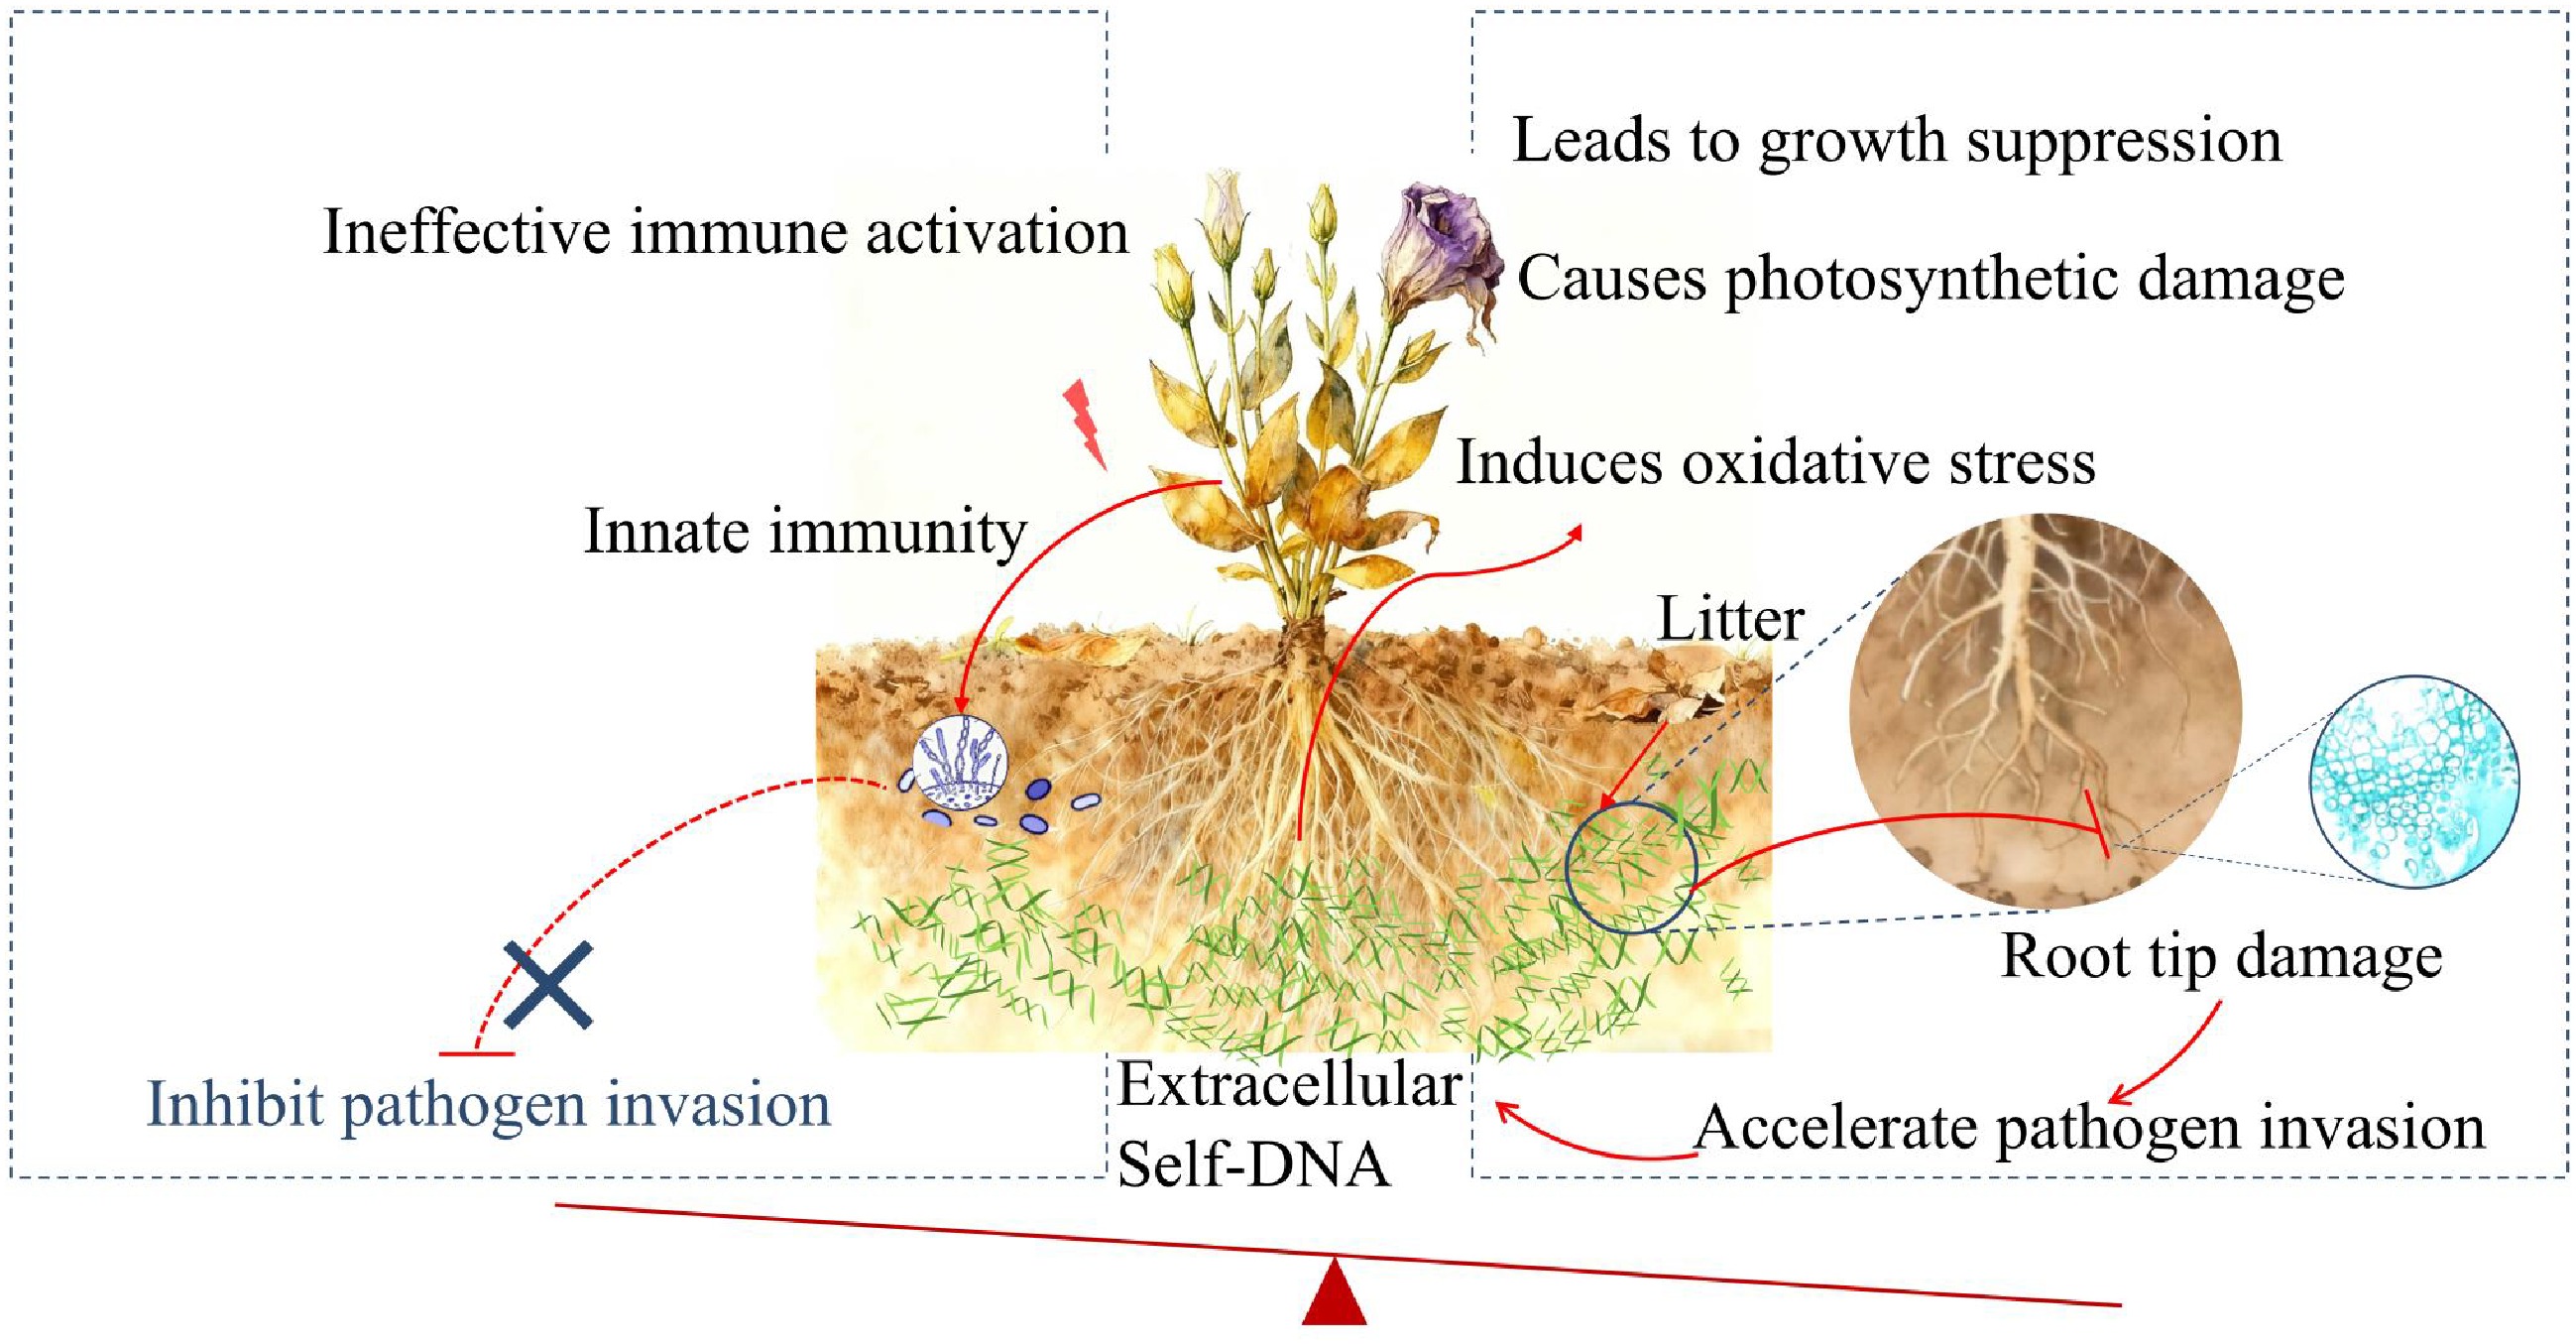
Figure 5.
Schematic diagram depicting the proposed mechanism of sDNA-mediated negative plant-soil feedback in lisianthus. Self-DNA released from accumulated root litter in the soil acts as a danger signal, activating the innate immune system and potentially enhancing pathogen resistance. Simultaneously, it induces oxidative stress and inhibits basic metabolic processes like photosynthesis, leading to root damage and reduced plant fitness. Crucially, the beneficial effects of immune activation are likely overridden by the growth-inhibitory and damaging effects, ultimately predisposing the plant to accelerate pathogen invasion and establishing a vicious cycle characteristic of soil sickness.
Figures
(5)
Tables
(0)