-
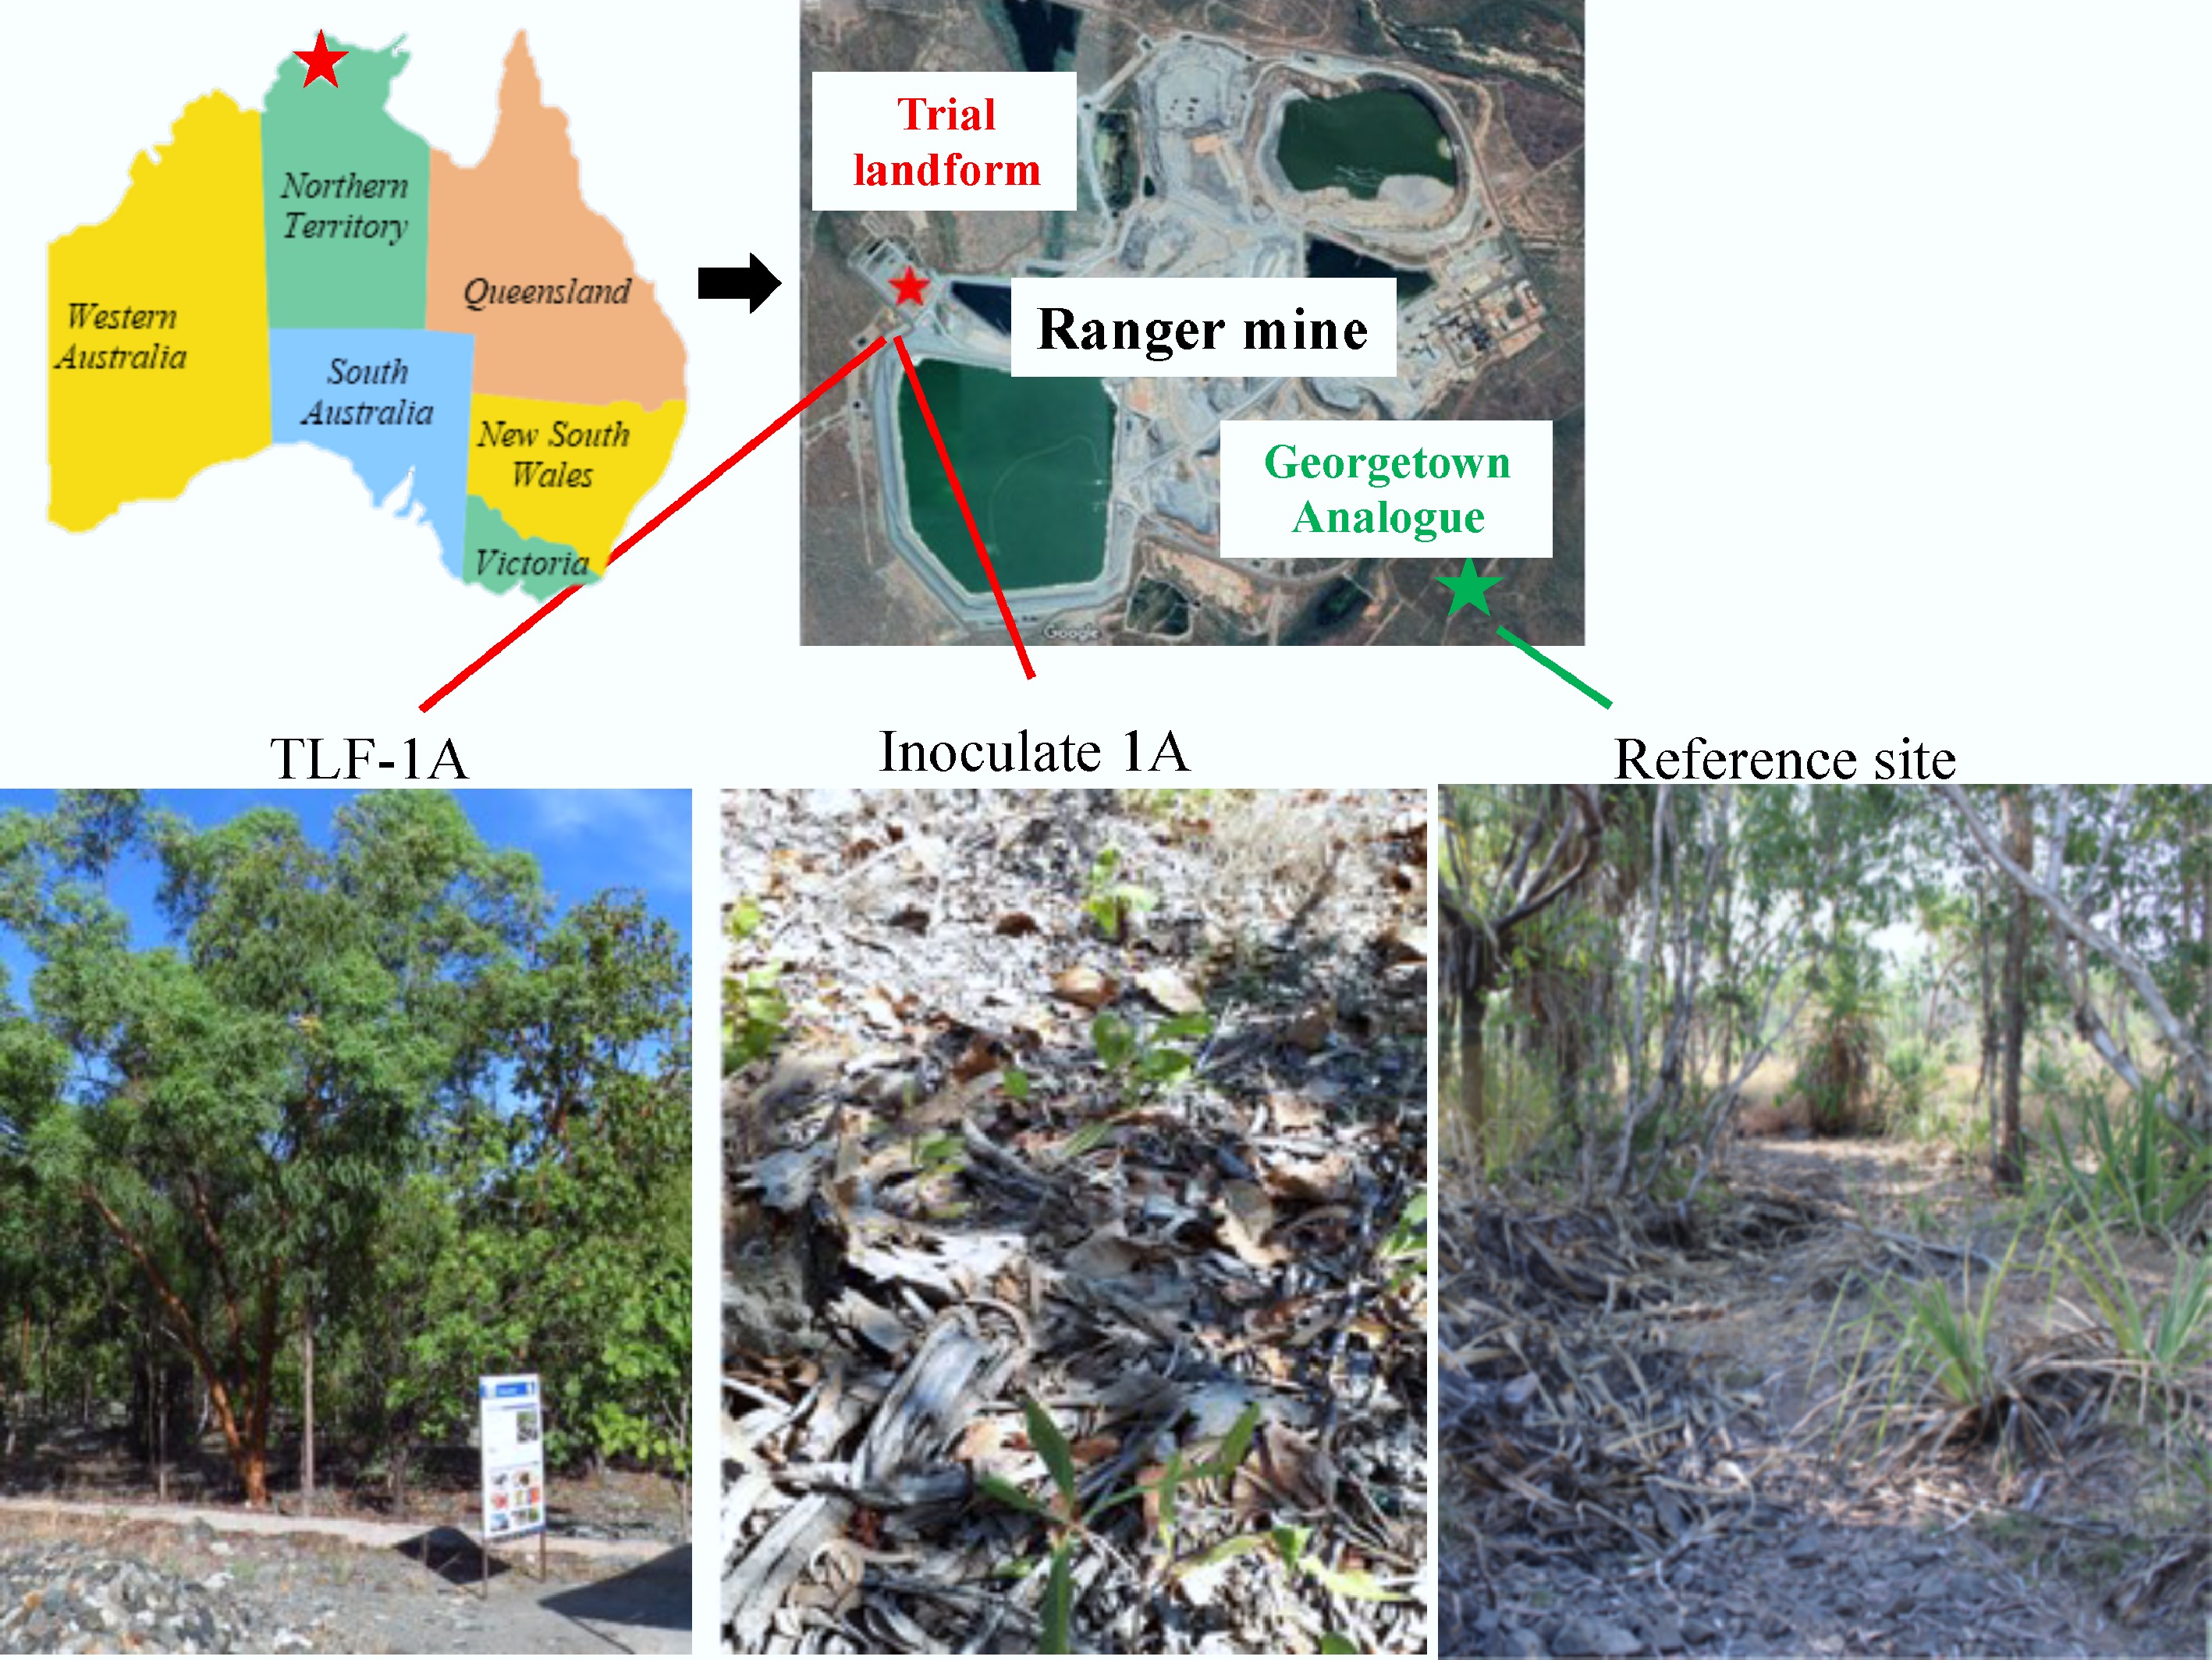
Figure 1.
Map of the Trial Landform (TLF) and Georgetown analogue tropical Eucalyptus open woodland adjacent to the Ranger Mine (Northern Territory, Australia), showing the relative positions of the rehabilitation area and the reference woodland community. Bottom panels show representative field views of sampling sites: TLF-1A, Inoculated-1A, and the reference site.
-
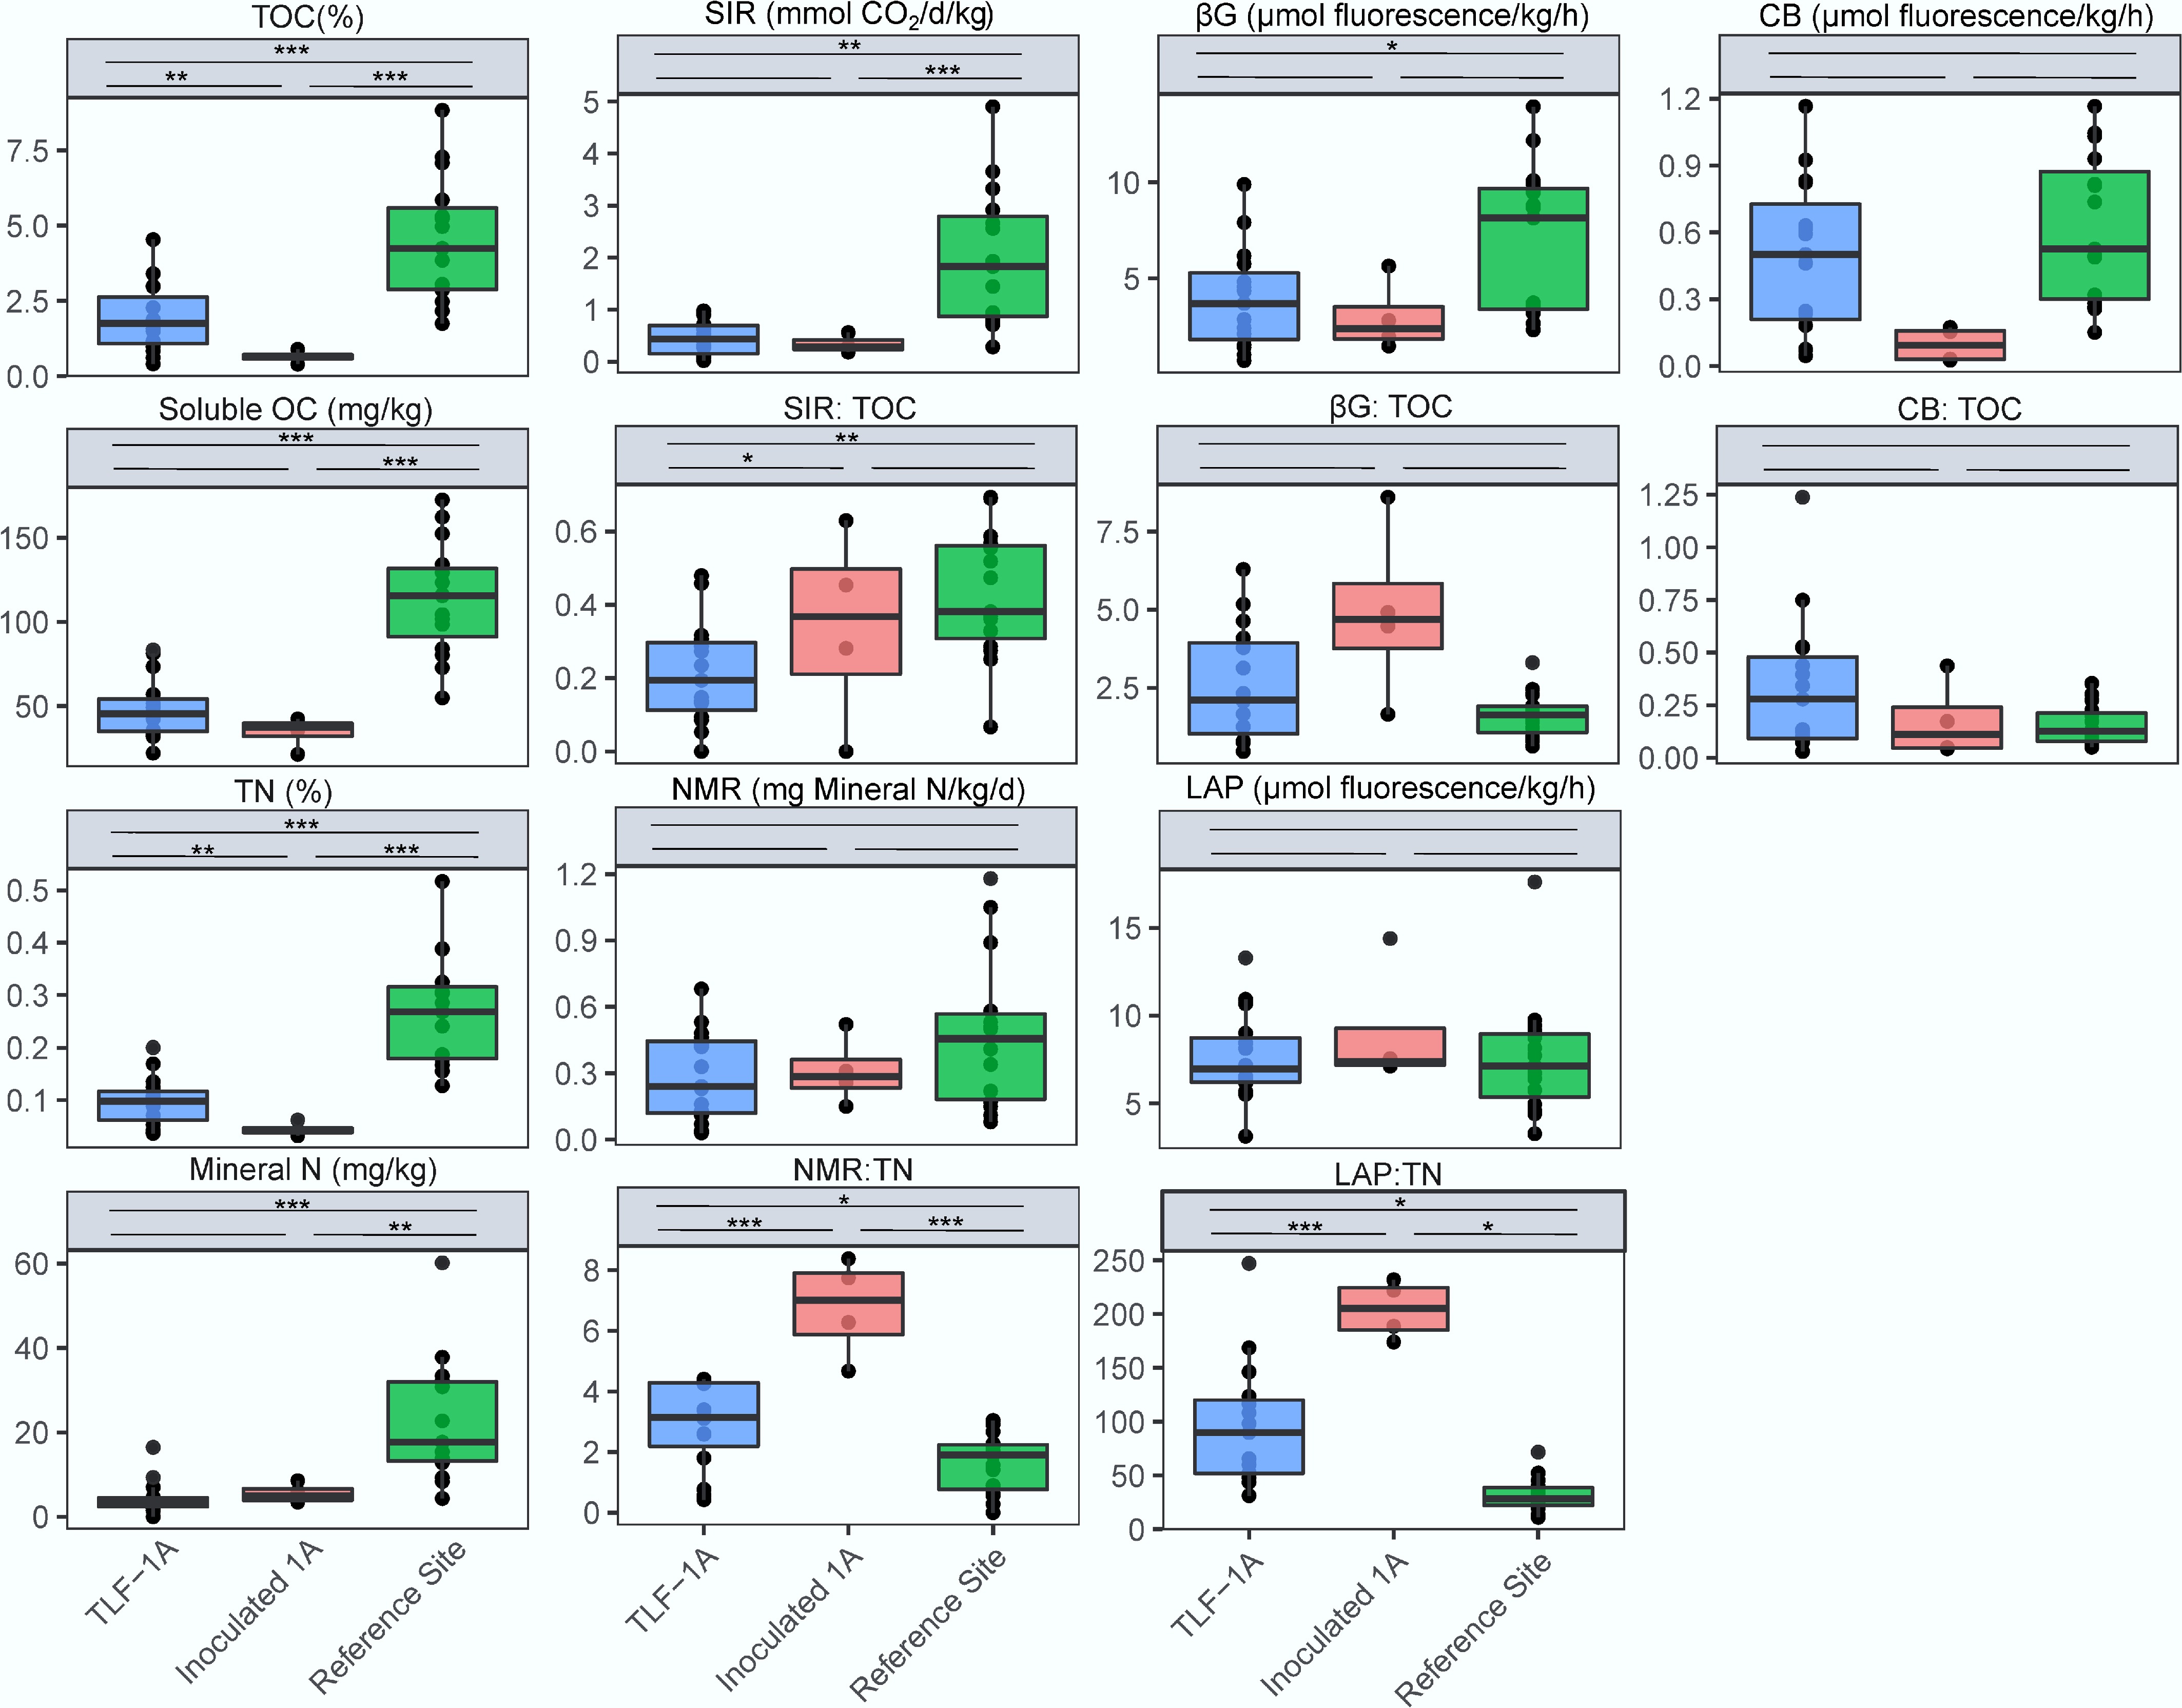
Figure 2.
Total organic carbon (TOC), sucrose-induced respiration rate (SIR), and enzymatic activities of soils for β-1,4-glucosidase (βG), cellobiohydrolase (CB) and the ratio of SIR:TOC, βG: TOC and CB: TOC. Total nitrogen (TN), mineral N, net N mineralization rate (NMR), L-leucine aminopeptidases activities (LAP) and the ratio of NMR:TN and LAP: TN. Enzymatic activities were measured following the MUB/MUC-substrate fluorometric procedure and reported in mmol fluorescence produced per hour per kg of soil. Significant differences between treatment means were determined using post-hoc comparisons with ***, **, * above the line indicating p < 0.001, p < 0.01, and p < 0.05, respectively. For data meeting the assumption of homogeneity of variance, Tukey's Honestly Significant Difference (HSD) test was employed. For heteroscedastic data where Welch's ANOVA was used, the Games-Howell post-hoc test was applied to account for unequal variances and sample sizes.
-
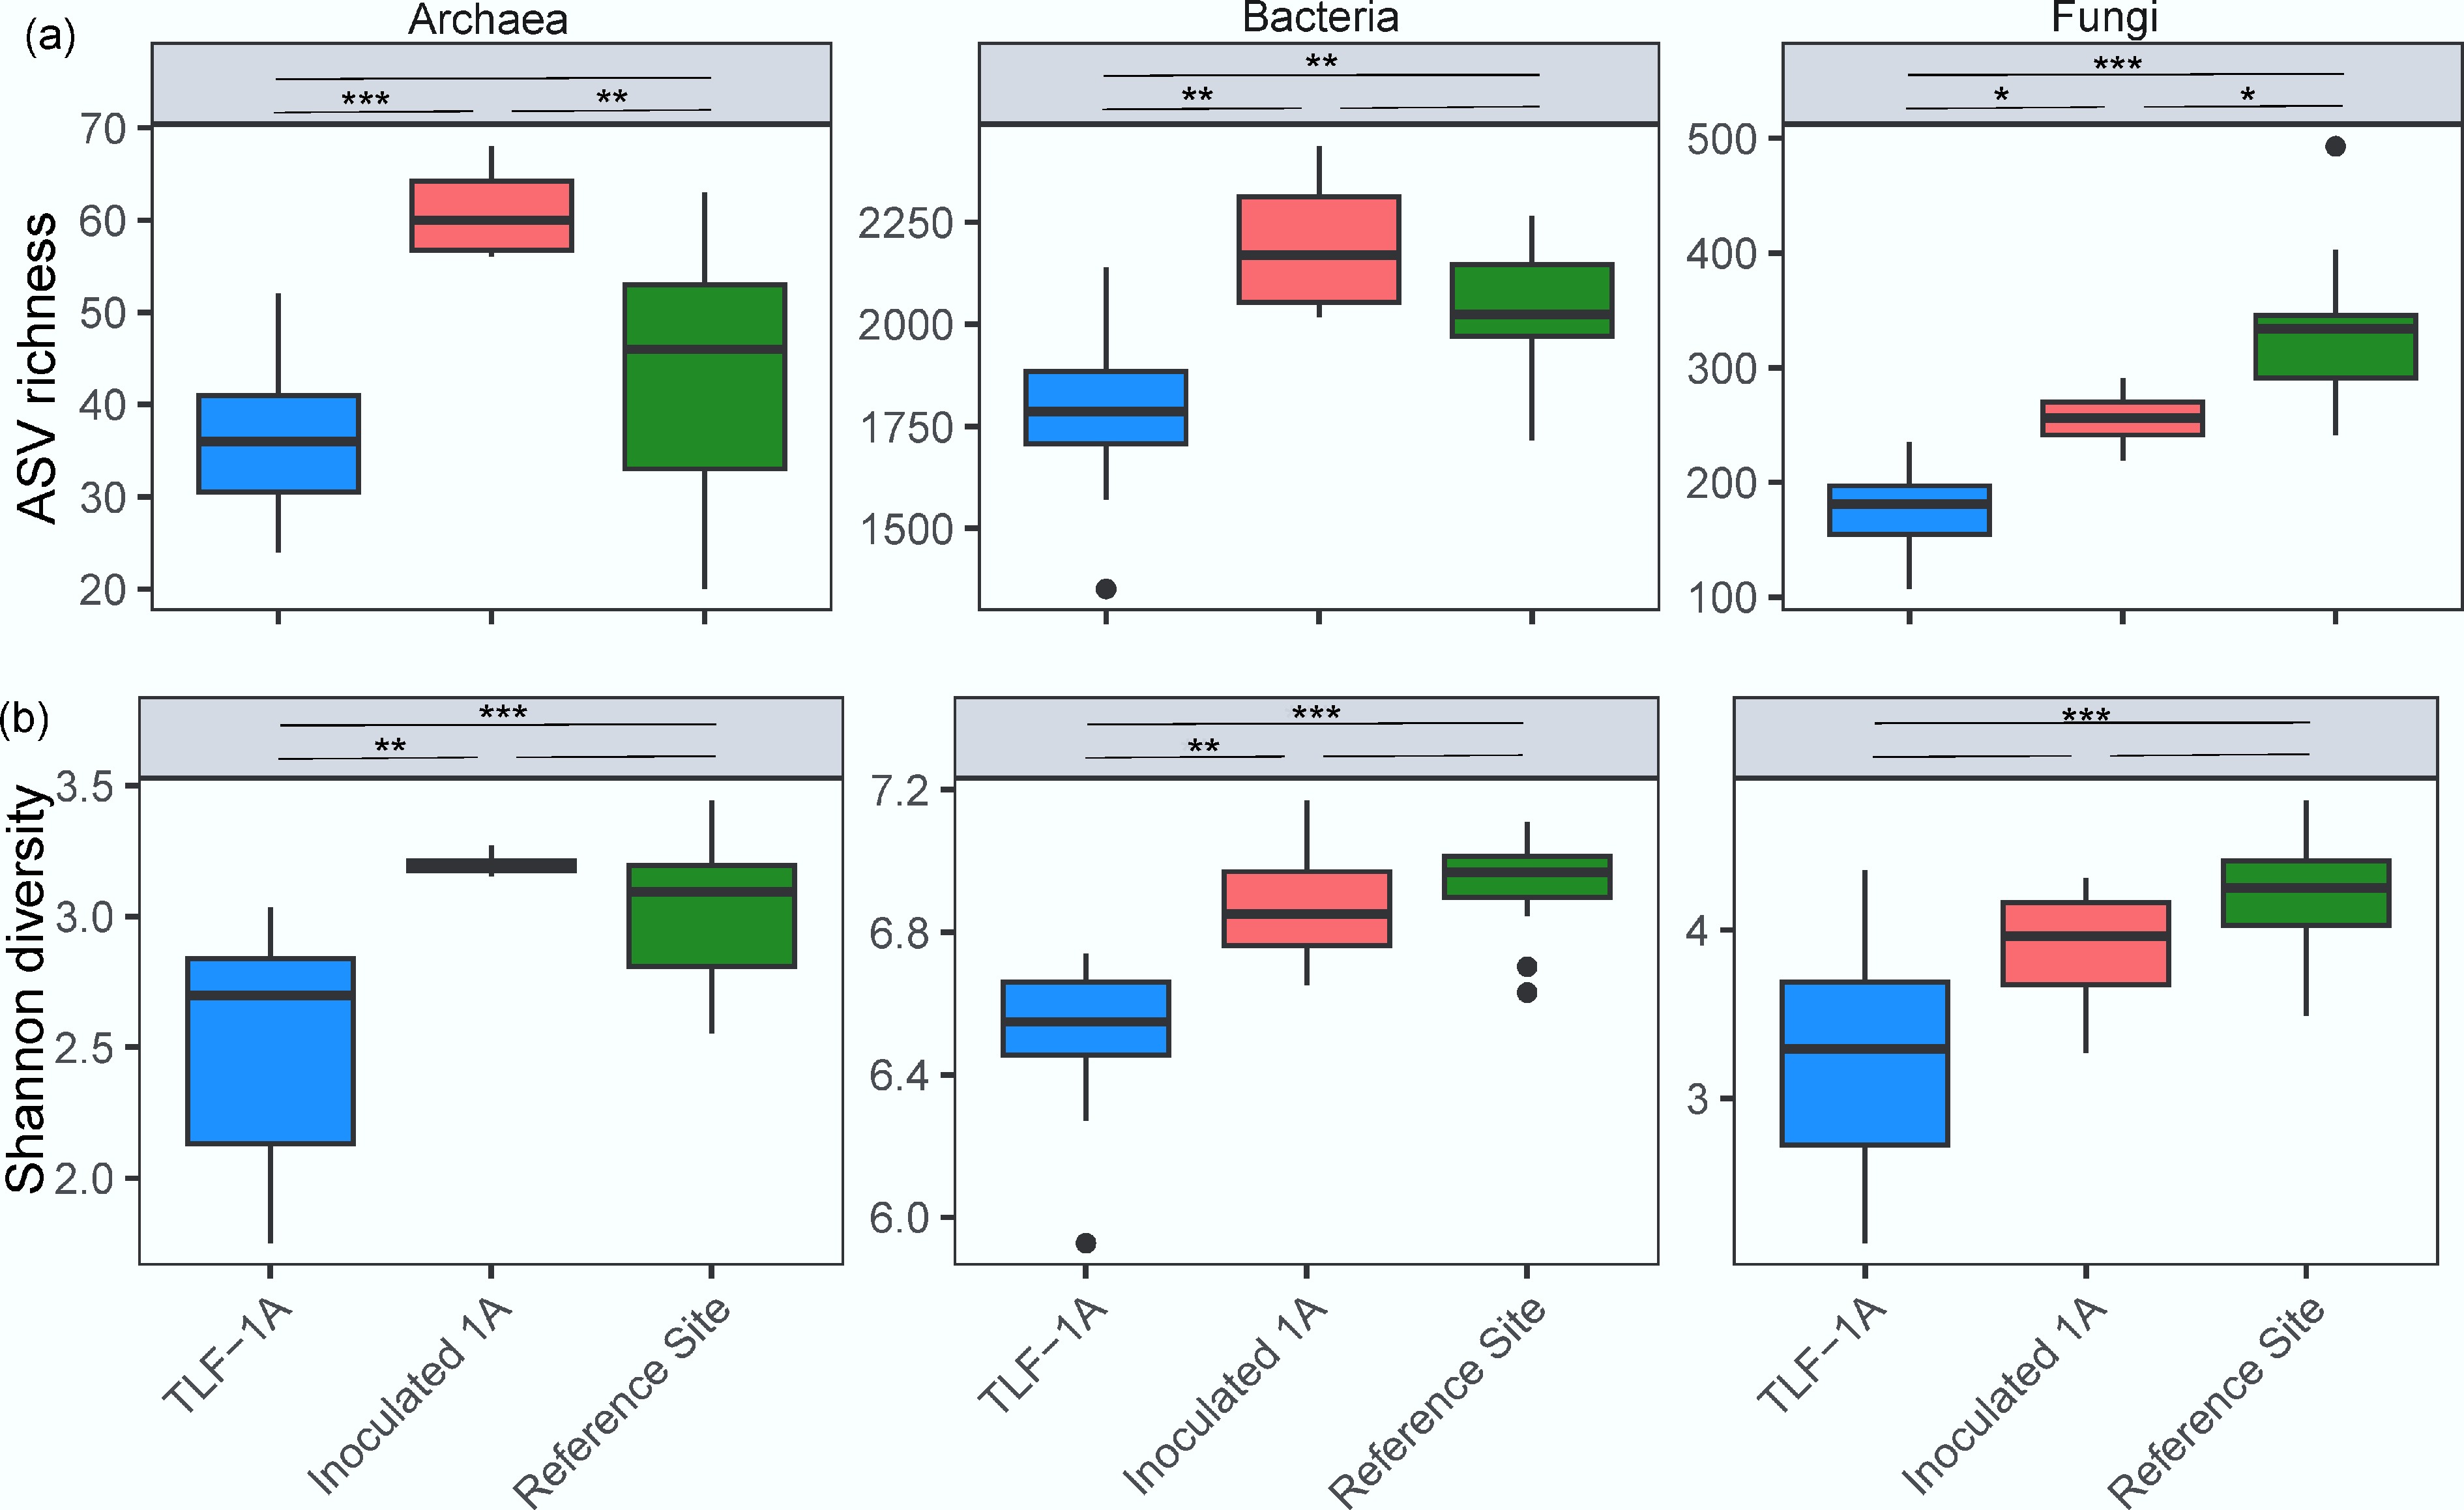
Figure 3.
Box plots of (a) ASV richness, and (b) Shannon index of archaeal, bacterial, and fungal communities in surface soil from TLF-1A, Inoculated 1A and the reference site. Box plots show quartile values. Significant differences between treatment means were determined using post-hoc comparisons with ***, **, and * above the line indicating p < 0.001, p < 0.01, and p < 0.05, respectively. For data meeting the assumption of homogeneity of variance, Tukey's Honestly Significant Difference (HSD) test was employed. For heteroscedastic data where Welch's ANOVA was used, the Games-Howell post-hoc test was applied to account for unequal variances and sample sizes.
-
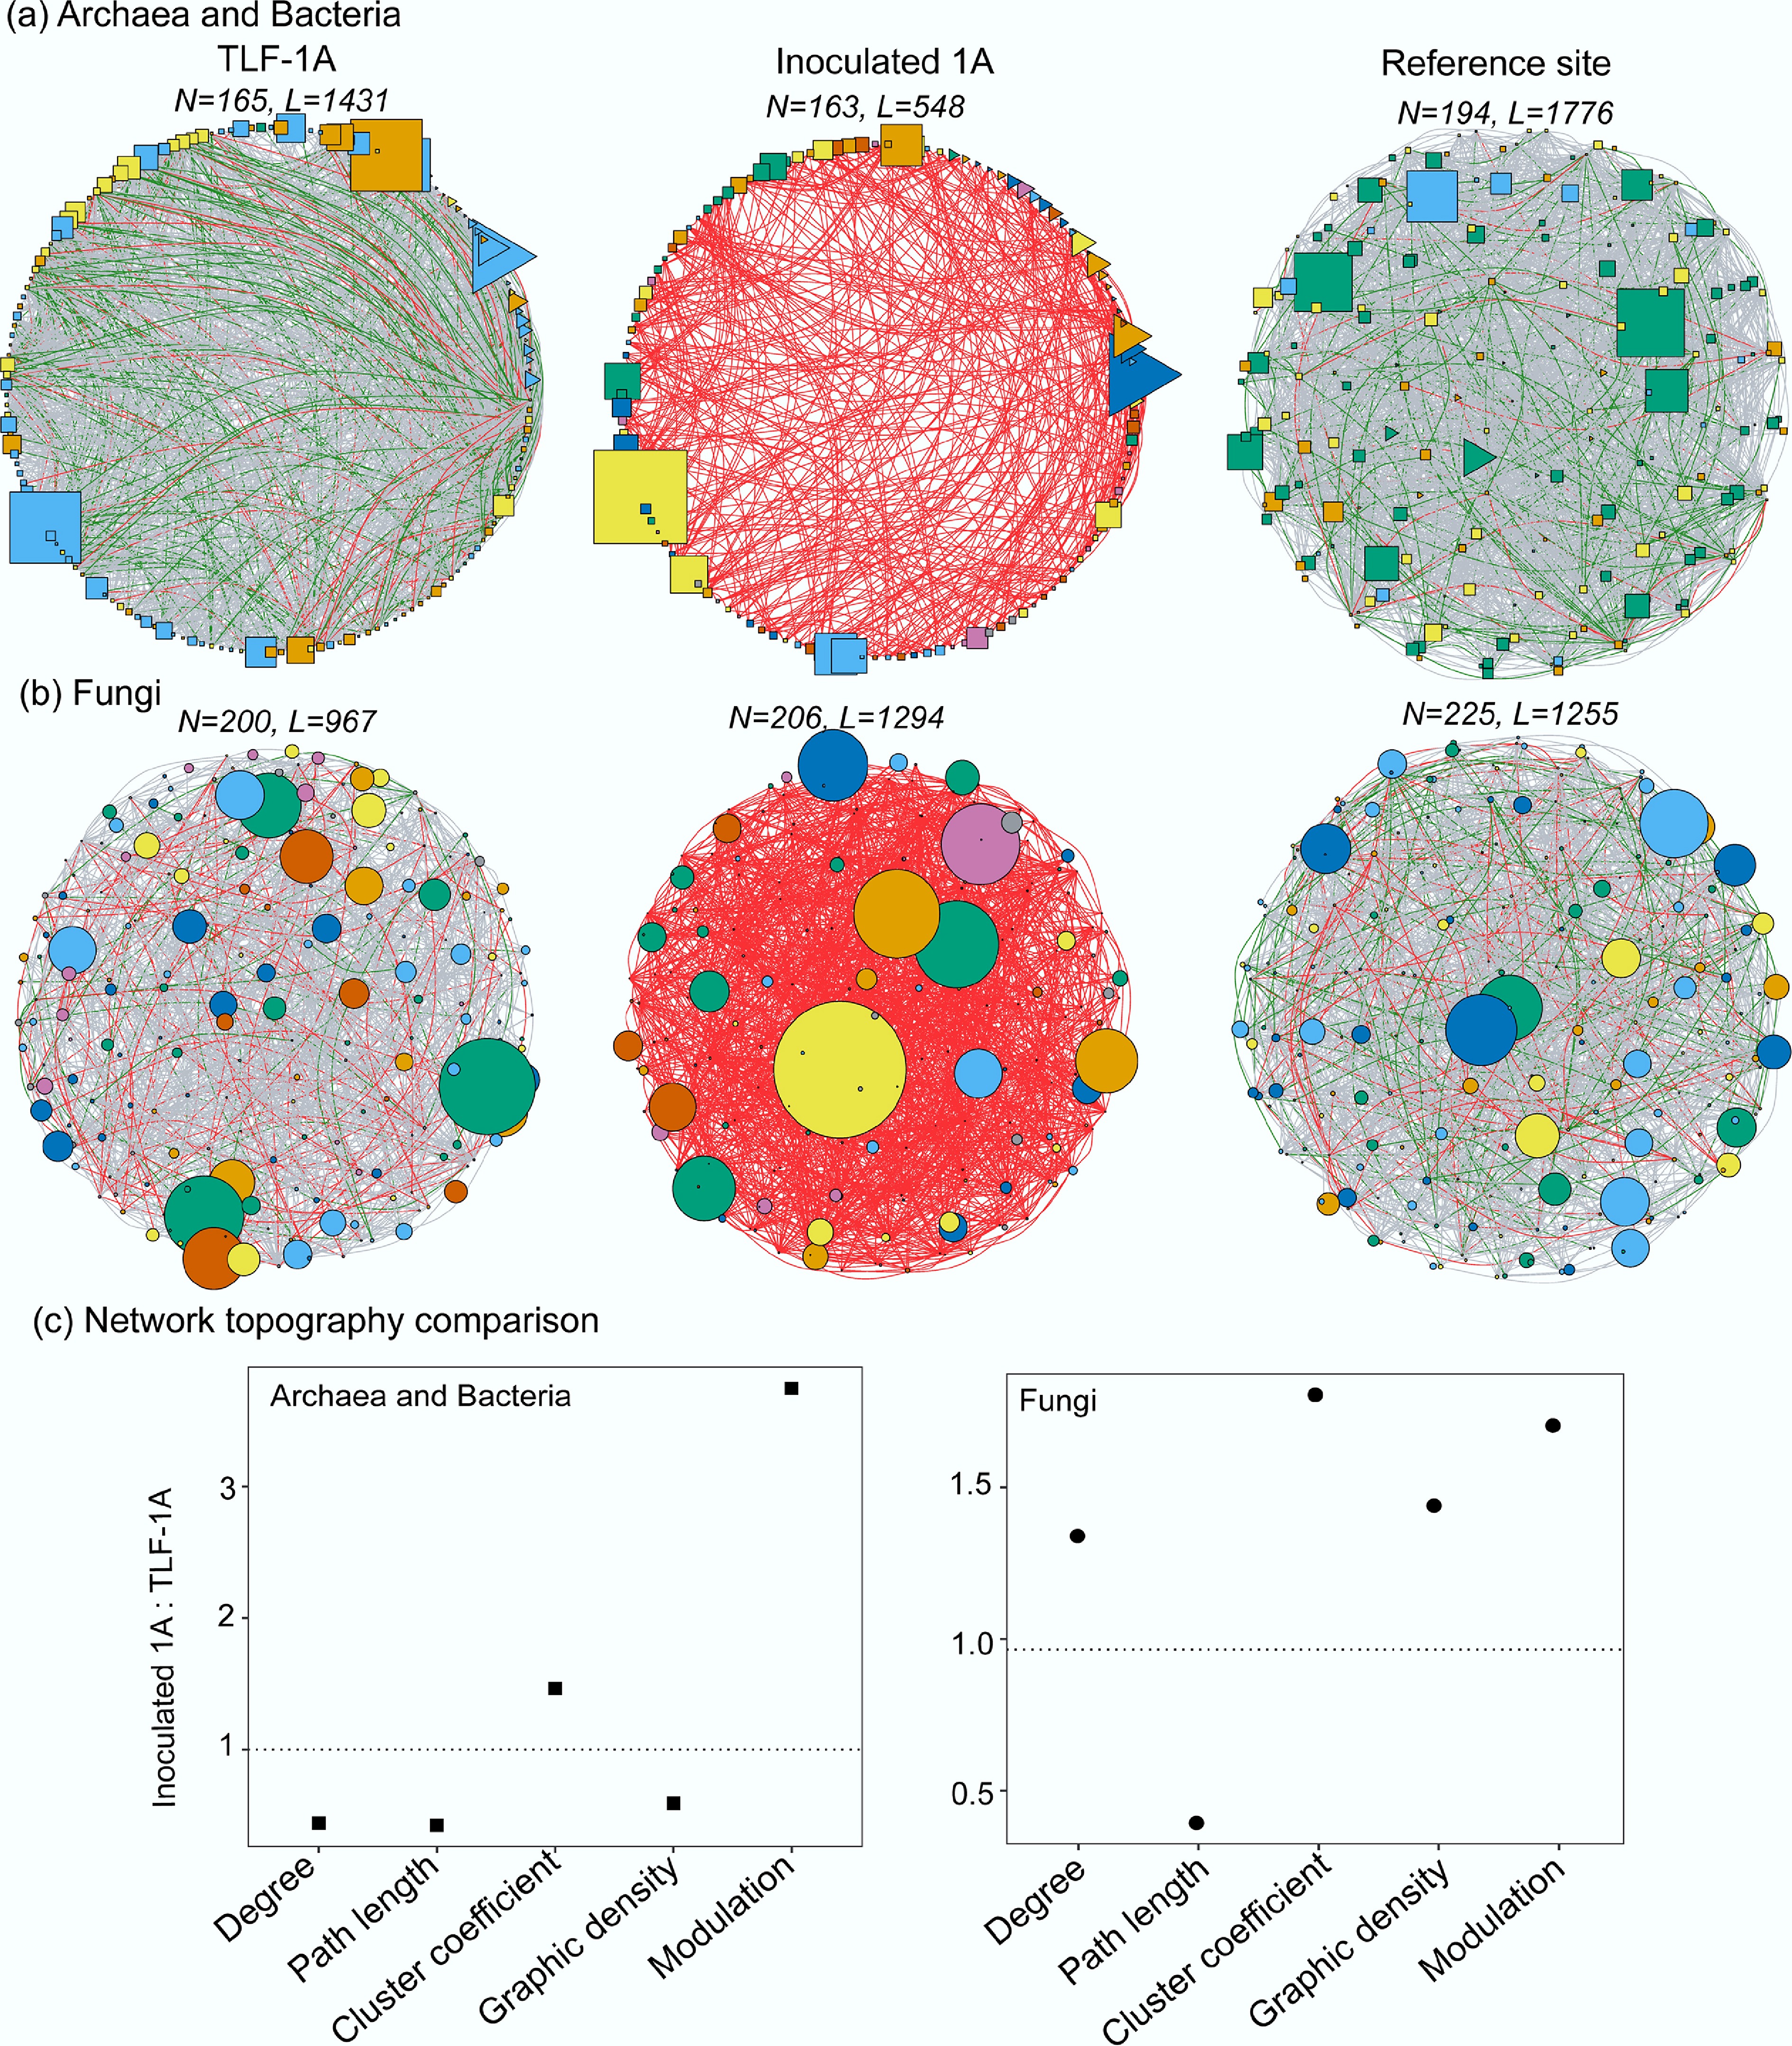
Figure 4.
Patterns of co-occurrence networks for (a) archaeal and bacterial ASVs, and (b) fungal ASVs from TLF-1A, Inoculated 1A and the reference site. The N and L above the networks represent the nodes and edge numbers. The shapes of the network present archaeal (triangle), bacterial (circle) and fungal (square) ASVs. The colors of nodes indicate different network modules with at least five nodes detected using the greedy modularity optimization method. The size of a node is proportional to the relative abundance. The edge connection stands for a strong (Spearman's ρ > 0.6) and significant (p < 0.05) correlation. The color of the edges represent the correlationship coefficient (r > 0.9, red; r: 0.8–0.9, green; and r: 0.6–0.8, grey, respectively). (c) Network topological properties of soil microbiomes change in TLF after litter inoculation.
-
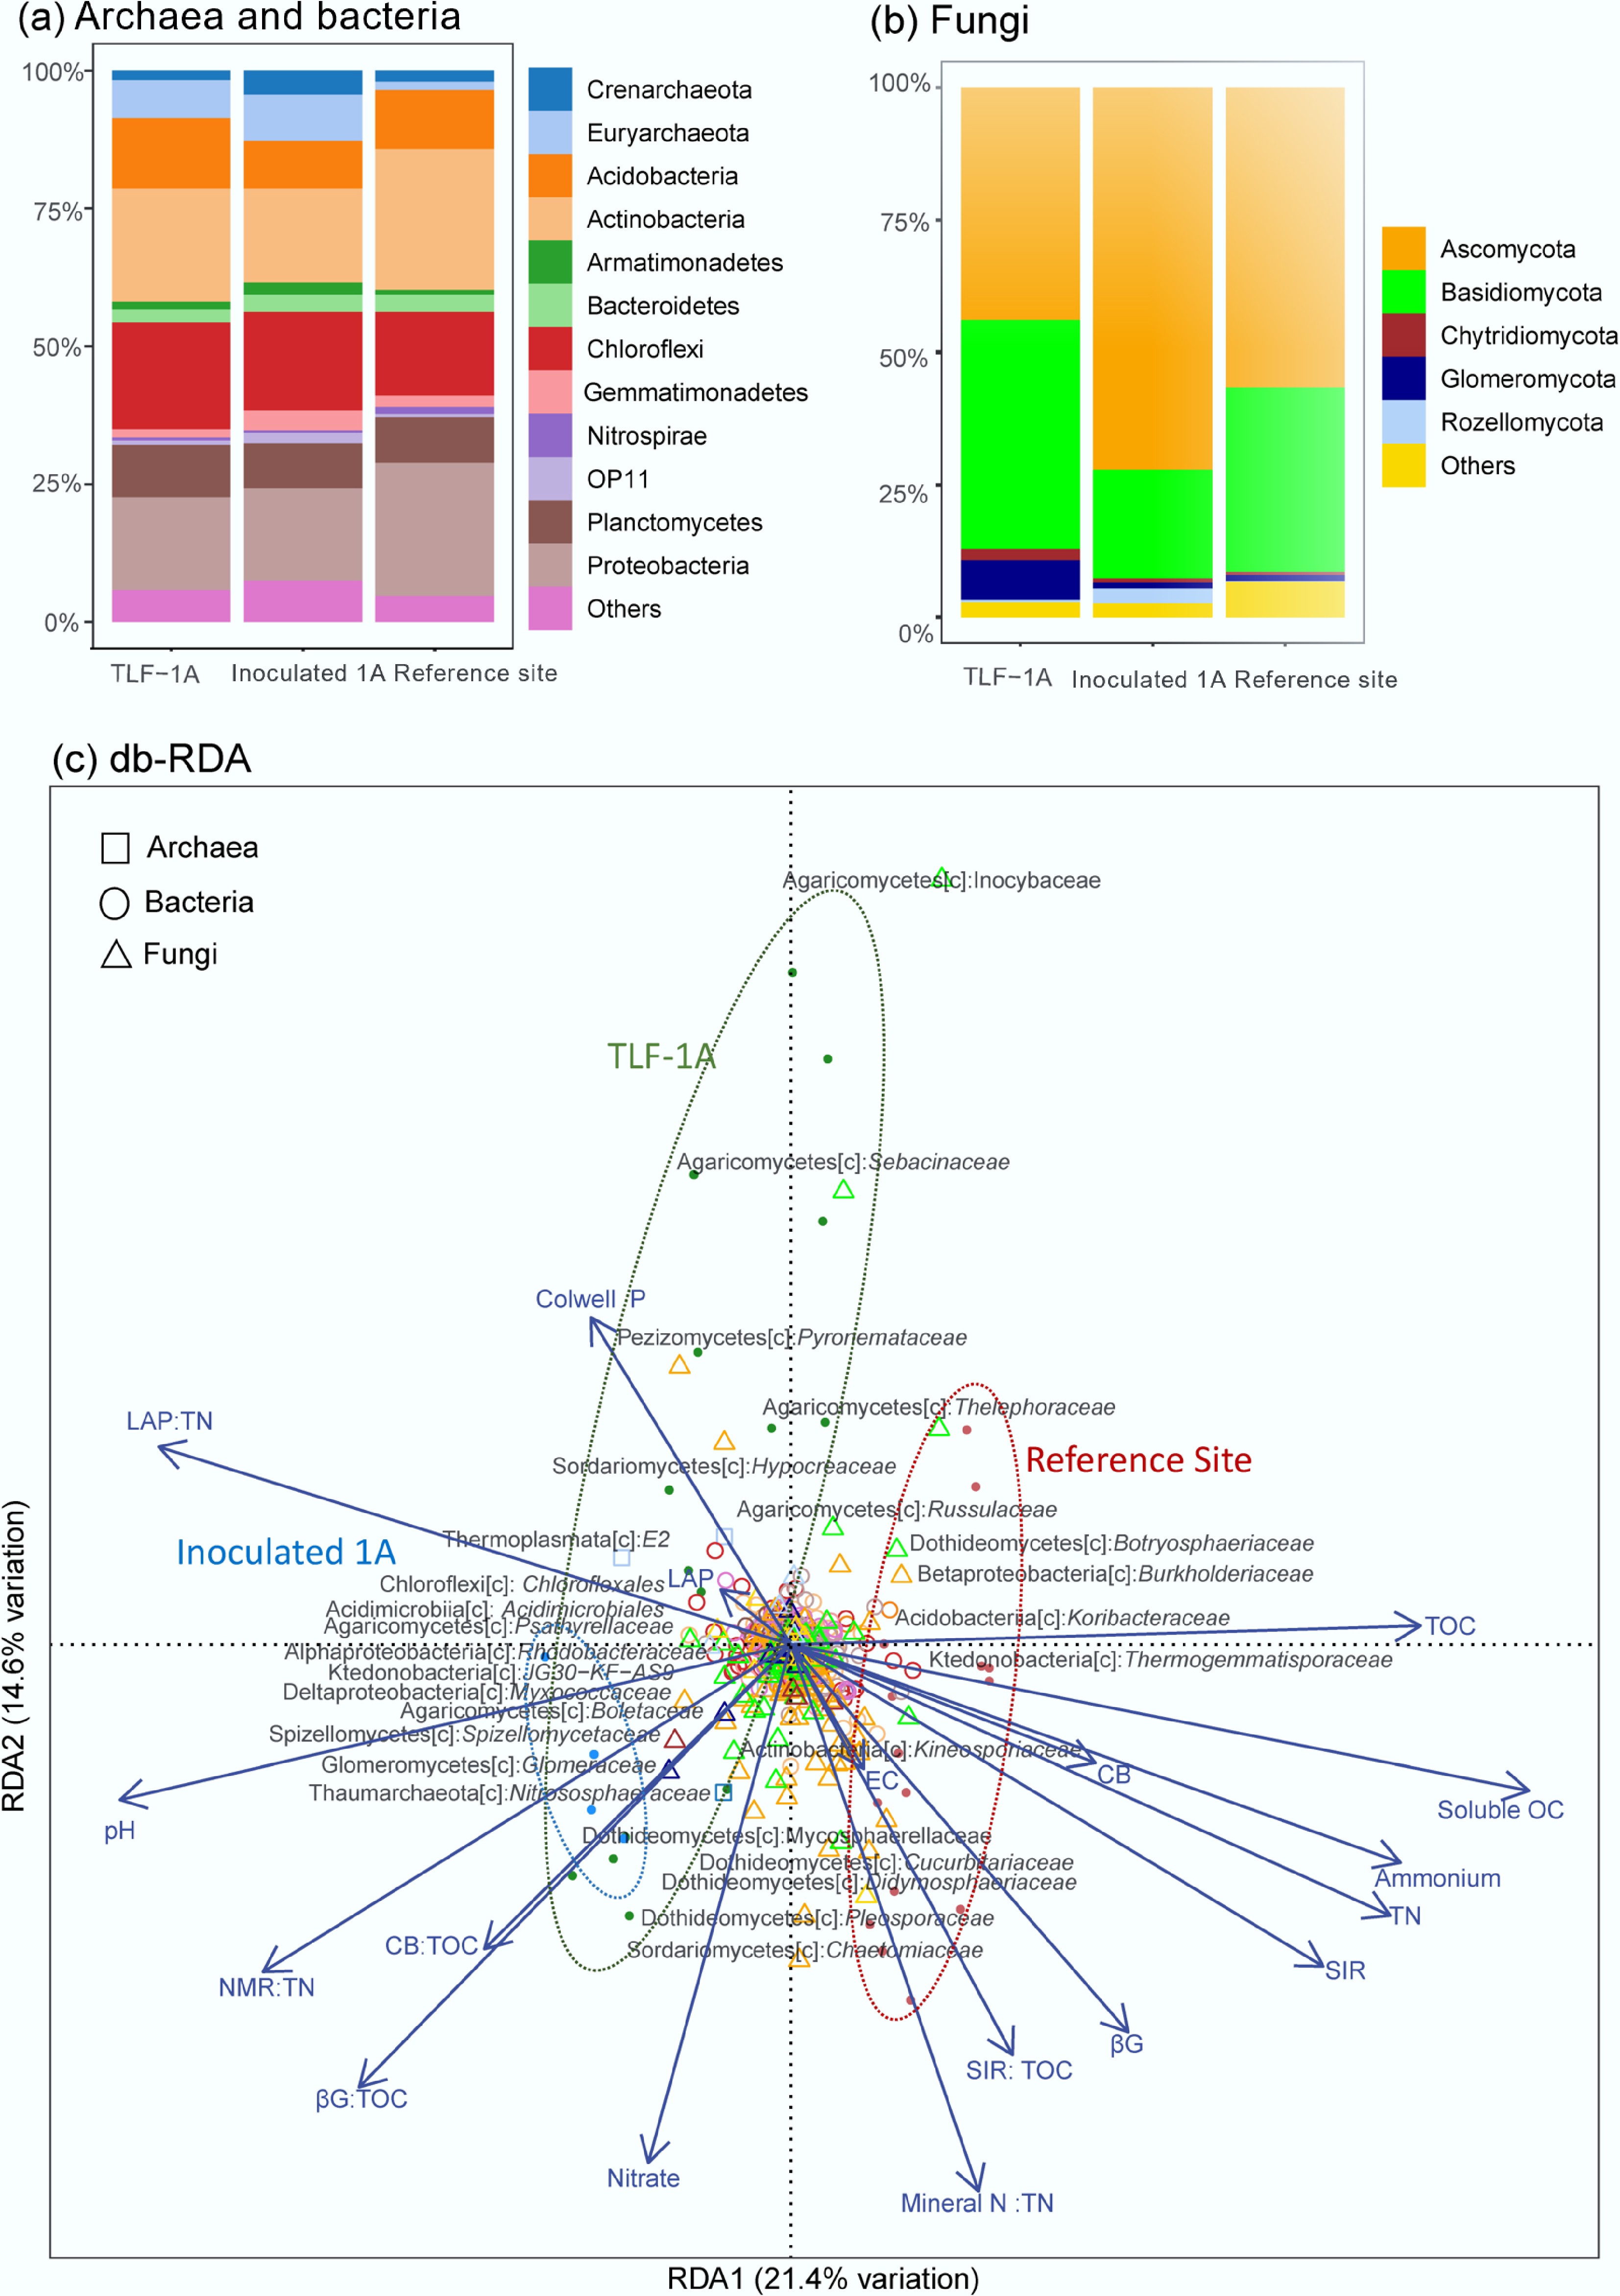
Figure 5.
Relative abundance of soil microbiomes among different sites: (a) Archaeal and bacterial phyla. (b) Fungal phyla. (c) Distance-based redundancy analysis (db-RDA) of soil microbiomes at the family levels and soil biochemistry and function, with archaeal families shown as squares, bacterial families shown as rings and fungal families shown as triangles. The color represents their respective phylum. Each sample is represented by a dot, annotated with its treatment within 95% confidence ellipses, and the environmental drivers are indicated by arrows. The taxonomy annotation is based on the BLAST results in the format of name of class[c]: family group. Abbreviations for soil biochemistry include TOC: total organic carbon; TN: total nitrogen; NMR: net N mineralization rate; SIR: sucrose-induced respiration; βG: β-1,4-glucosidase activity; CB: cellobiohydrolase activity; and LAP: L-leucine aminopeptidase activity.
-
Site Archaea Bacteria Fungi No. Richness No. Richness No. Richness TLF-1A 3 8.3% 101 5.6% 16 9.2% Inoculated 1A 27 44.3% 677 30.8% 62 24.2% Reference site 6 14.0% 469 23.2% 30 9.1% Table 1.
Summary of the number and percent of core microbial ASVs richness within soil archaeal, bacterial, and fungal communities across the rehabilitated TLF-1A, Inoculated 1A, and reference site soils
-
Domain/phyla Closest blast
speciesTLF-1A
(%)Inoculated
1A (%)Reference
site (%)Putative functions Ref. Archaea (total) 7.7 8.9 10.4 Crenarchaeota Candidatus nitrososphaera 3.3 6.1 1.9 Ammonium oxidizer [24] Euryarchaeota Methanogenic archaeon 4.4 2.8 8.5 Methane producer [18] Bacteria (total) 2.63 3.07 4.62 Acidobacteria Arenimicrobium luteum 0.2 0.4 0.7 Obligate aerobic soil organic matter decomposer [25] Acidobacteria bacterium 0.04 0.06 0.09 Soil organic matter decomposer [25] Acidobacteria bacterium 0.11 0.07 0.29 Soil organic matter decomposer [25] Actinobacteria Acidimicrobidae bacterium 0.05 0.03 0.03 Iron reducer [26] Rhabdothermincola sediminis 0.22 0.33 0.07 Thermophilic, aerobic organic matter decomposer [27] Aciditerrimonas sp. 0.04 0.01 0.02 Iron-reducing thermoacidophile [21] Geodermatophilus sp. 0.42 0.27 0.36 Gamma-ray resistant and aerobic rock degrader [20] Geodermatophilus sp. 0.28 0.18 0.87 Stress-tolerant rock degrader [20] Actinomycetospora sp. 0.02 0.07 0.06 Aerobic organic matter decomposer [28] Solirubrobacter sp. 0.18 0.13 0.17 Aerobic soil organic matter decomposer [29] Bacteroidetes Terrimonas soli 0.10 0.38 0.16 Aerobic soil organic matter decomposer [30] Chloroflexi Chloroflexi bacterium 0.04 0.12 0.06 Marine thermophilic heterotroph [19] Bacterium YC-LK-LKJ27 0.06 0.13 0.05 Uncharacterized moderate halophile [31] Gemmatimonadetes Gemmatimonas sp. 0.08 0.07 0.21 Aerobic anoxygenic phototroph [32] Planctomycetes Phycisphaera mikurensis 0.03 0.02 0.02 Marine source anaerobic bacteria [33] Planctomycete LX80 0.06 0.15 0.11 Slow-growing fastidious heterotroph [34] Proteobacteria Sphingomonas horti 0.06 0.04 0.18 Aerobic soil organic matter decomposer [35] Reyranella soli 0.05 0.02 0.10 Microaerobic soil organic matter decomposer [36] Kaistobacter sp. 0.06 0.09 0.21 Soil organic matter decomposer [37] Sulfuriferula plumbiphila 0.31 0.15 0.58 Chemolithoautotrophic sulfur-oxidizer [22] Steroidobacter sp. 0.07 0.12 0.07 Aerobic soil organic matter decomposer [38] Verrucomicrobia Bacterium Ellin518 0.04 0.03 0.07 Soil organic matter decomposer [39] Opitutus sp. 0.04 0.10 0.09 Obligately anaerobic decomposer [40] Lacunisphaera anatis 0.07 0.10 0.05 Organic matter decomposer [41] Fungi (total) 1.72 1.90 2.09 Ascomycota Aspergillus saccharolyticus 0.45 0.42 0.16 Organic matter decomposer [23] Aspergillus saccharolyticus 0.15 0.13 0.12 Organic matter decomposer [23] Aspergillus tubingensis 0.46 0.61 0.41 Organic matter decomposer [42] Aspergillus brunneoviolaceus 0.54 0.36 0.34 Organic matter decomposer with high P solubility [43] Curvularia guangxiensis 0.12 0.38 1.06 Organic matter decomposer [44] Table 2.
A compiled list of core microbial ASVs, their relative abundance and putative functions in the surface soils of TLF-1A, Inoculated 1A and the reference site
Figures
(5)
Tables
(2)