-
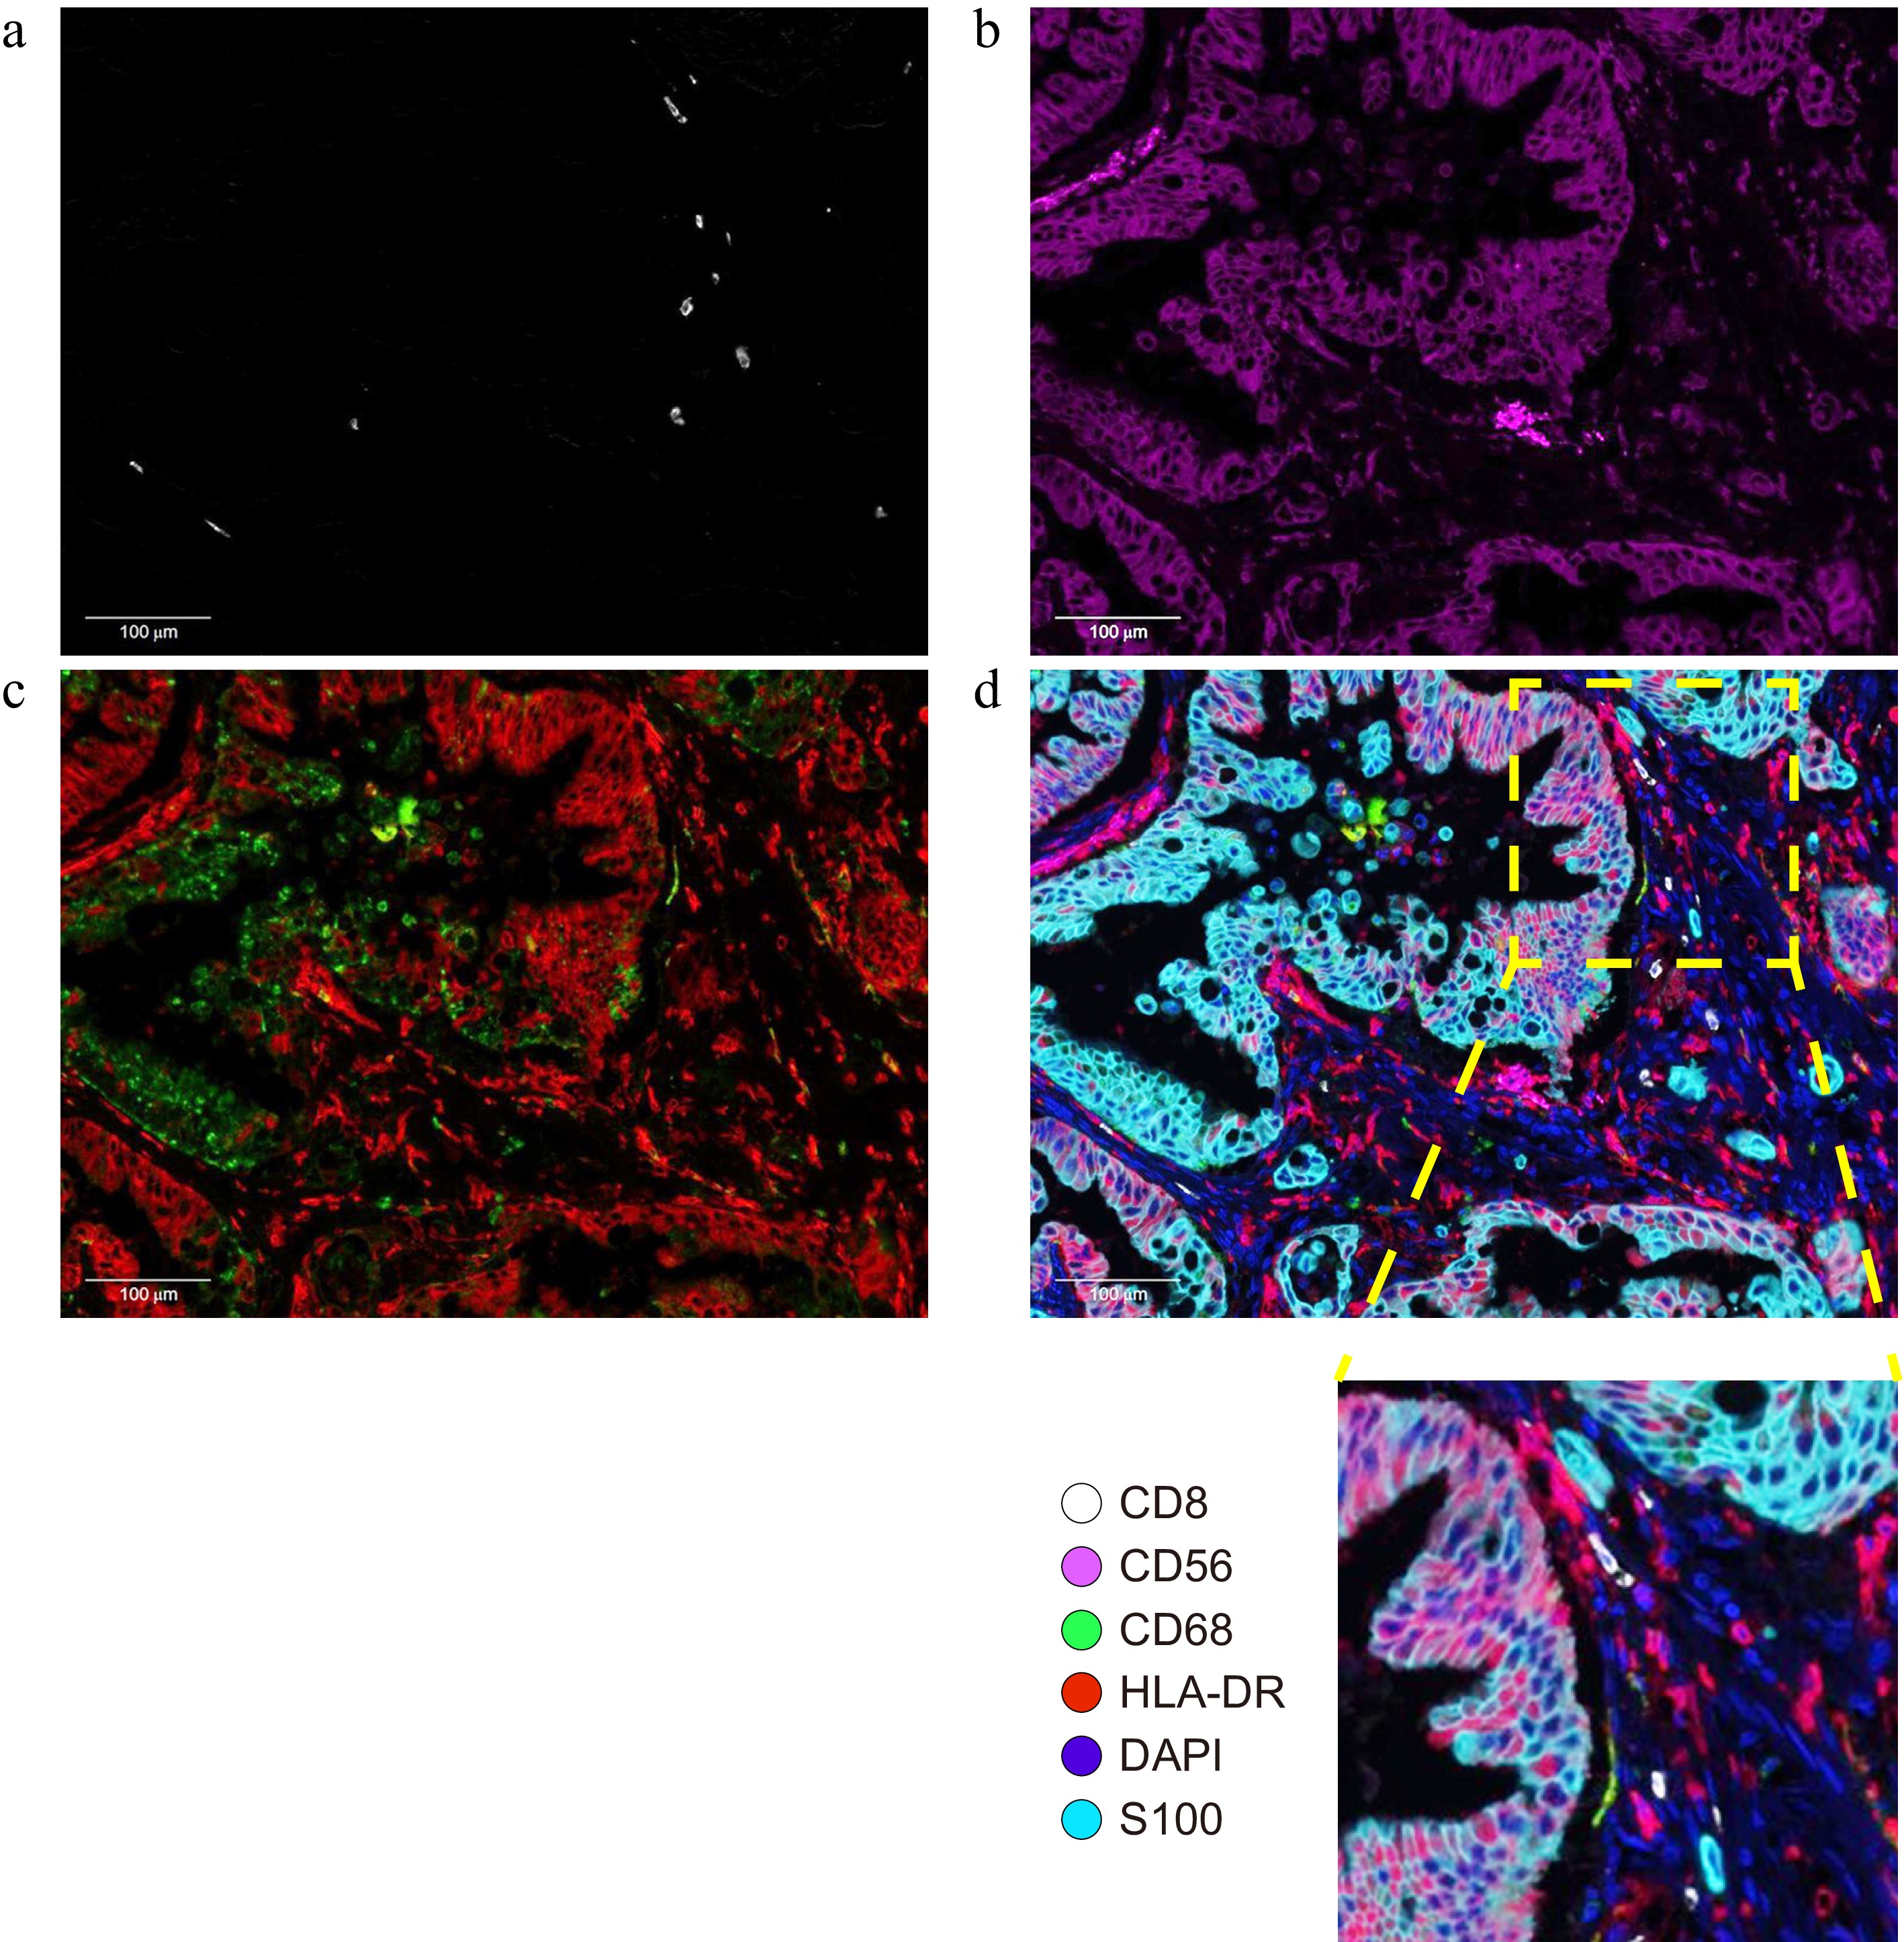
Figure 1.
Typical photomicrographs of multiple immunofluorescence staining: (a) CD8+ (white); (b) CD56+ (purple); (c) CD68+ (green) and HLA-DR (red); and (d) Reconstructed image after removal of autofluorescence and local enlargement. The lower right panel of (d) is a 4× magnified image of the selected region.
-
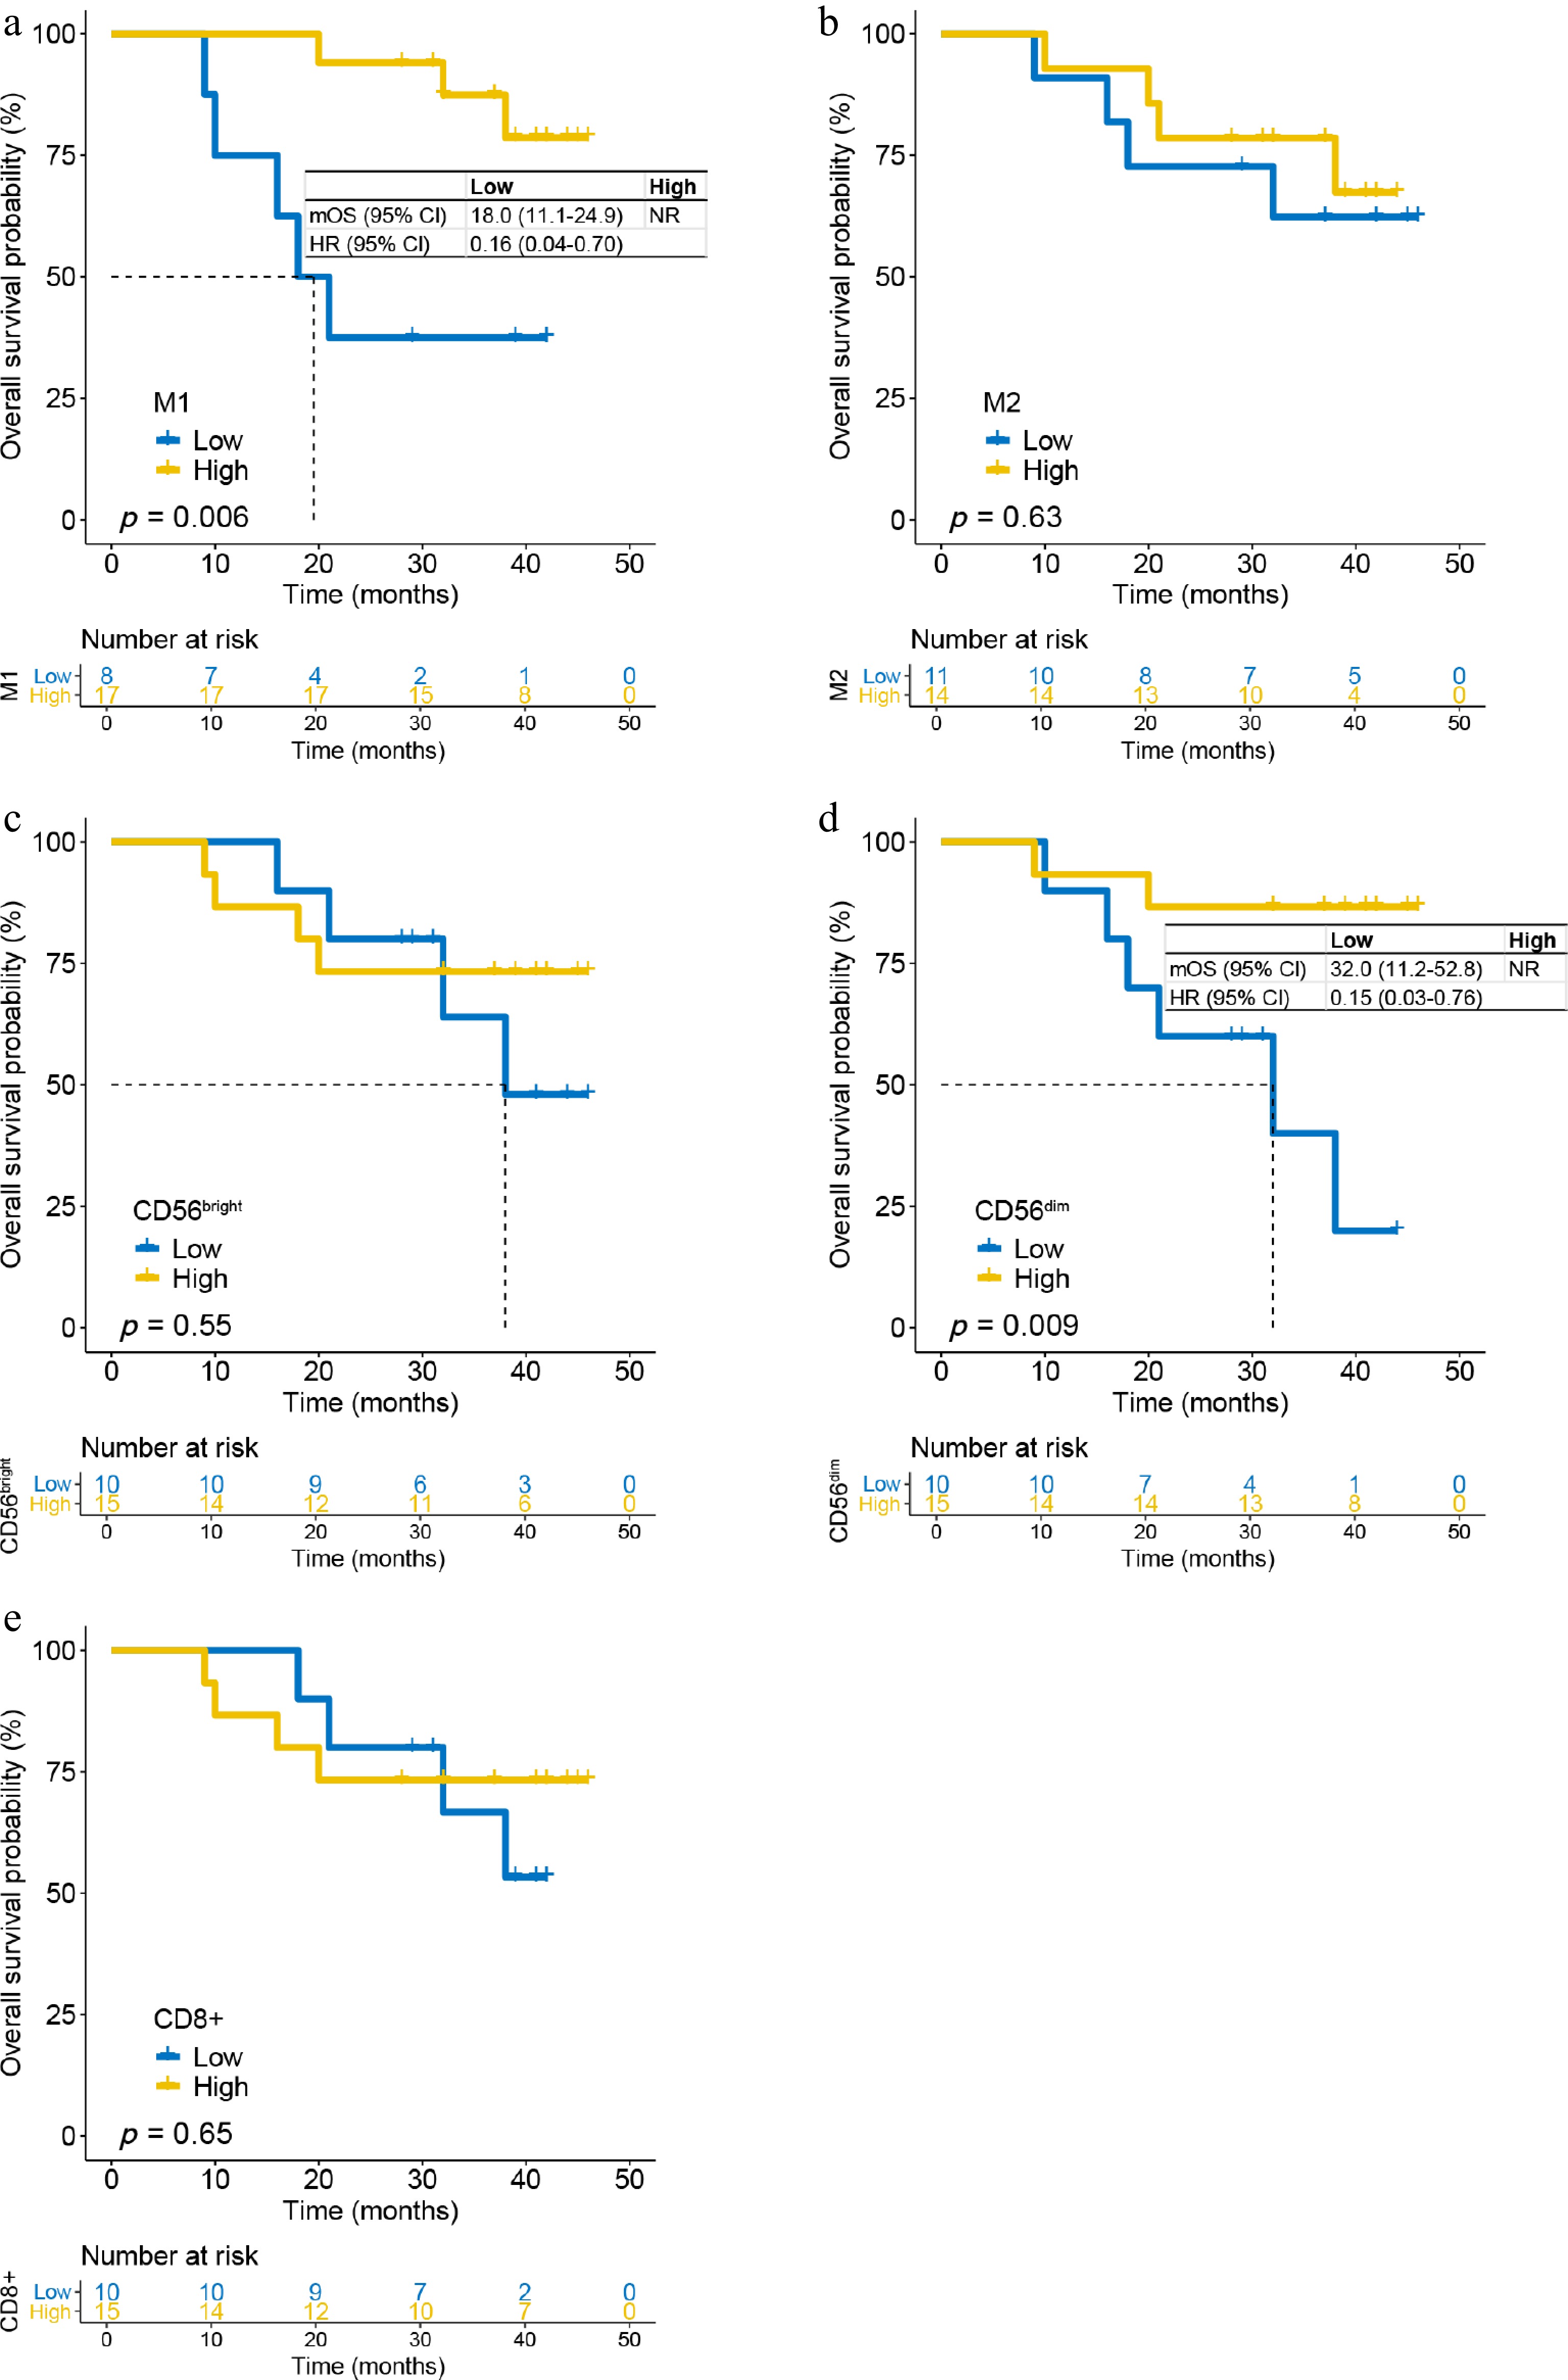
Figure 2.
The density of immune infiltrating cells in the tumor parenchyma and OS in patients receiving adjuvant chemotherapy. (a) M1 cells; (b) M2 cells; (c) CD56bright cells; (d) CD56dim cells; (e) CD8+ T-cells.
-
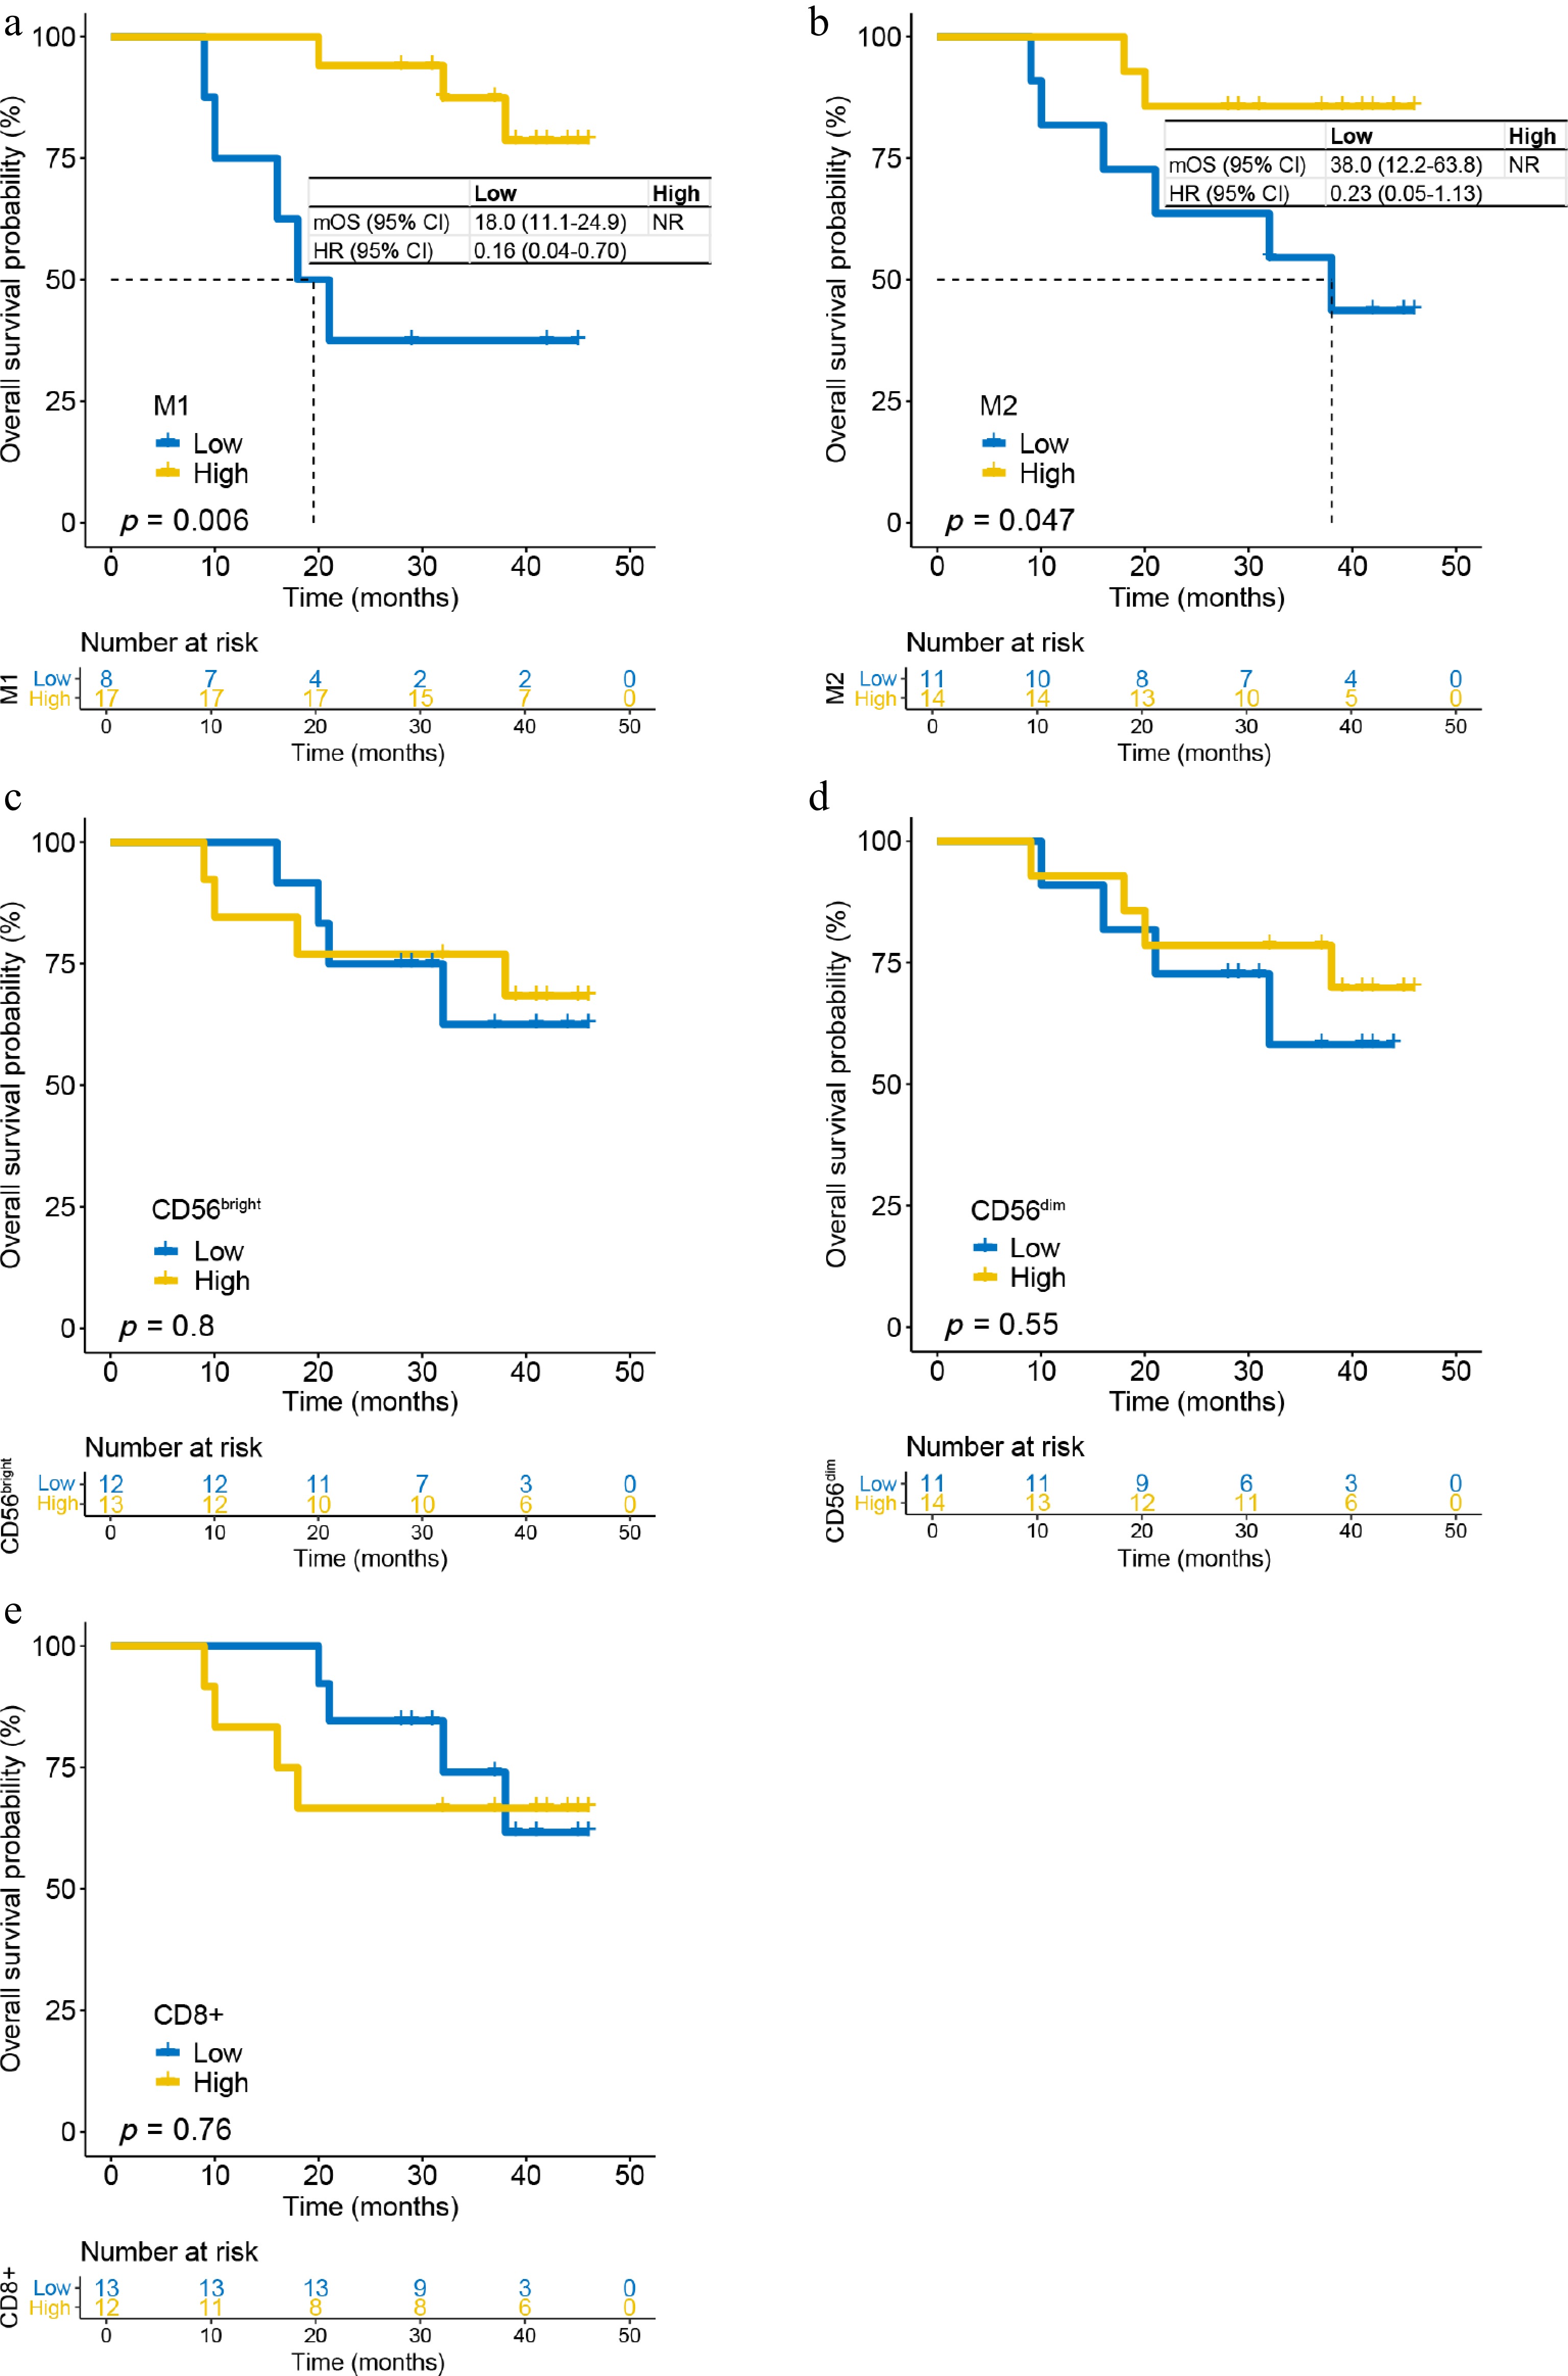
Figure 3.
The density of immune infiltrating cells in the tumor stroma and OS in patients receiving adjuvant chemotherapy. (a) M1 cells; (b) M2 cells; (c) CD56bright cells; (d) CD56dim cells; and (e) CD8+ T-cells.
-
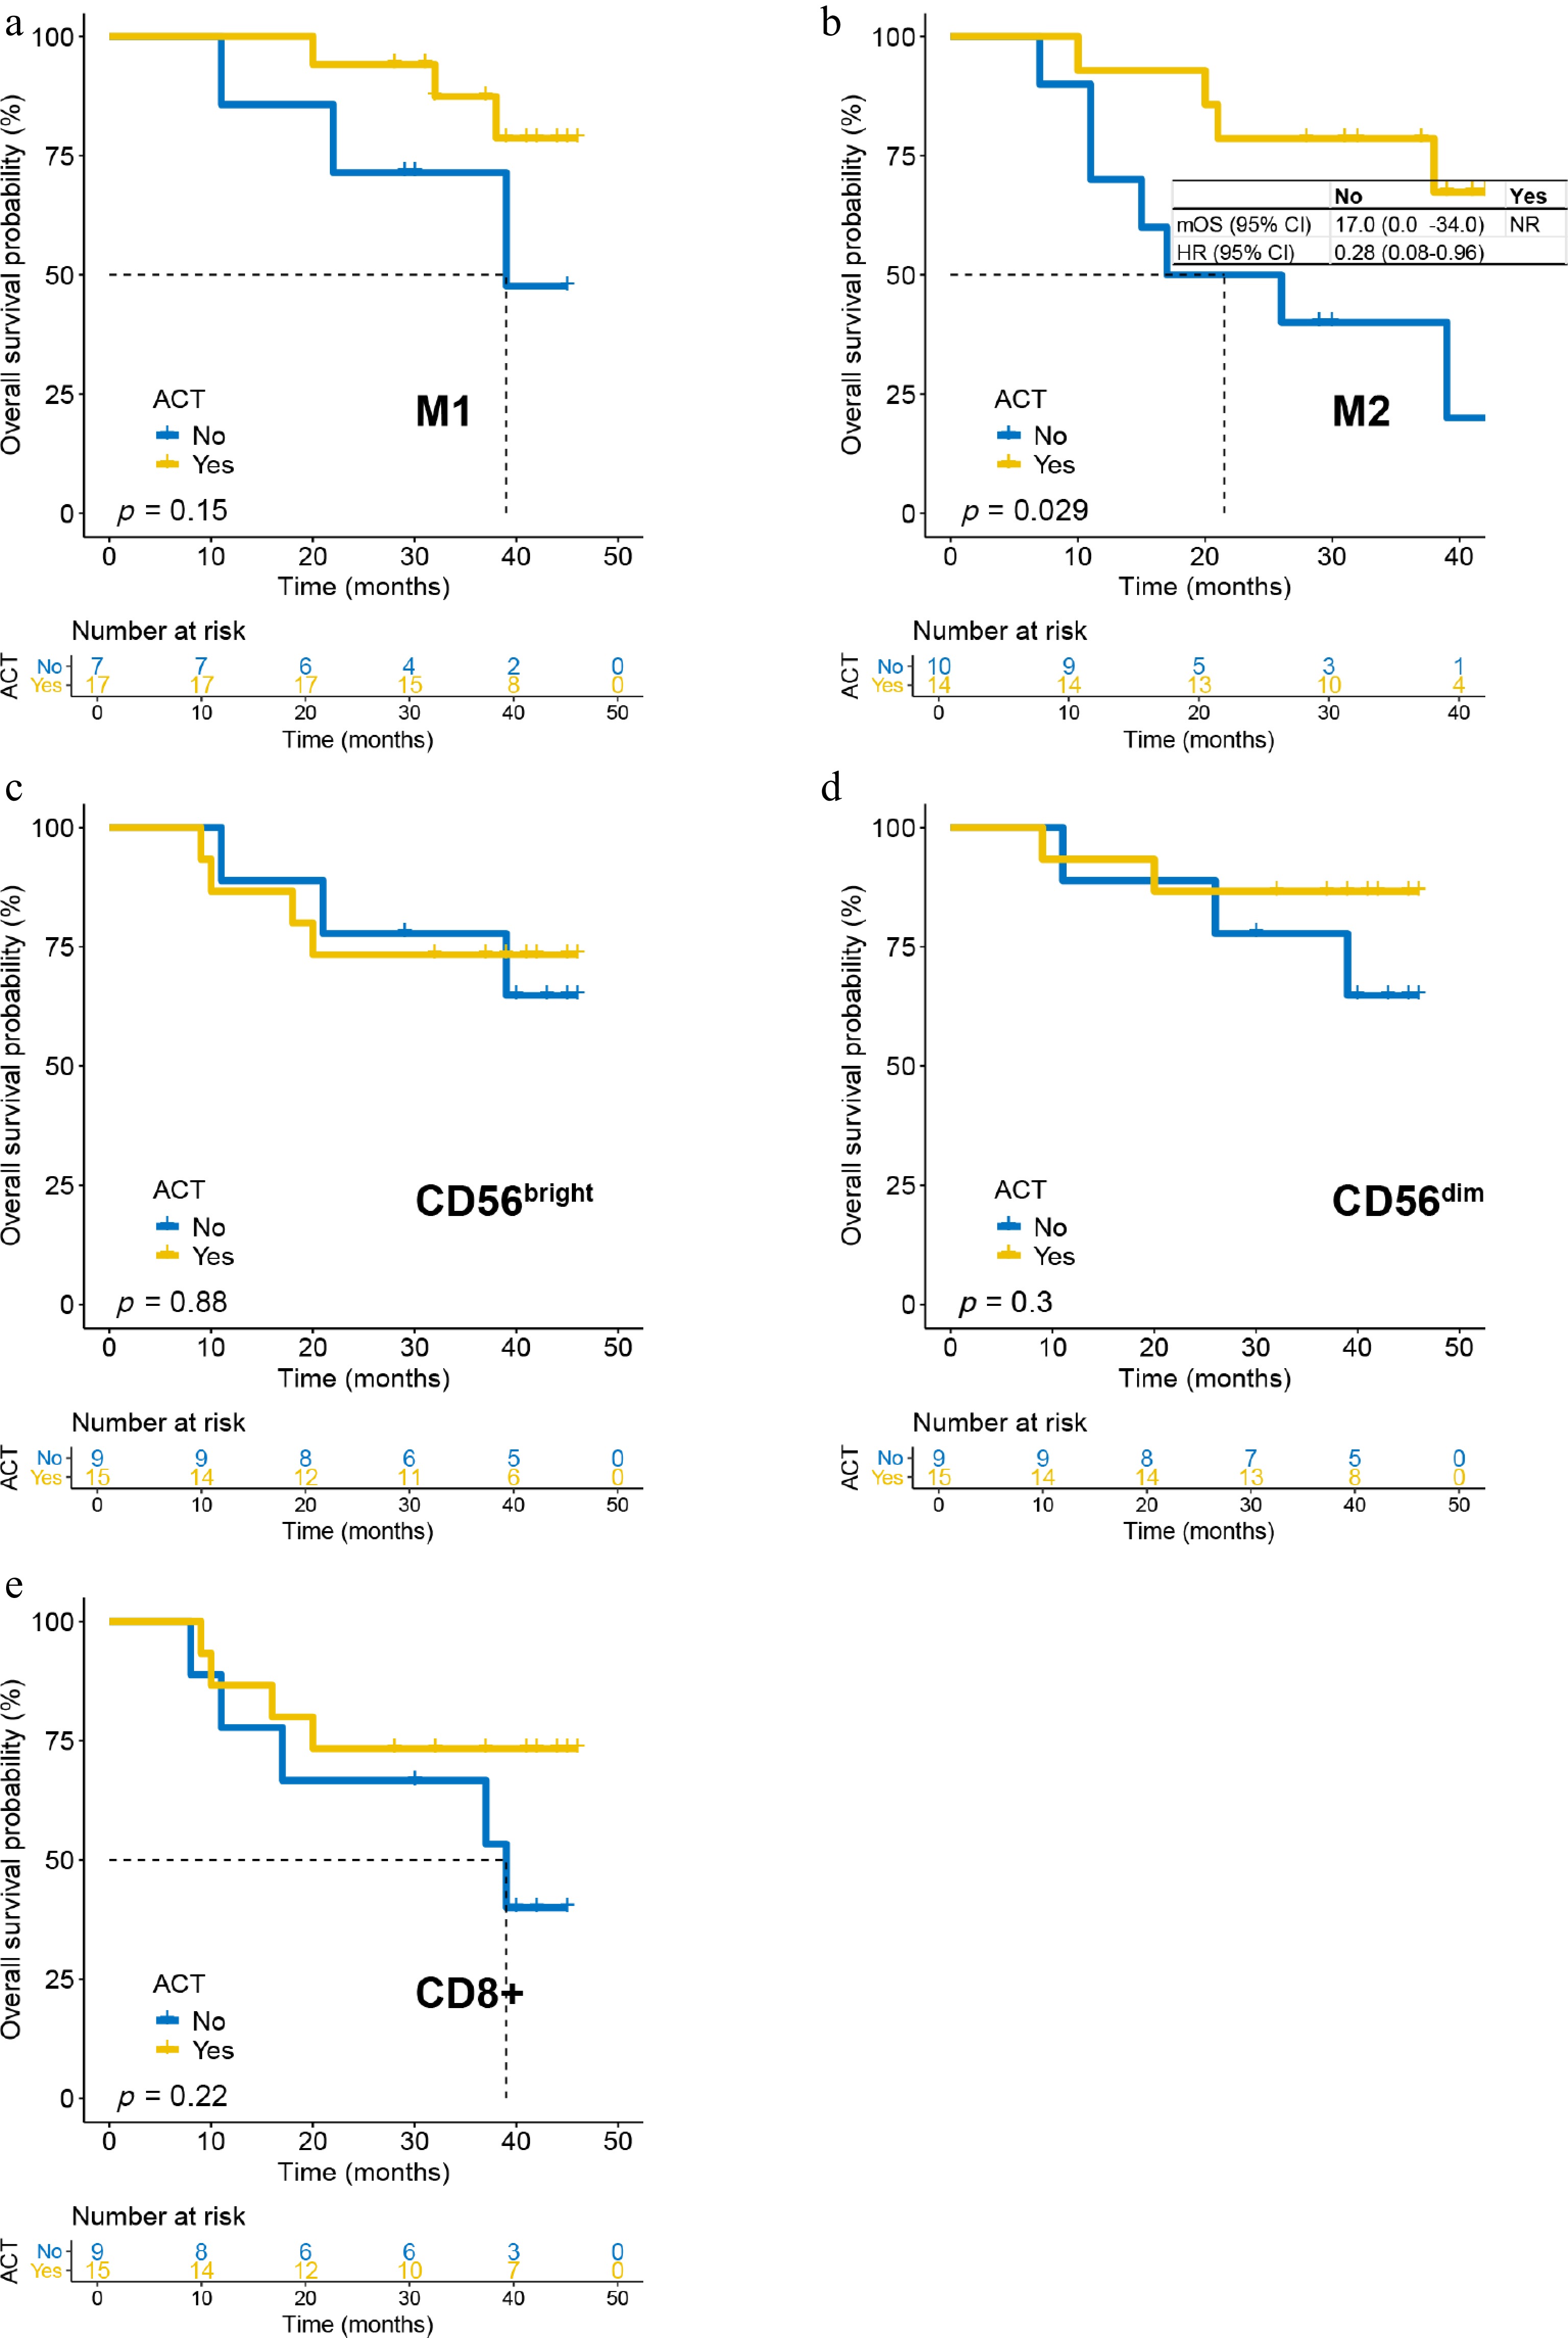
Figure 4.
The impact of ACT on OS in patients with high-density immune infiltrating cells in the tumor parenchyma. (a) M1 cells; (b) M2 cells; (c) CD56bright cells; (d) CD56dim cells; and (e) CD8+ T-cells.
-
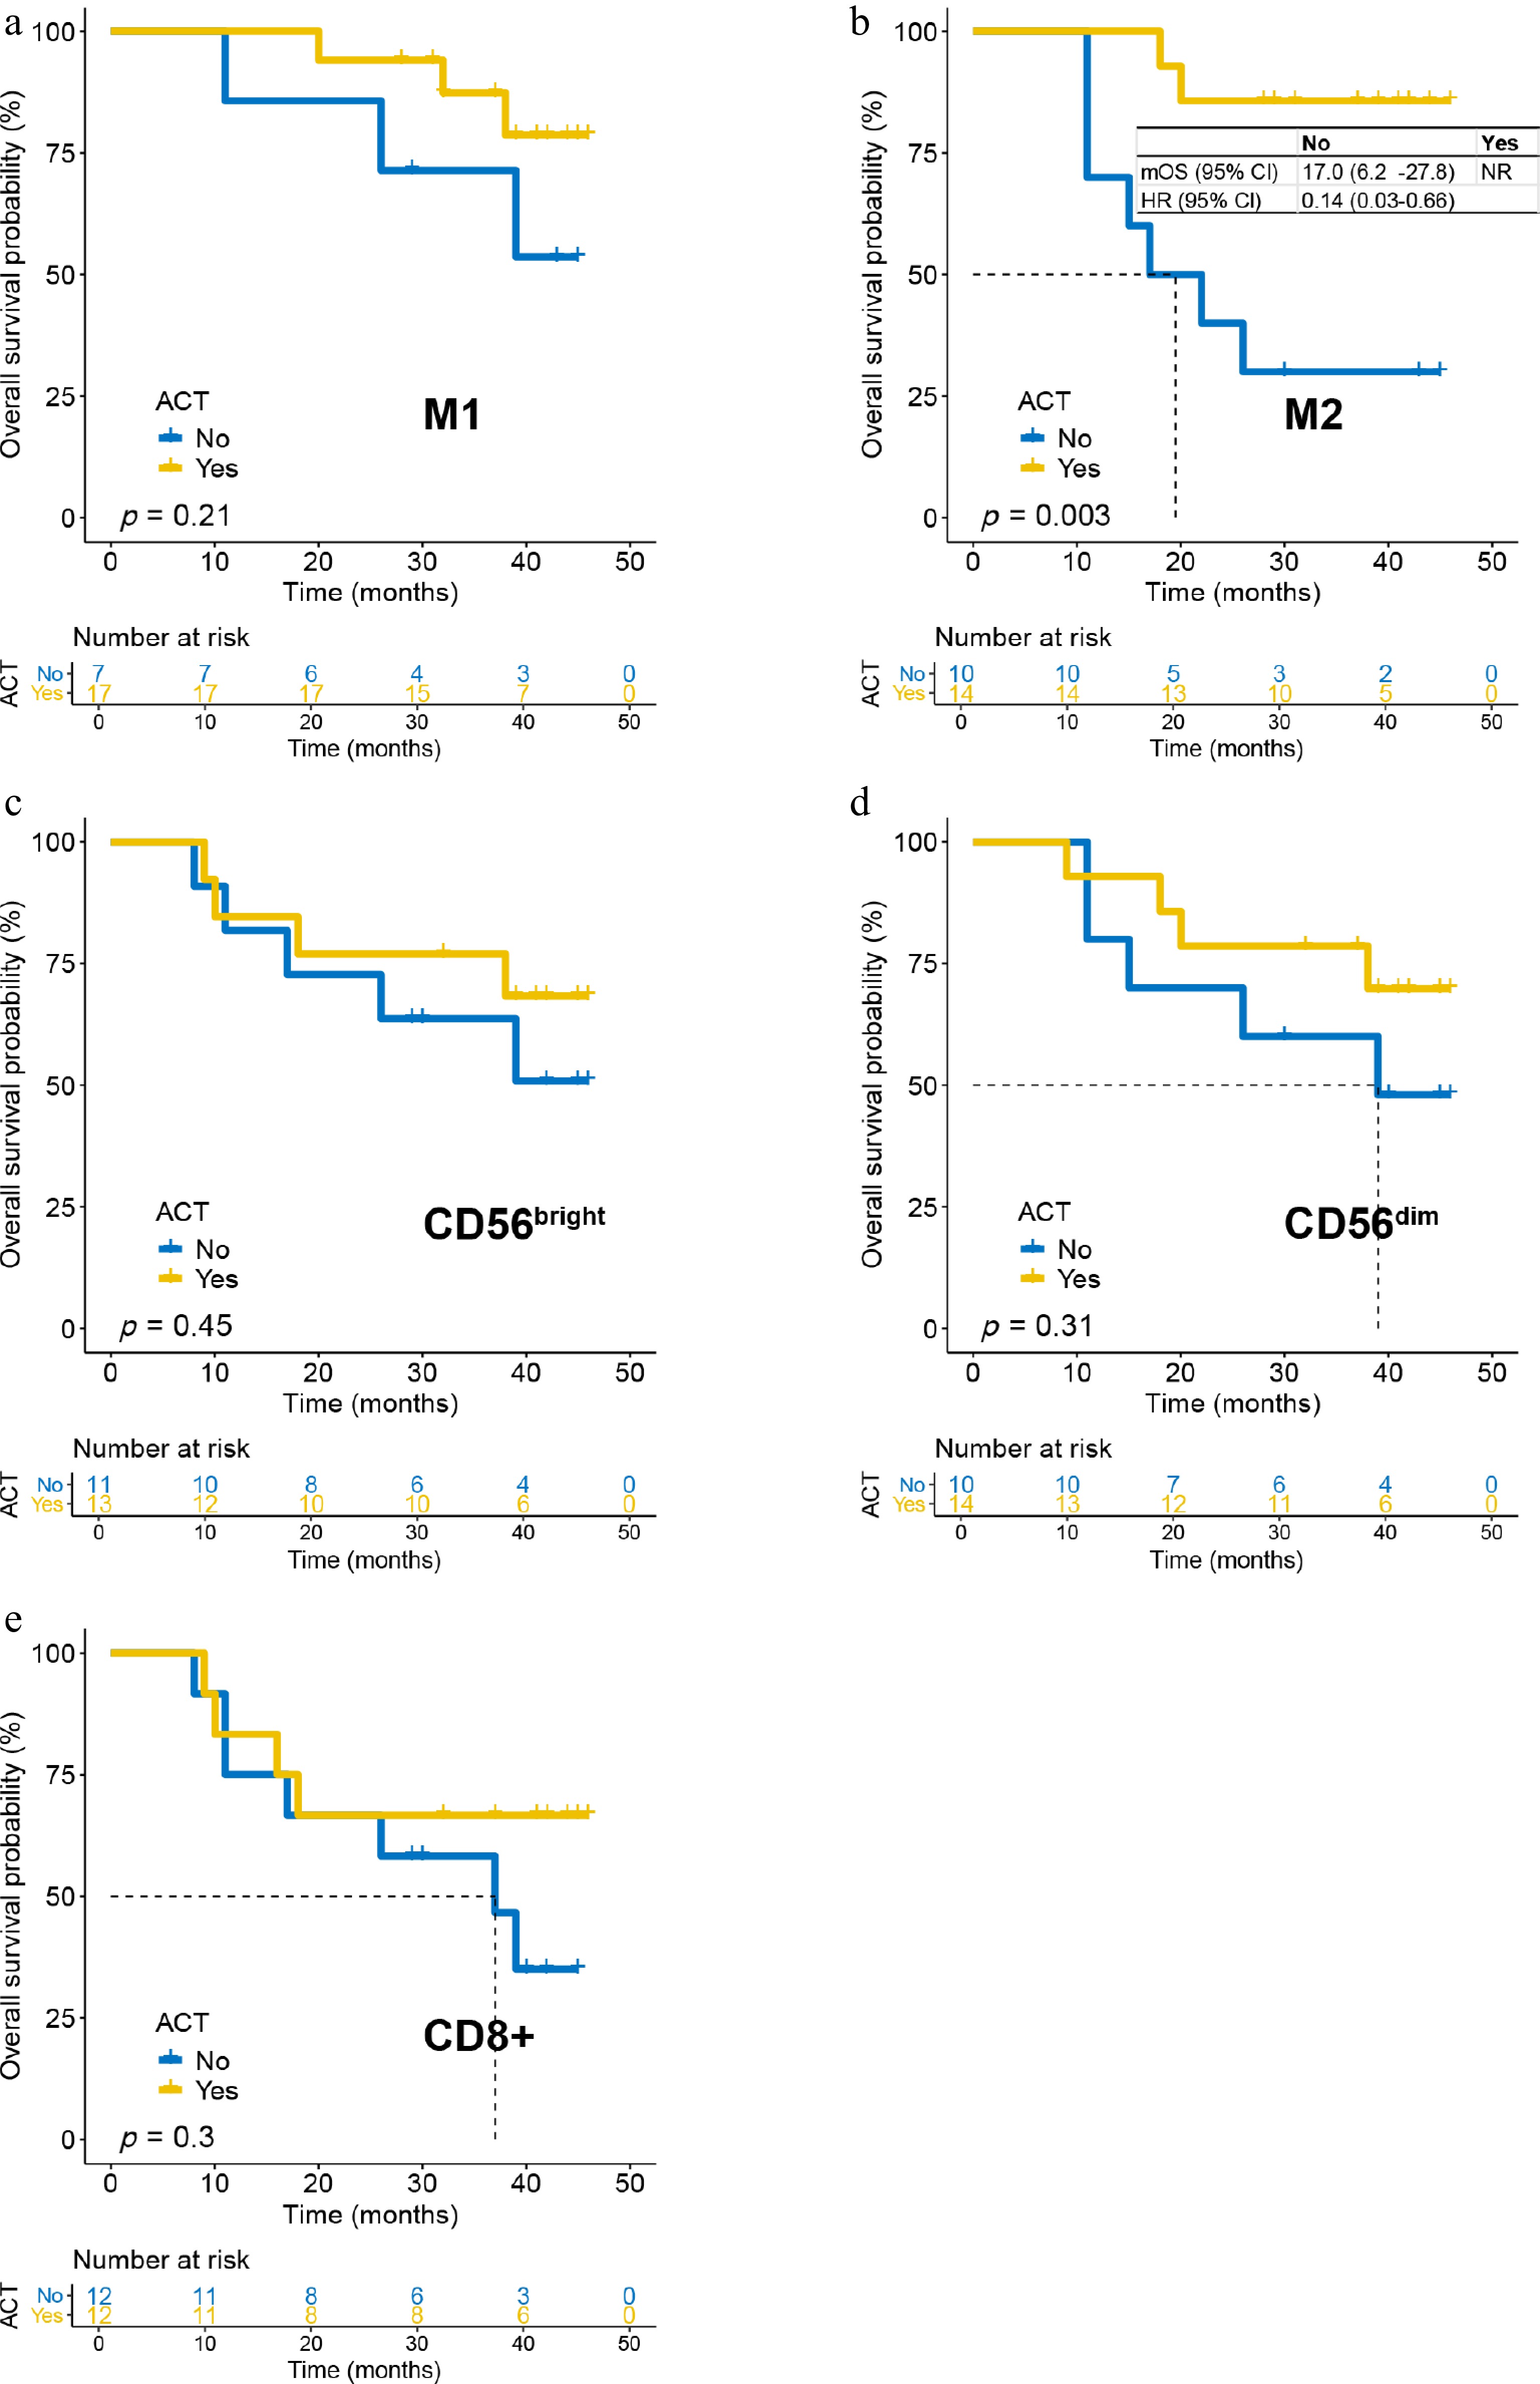
Figure 5.
The impact of adjuvant chemotherapy on overall survival in patients with high-density immune infiltrating cells in the tumor stroma. (a) M1 cells; (b) M2 cells; (c) CD56bright cells; (d) CD56dim cells; and (e) CD8+ T cells.
-
Variable Group Adjuvant chemotherapy p-Value No Yes Age (years) < 65 8 (36.4) 10 (40.0) 0.798 ≥ 65 14 (63.6) 15 (60.0) Sex Female 3 (13.6) 7 (28.0) 0.230 Male 19 (86.4) 18 (72.0) Histological grade I/II 5 (22.7) 5 (20.0) 0.820 III 17 (77.3) 20 (80.0) Stage II 7 (31.8) 6 (24.0) 0.550 III 15 (68.2) 19 (76.0) Table 1.
Patient characteristics.
Figures
(5)
Tables
(1)