-
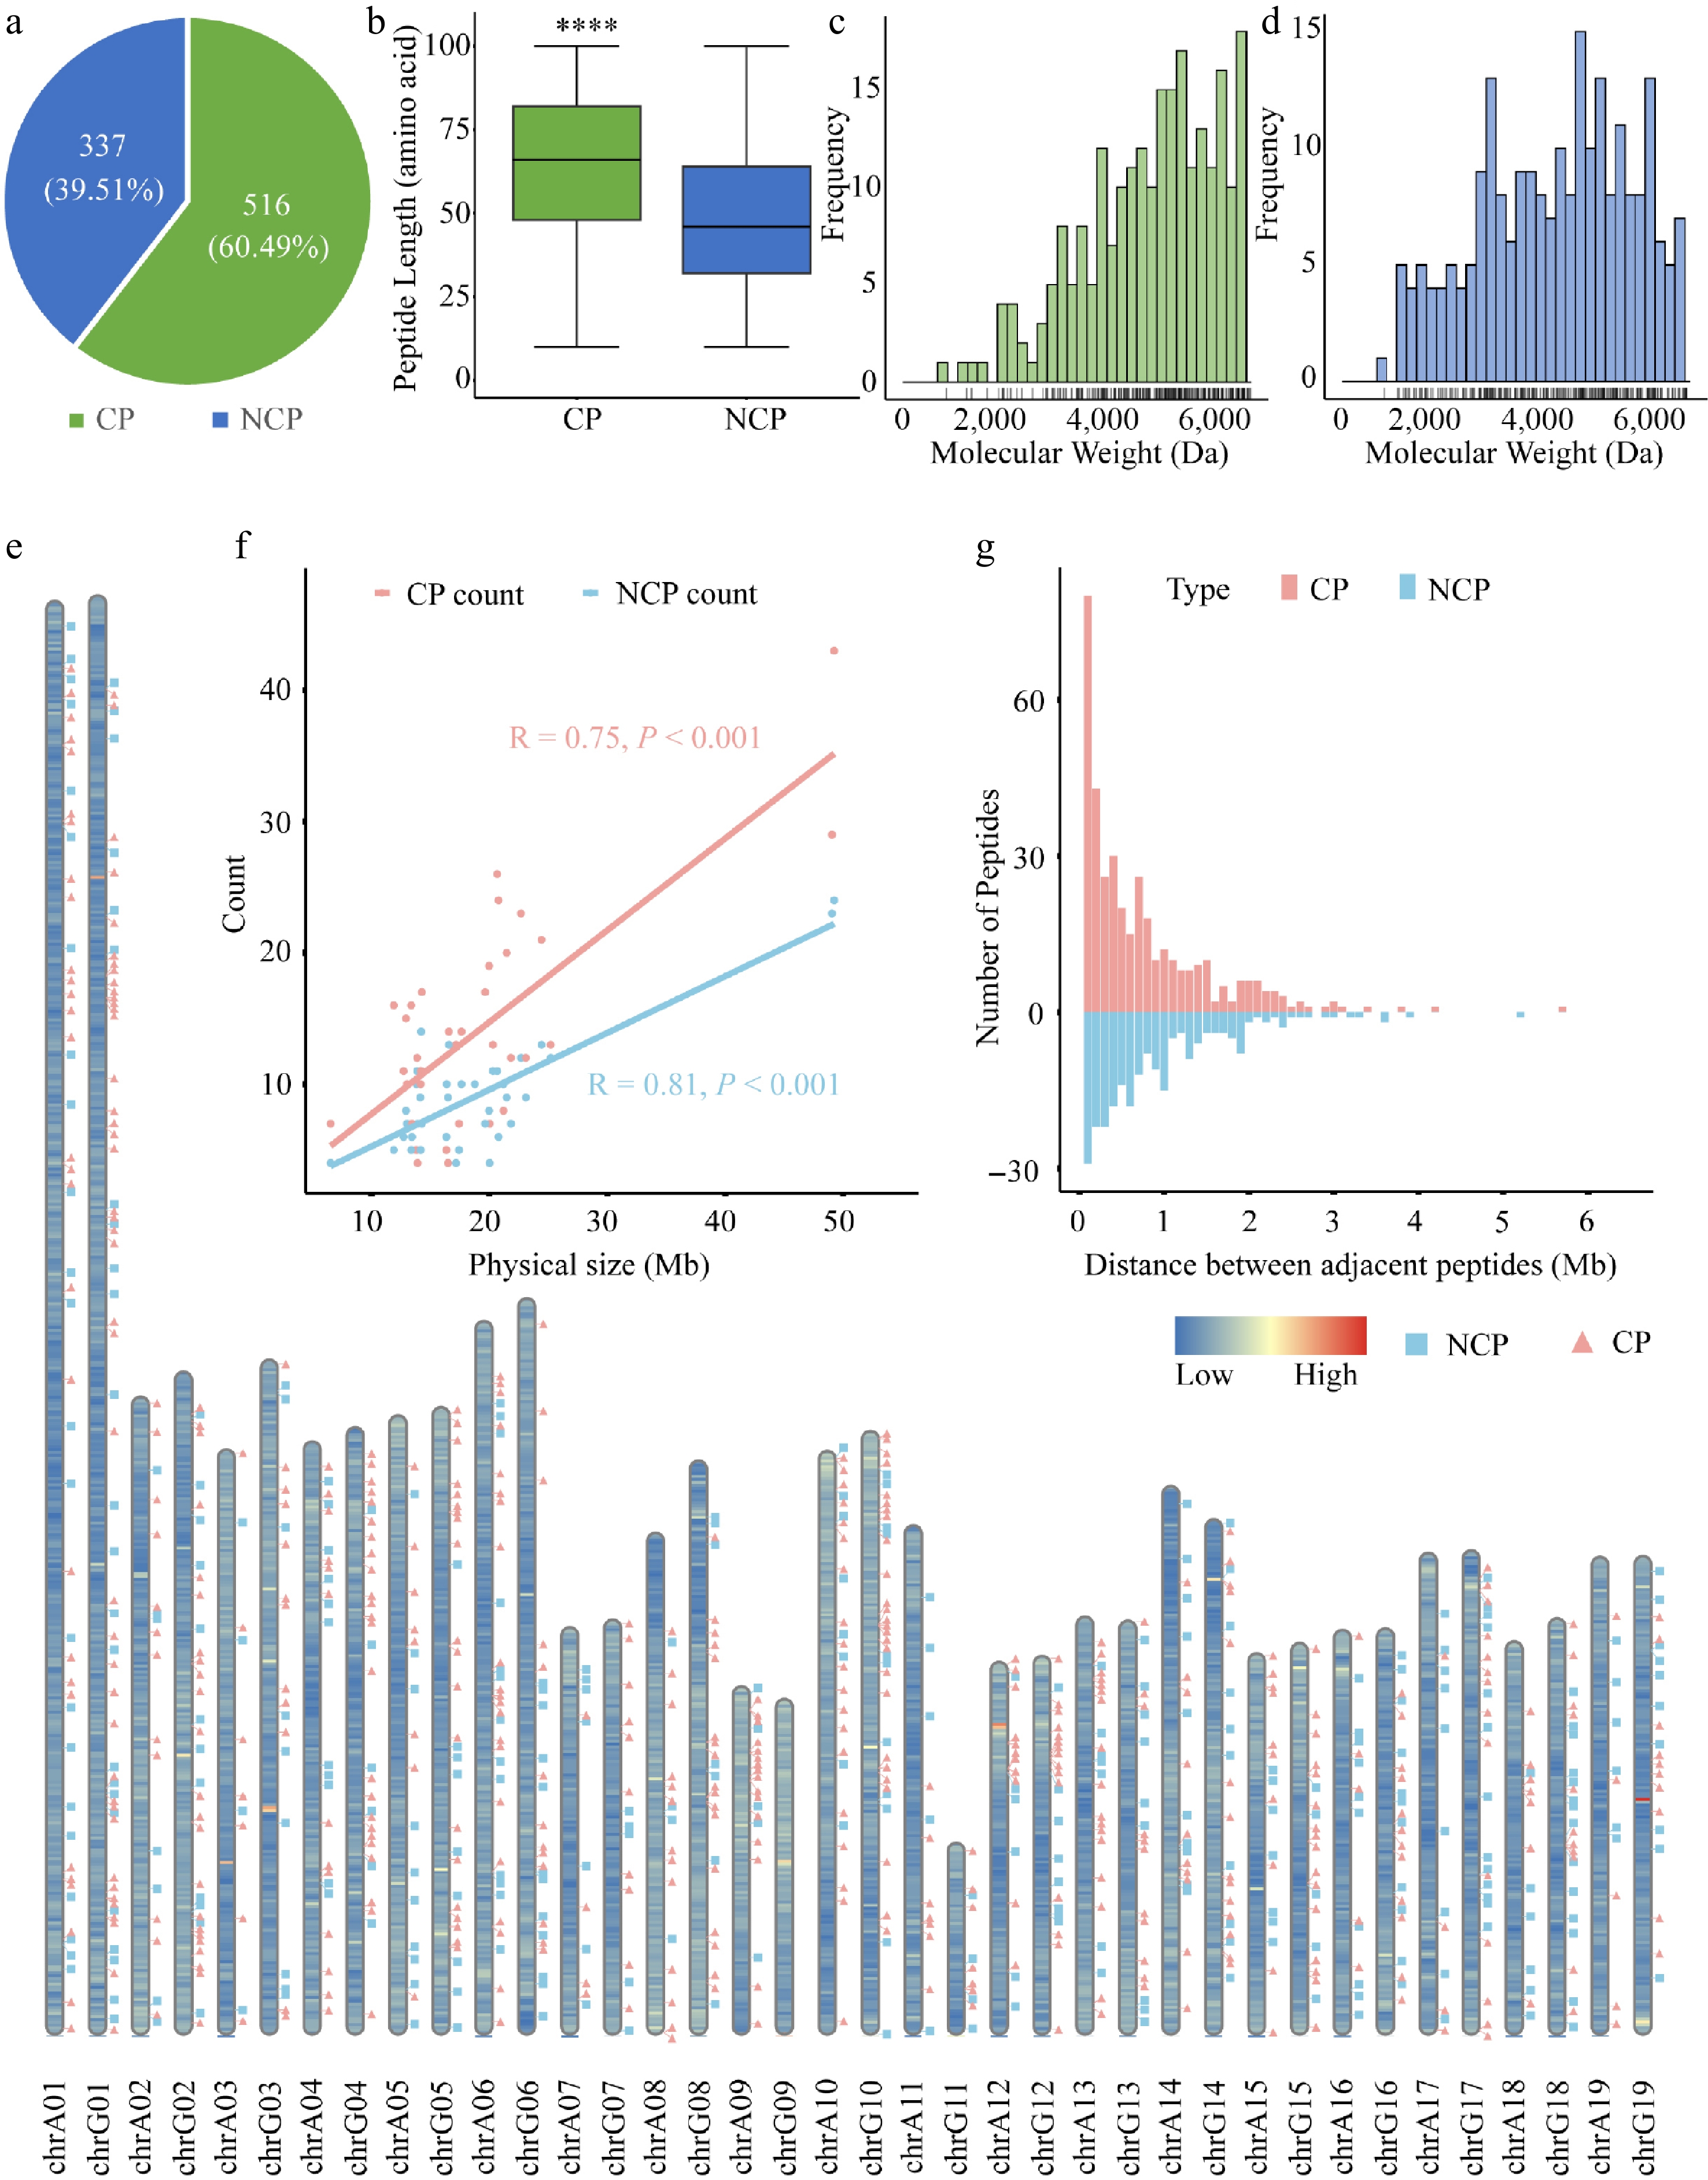
Figure 1.
Overview and distribution of CPs and NCPs identified in poplar 84K. (a) Number of CPs and NCPs in poplar. (b) Length distribution of CPs and NCPs. Boxes represent the interquartile range (IQR, 25th to 75th percentile), whiskers extend to 1.5 × IQR. Wilcoxon's exact test was used for significance testing; p < 0.05. Molecular weight distribution of (c) CPs, and (d) NCPs, with rug plots indicating individual data points. (e) Genome-wide distribution of CPs (pink squares) and NCPs (green triangles) across chromosomes. Background color reflects gene density (blue: low; red: high). (f) Correlation between CP or NCP counts and chromosome length (Pearson's R: CPs = 0.75, p = 1.2e–07; NCPs = 0.81, p = 8.4e–10). (g) Distribution of distances between adjacent peptides.
-
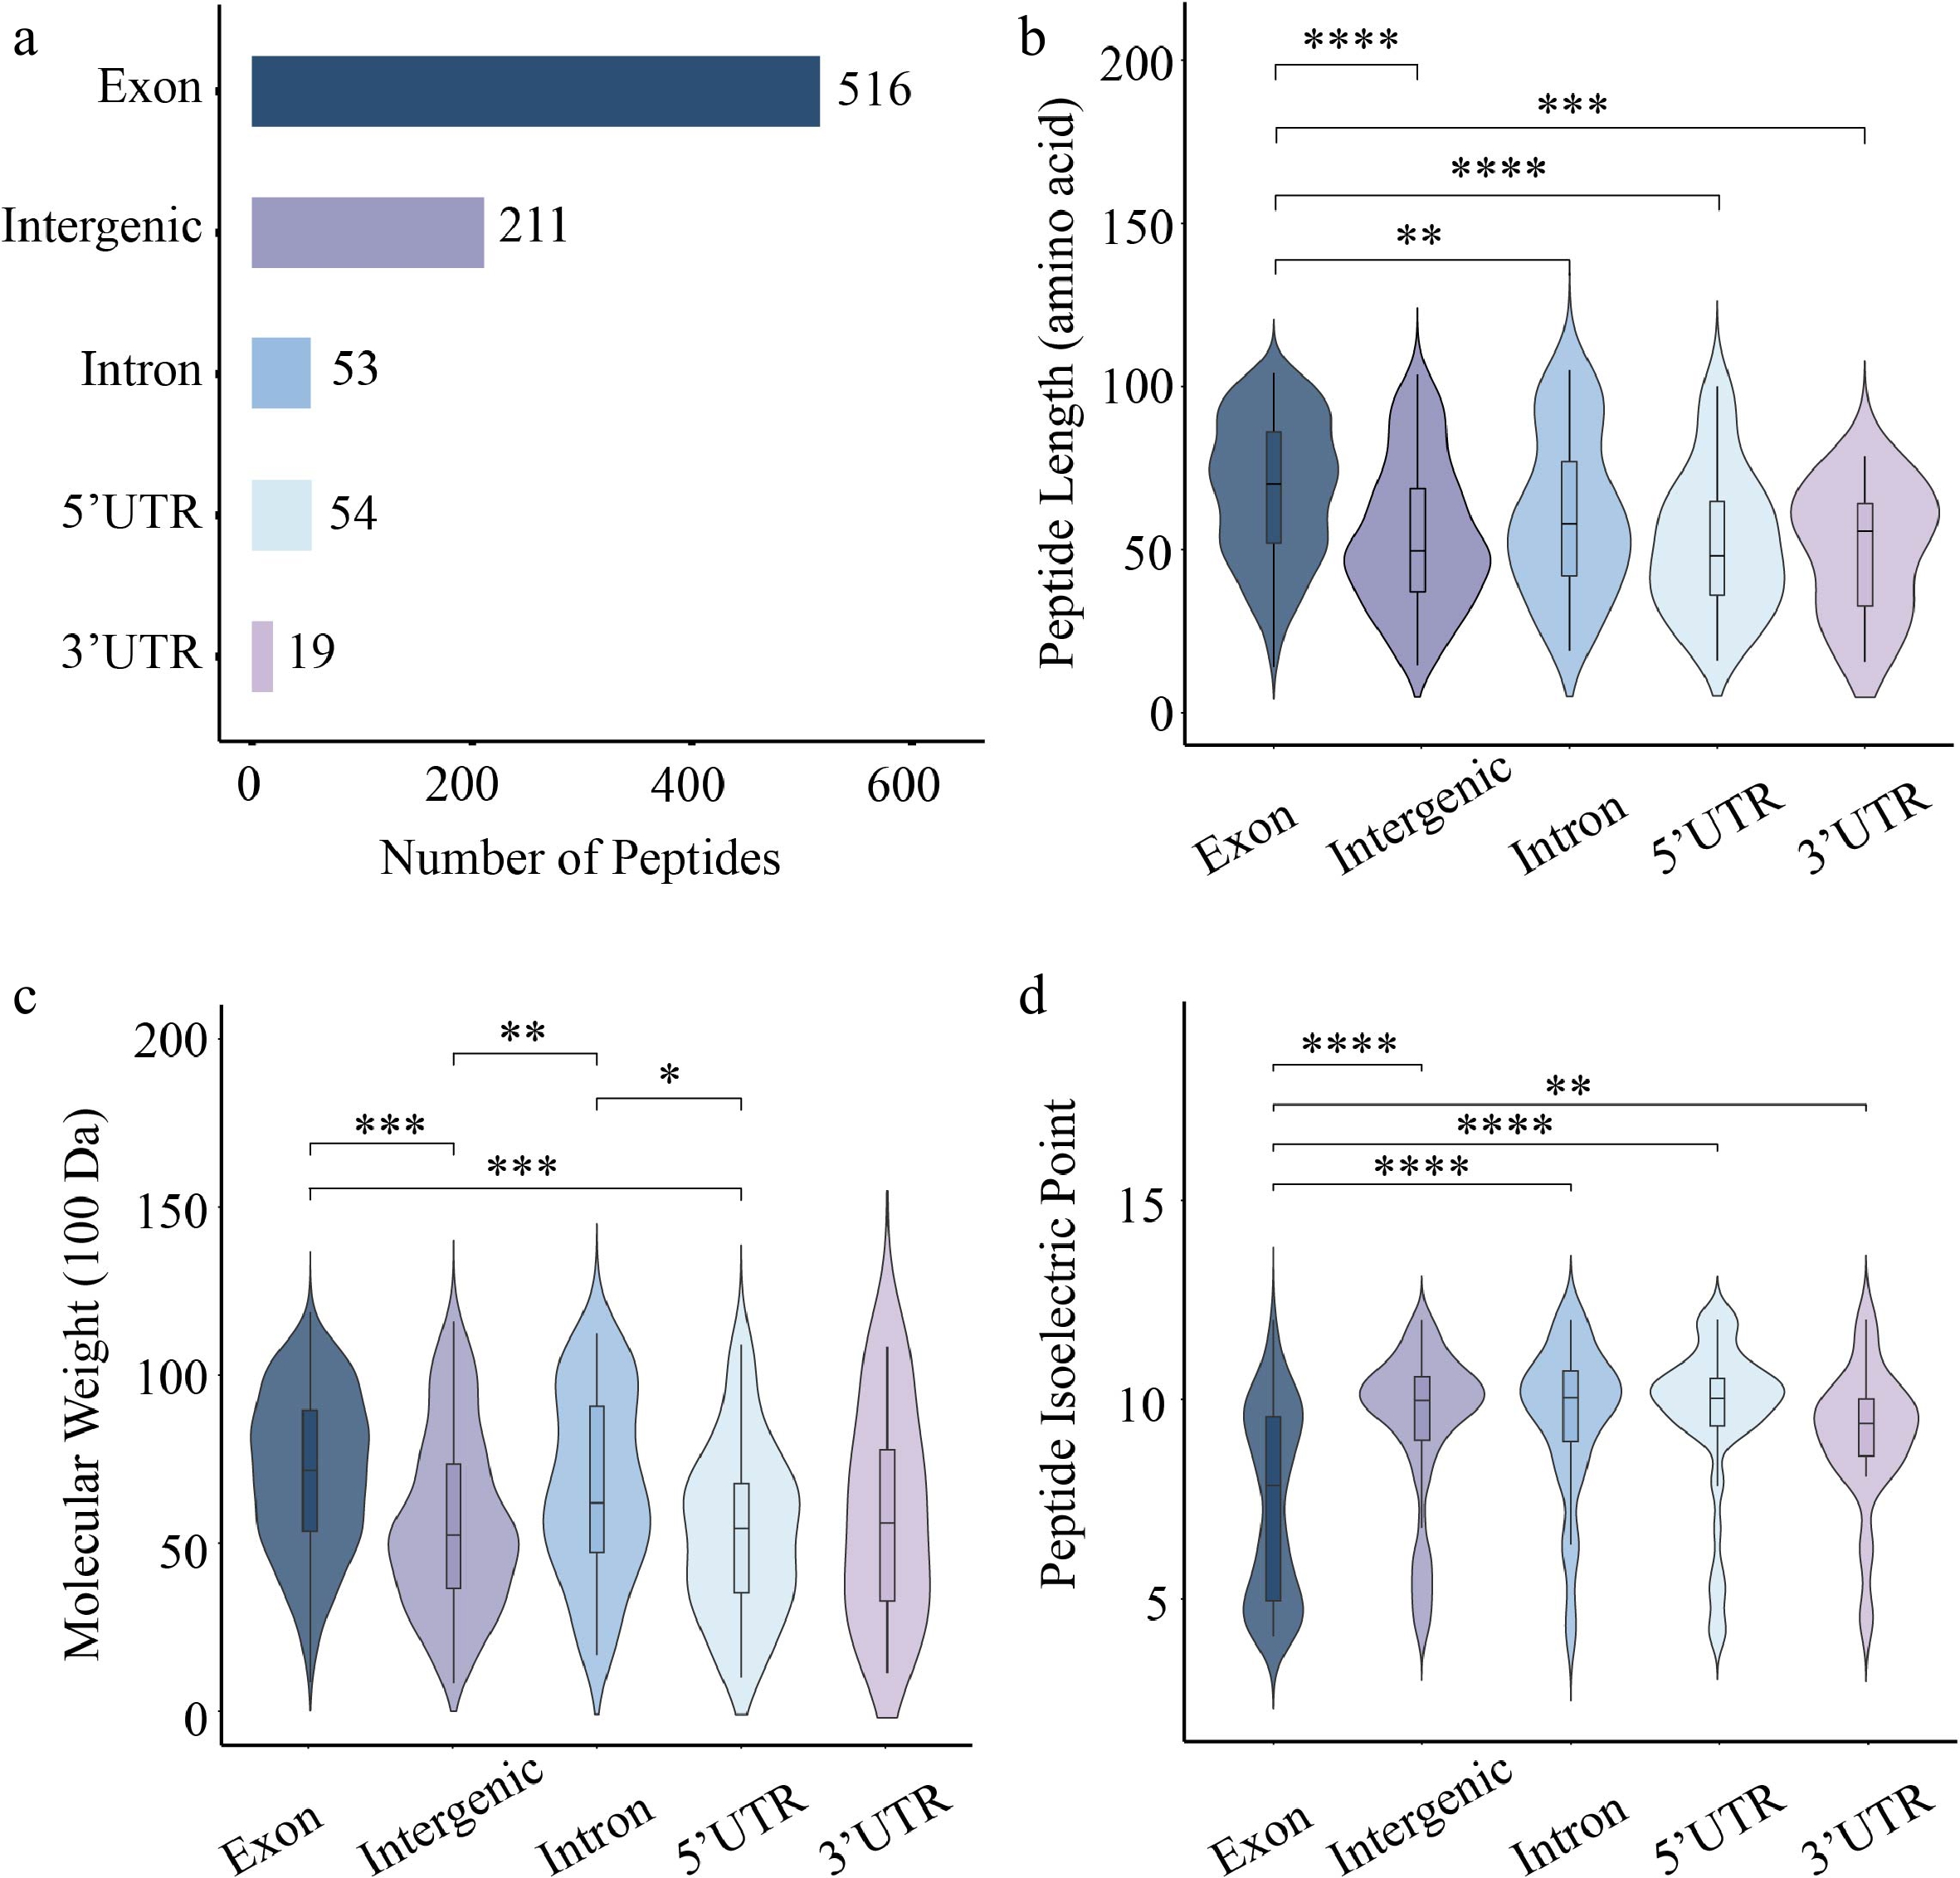
Figure 2.
Characterization of 84K poplar peptides identified from exonic, UTR, intronic, and intergenic regions. (a) Number of peptides derived from different gene elements. Violin plots showing the distribution of (b) peptide length, (c) molecular weight, and (d) isoelectric point. Each plot combines a boxplot and a kernel density curve. Statistical significance was assessed using the Wilcoxon test (* p < 0.05, ** p < 0.01, *** p < 0.001, **** p < 0.0001).
-
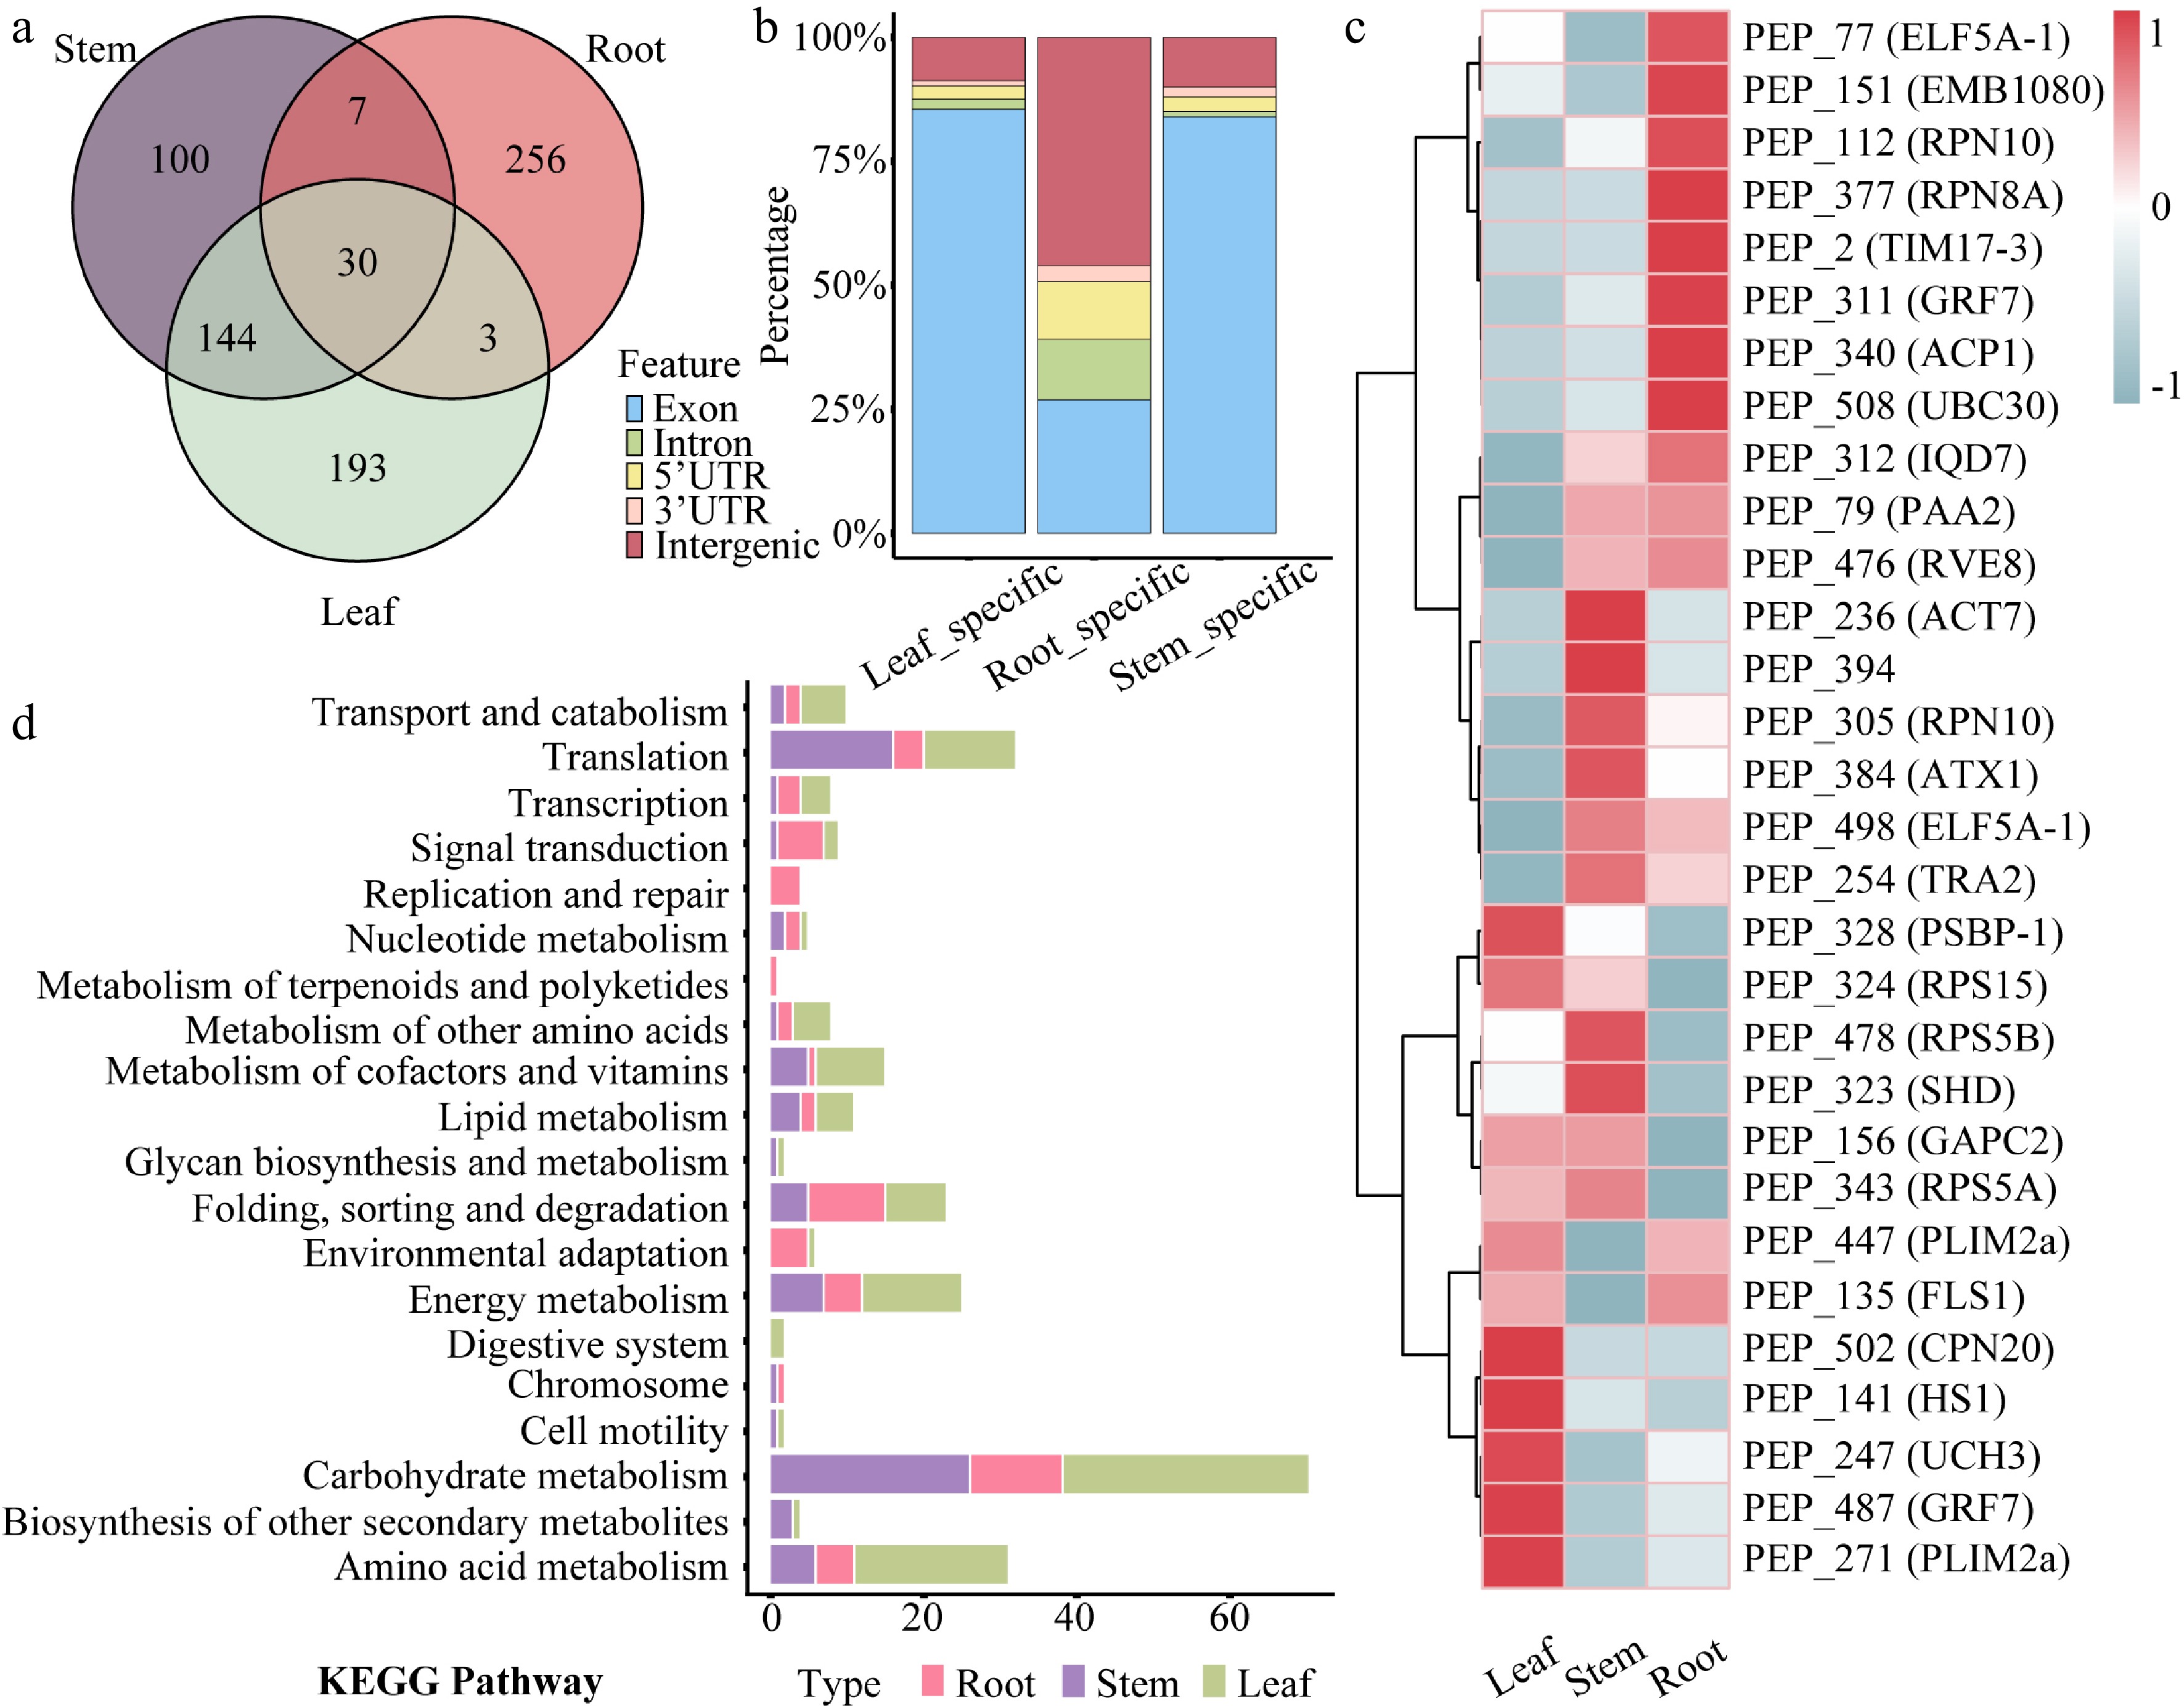
Figure 3.
Tissue expression patterns of peptides in 84K poplar. (a) Venn diagram showing the number and overlap of tissue-specific peptides identified in roots, stems, and leaves. (b) Stacked bar chart displaying the percentage distribution of genomic origins of peptides with tissue-specific expression. (c) Heatmap presenting the expression profiles of 30 commonly expressed peptides across root, stem, and leaf tissues. Rows correspond to peptides, and columns to tissues. (d) KEGG pathway enrichment analysis of genes harboring tissue-specific peptide-associated ORFs. Bar lengths indicate the number of enriched genes, and bar colors represent corresponding tissues.
-
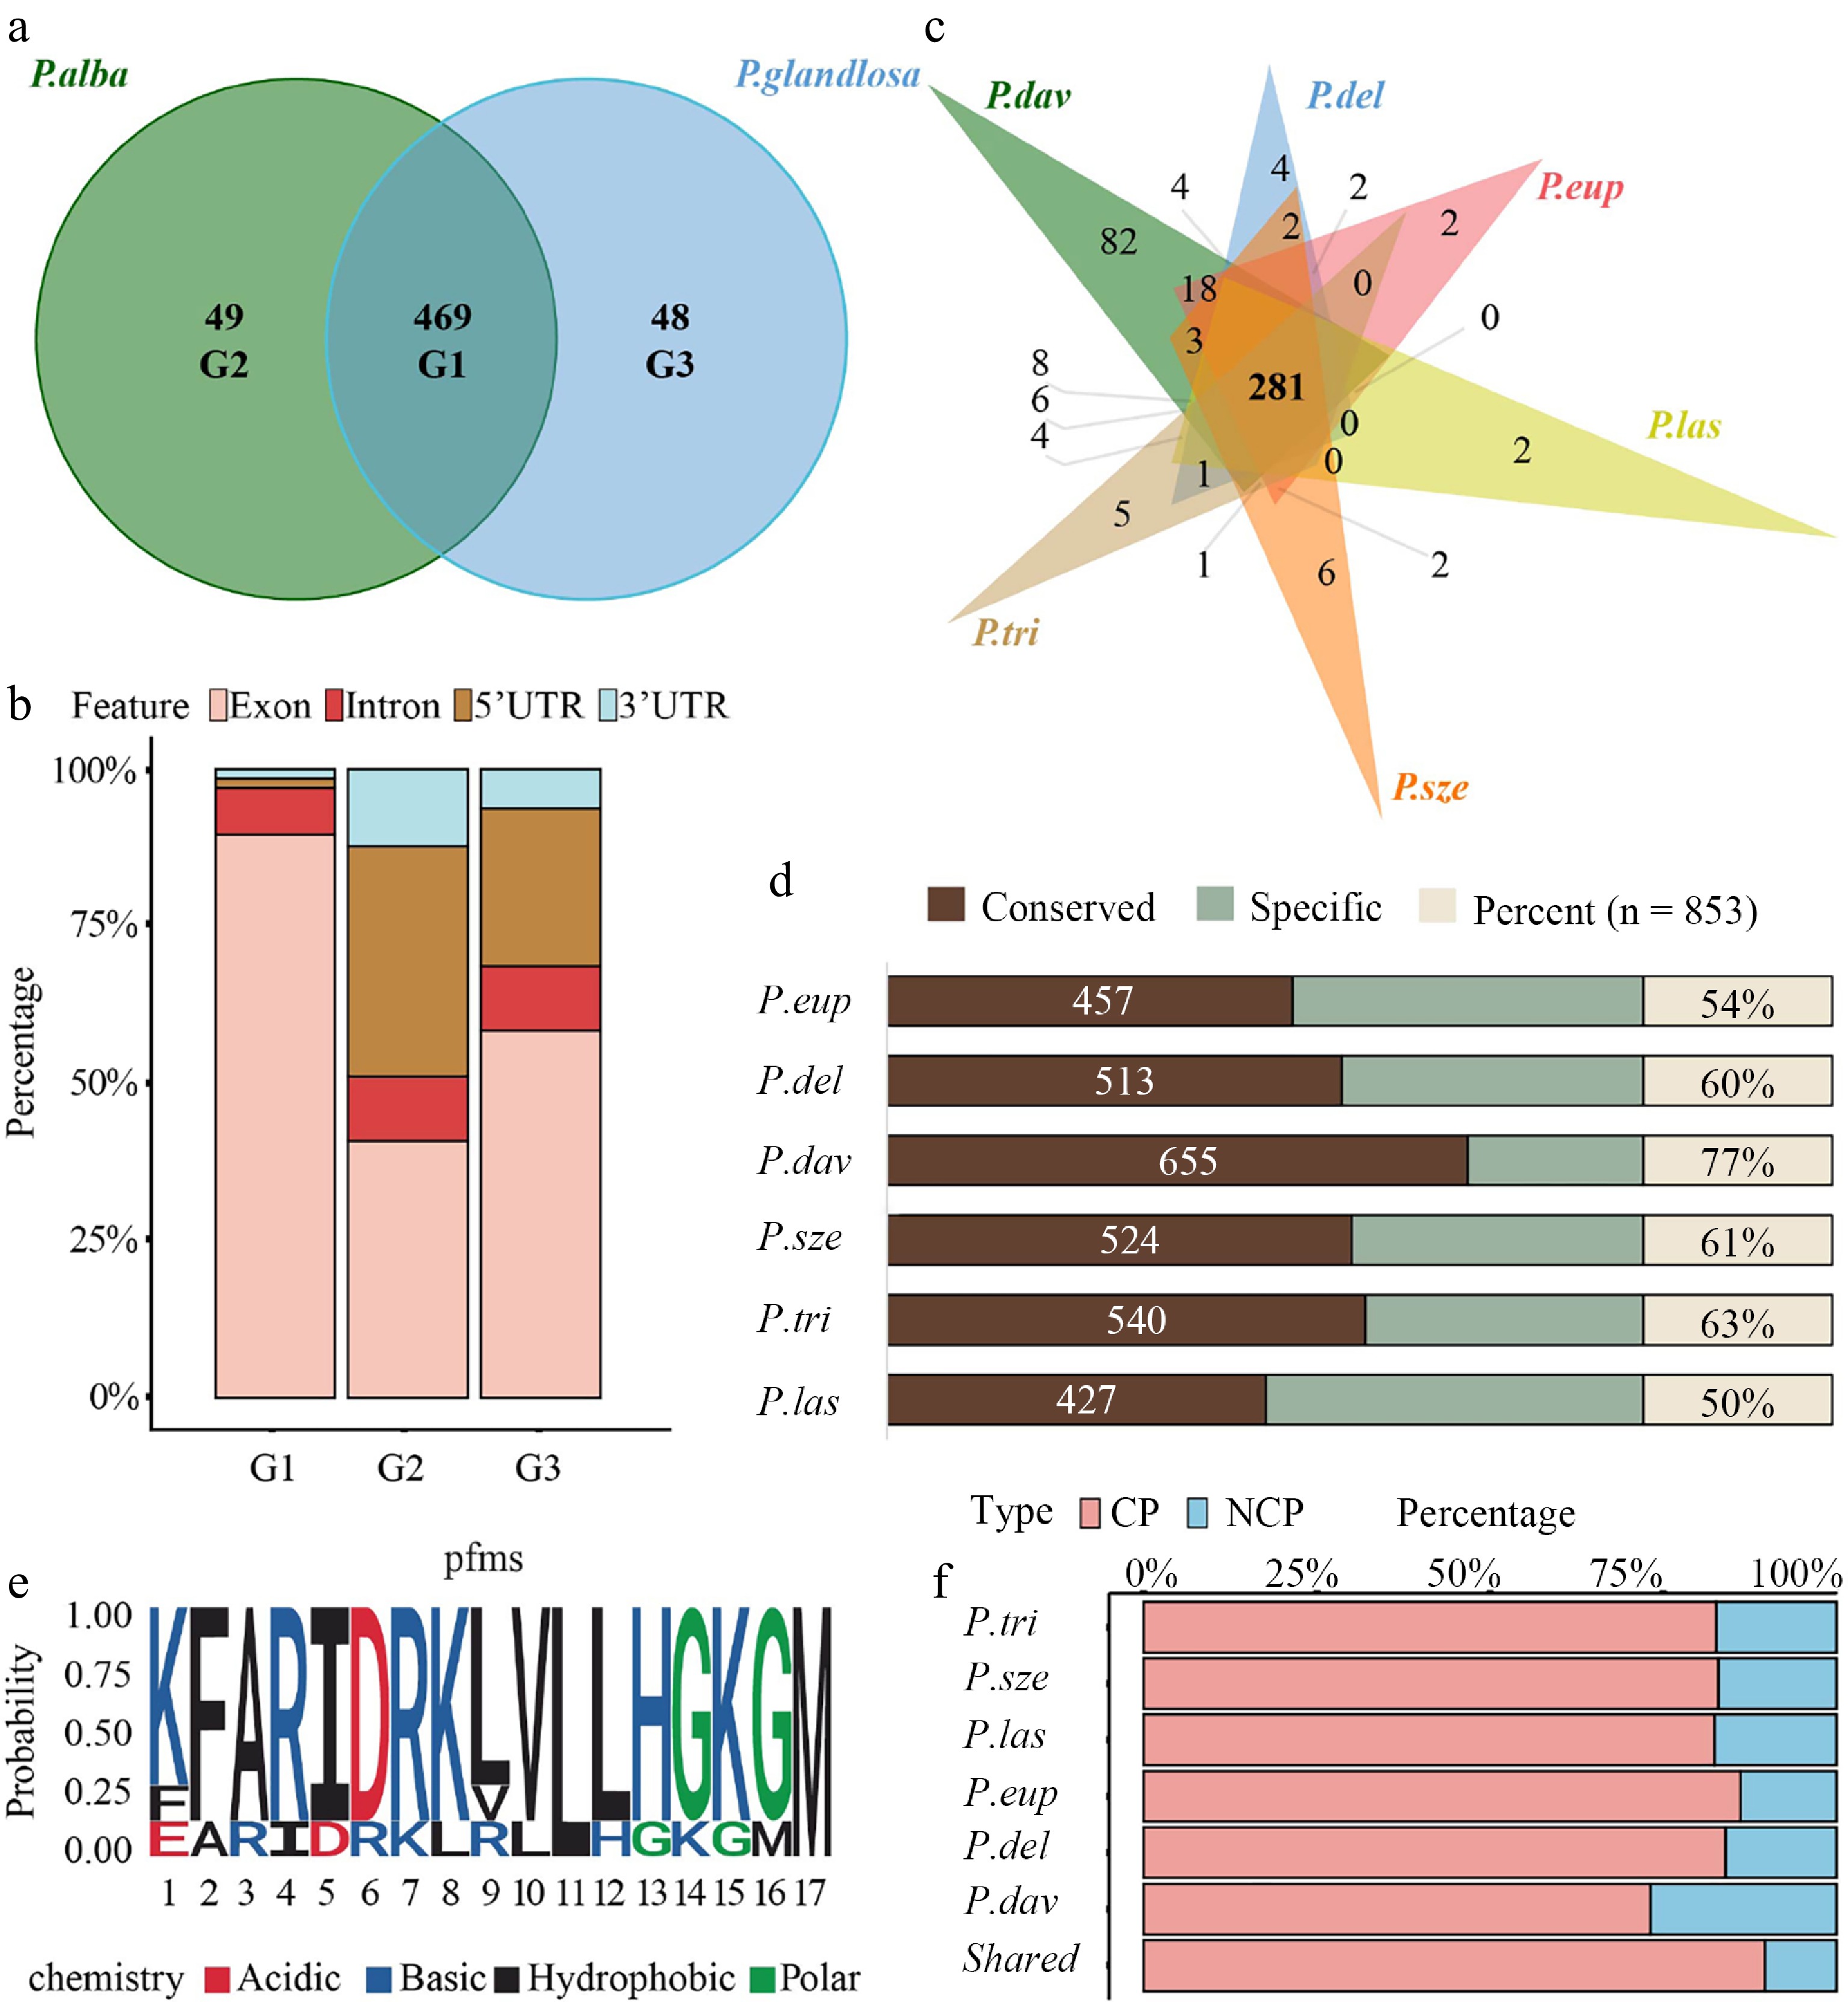
Figure 4.
Allele-specific peptide mapping and cross-species conservation analysis. (a) Venn diagram illustrating the number and overlap of peptides identified through reciprocal mapping to the maternal (P. alba) and paternal (P. glandulosa) genomes. Group 1 (G1) represents peptides common to both parents, while Group 2 (G2) and Group 3 (G3) correspond to parent-specific peptides to P. alba and P. glandulosa, respectively. (b) Stacked bar chart showing the genomic origins of peptides across allelic categories, classified into exonic, 5′ UTR, intronic, and intergenic regions. (c) Venn diagram depicting the overlap of peptides identified in 84K poplar and six other Populus species (P. euphratica, P. deltoides, P. davidiana, P. szechuanica, P. trichocarpa, and P. lasiocarpa). (d) Bar chart showing the proportion of 84K poplar peptides conserved across the six Populus species. Conservation was assessed based on shared peptide sequences between 84K and each species. (e) Sequence LOGO of the PEP_629. Letters indicate amino acids, with height representing conservation levels; red indicates acidic, blue alkaline, black hydrophobic, and green polar amino acids. (f) CP and NCP percentage of identified 84K poplar peptides conserved in each Populus species and in all Populus species.
Figures
(4)
Tables
(0)