-
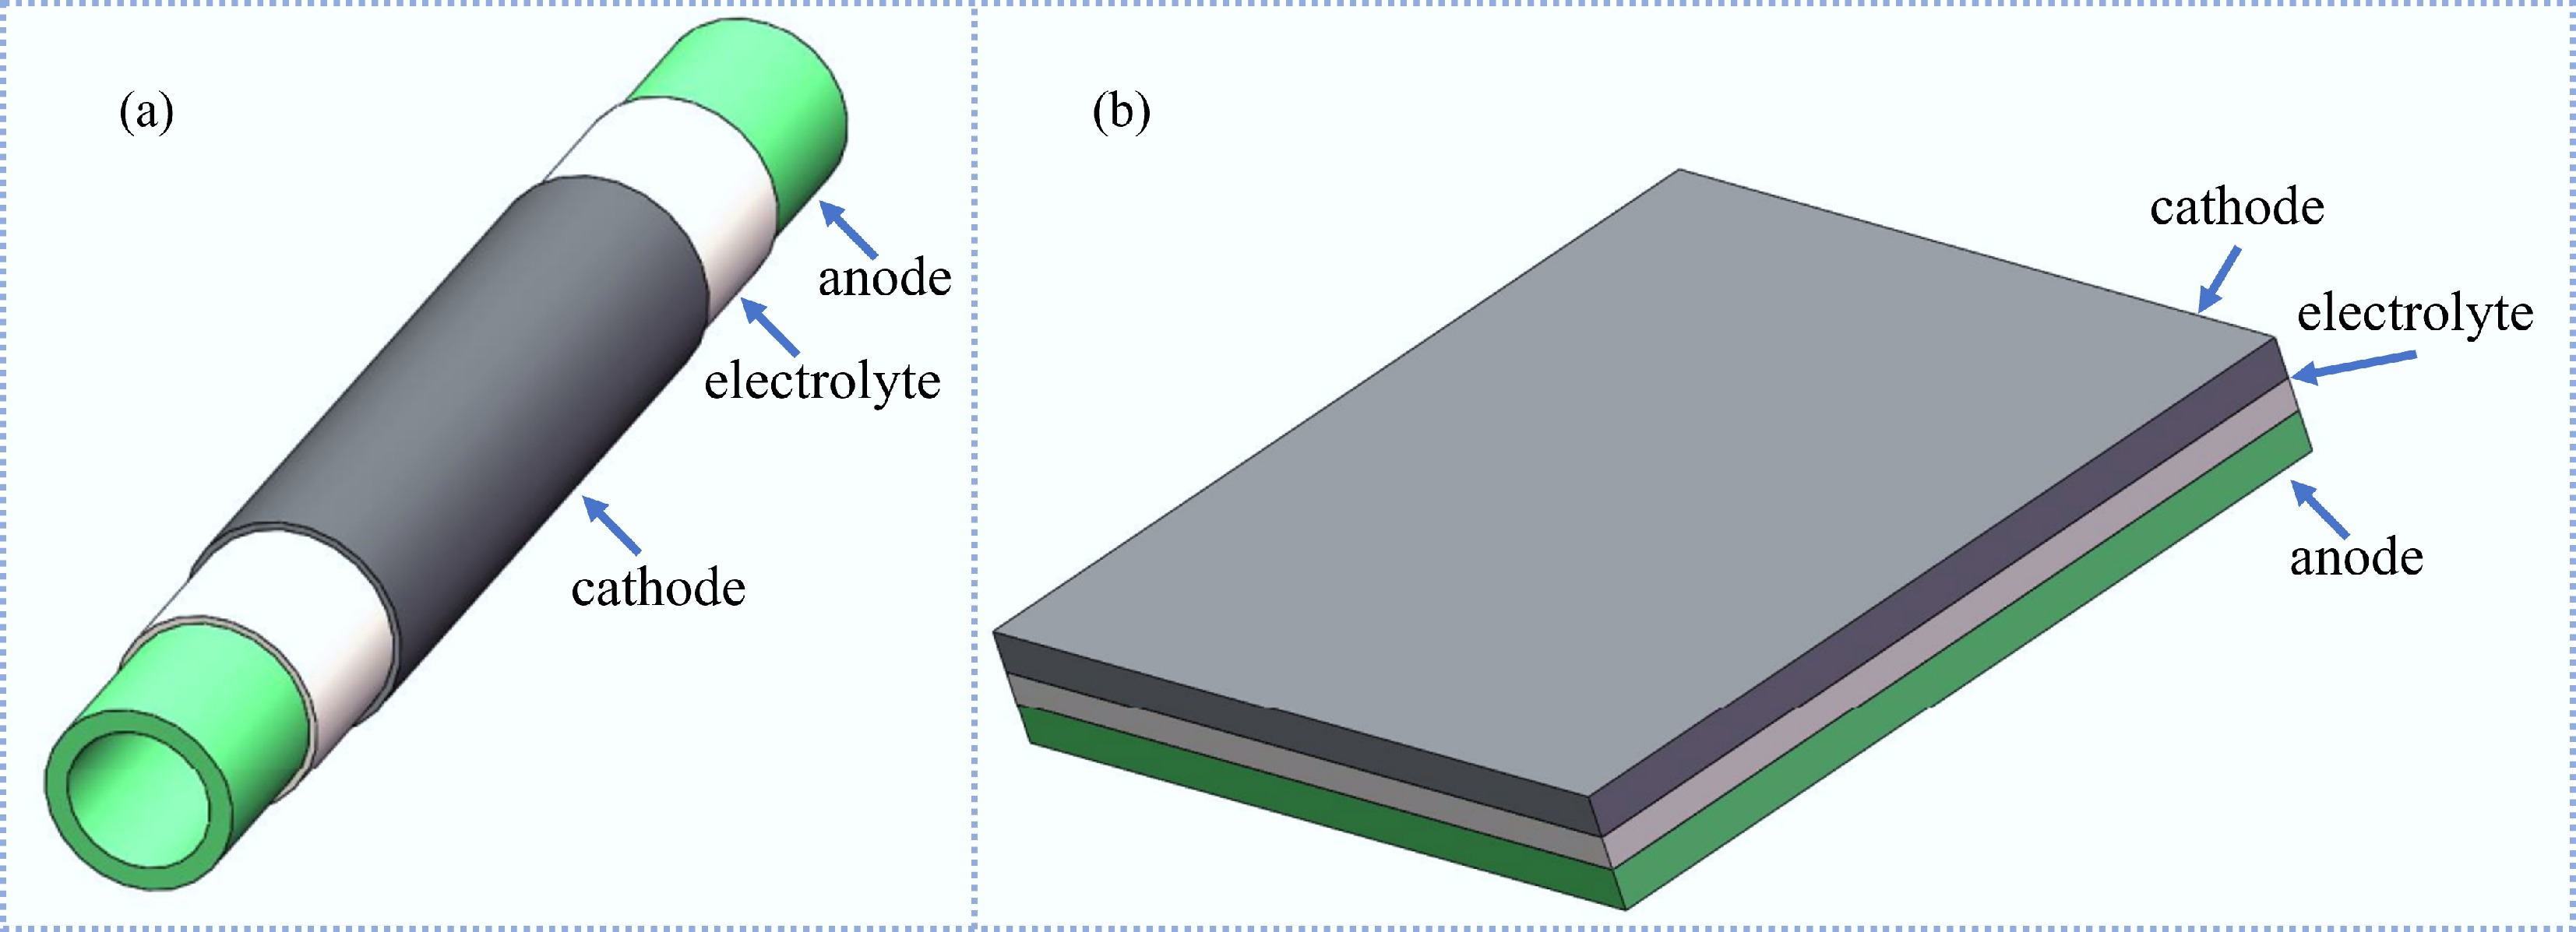
Figure 1.
Schematic of SOFC: (a) tubular structure, (b) planar structure.
-
-
-
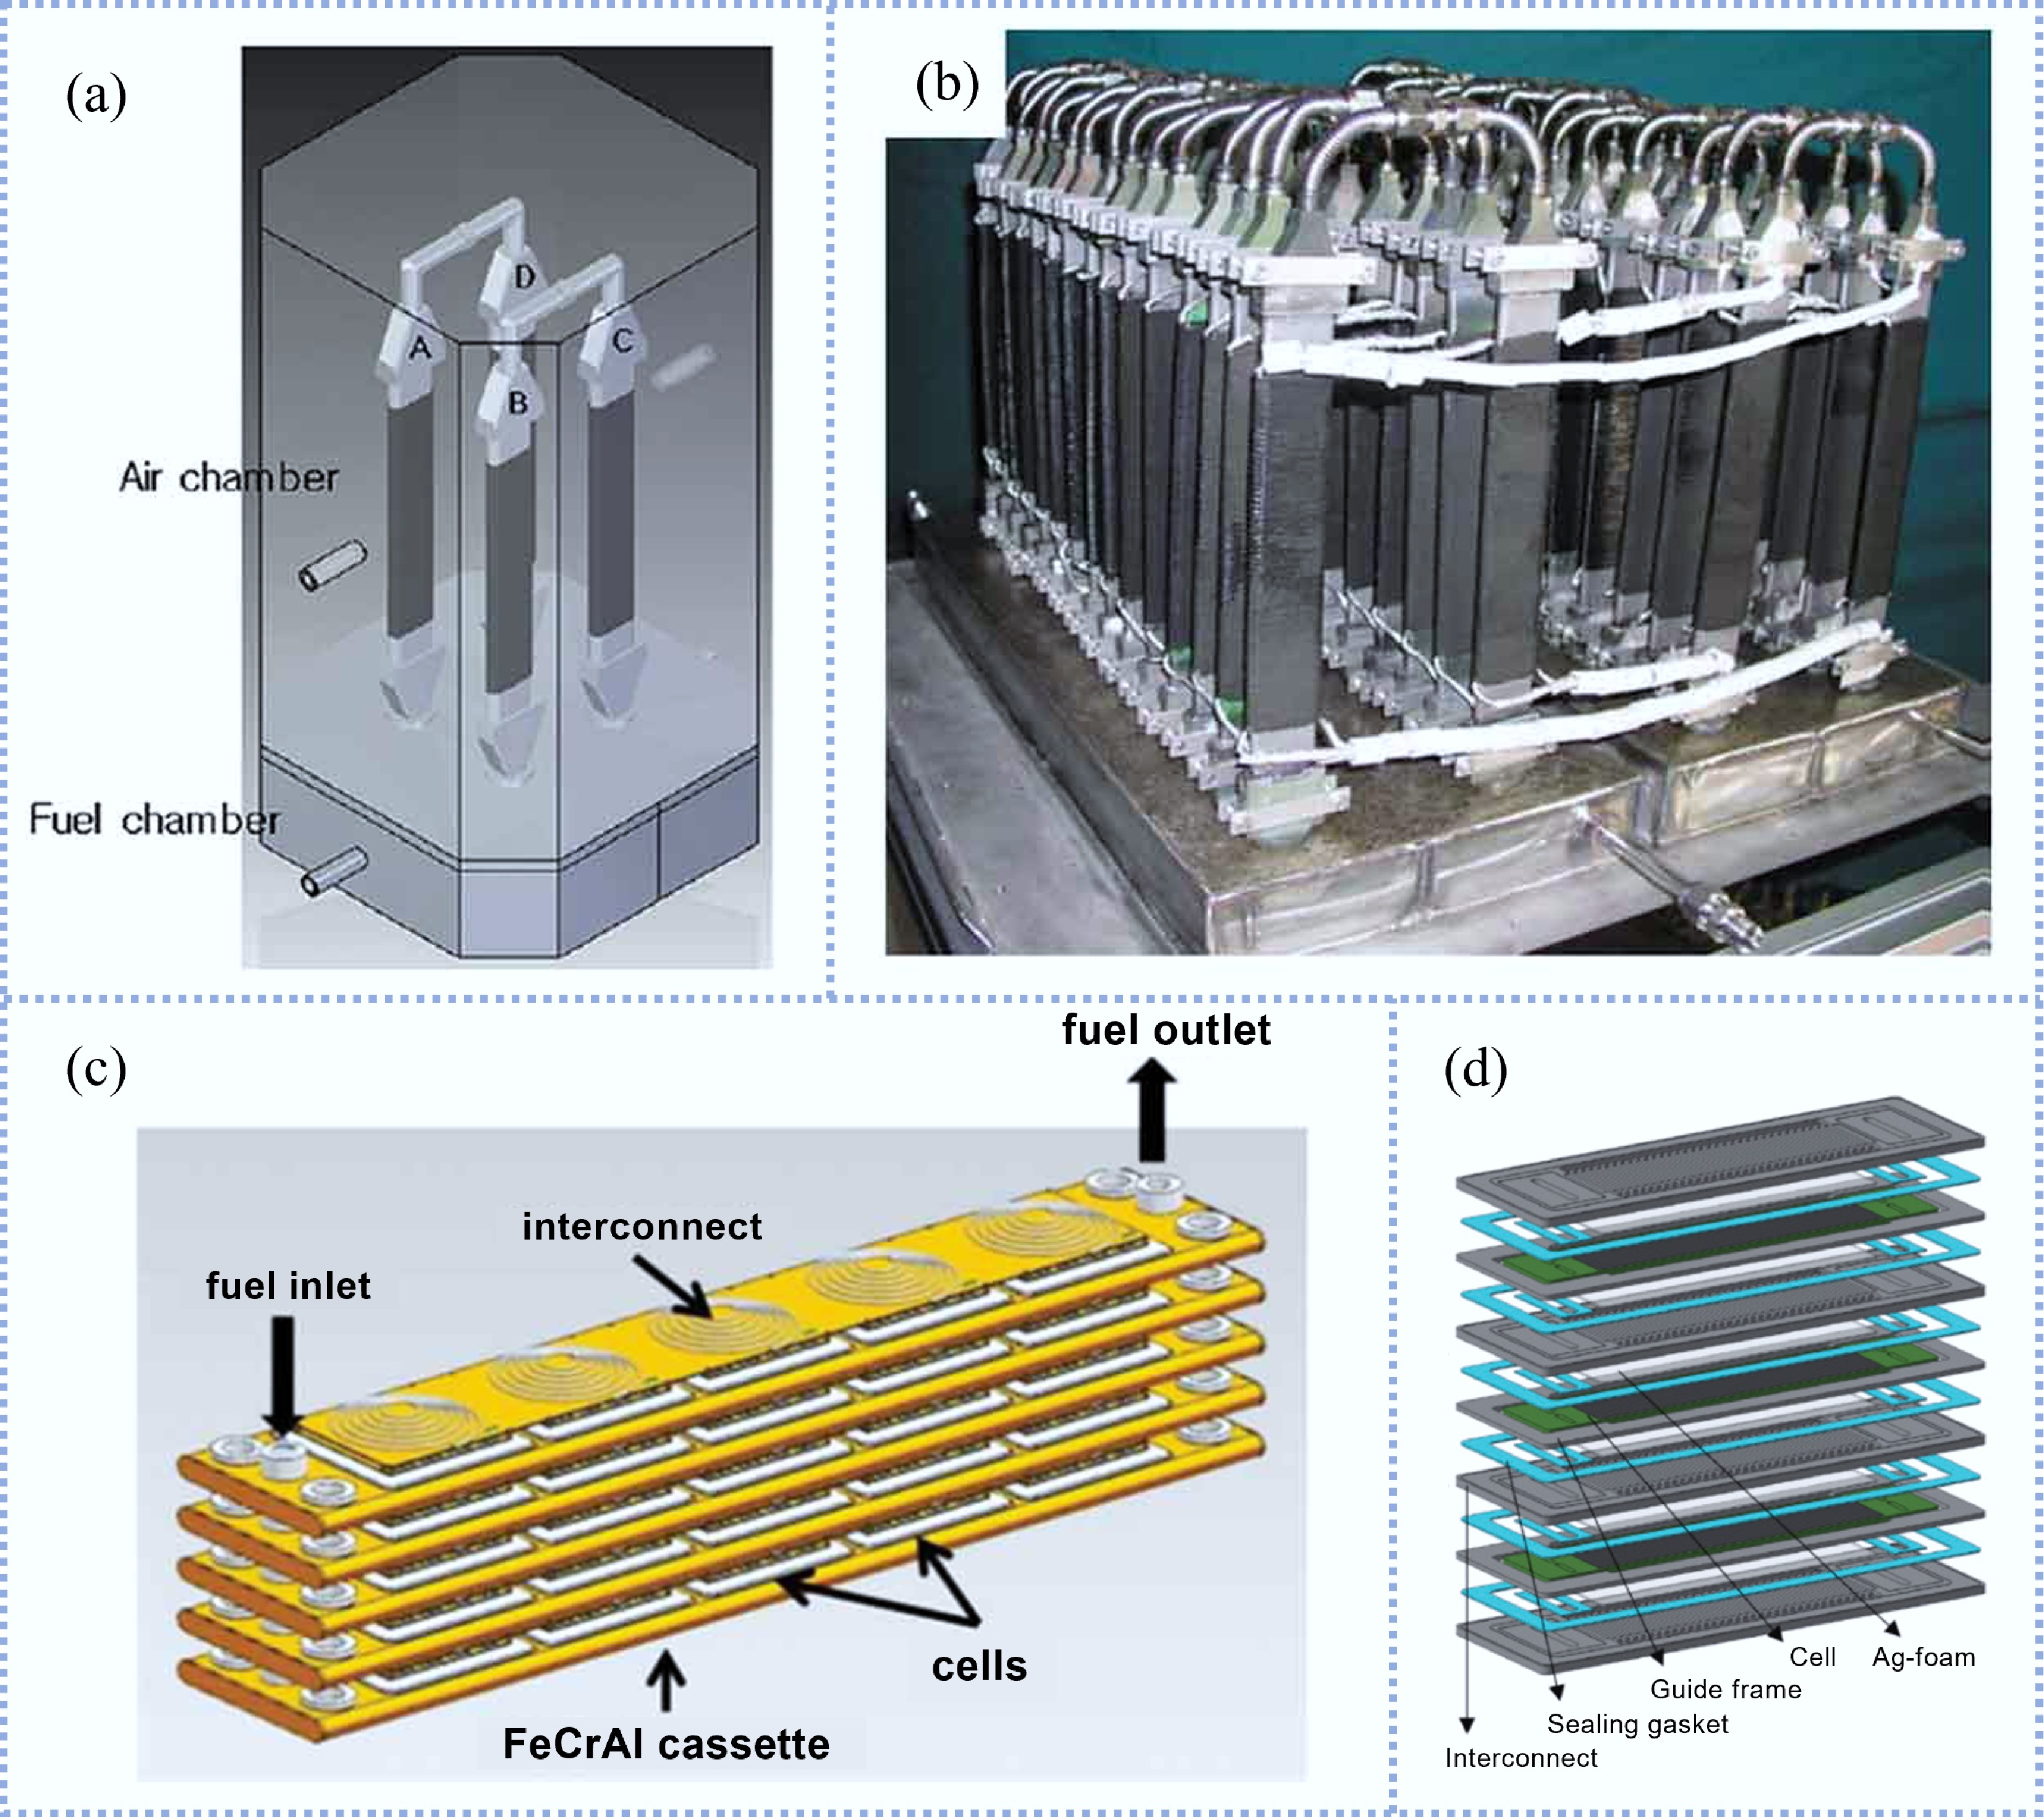
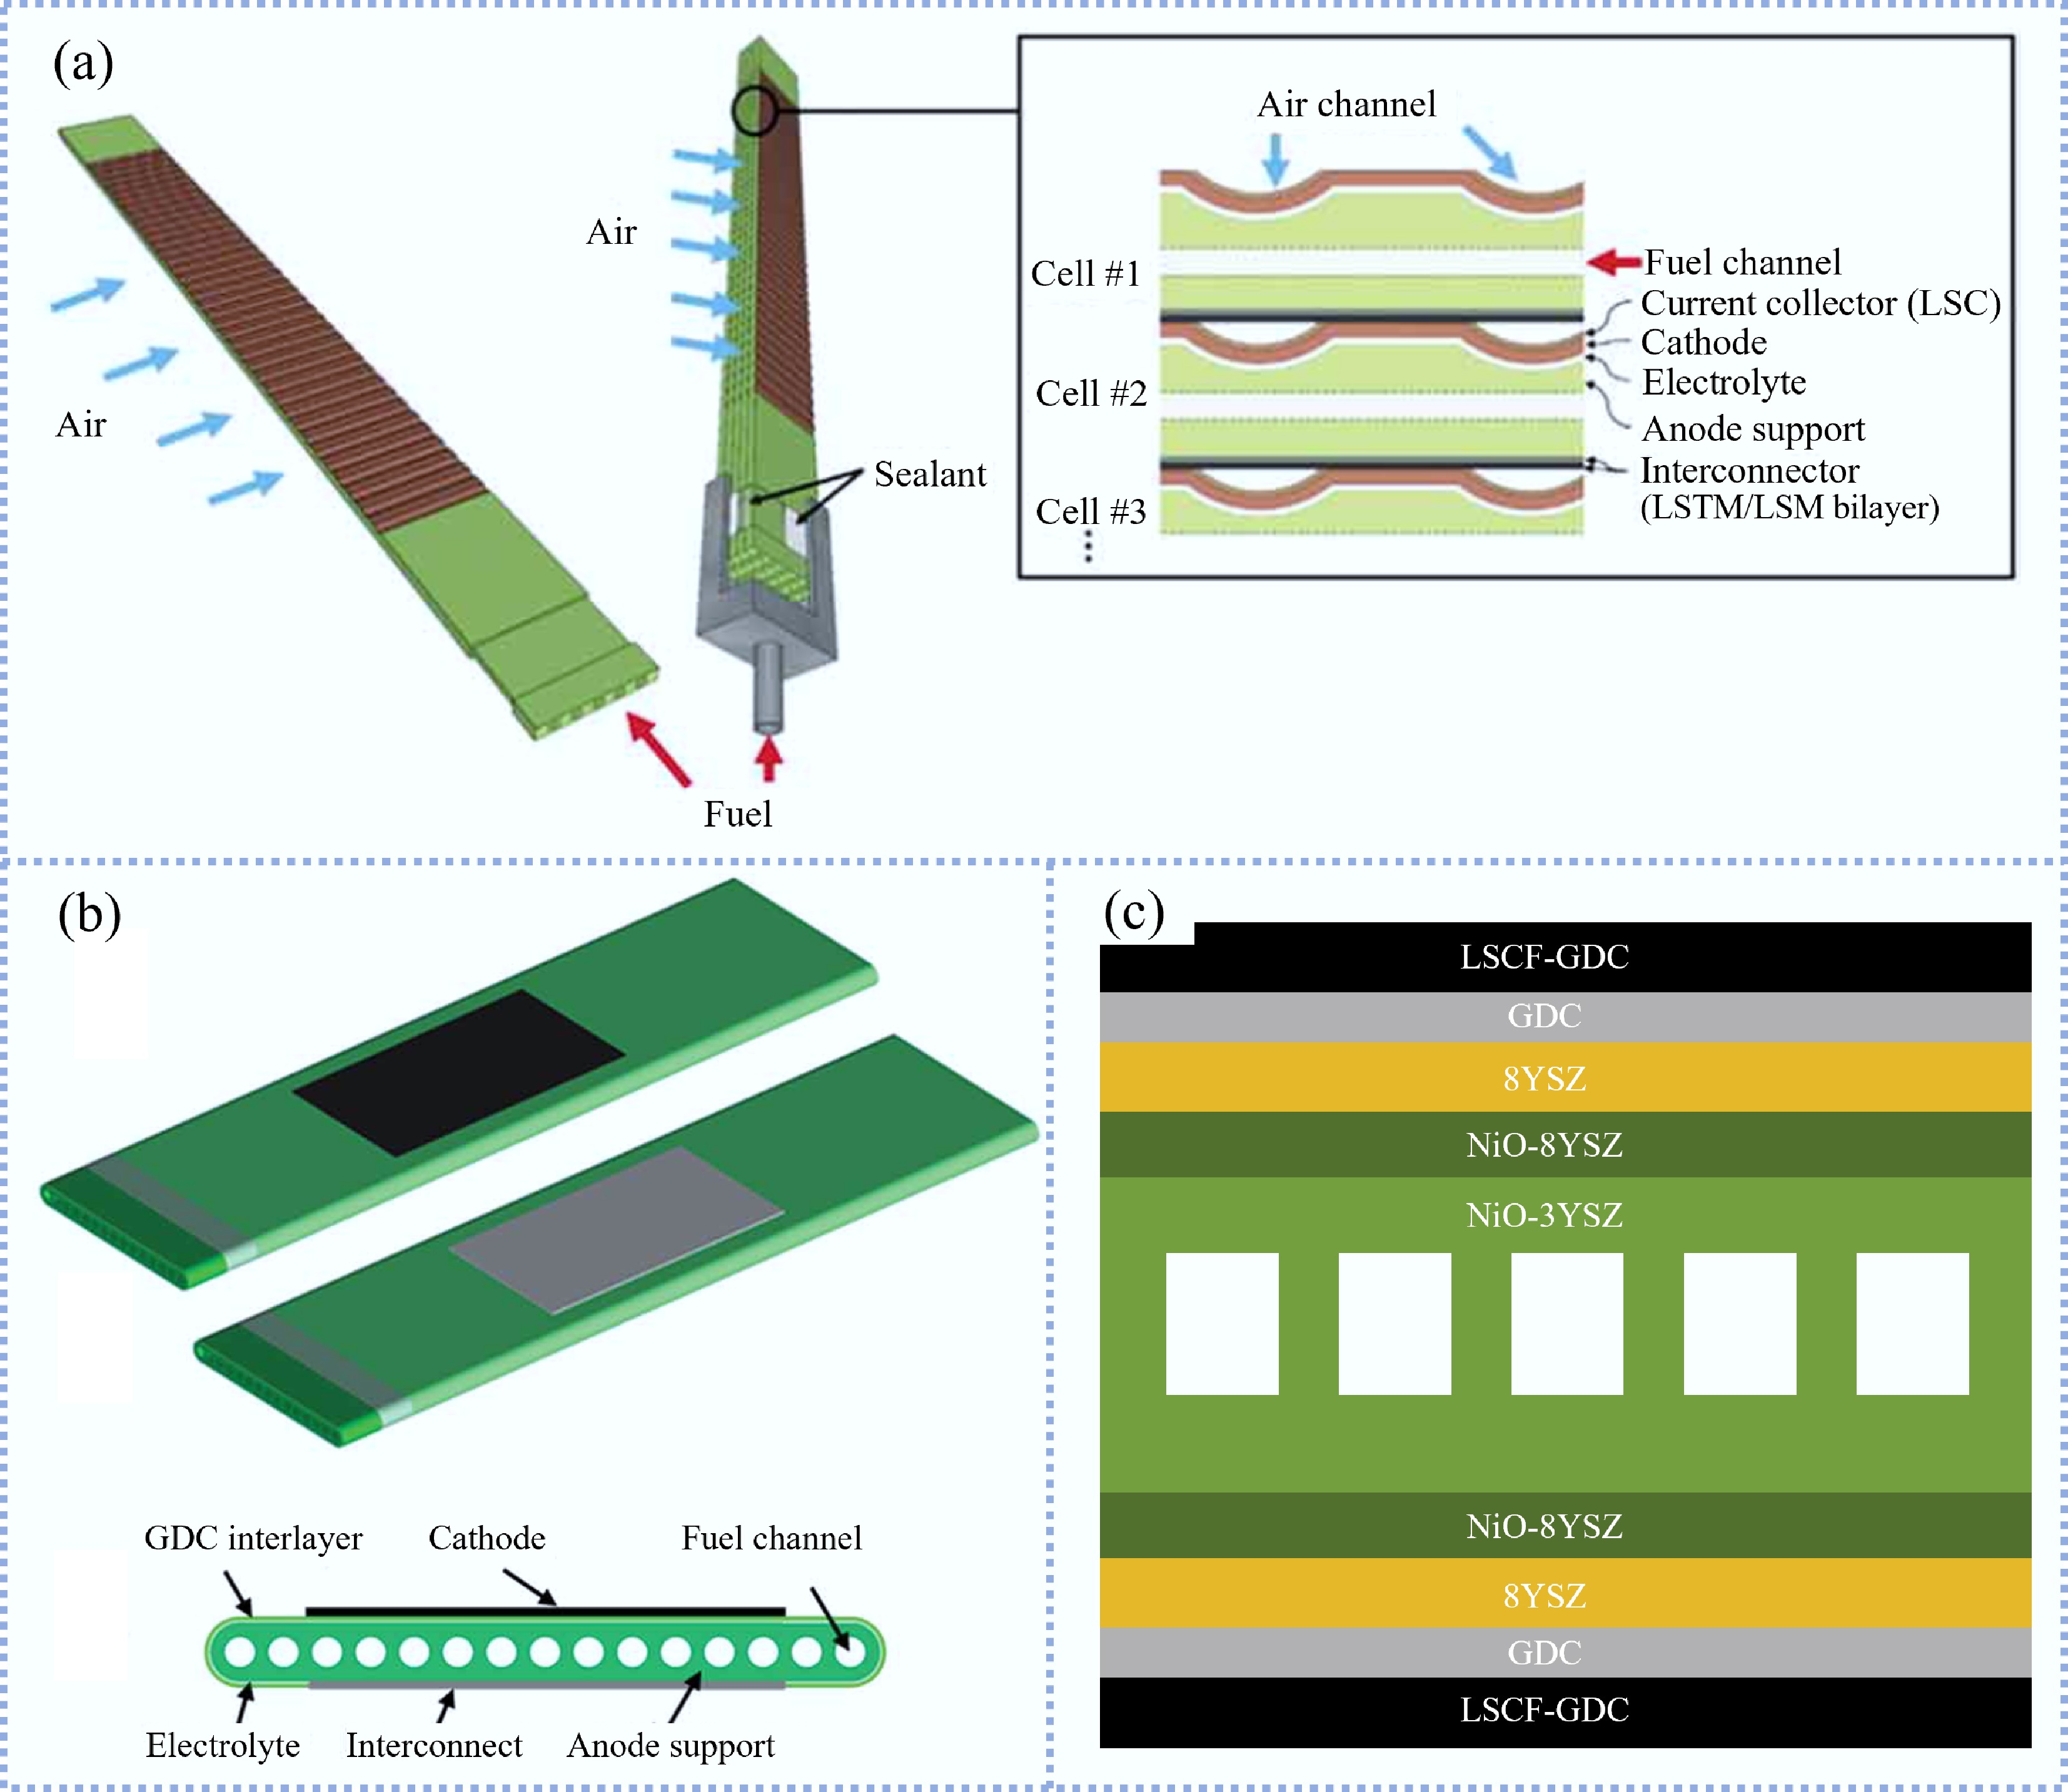
Figure 4.
(a) Schematic diagram of a two-unit bundle containing four cells, and (b) actual image of the 1 kW class FT-SOFC stack[29]. (c) Schematic diagram of stack structure[29]. (d) Schematic diagram of the stack components[42]. (Reprinted with permission from Han et al.[43]. Copyright [2022] Elsevier B.V.)
-
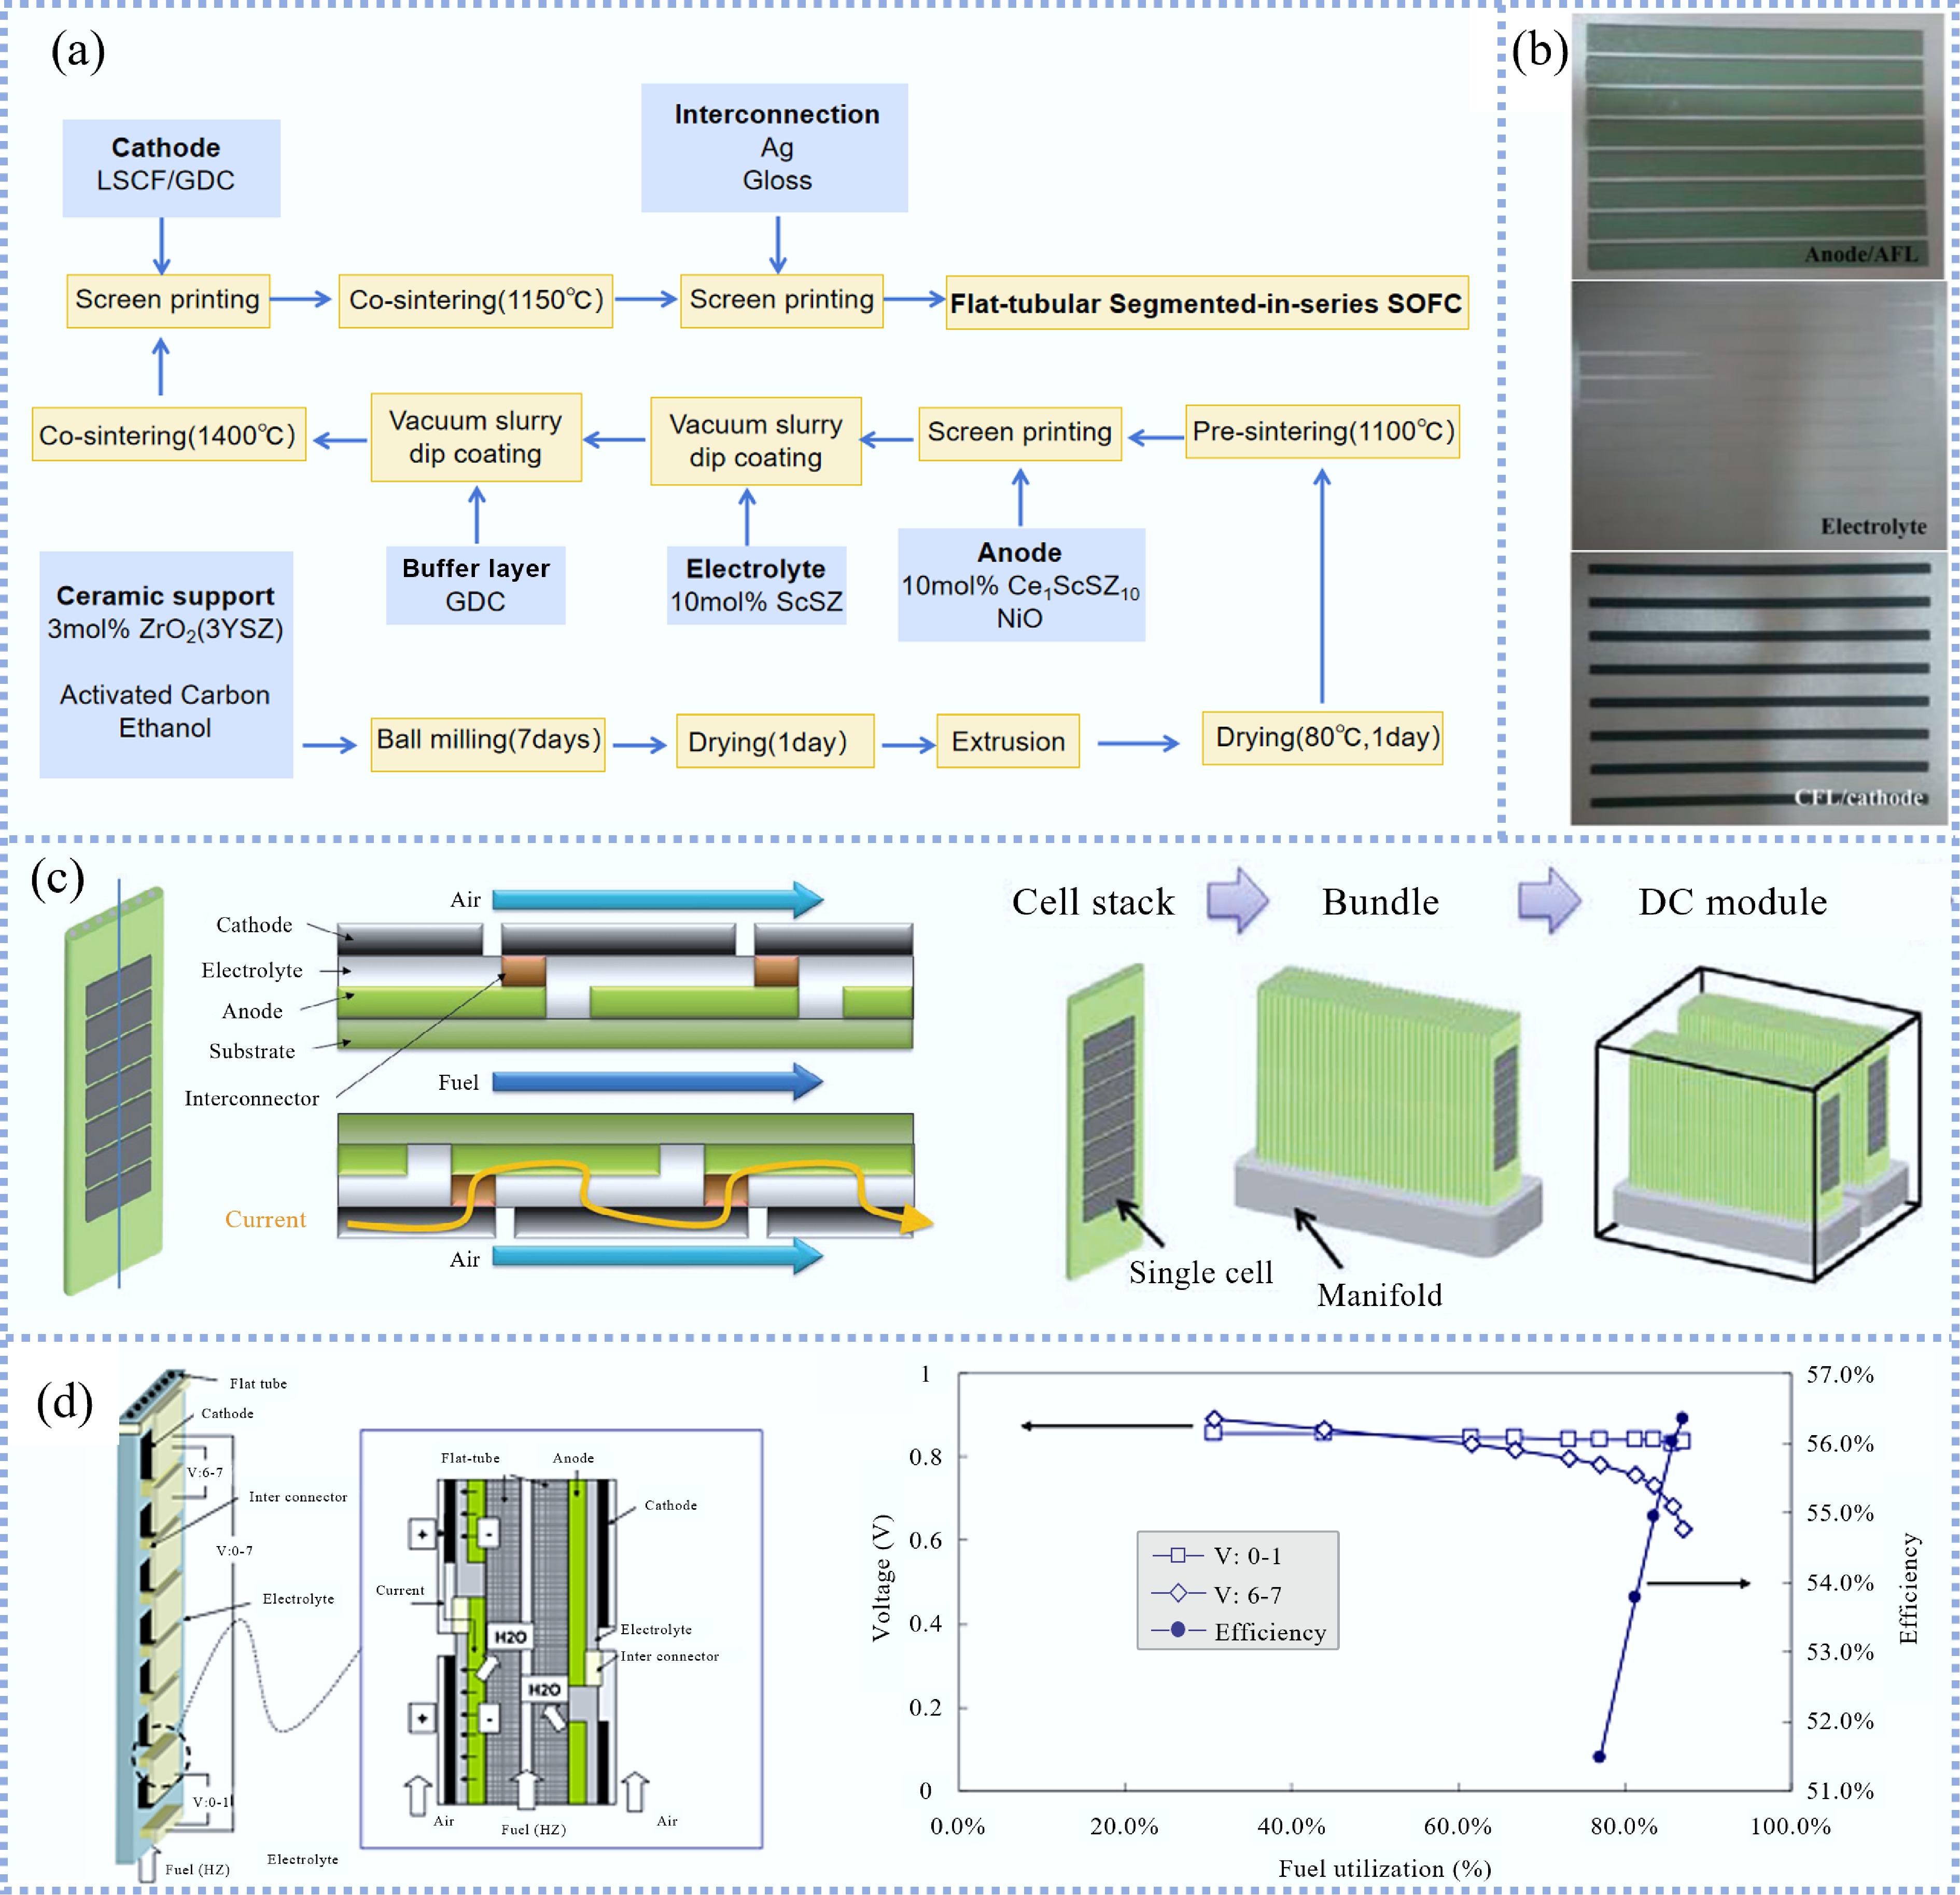
Figure 5.
(a) Process of preparing SIS-SOFC. (b) Cell components fabricated by decalcomania papers method[61]. (c) Schematic of the tubular SIS-SOFC and the stack with 56 tubular SIS-SOFCs[29]. (d) Schematic diagram of the SIS-SOFCs stacks consist of 14 cells, and the influence of fuel utilization on voltage. V: 0–1 and V: 6, 7 represent the voltage of the cell at the most upstream and most downstream cell, respectively[68].
-
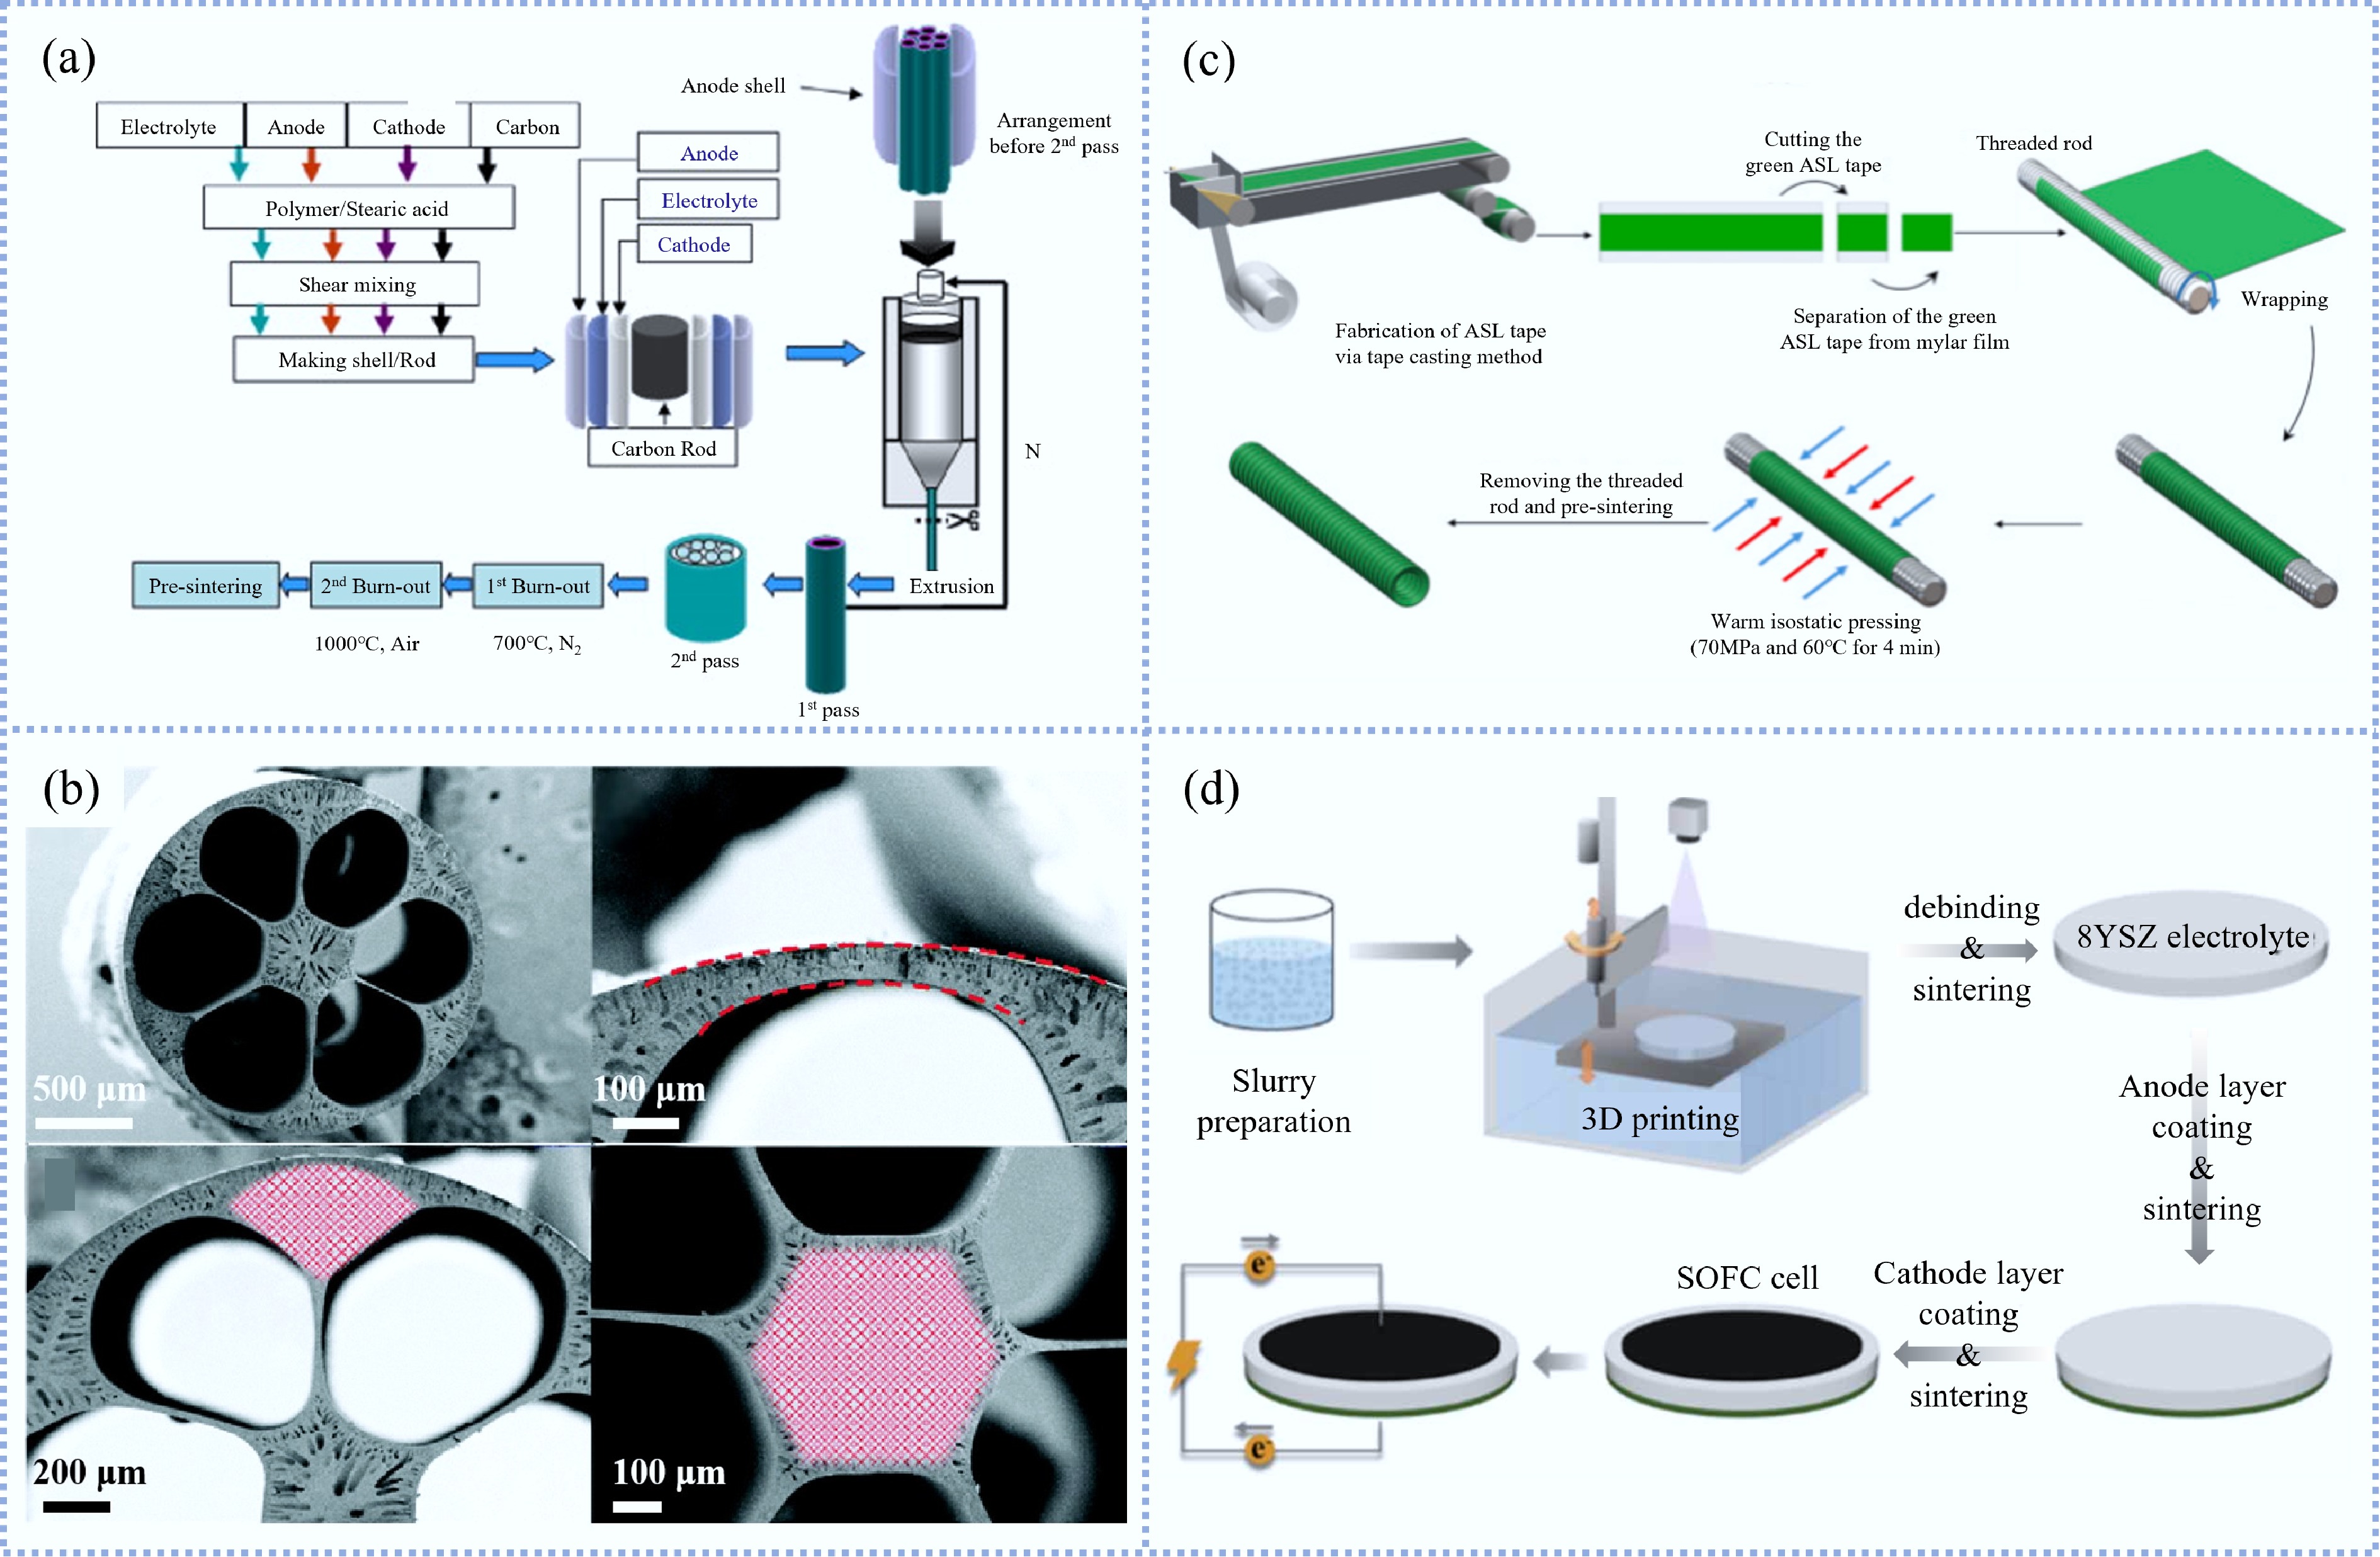
Figure 6.
(a) Fabricating process of multi-tubular SOFC with seven cells[78] (Reprinted with permission from Mani et al.[79]. Copyright [2010] Elsevier B.V.). (b) SEM photomicrographs of 6-channel anode supports[22]. (c) Fabrication steps of anode support bolt-microtube[83] (Reprinted with permission from Kim & Jang[84]. Copyright [2023] Elsevier B.V.). (d) Schematic of 3D printed MT-SOFC fabrication process[84].
-
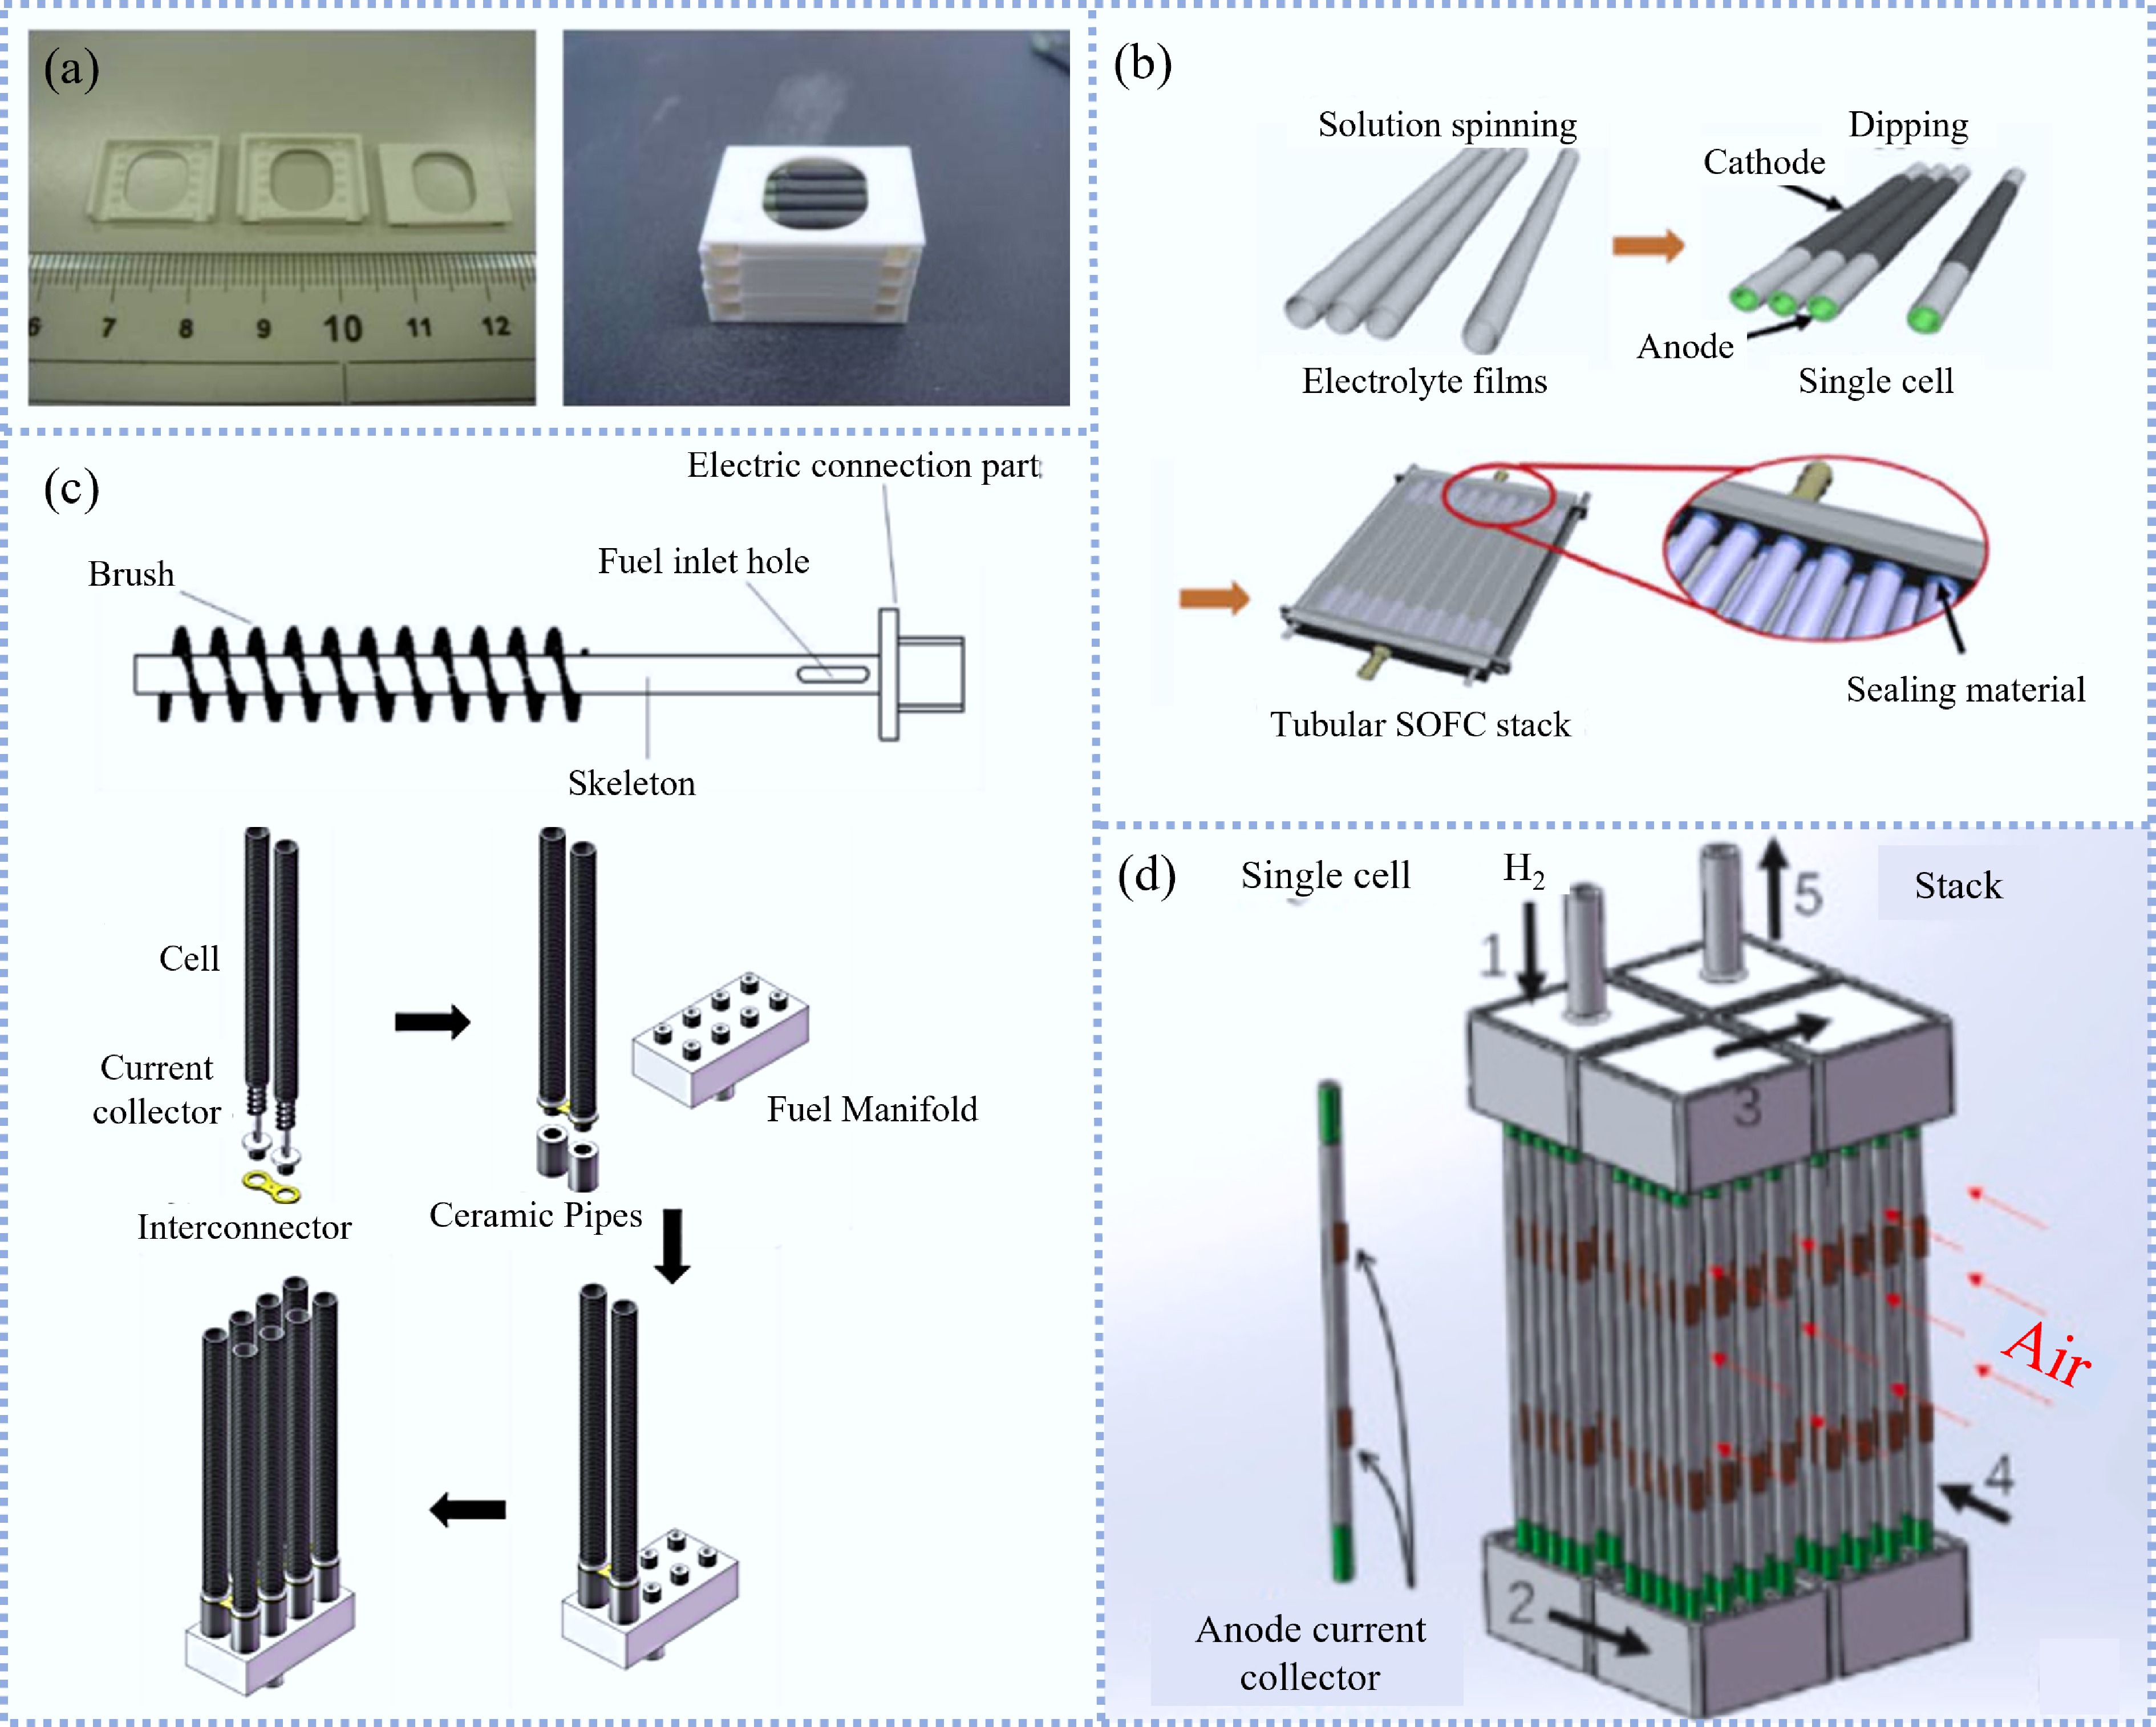
Figure 7.
(a) Actual images ceramic manifold components and micro-tubular SOFC stacks consisted of four bundles[94]. (b) Fabrication process of the MT-SOFC stack Using MgO matrices[61]. (c) Schematic diagram of the current collector and the assembly process of the eight-cell stack[98]. (d) Actual images of the MT-SOFC with double Ni-pads and the schematic diagram of the MT-SOFC stack consisting of 80 cells[99].
-
-
-
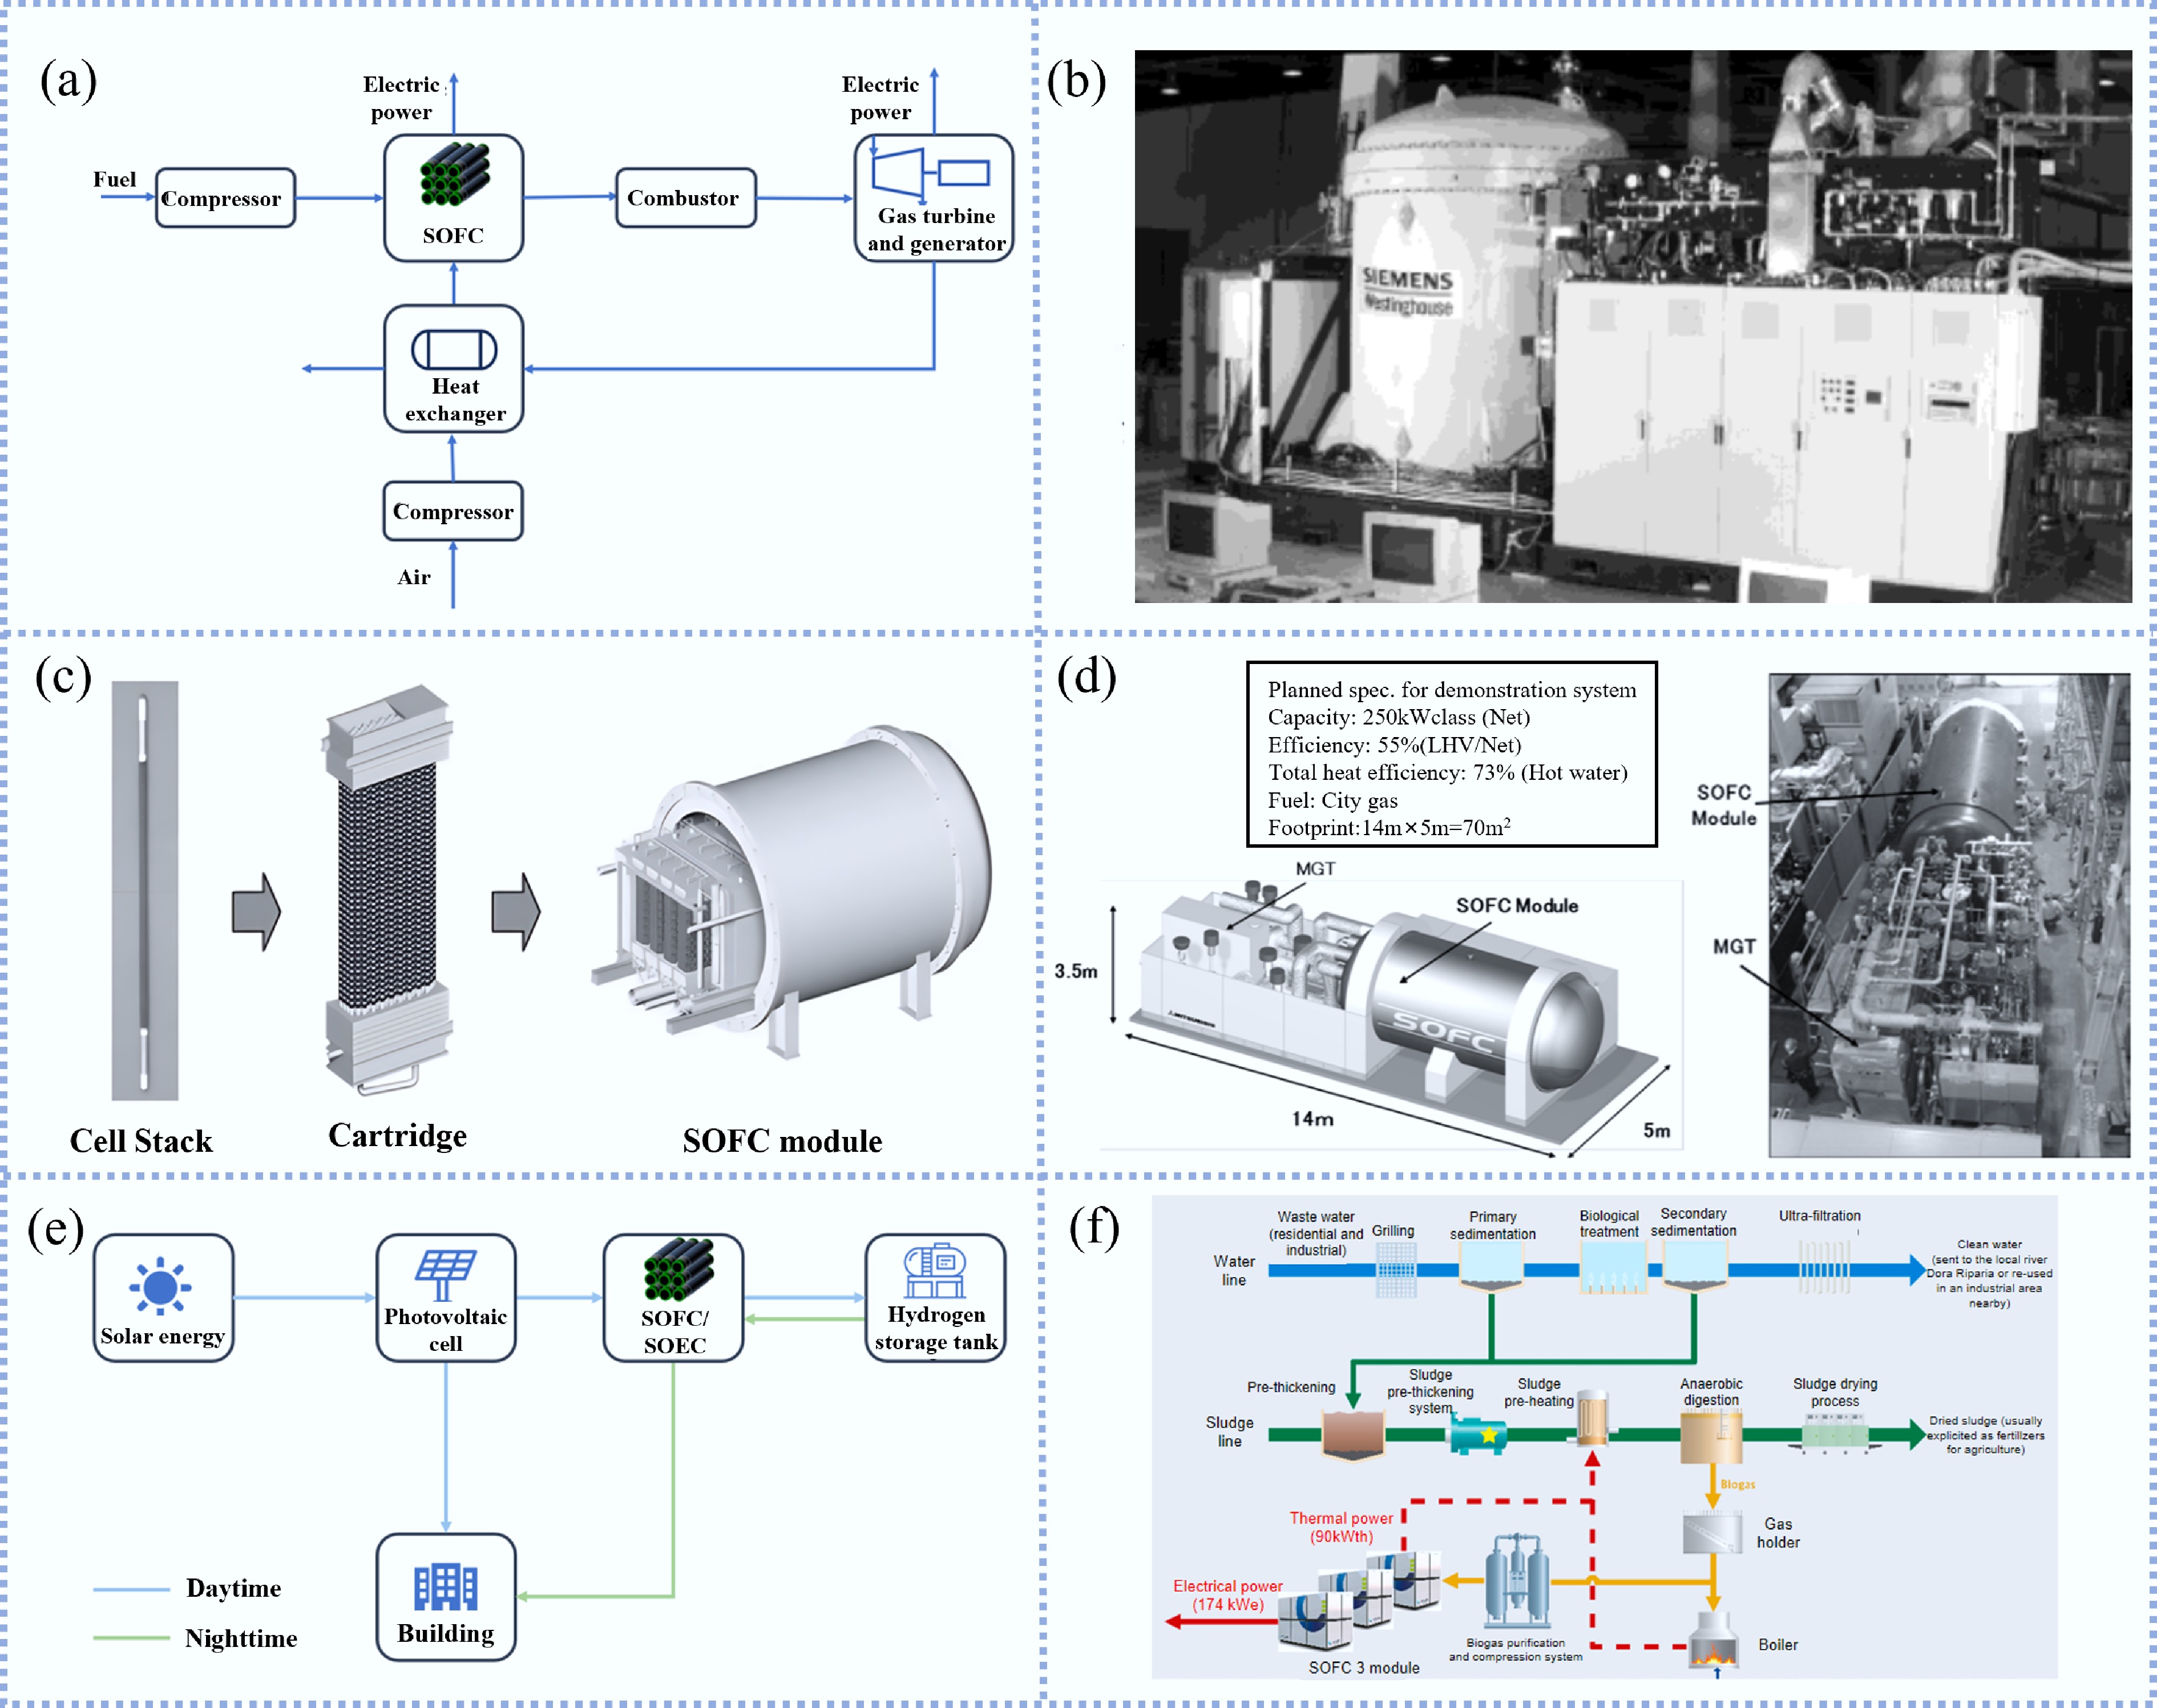
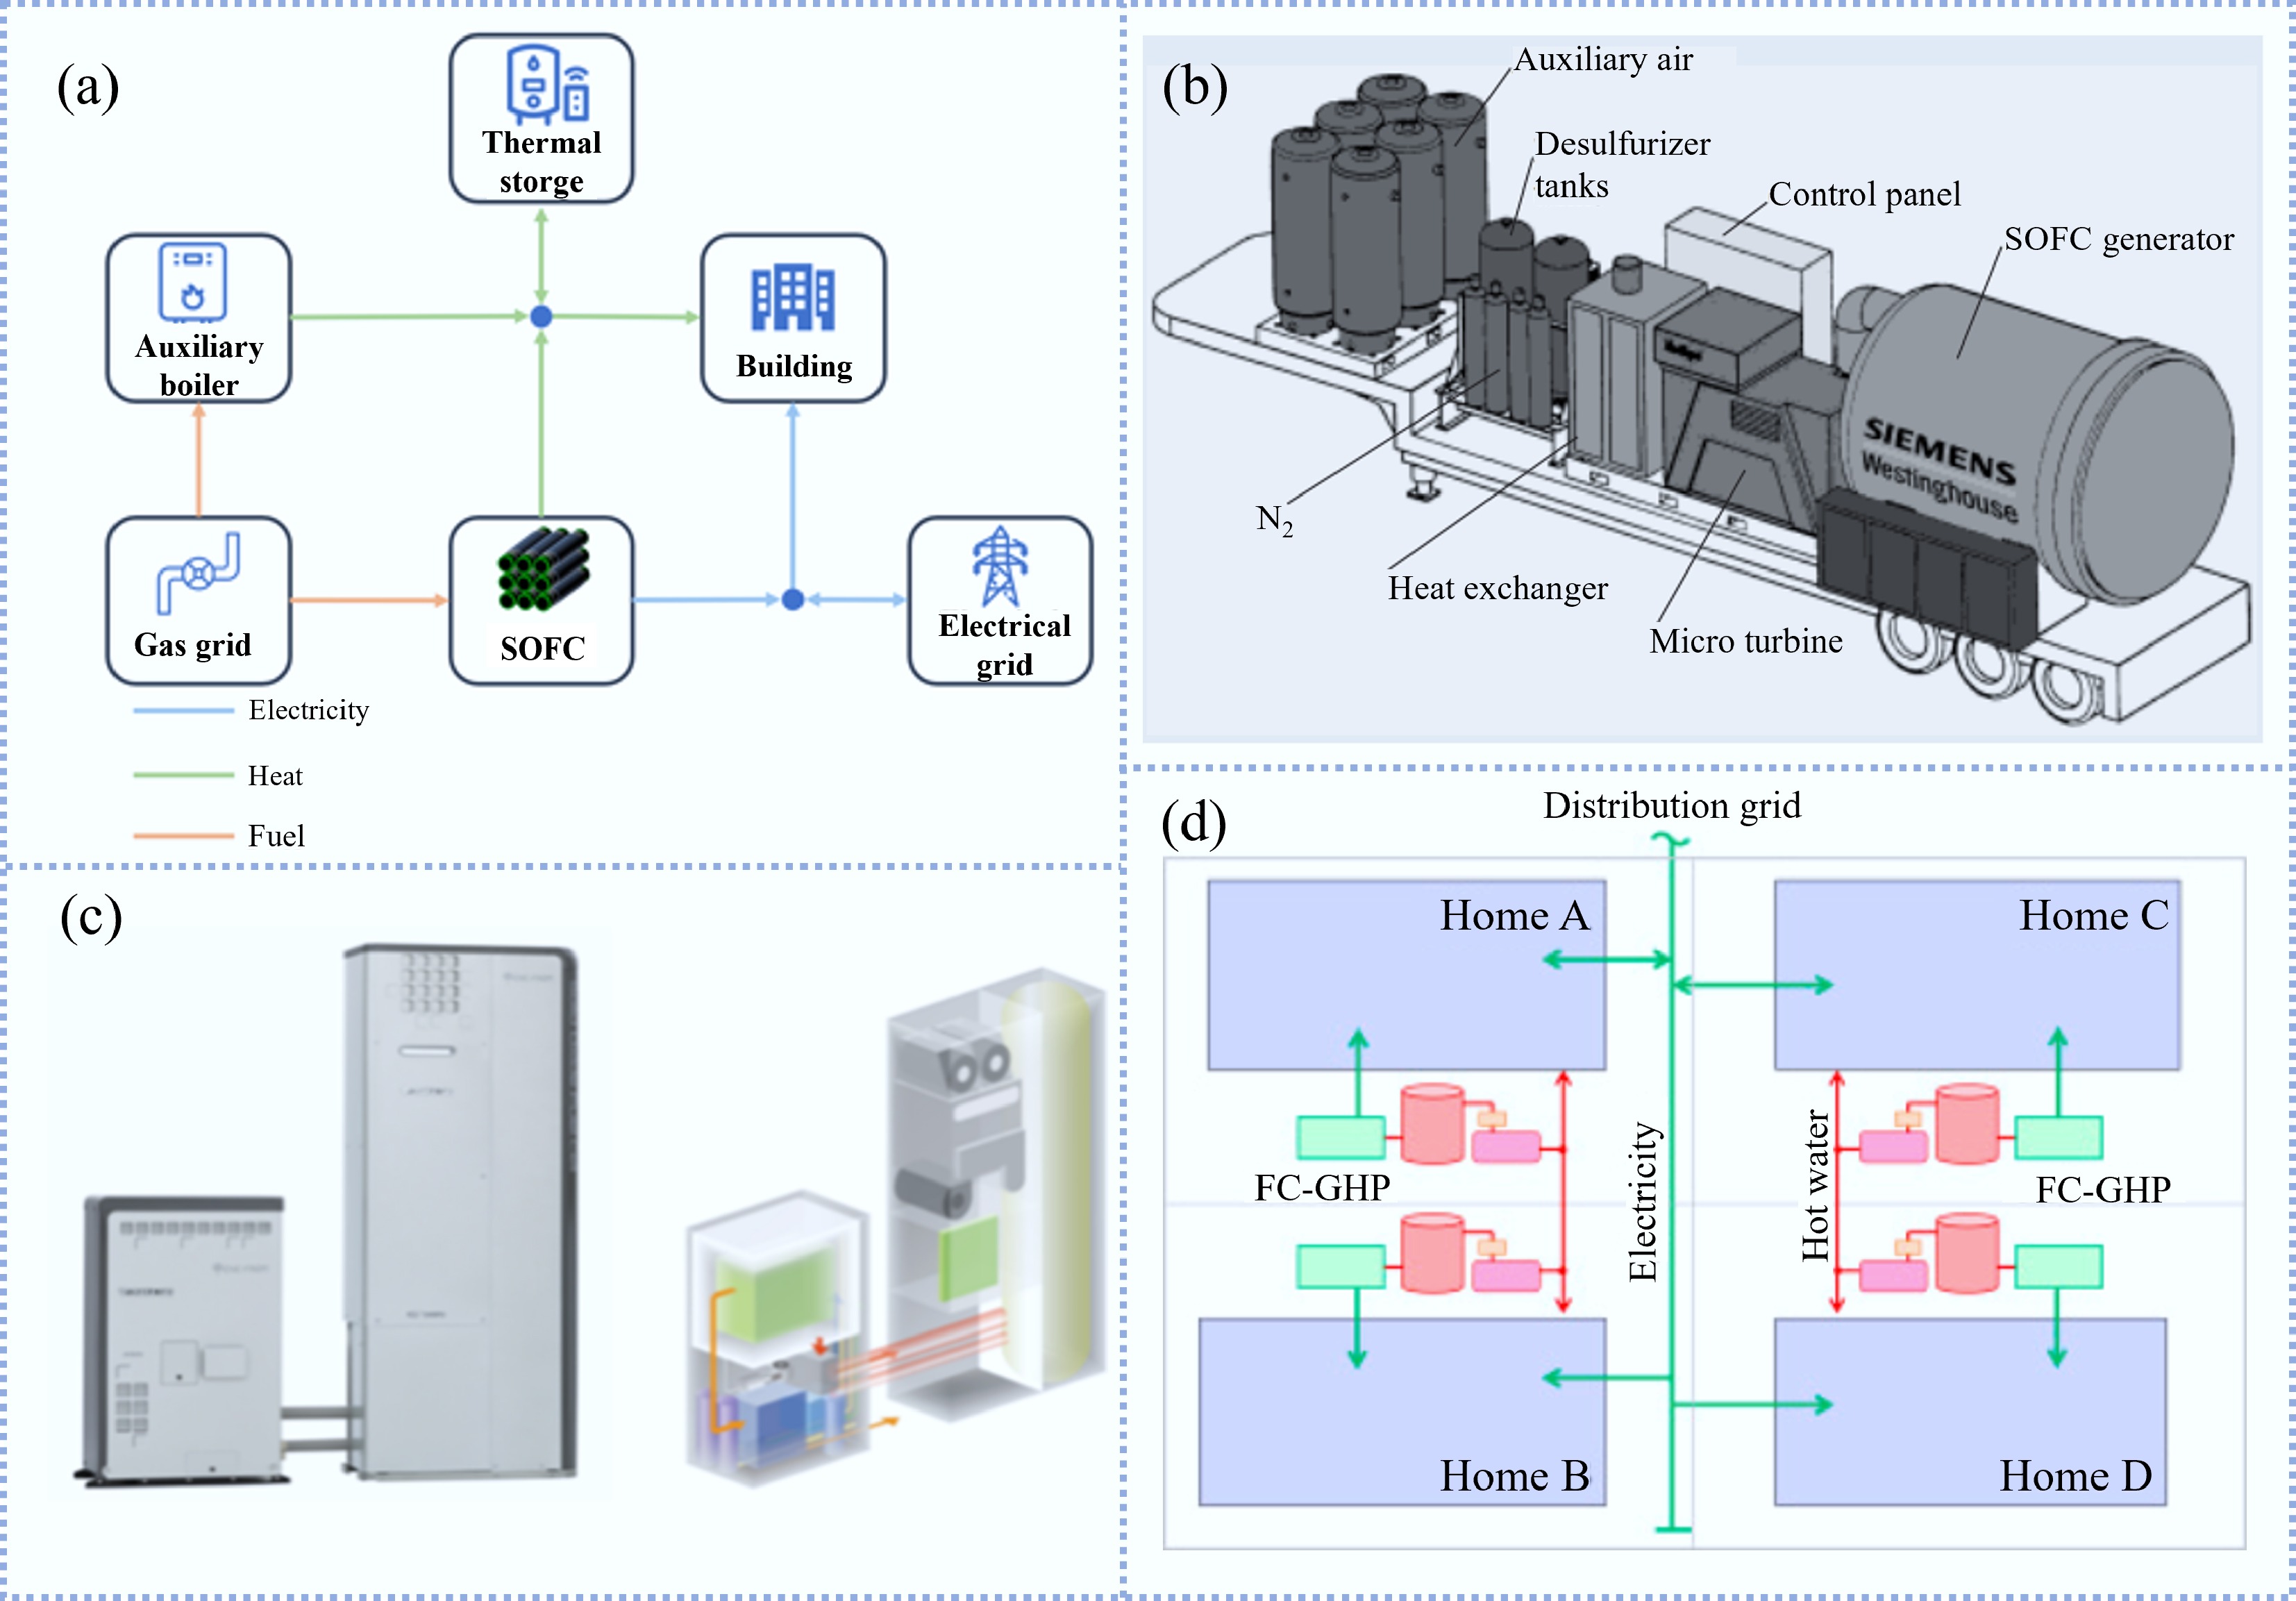
Figure 10.
(a) Schematic diagram of a pressurized SOFCs-GT system. (b) 220 kW SOFCs-GT system without the power dissipators[19]. (c) SOFC module developed by MHI[127]. (d) 250 kW SOFCs-GT system was developed by MHPS[66]. (e) Schematic diagram of a system combining SOFCs and photovoltaics. (f) Layout of wastewater treatment plant with SOFCs[128].
-
Type Cell composition Maximum power density (W cm−2) Test temperature (°C) Ref. FT-SOFC NiO-YSZ/YSZ/LSM-YSZ/LSM/LSCF 0.39 750 [30] FT-SOFC NiO-YSZ/ScSZ/GDC/ LSCF-GDC 0.546 700 [6] FT-SOFC NiO-YSZ/YSZ/LSCF-GDC 0.498 700 [32] FT-SOFC Ni-YSZ/YSZ/GDC/LSCF-GDC 0.539 750 [33] FT-SOFC NiO-YSZ/YSZ/LSM-YSZ 0.798 750 [34] Table 1.
Comparison of peak power densities and geometric parameters of anode-supported FT-SOFCs reported in recent literature
-
Fabrication method Cell composition Maximum power density (W cm−2) Test temperature (°C) Ref. Extrusion NiO-GDC/GDC/LSCF-GDC 0.857 550 [72] Extrusion NiO-GDC/GDC/LSCF-GDC 1.017 550 [74] Extrusion NiO-GDC/GDC/LSCF-GDC 1.31 550 [76] Extrusion NiO-GDC/GDC/LSCF-GDC 1.31 550 [75] Phase inversion NiO-YSZ/YSZ/LSM-YSZ 0.66 850 [87] Phase inversion NiO-YSZ/YSZ/LSM-YSZ 0.78 800 [88] Phase inversion NiO-YSZ/YSZ/GDC/LSCF-GDC 2.27 700 [22] Phase inversion NiO-YSZ/YSZ/LSM-YSZ 0.75 700 [17] Tape casting combined with isostatic pressing NiO-YSZ/NiO-YSZ/YSZ/LSM-YSZ 0.293 800 [83] Dip-coating NiO/NiO-GDC/GDC/GDC-LSCF 0.6 600 [91] 3D printing NiO-YSZ/YSZ/Proprietary material 0.989 800 [92] Phase inversion Alumina/NiO-SDC/SDC/PBC 1.42 600 [93] Table 2.
The performance of the MT-SOFCs prepared by different fabrication techniques
Figures
(10)
Tables
(2)