-
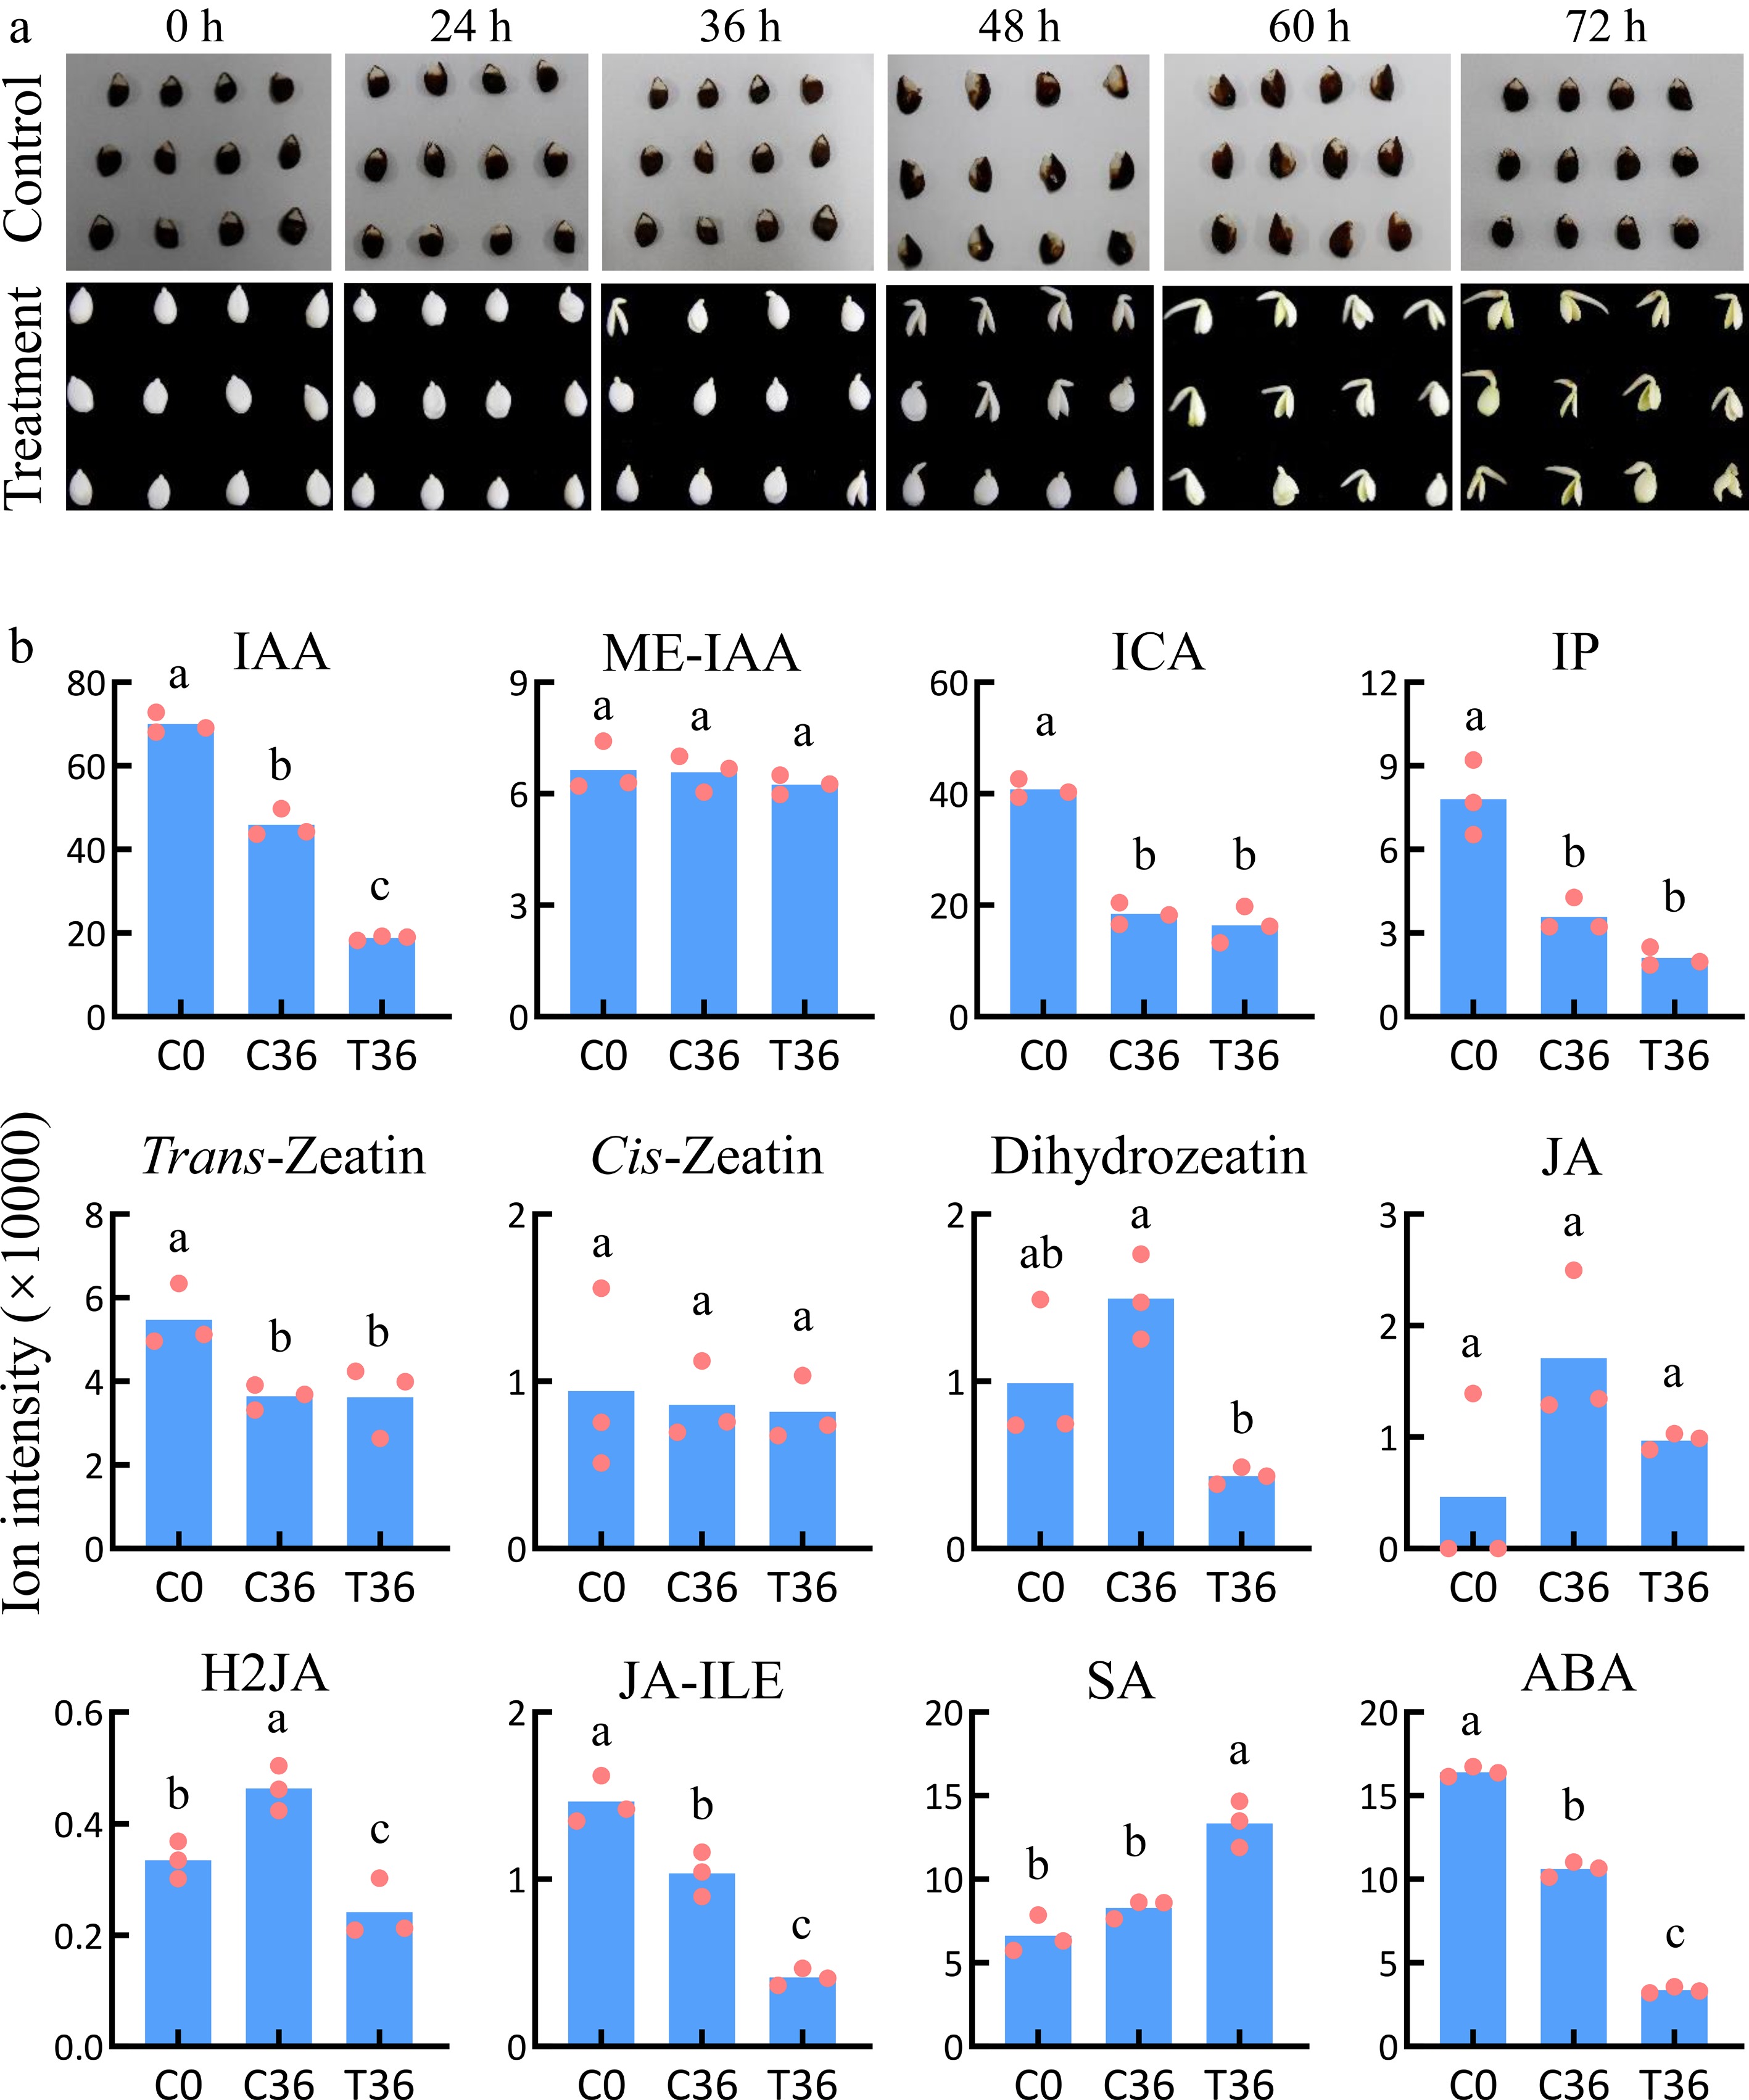
Figure 1.
Identification of plant hormones associated with seed germination. (a) Dynamic changes during the germination of coated seeds. The treatment indicates seeds with the whole coat removed; the control indcludes the coated seeds. (b) The levels of plant hormones in coated seeds at 0 h (C0) and 36 h (C36) and uncoated seeds at 36 h (T36). Means and standard errors were calculated using Student's t-test. The lowercase letters a, b, and c indicate significant differences at p < 0.05.
-
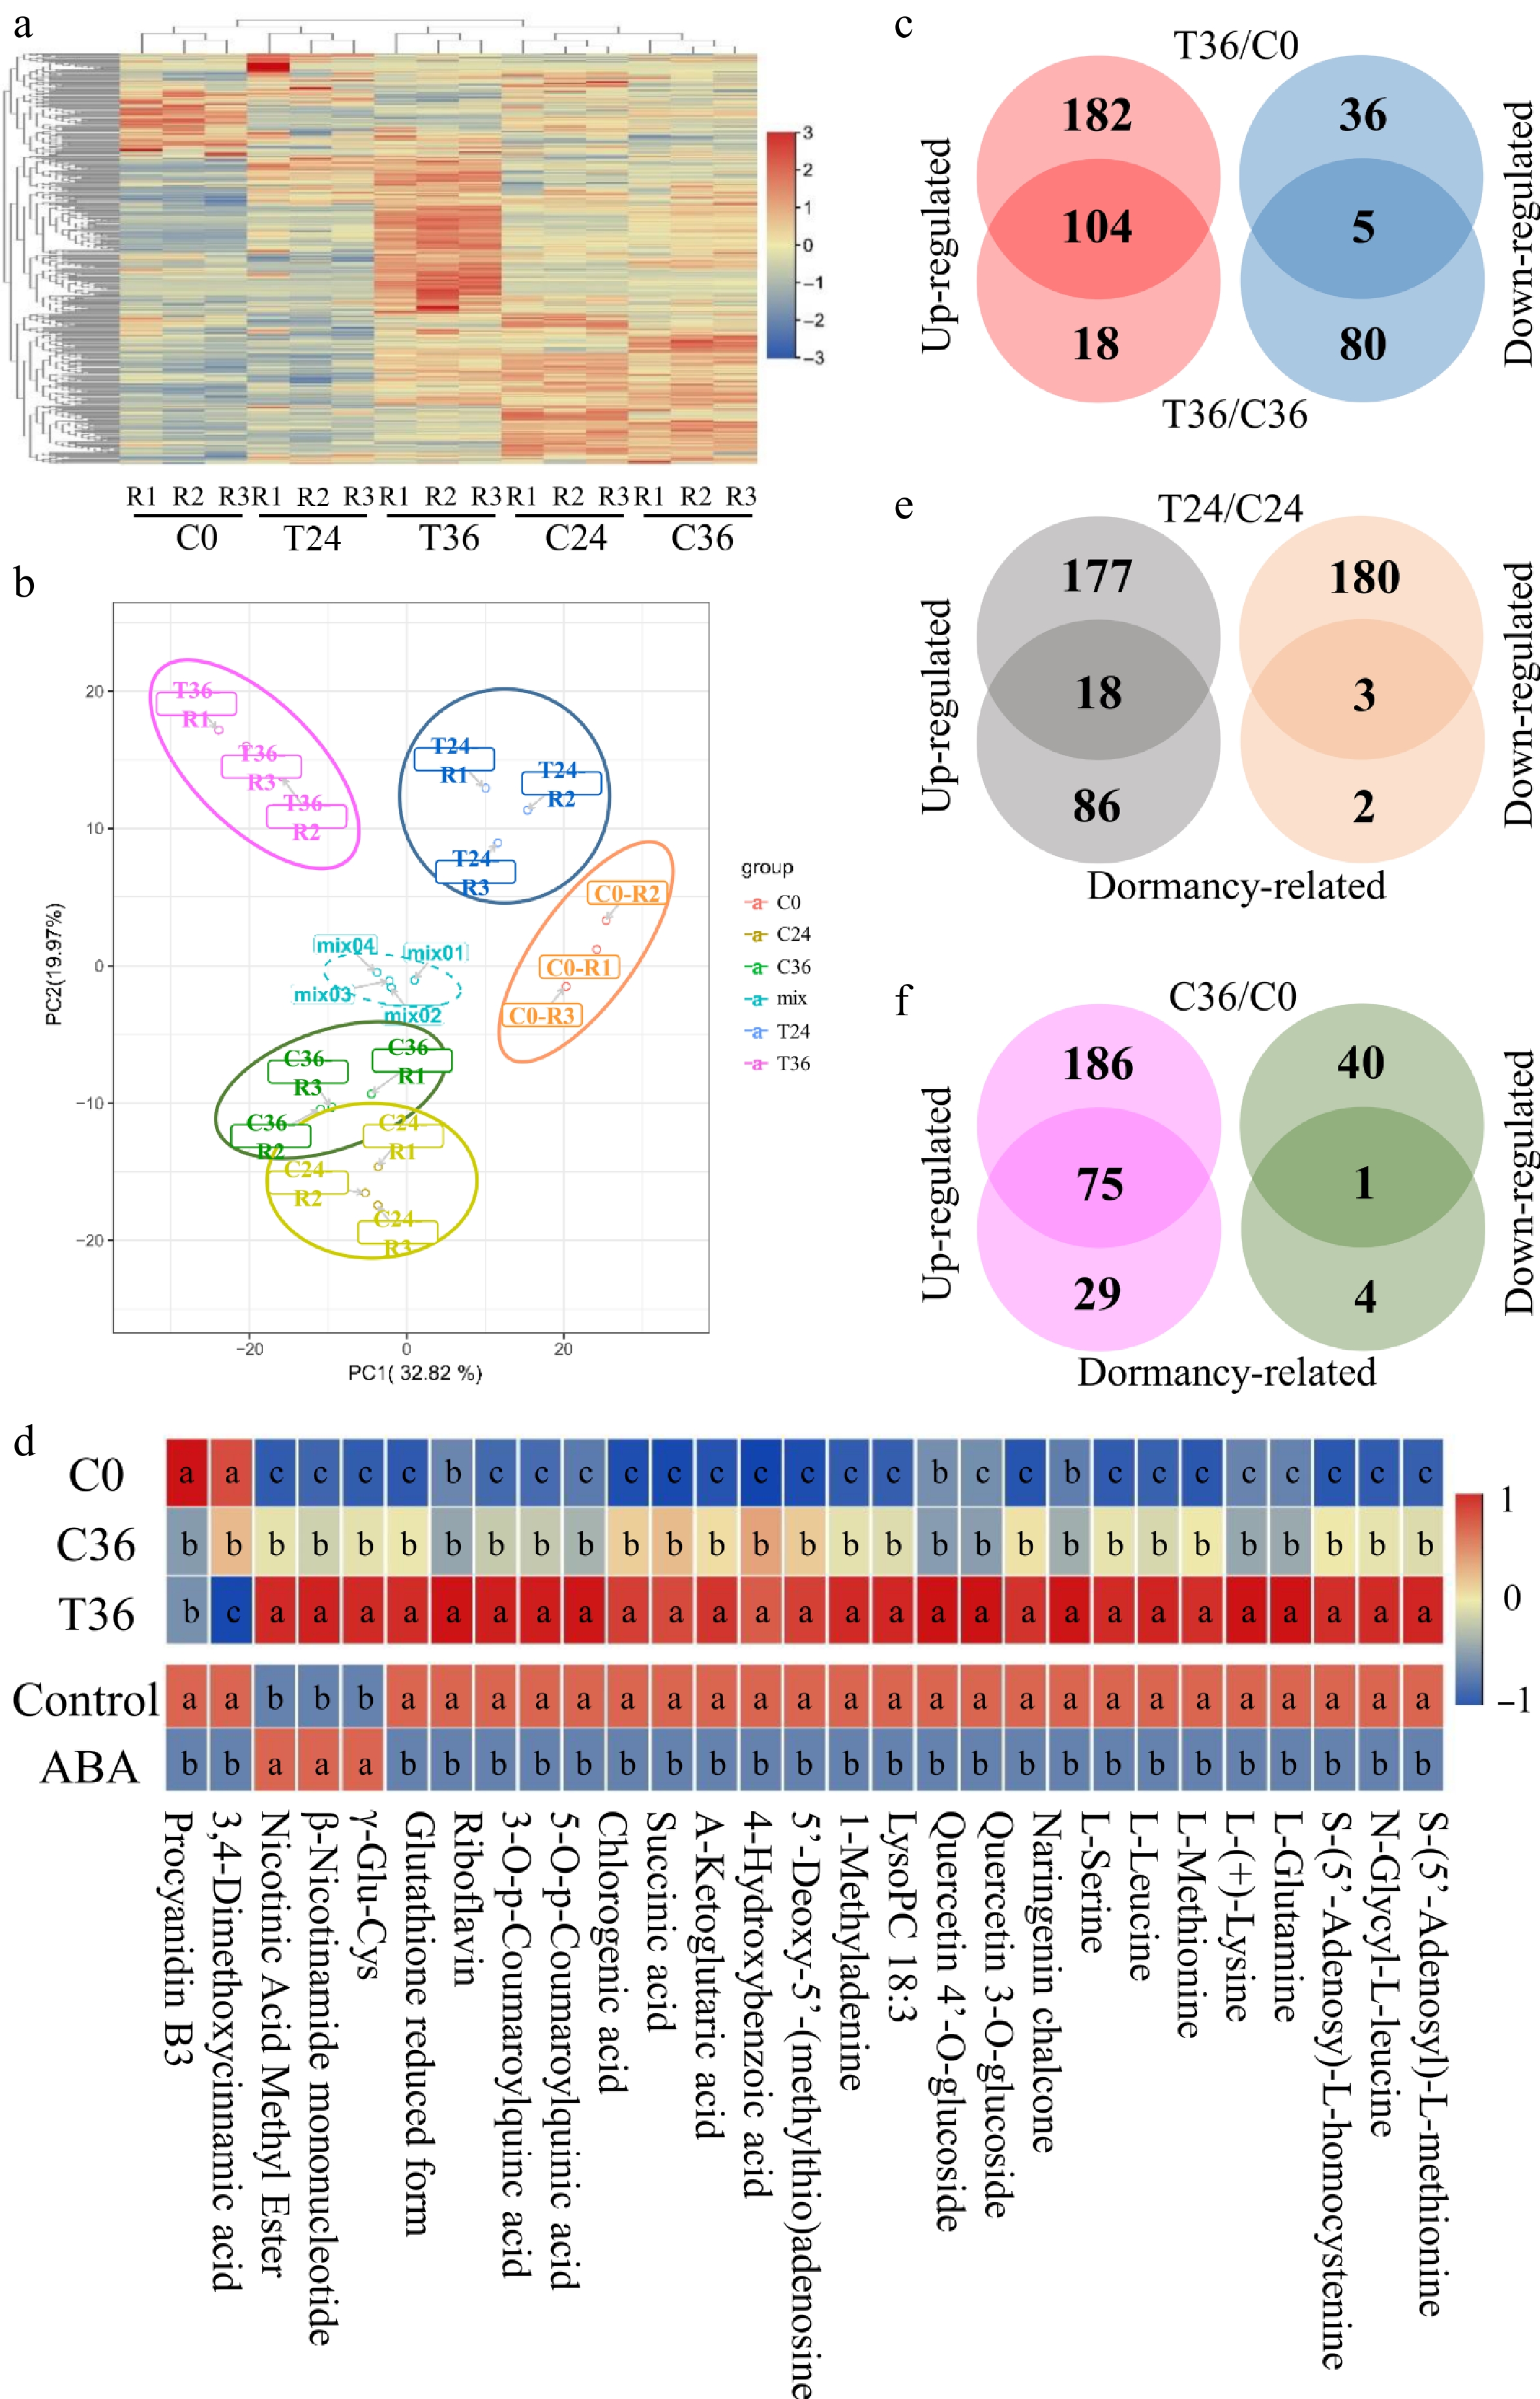
Figure 2.
Differential accumulation analyses of metabolic compounds associated with seed germination. (a) A heatmap showing the levels of 612 metabolic compounds in coated seeds at 0 (C0), 24 (C24), and 36 h (C36), and uncoated seeds at 24 (T24) and 36 h (T36). R1, R2, and R3 are the three replicates. The level increases with the transition from blue to red. (b) Principal component analysis of the metabolic compounds in five samples. (c) Identification of compounds that were responsive to seed germination. Differential accumulation was tested between T36 and C0 and between T36 and C36. (d) Exogenous ABA treatment influences the levels of 29 compounds that are responsive to seed germination. The top panel is the levels of 29 compounds in C0, C36, and T36; the bottom panel shows the levels of 29 compounds in ABA-treated and control seeds. Student's t-test was used to assess significant differences. The lowercase letters a, b, and c indicate significant differences at p < 0.05. (e) Identification of compounds that are responsive to seed germination and differentially accumulated between T24 and C24. Dormancy-related indicates compounds that are responsive to seed germination. (f) Identification of compounds that are responsive to seed germination and differentially accumulated between C36 and C0.
-
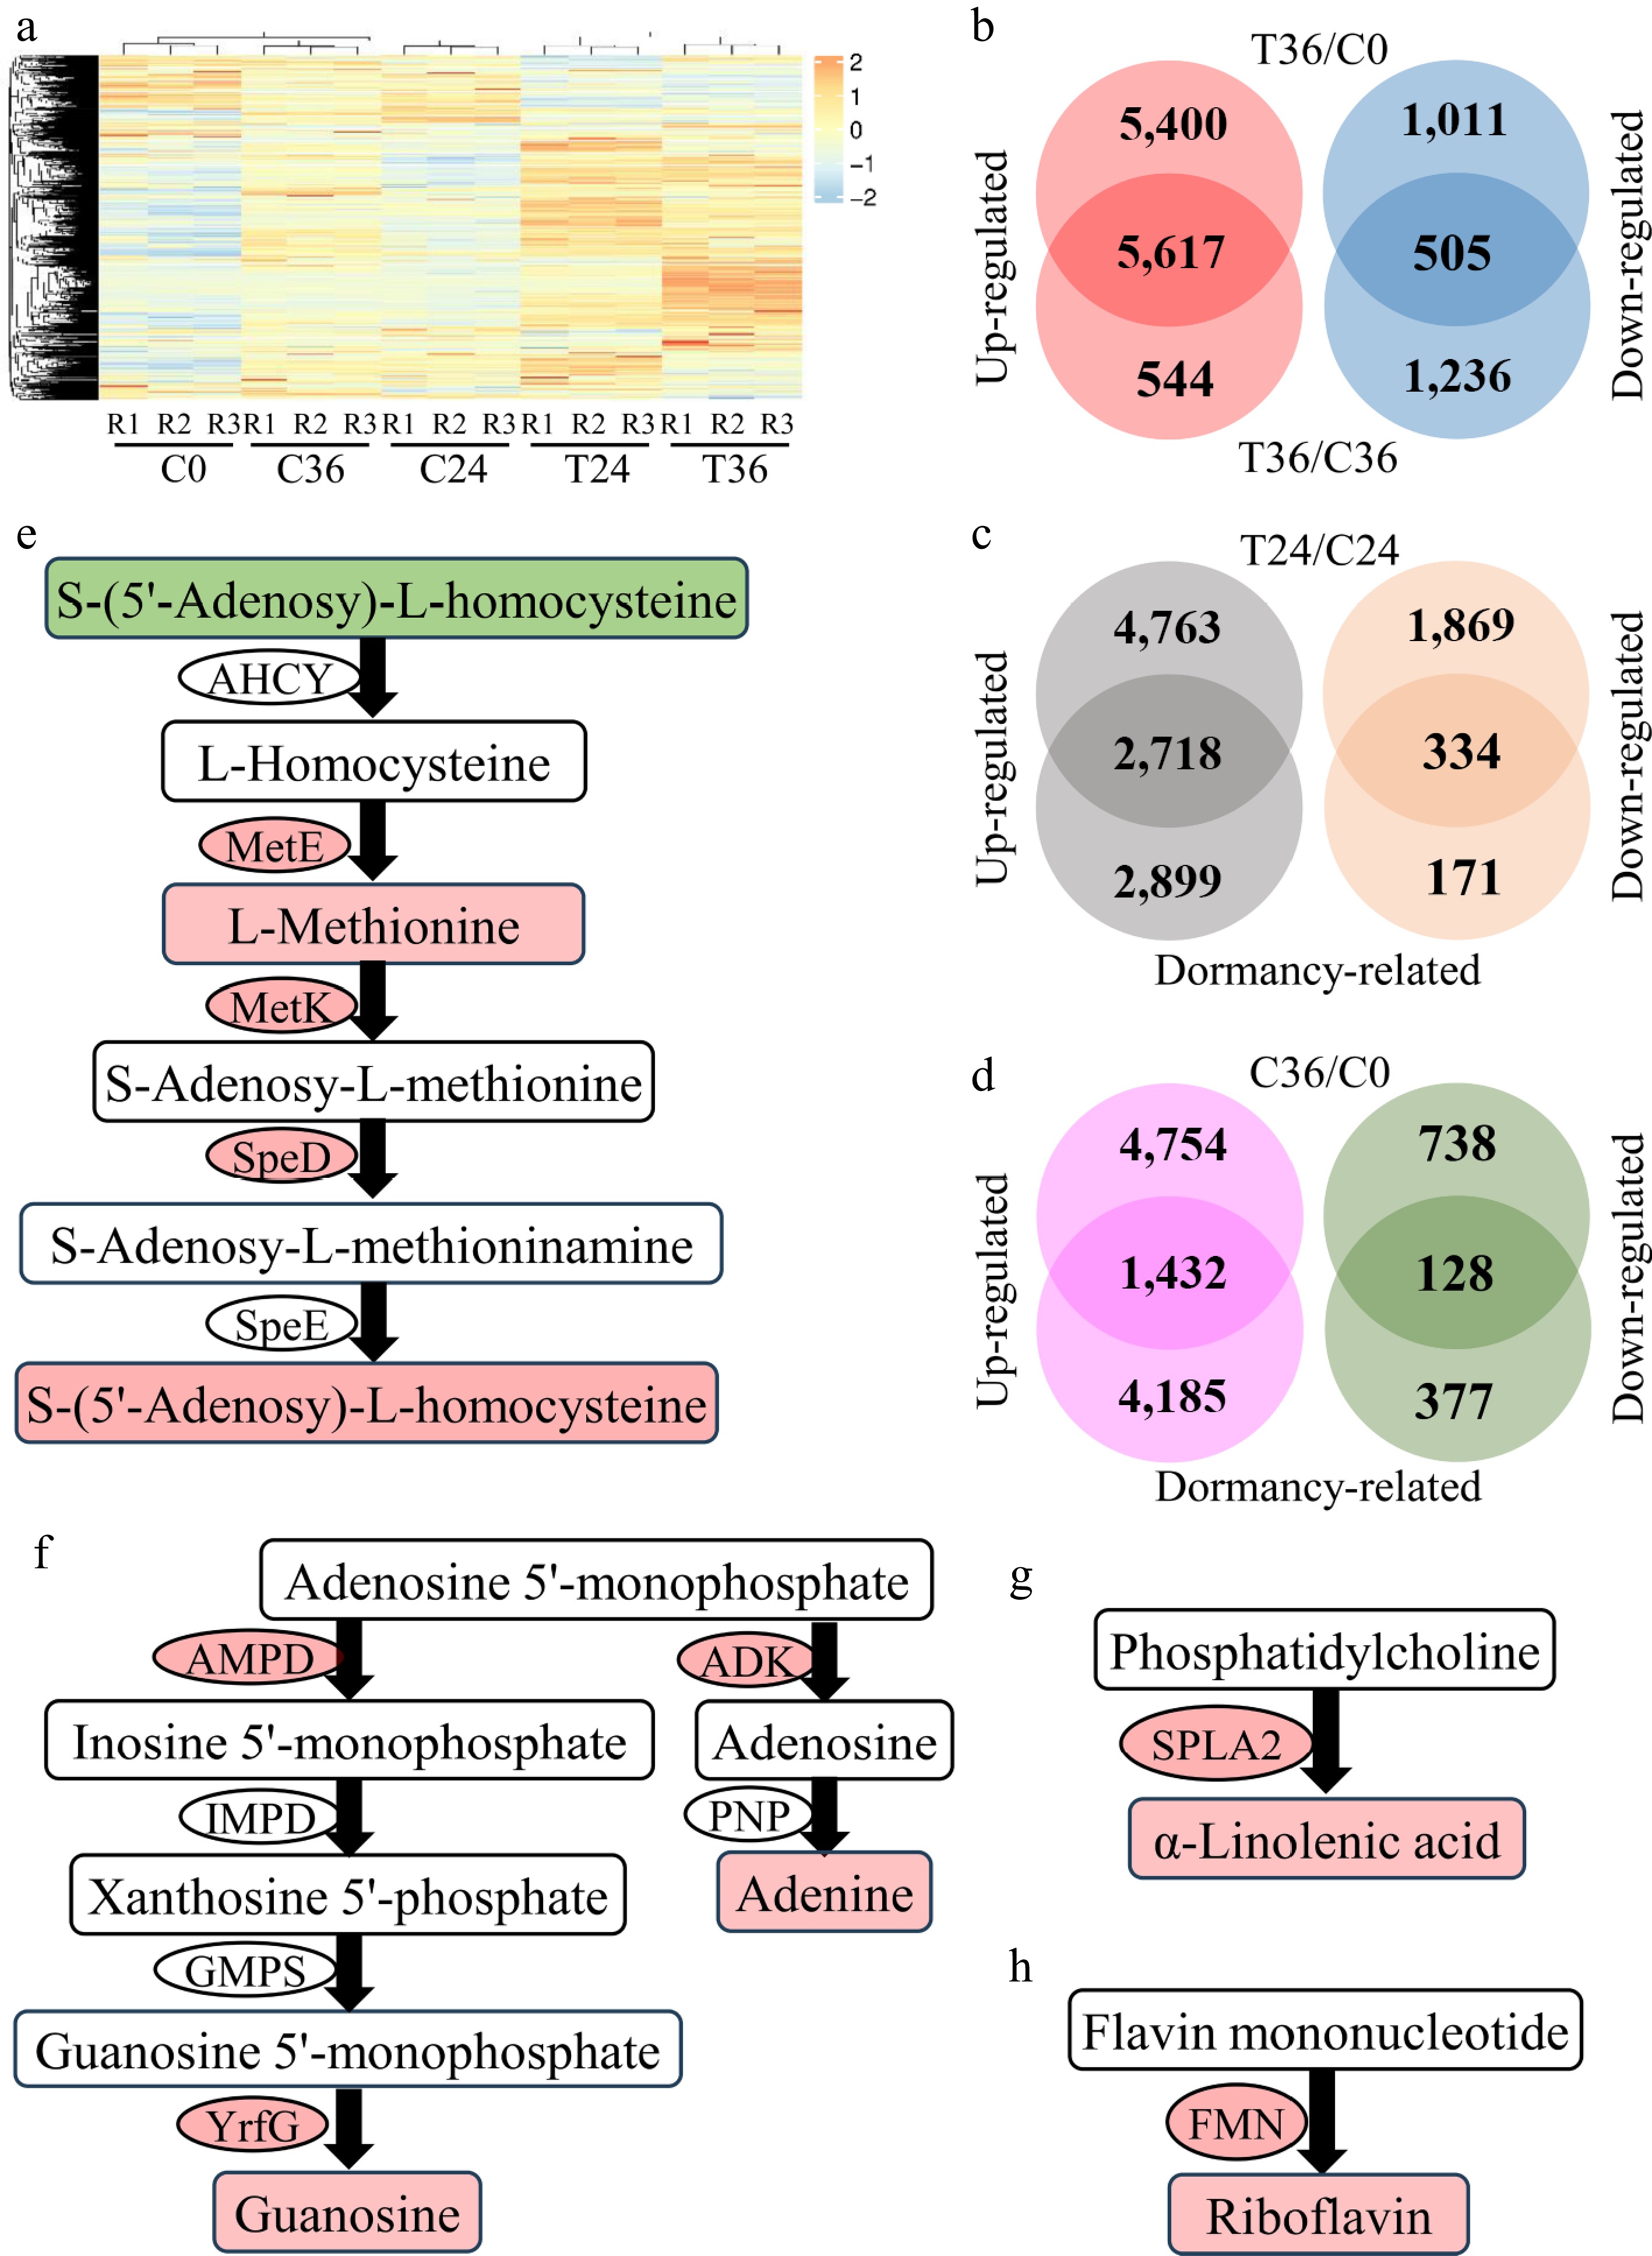
Figure 3.
Differential expression analyses of genes associated with seed germination. (a) A heatmap showing the expression levels of 30,468 genes in coated seeds at 0 (C0), 24 (C24), and 36 h (C36) and uncoated seeds at 24 (T24) and 36 h (T36). R1, R2, and R3 are the three replicates. The level increases with the transition from blue to red. (b) Identification of genes that are responsive to seed germination. Differential expression was tested between T36 and C0 and between T36 and C36. (c) Identification of genes that are responsive to seed germination and differentially expressed between T24 and C24. "Dormancy-related" indicates genes that are responsive to seed germination. (d) Identification of genes that are responsive to seed germination and differentially expressed between C36 and C0. (e) Cysteine and methionine metabolism. AHCY, adenosylhomocysteinase; MetE, 5-methyltetrahydropteroyltriglutamate–homocysteine methyltransferase; MetK, S-adenosylmethionine synthetase; SpeD, S-adenosylmethionine decarboxylase; SpeE, spermidine synthase. The compounds and genes with a red background are increased in T36, compared with C36. In contrast, the compounds with a green background are decreased in T36. (f) Purine metabolism. AMPD, AMP deaminase; IMPD, IMP dehydrogenase; GMPS, GMP synthase; YrfG, 5'-nucleotidase; ADK, adenosine kinase; PNP, purine-nucleoside phosphorylase. (g) Biosynthesis of α-linolenic acid. SPLA2, secretory phospholipase A2. (h) Riboflavin biosynthesis. FMN, acid phosphatase.
-
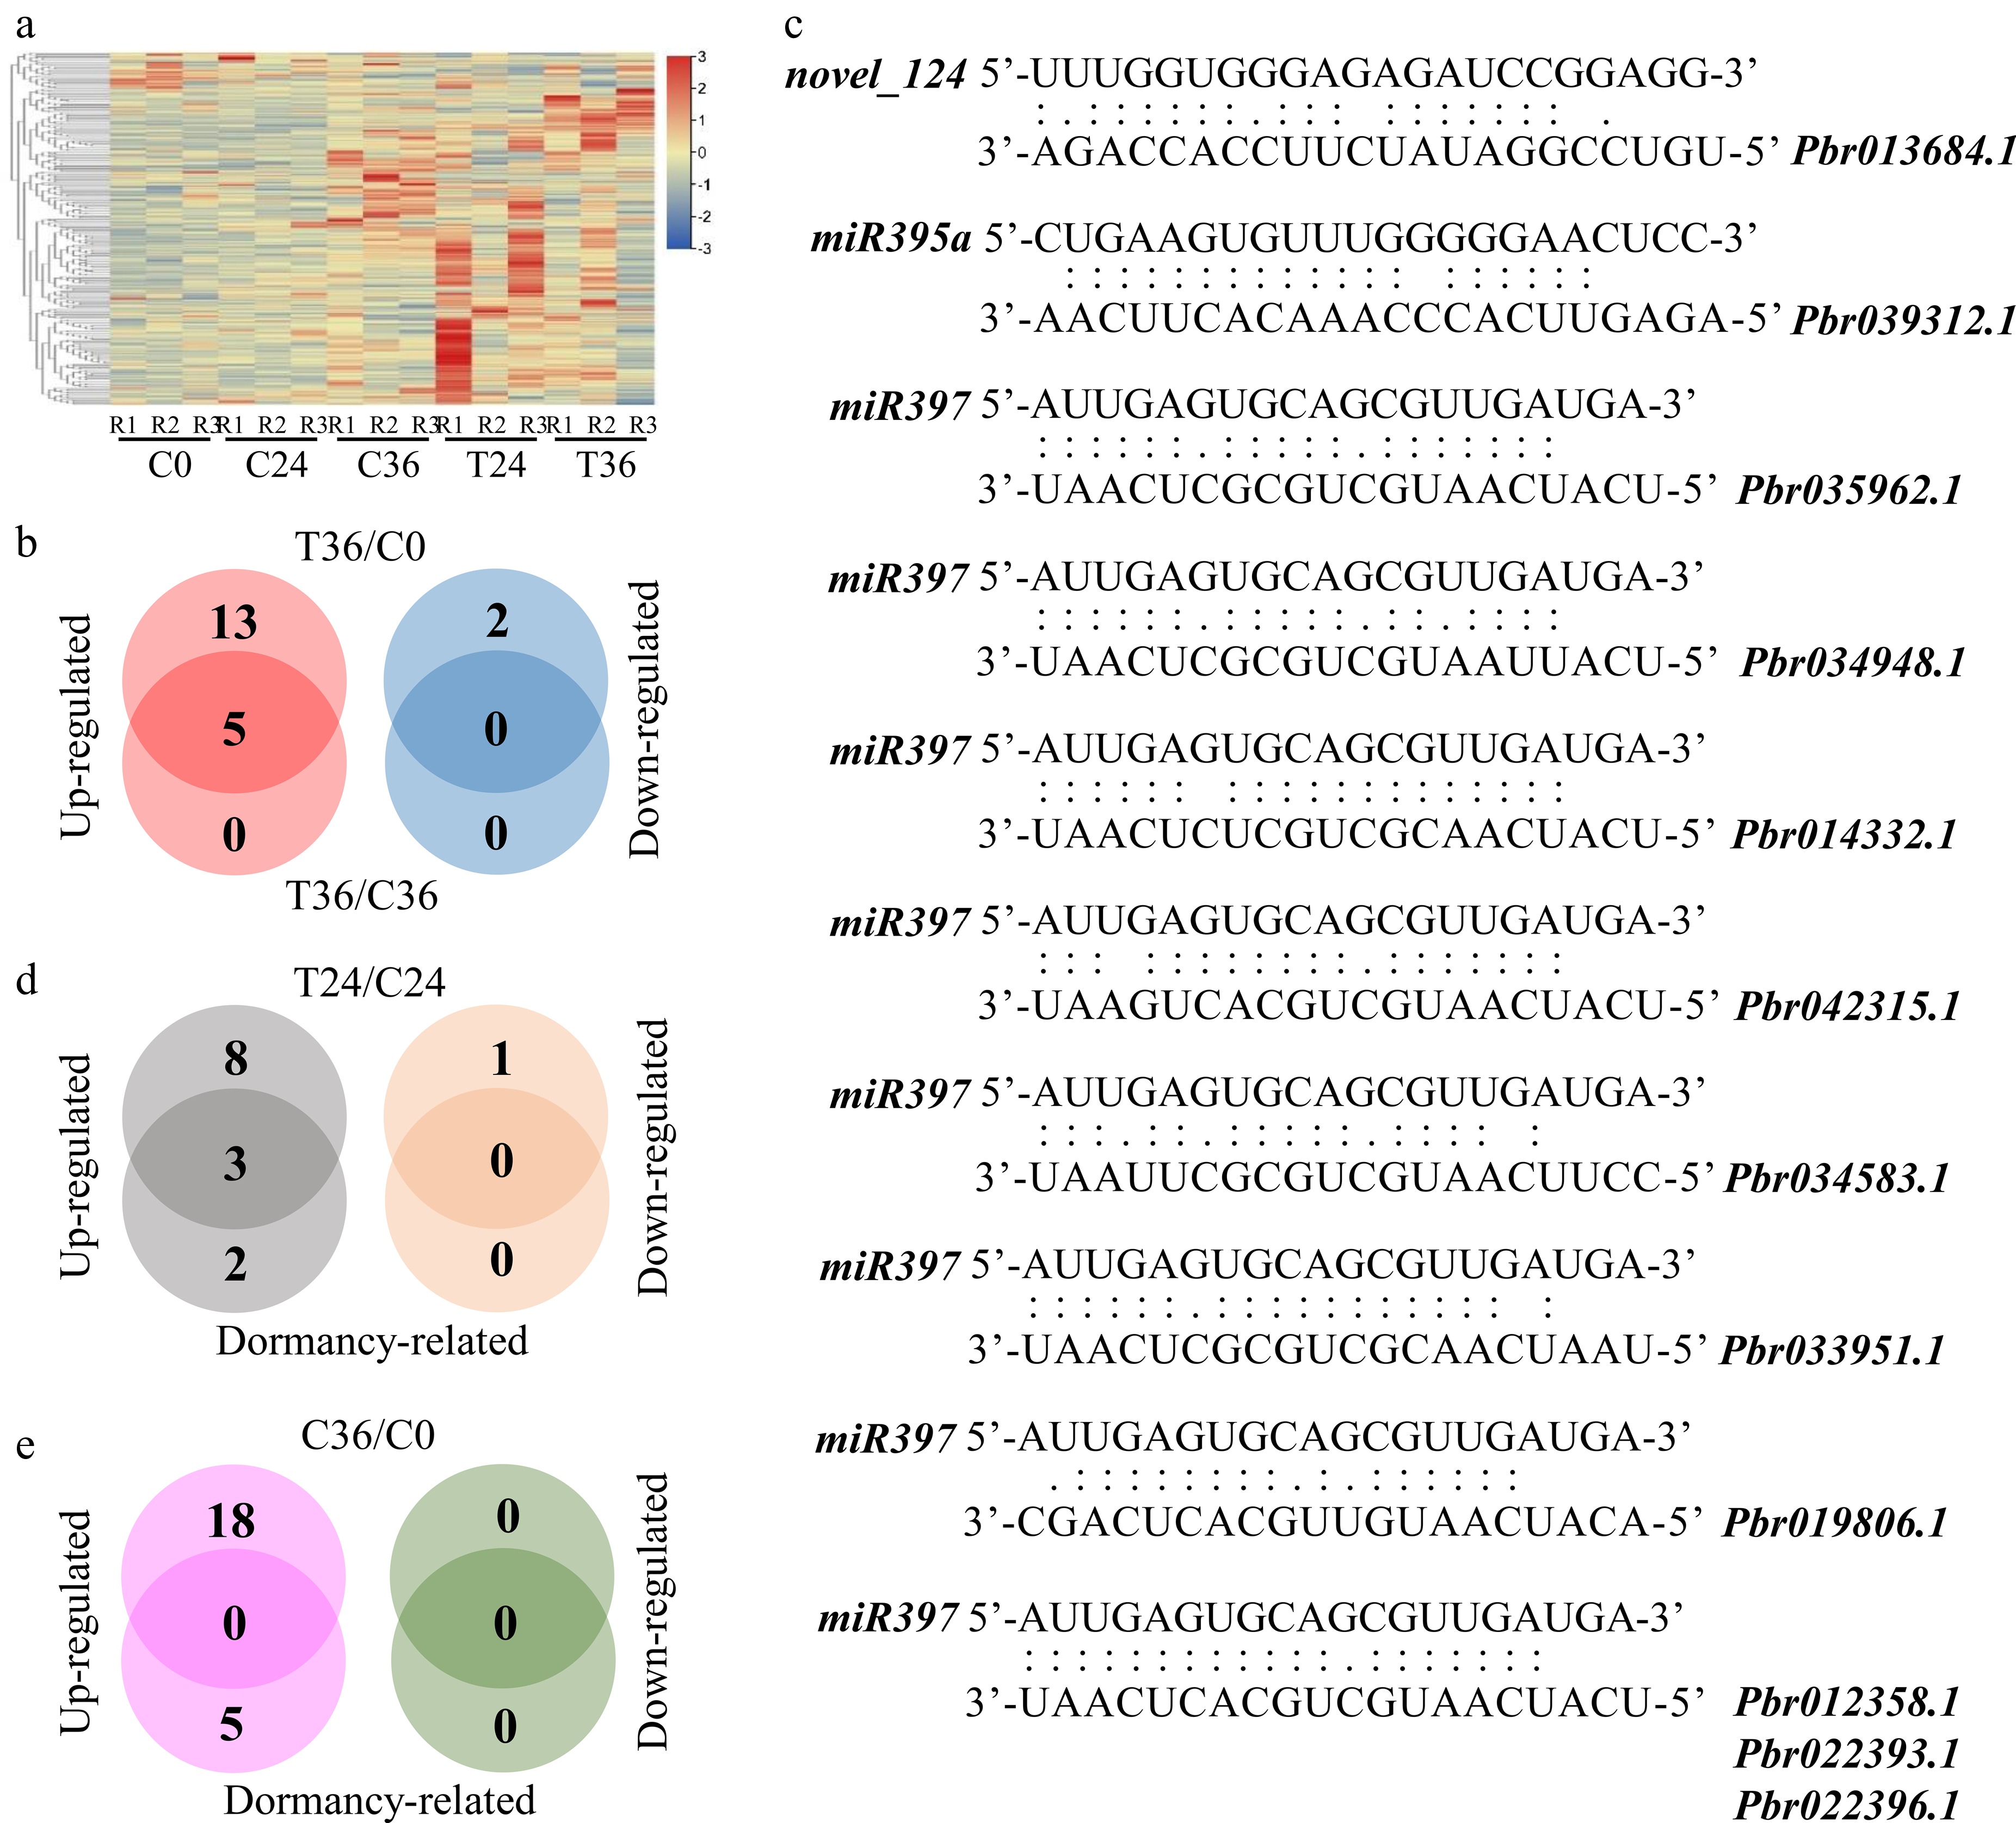
Figure 4.
Differential expression analyses of microRNAs associated with seed germination. (a) A heatmap showing the expression levels of 293 microRNAs in coated seeds at 0 (C0), 24 (C24), and 36 h (C36) and uncoated seeds at 24 (T24) and 36 h (T36). R1, R2, and R3 are the three replicates. The level increases with the transition from blue to red. (b) Identification of microRNAs that are responsive to seed germination. Differential expression was tested between T36 and C0 and between T36 and C36. (c) Prediction of microRNA–gene interactions. (d) Identification of microRNAs that are responsive to seed germination and differentially expressed between T24 and C24. Dormancy-related indicates microRNAs that are responsive to seed germination. (e) Identification of microRNAs that are responsive to seed germination and differentially expressed between C36 and C0.
-
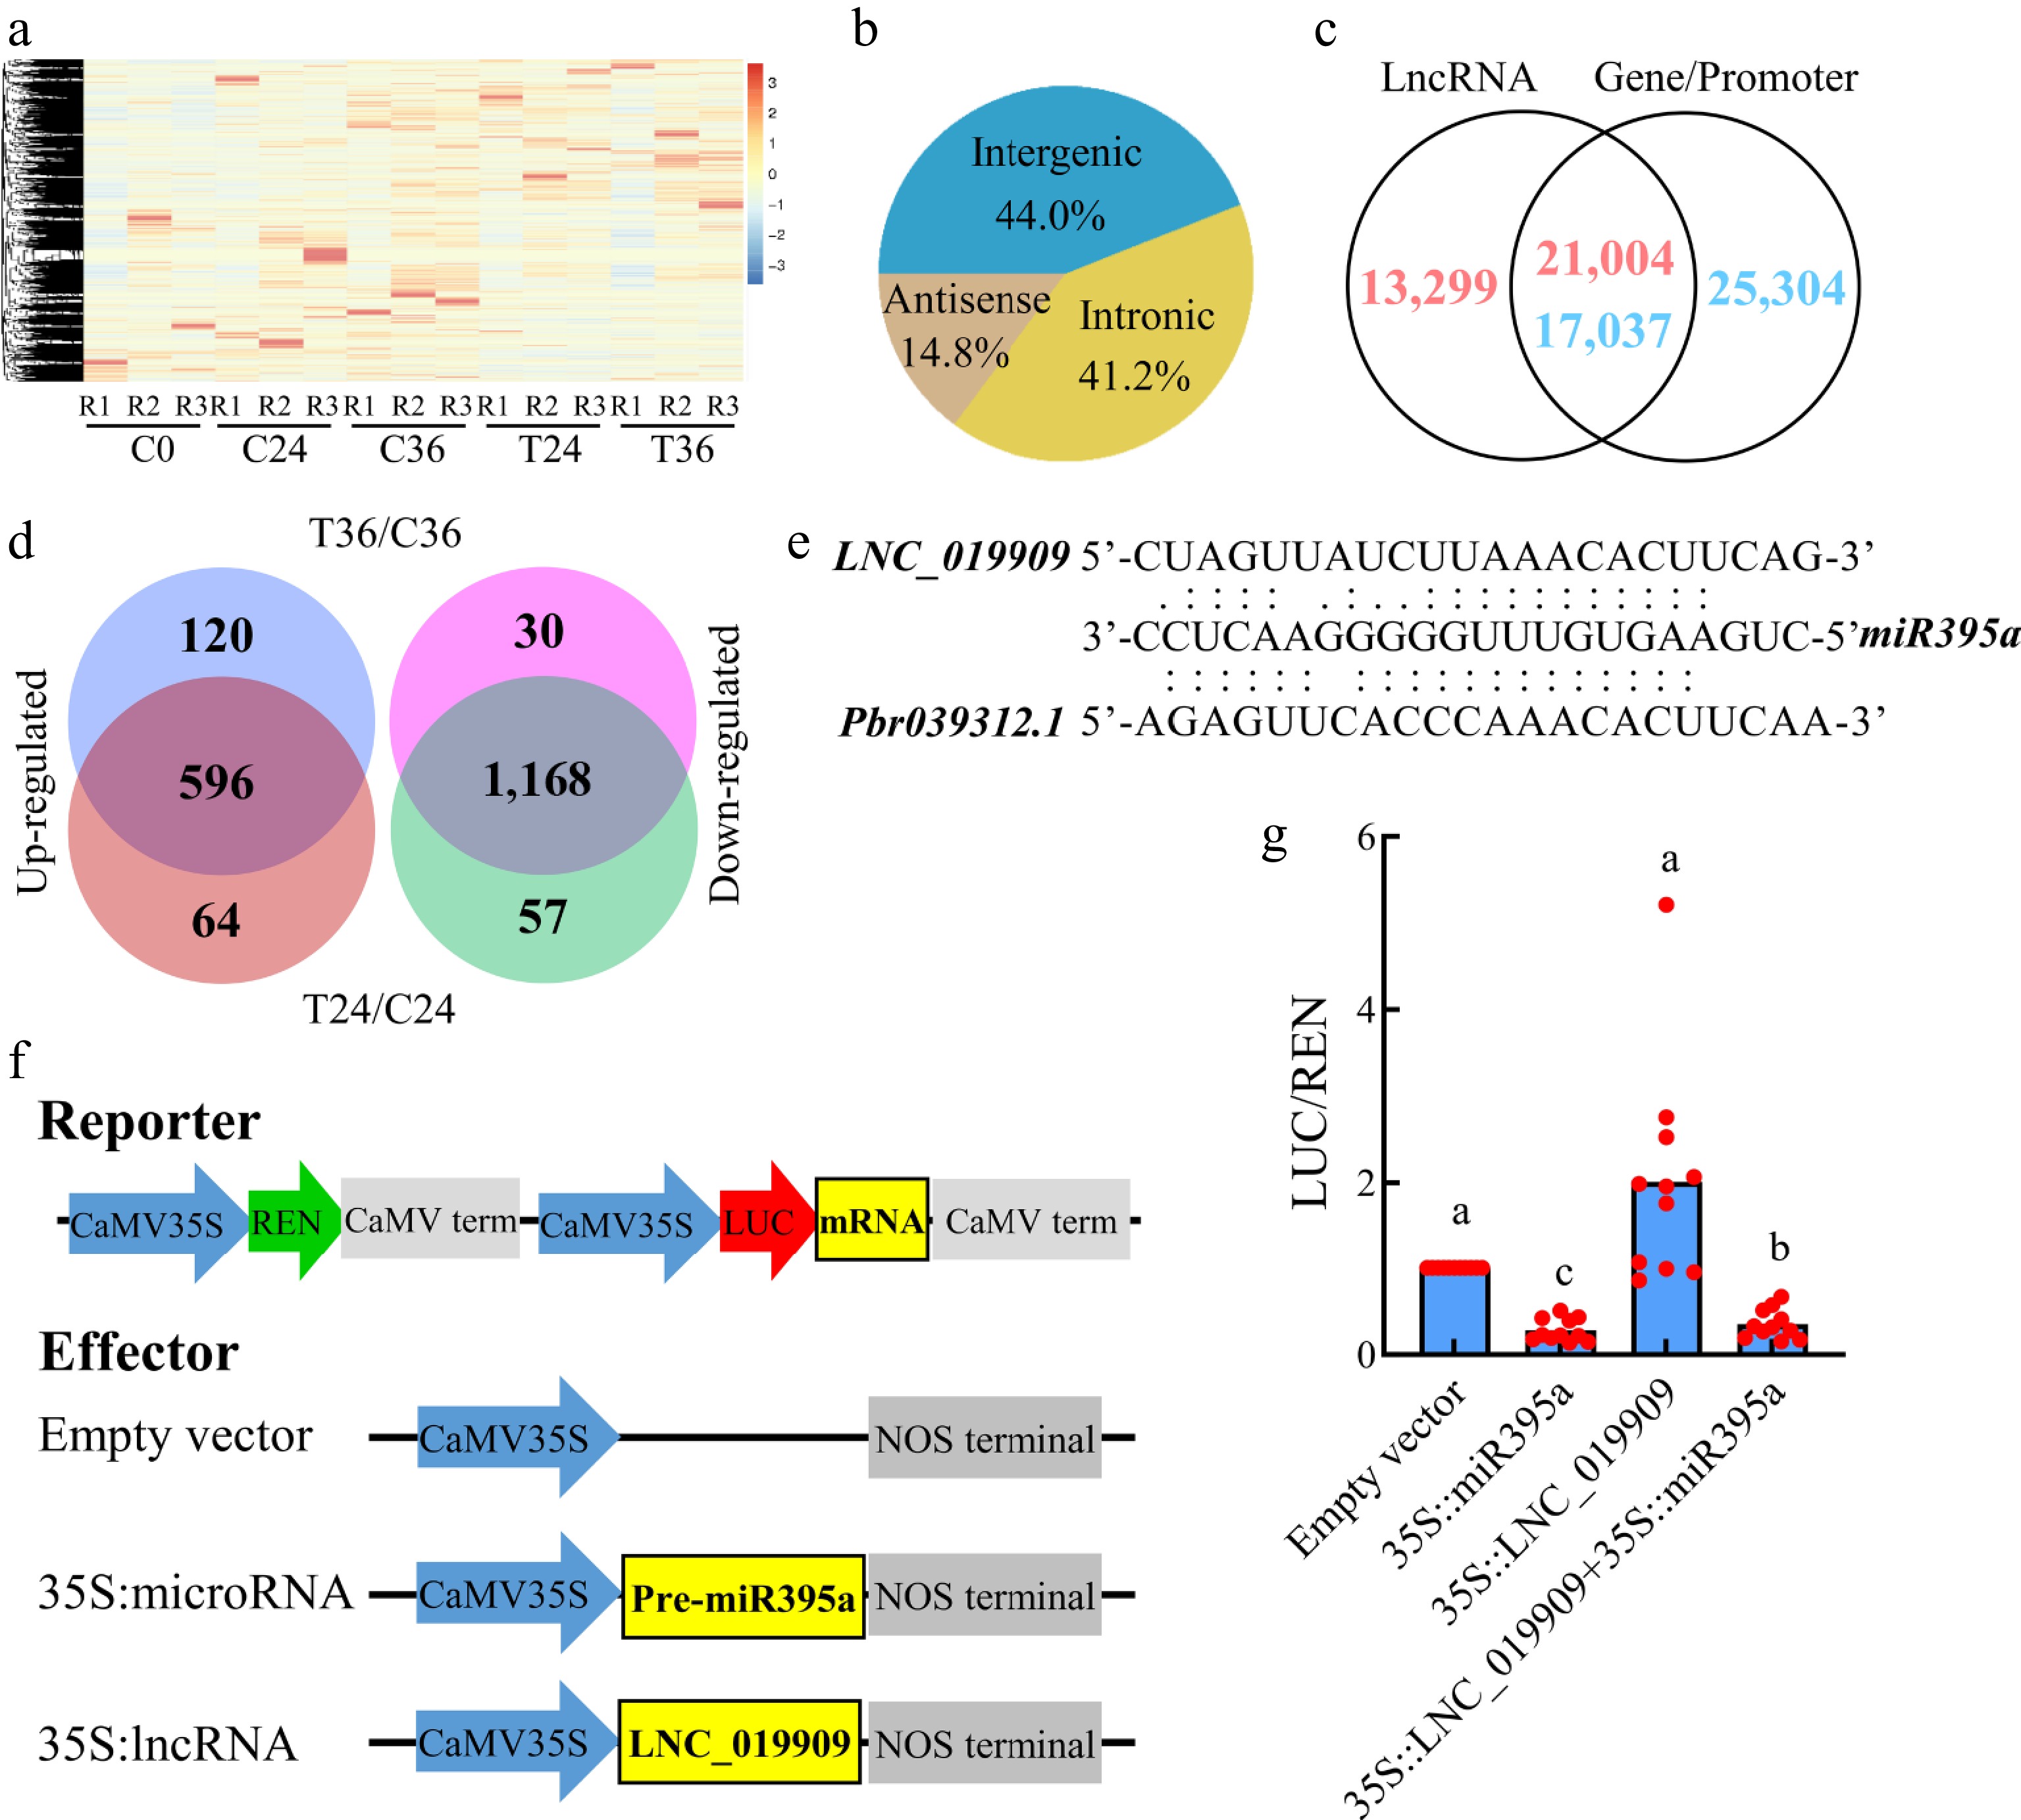
Figure 5.
Identification and differential expression analyses of lncRNAs associated with seed germination. (a) A heatmap showing the expression levels of of 34,303 lncRNAs in coated seeds at 0 (C0), 24 (C24), and 36 h (C36) and uncoated seeds at 24 (T24) and 36 h (T36). R1, R2, and R3 are the three replicates. The level increases with the transition from blue to red. (b) Distribution of lncRNAs in the antisense, intronic, and intergenic regions. (c) Identification of lncRNAs overlapping with gene bodies or promoters. (d) Identification of lncRNAs that are differentially expressed between T36 and C36 and T24 and C24. (e) Prediction of lncRNA–microRNA–gene interactions. (f) Construction of reporter and effector vectors. (g) Dual luciferase assay of lncRNA–microRNA–mRNA interactions.
Figures
(5)
Tables
(0)