-
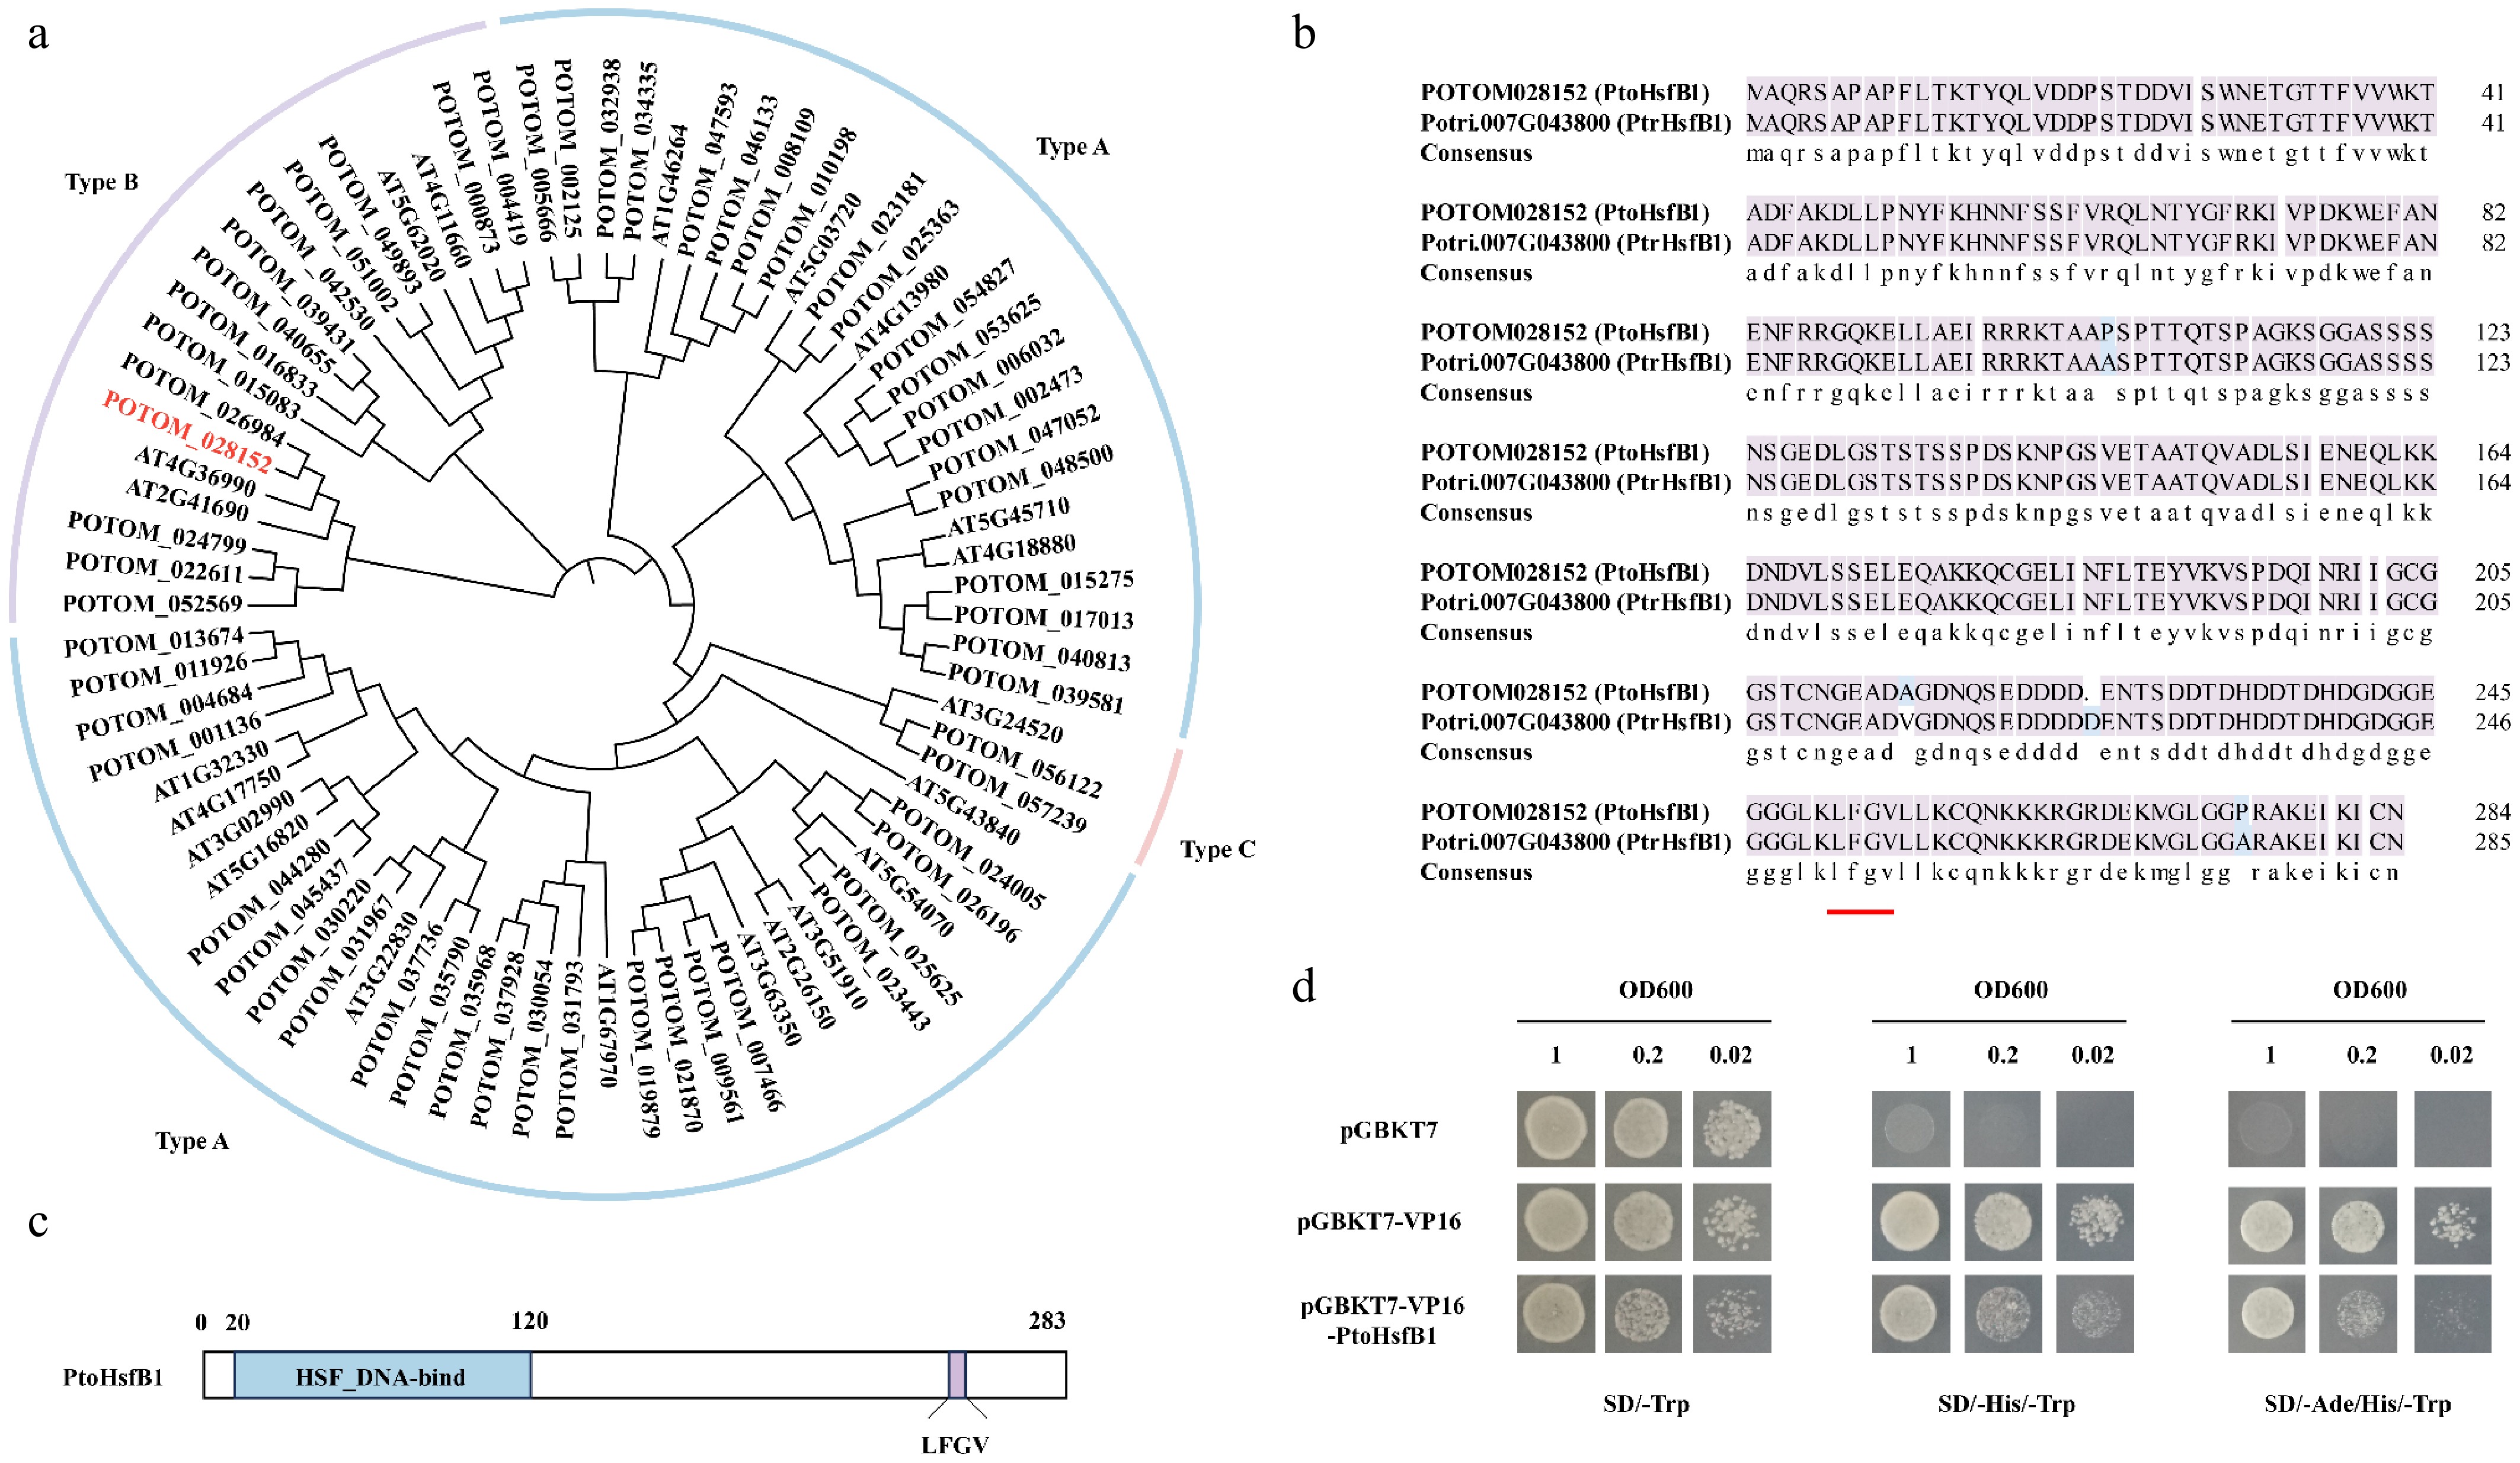
Figure 1.
The protein sequence analysis of PtoHsfB1 in P. tomentosa. (a) A NJ phylogenetic tree of Hsfs from A. thaliana and P. tomentosa was generated. The line colors blue, purple, and pink represent subgroups A, B, and C, respectively. (b) Comparison of the protein sequence of PtoHsfB1 and PtrHsfB1. The red underlined part represents the core tetrapeptide of the subgroup B transcriptional repressor Hsf. (c)The protein structure of PtoHsfB1. The blue part represents the Hsf DNA binding domain, and the purple part represents the core tetrapeptide 'LFGV' of the repressor domain. (d) Yeast transcriptional activation assay for PtoHsfB1 (negative control: pGBKT7; positive control: pGBKT7-VP16).
-
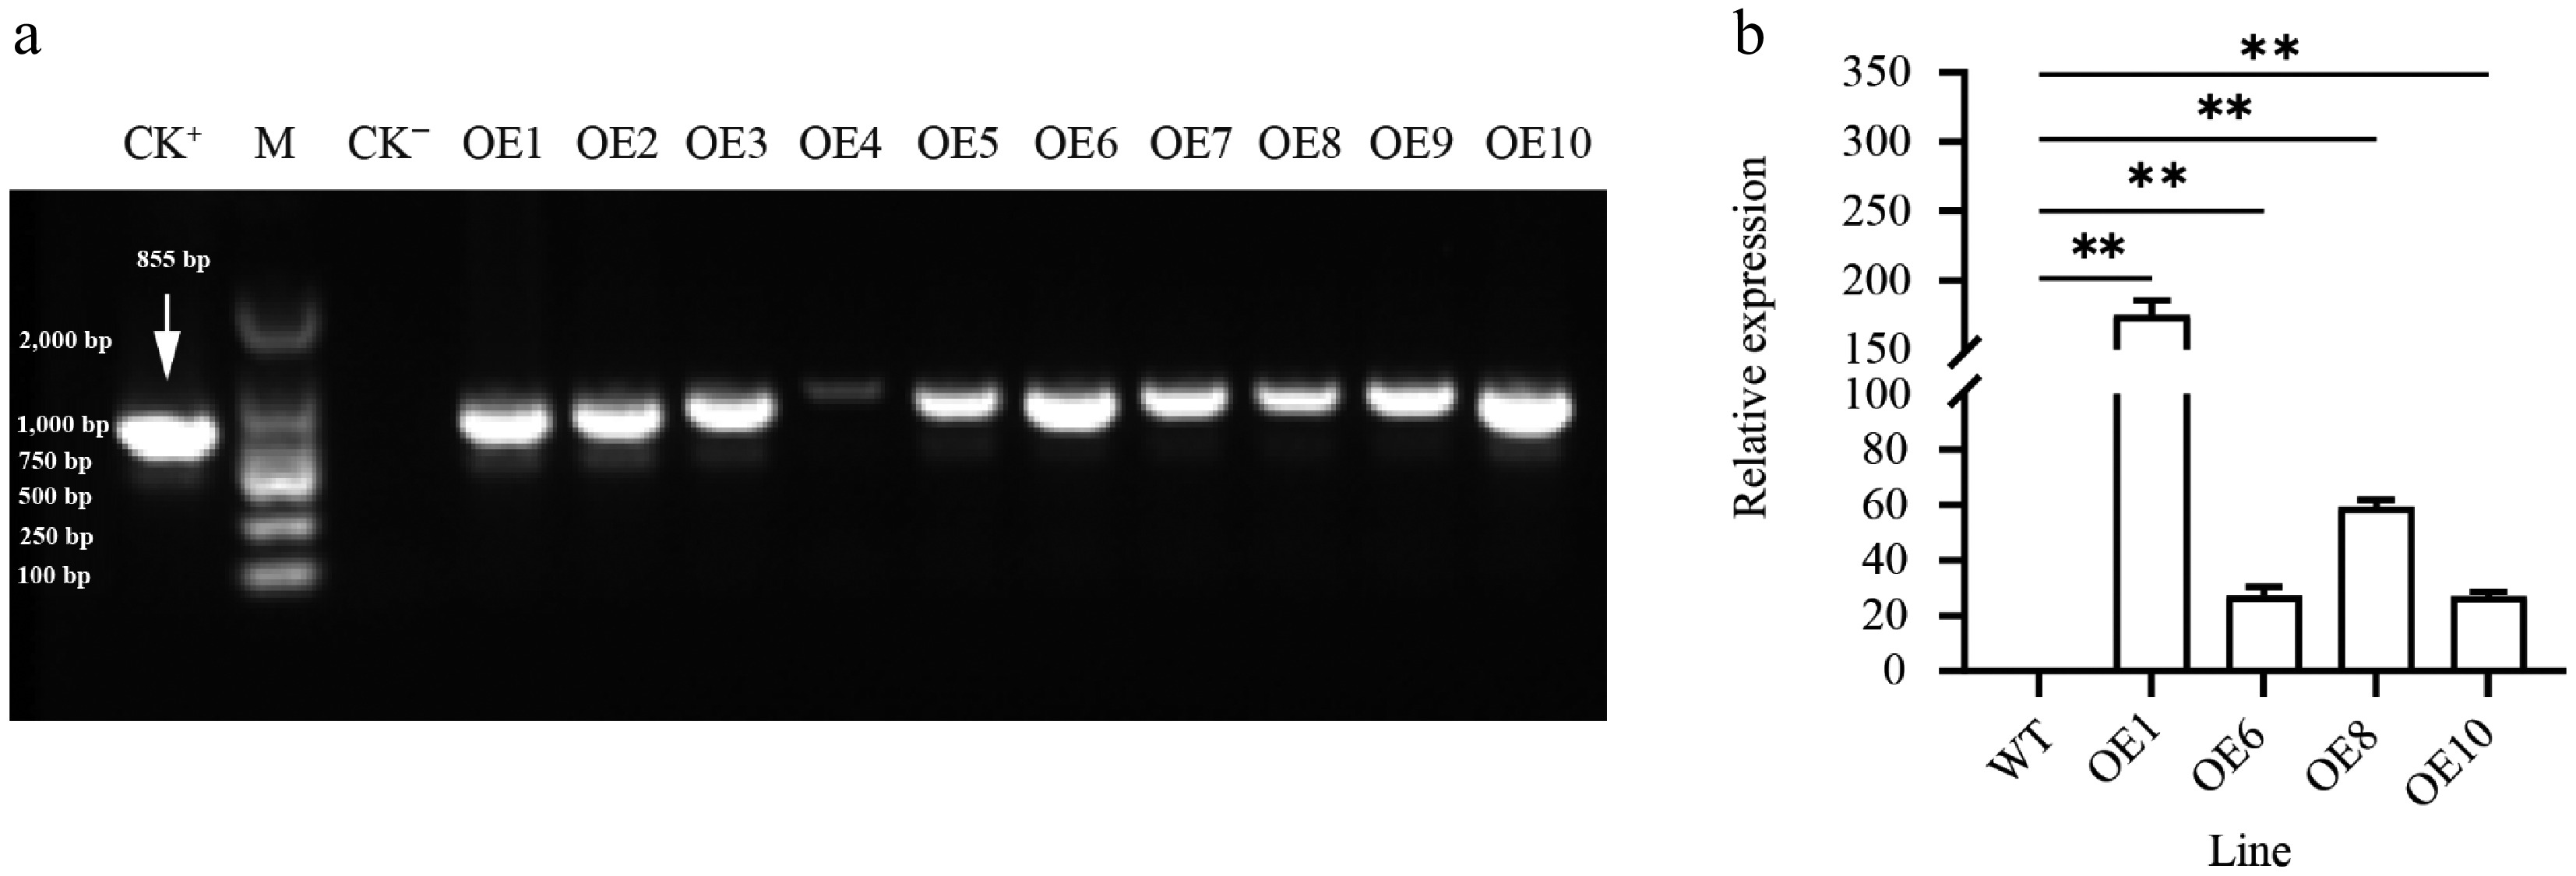
Figure 2.
Expression of PtoHsfB1 in leaves of plantlets. (a) PCR amplification of PtoHsfB1 from WT and different transgenic lines. CK+: Plasmid pBI121-PtoHsfB1, M: DL2000 DNA marker, CK−: untransformed line. (b) Relative quantification of RNA in transgenic plants and WT plants.
-
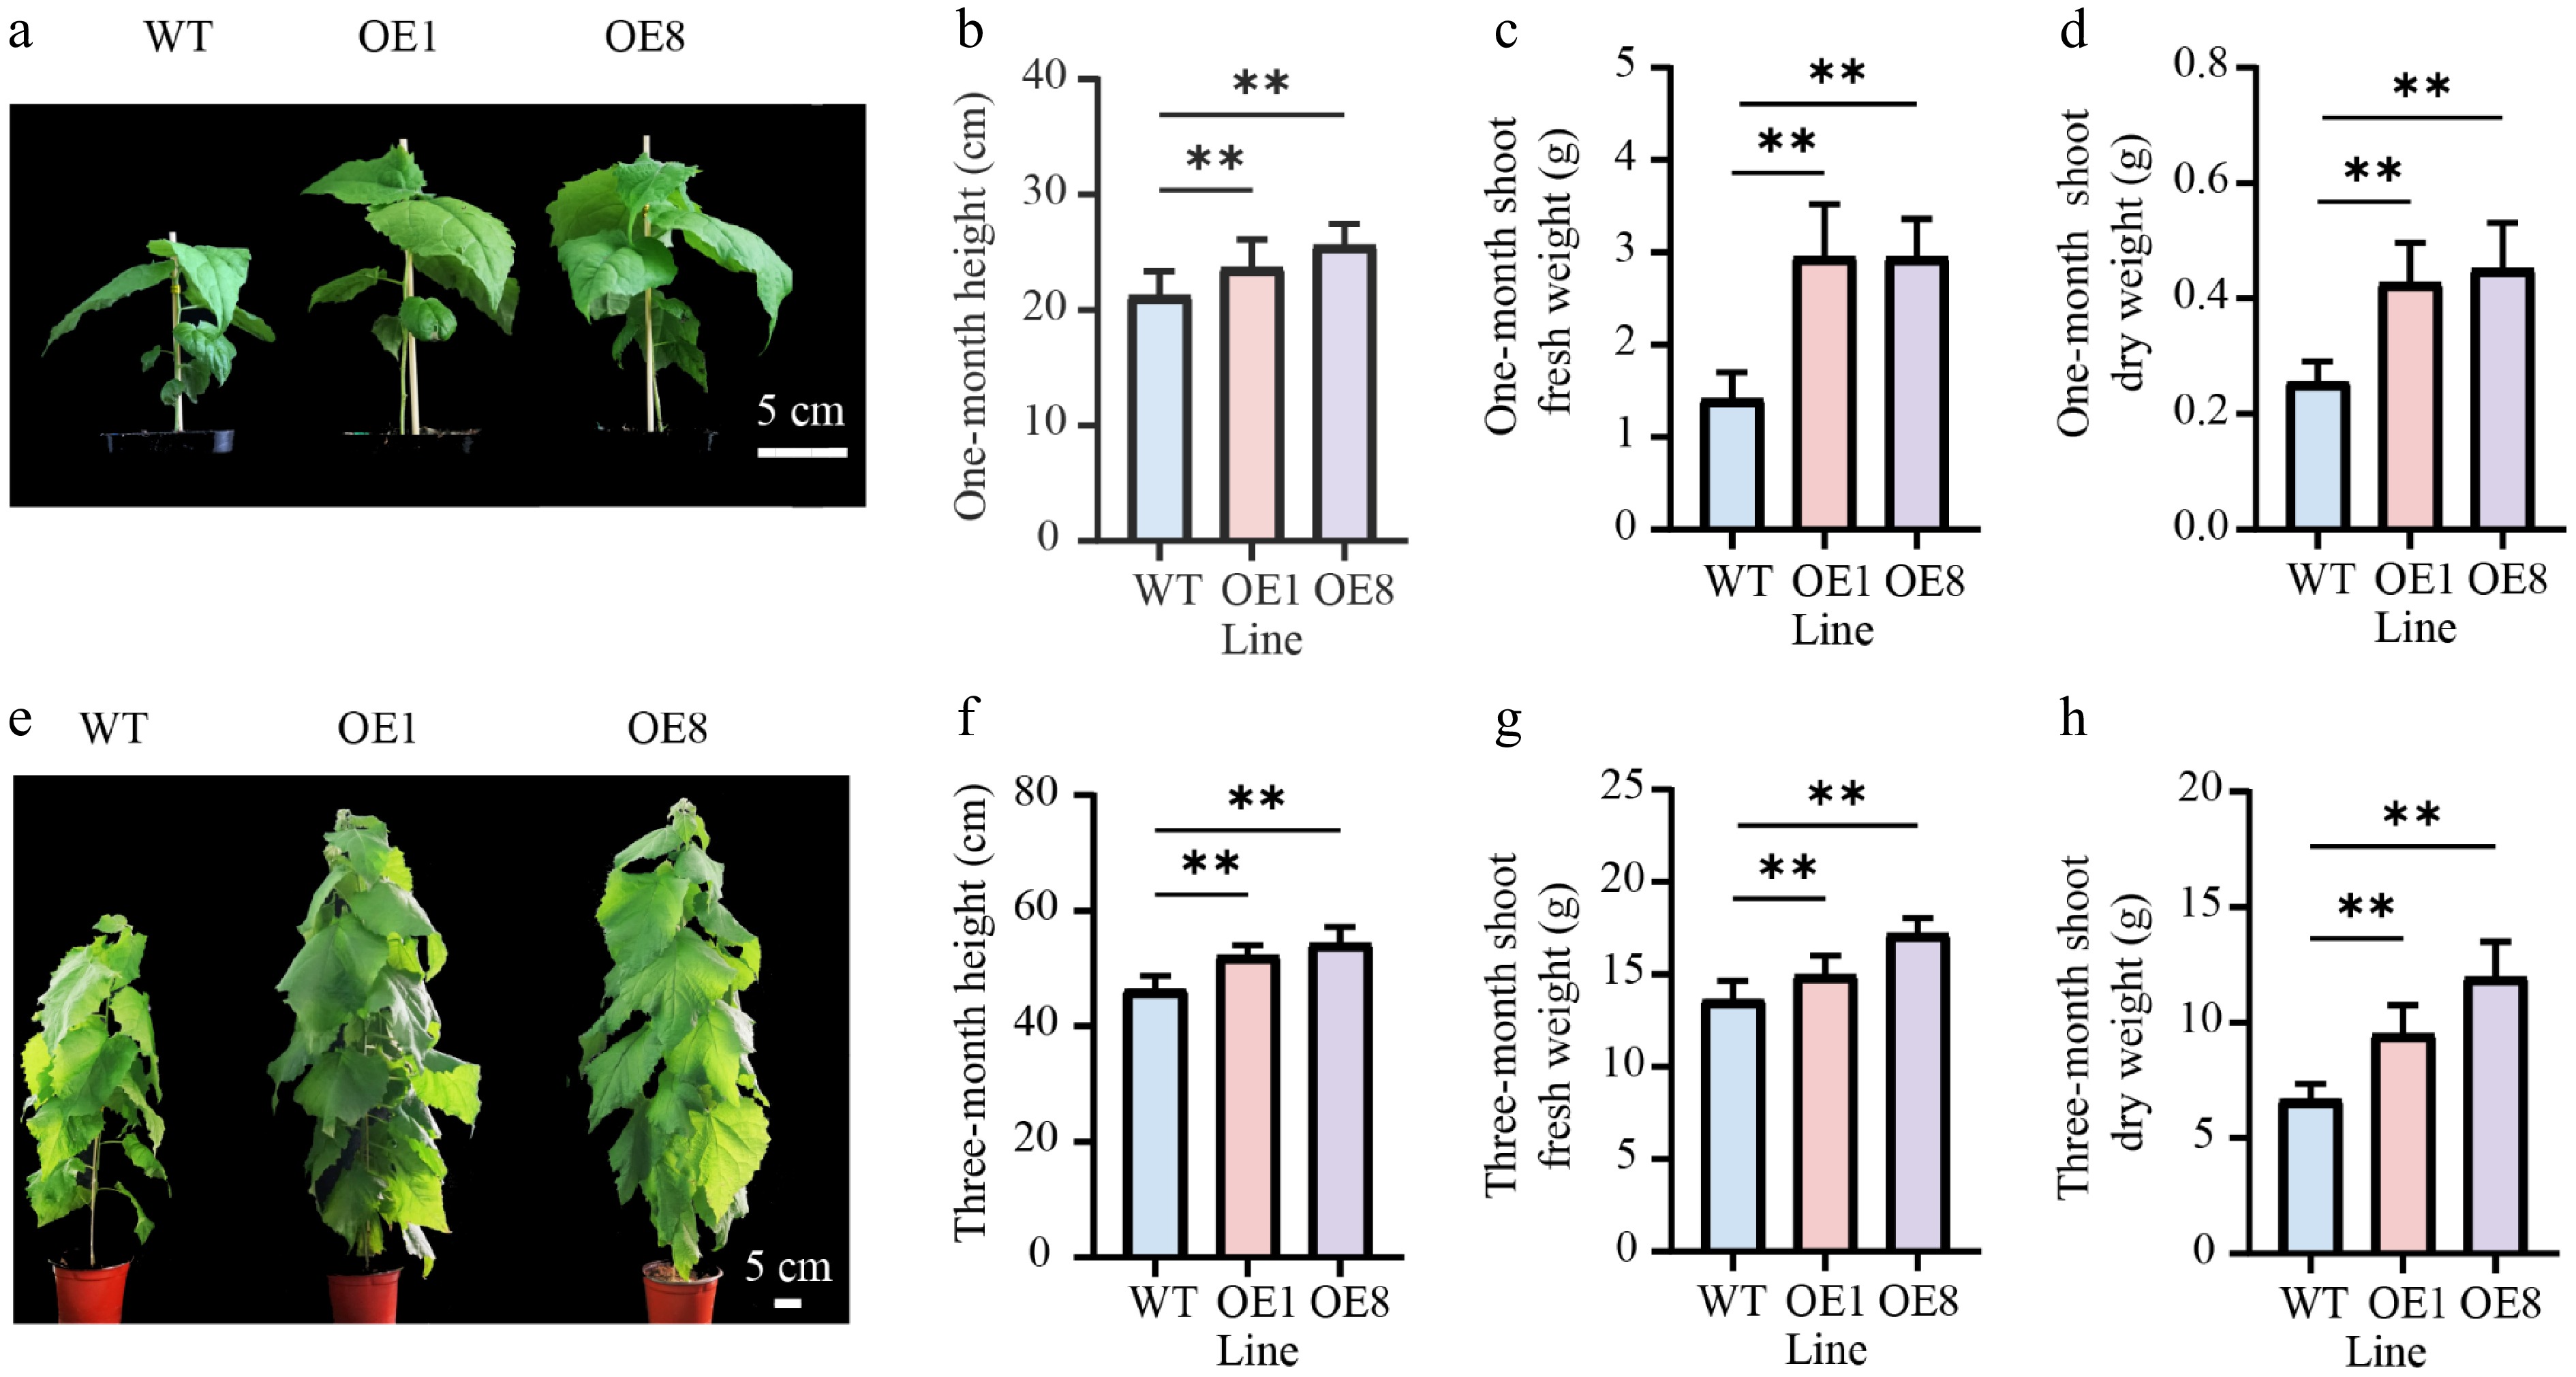
Figure 3.
Overexpressing PtoHsfB1 promoted shoot growth in transgenic poplars. (a) The shoot phenotype of one-month-old plantlets. Scale bar = 5 cm. (b) The height of one-month-old plantlets. (c) The shoot fresh weight of one-month-old plantlets. (d) The shoot dry weight of one-month-old plantlets. (e) The shoot phenotype of three-month-old plantlets. Scale bar = 5 cm. (f) The height of three-month-old plantlets. (g) The shoot fresh weight of three-month-old plantlets. (h) The shoot dry weight of three-month-old plantlets.
-
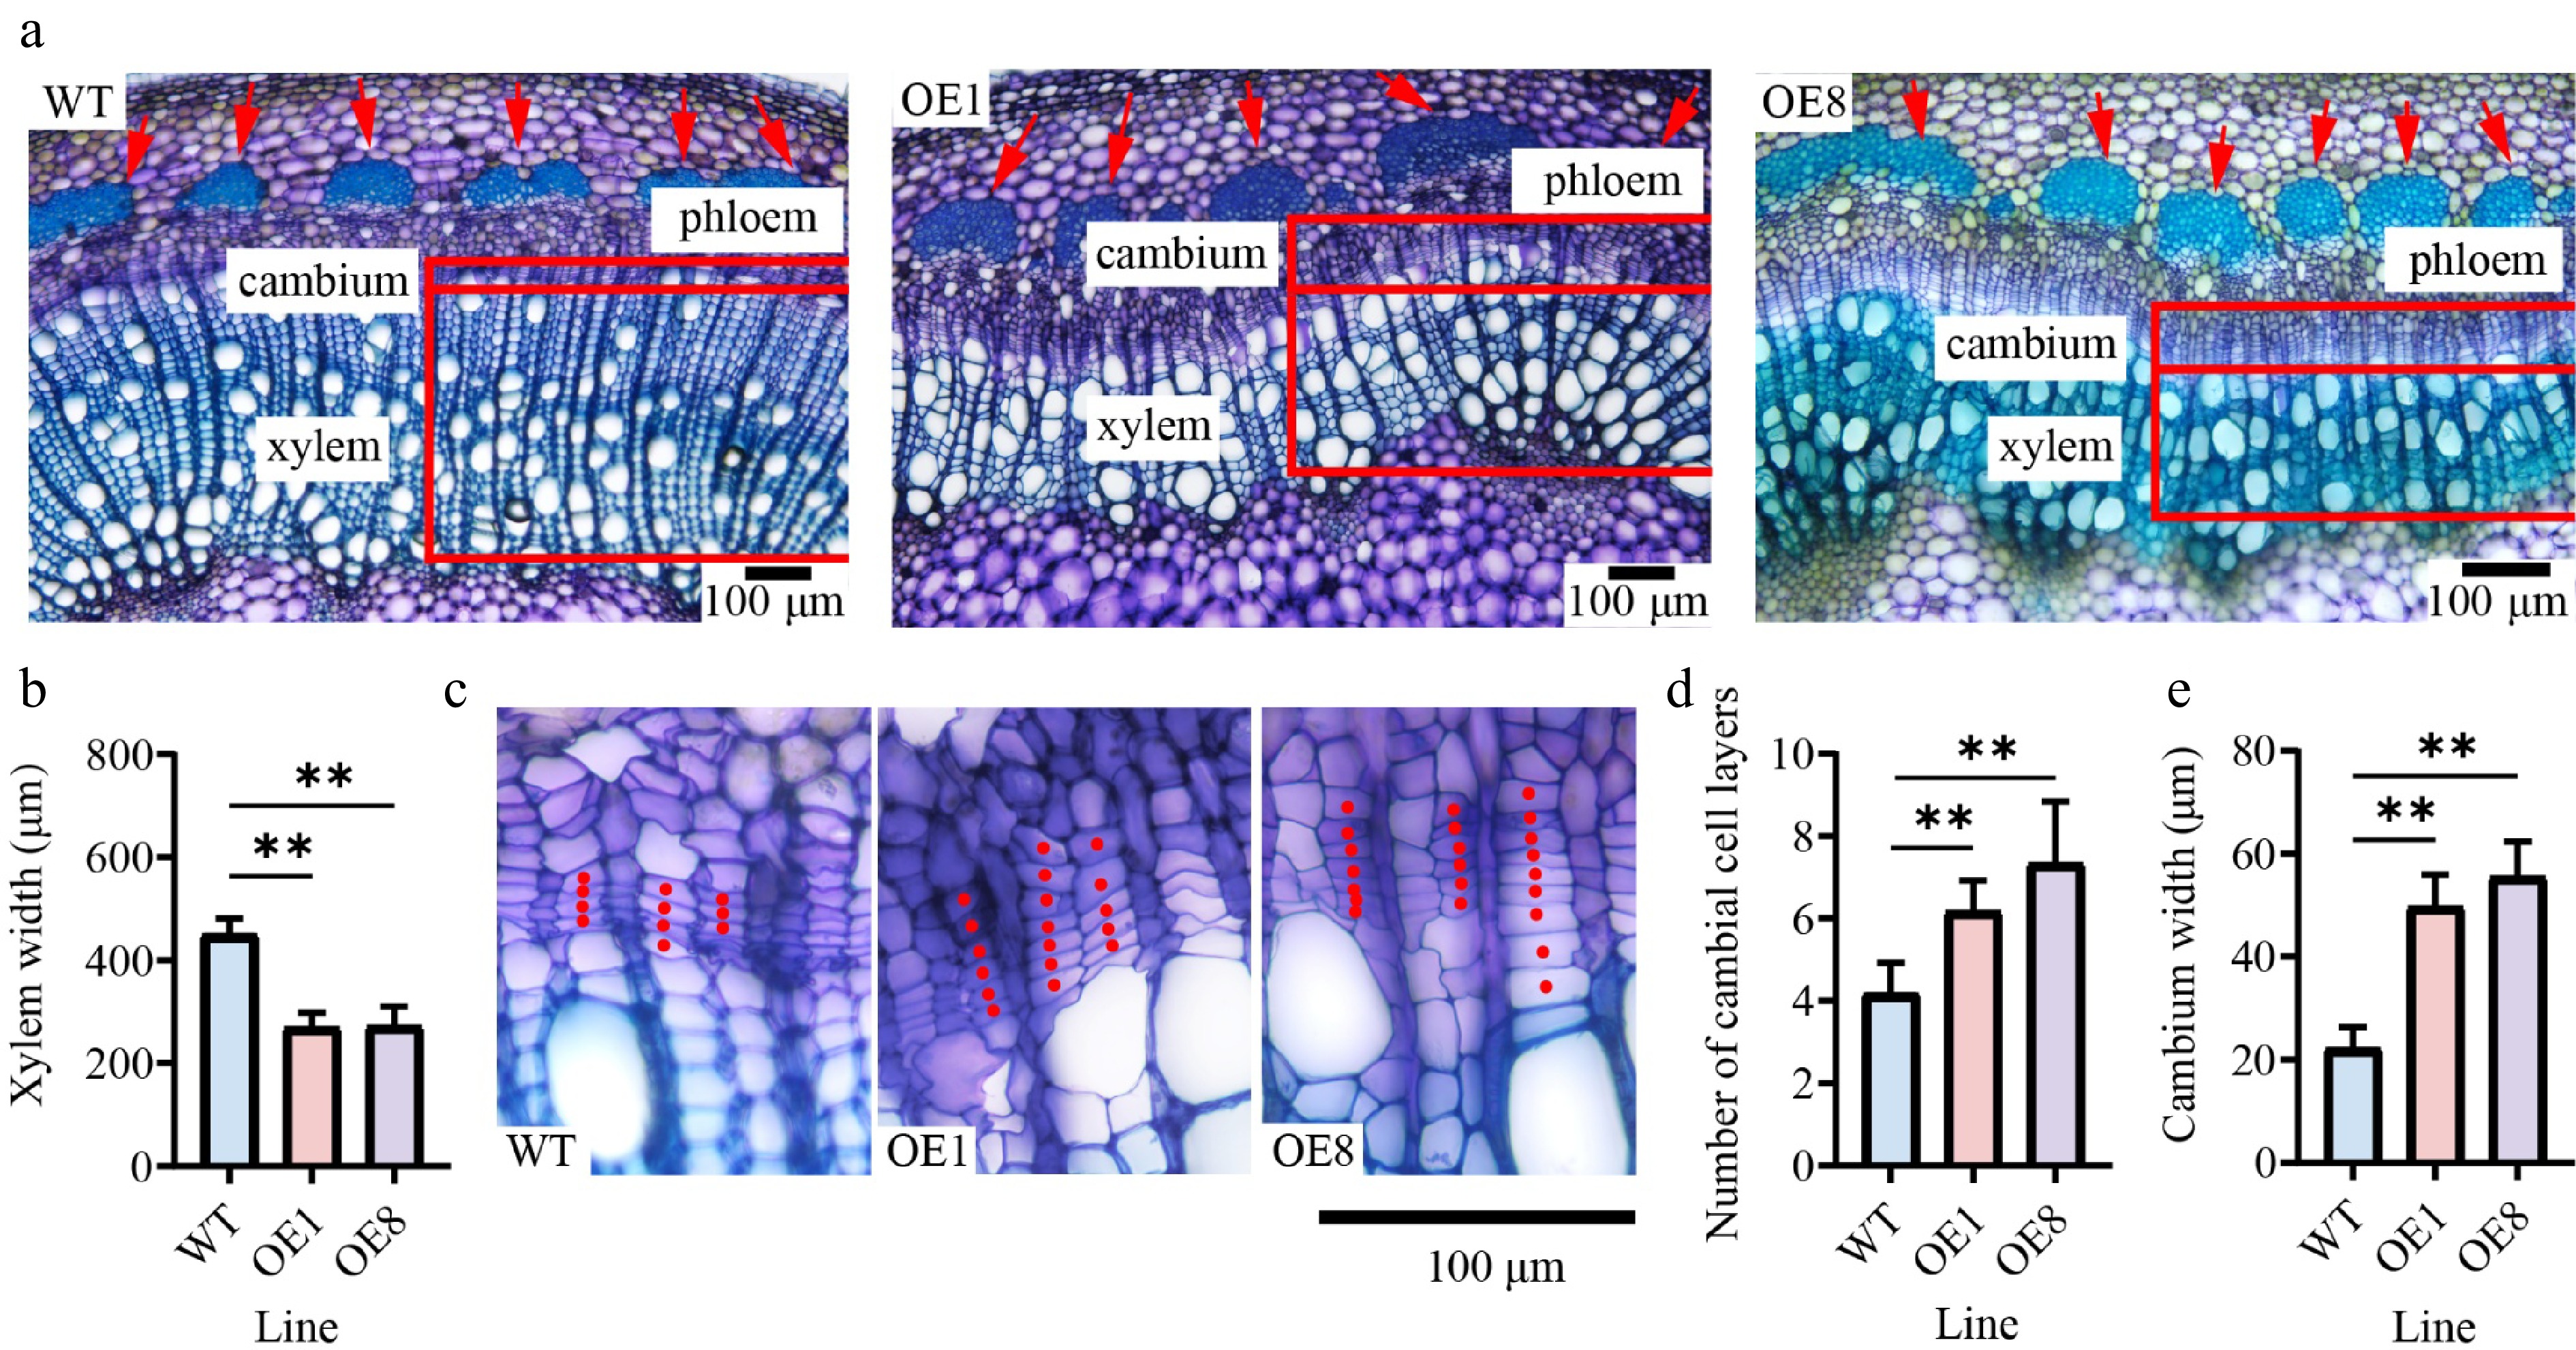
Figure 4.
Overexpressing PtoHsfB1 increases cambial activity and enhances phloem cell growth. (a) Cytological observations of stem cross-sections. The red arrow indicates the phloem. (b) Xylem width. (c) Magnified photos of the cambial area. (d) Number of cambial cell layers. (e) Cambium width.
-
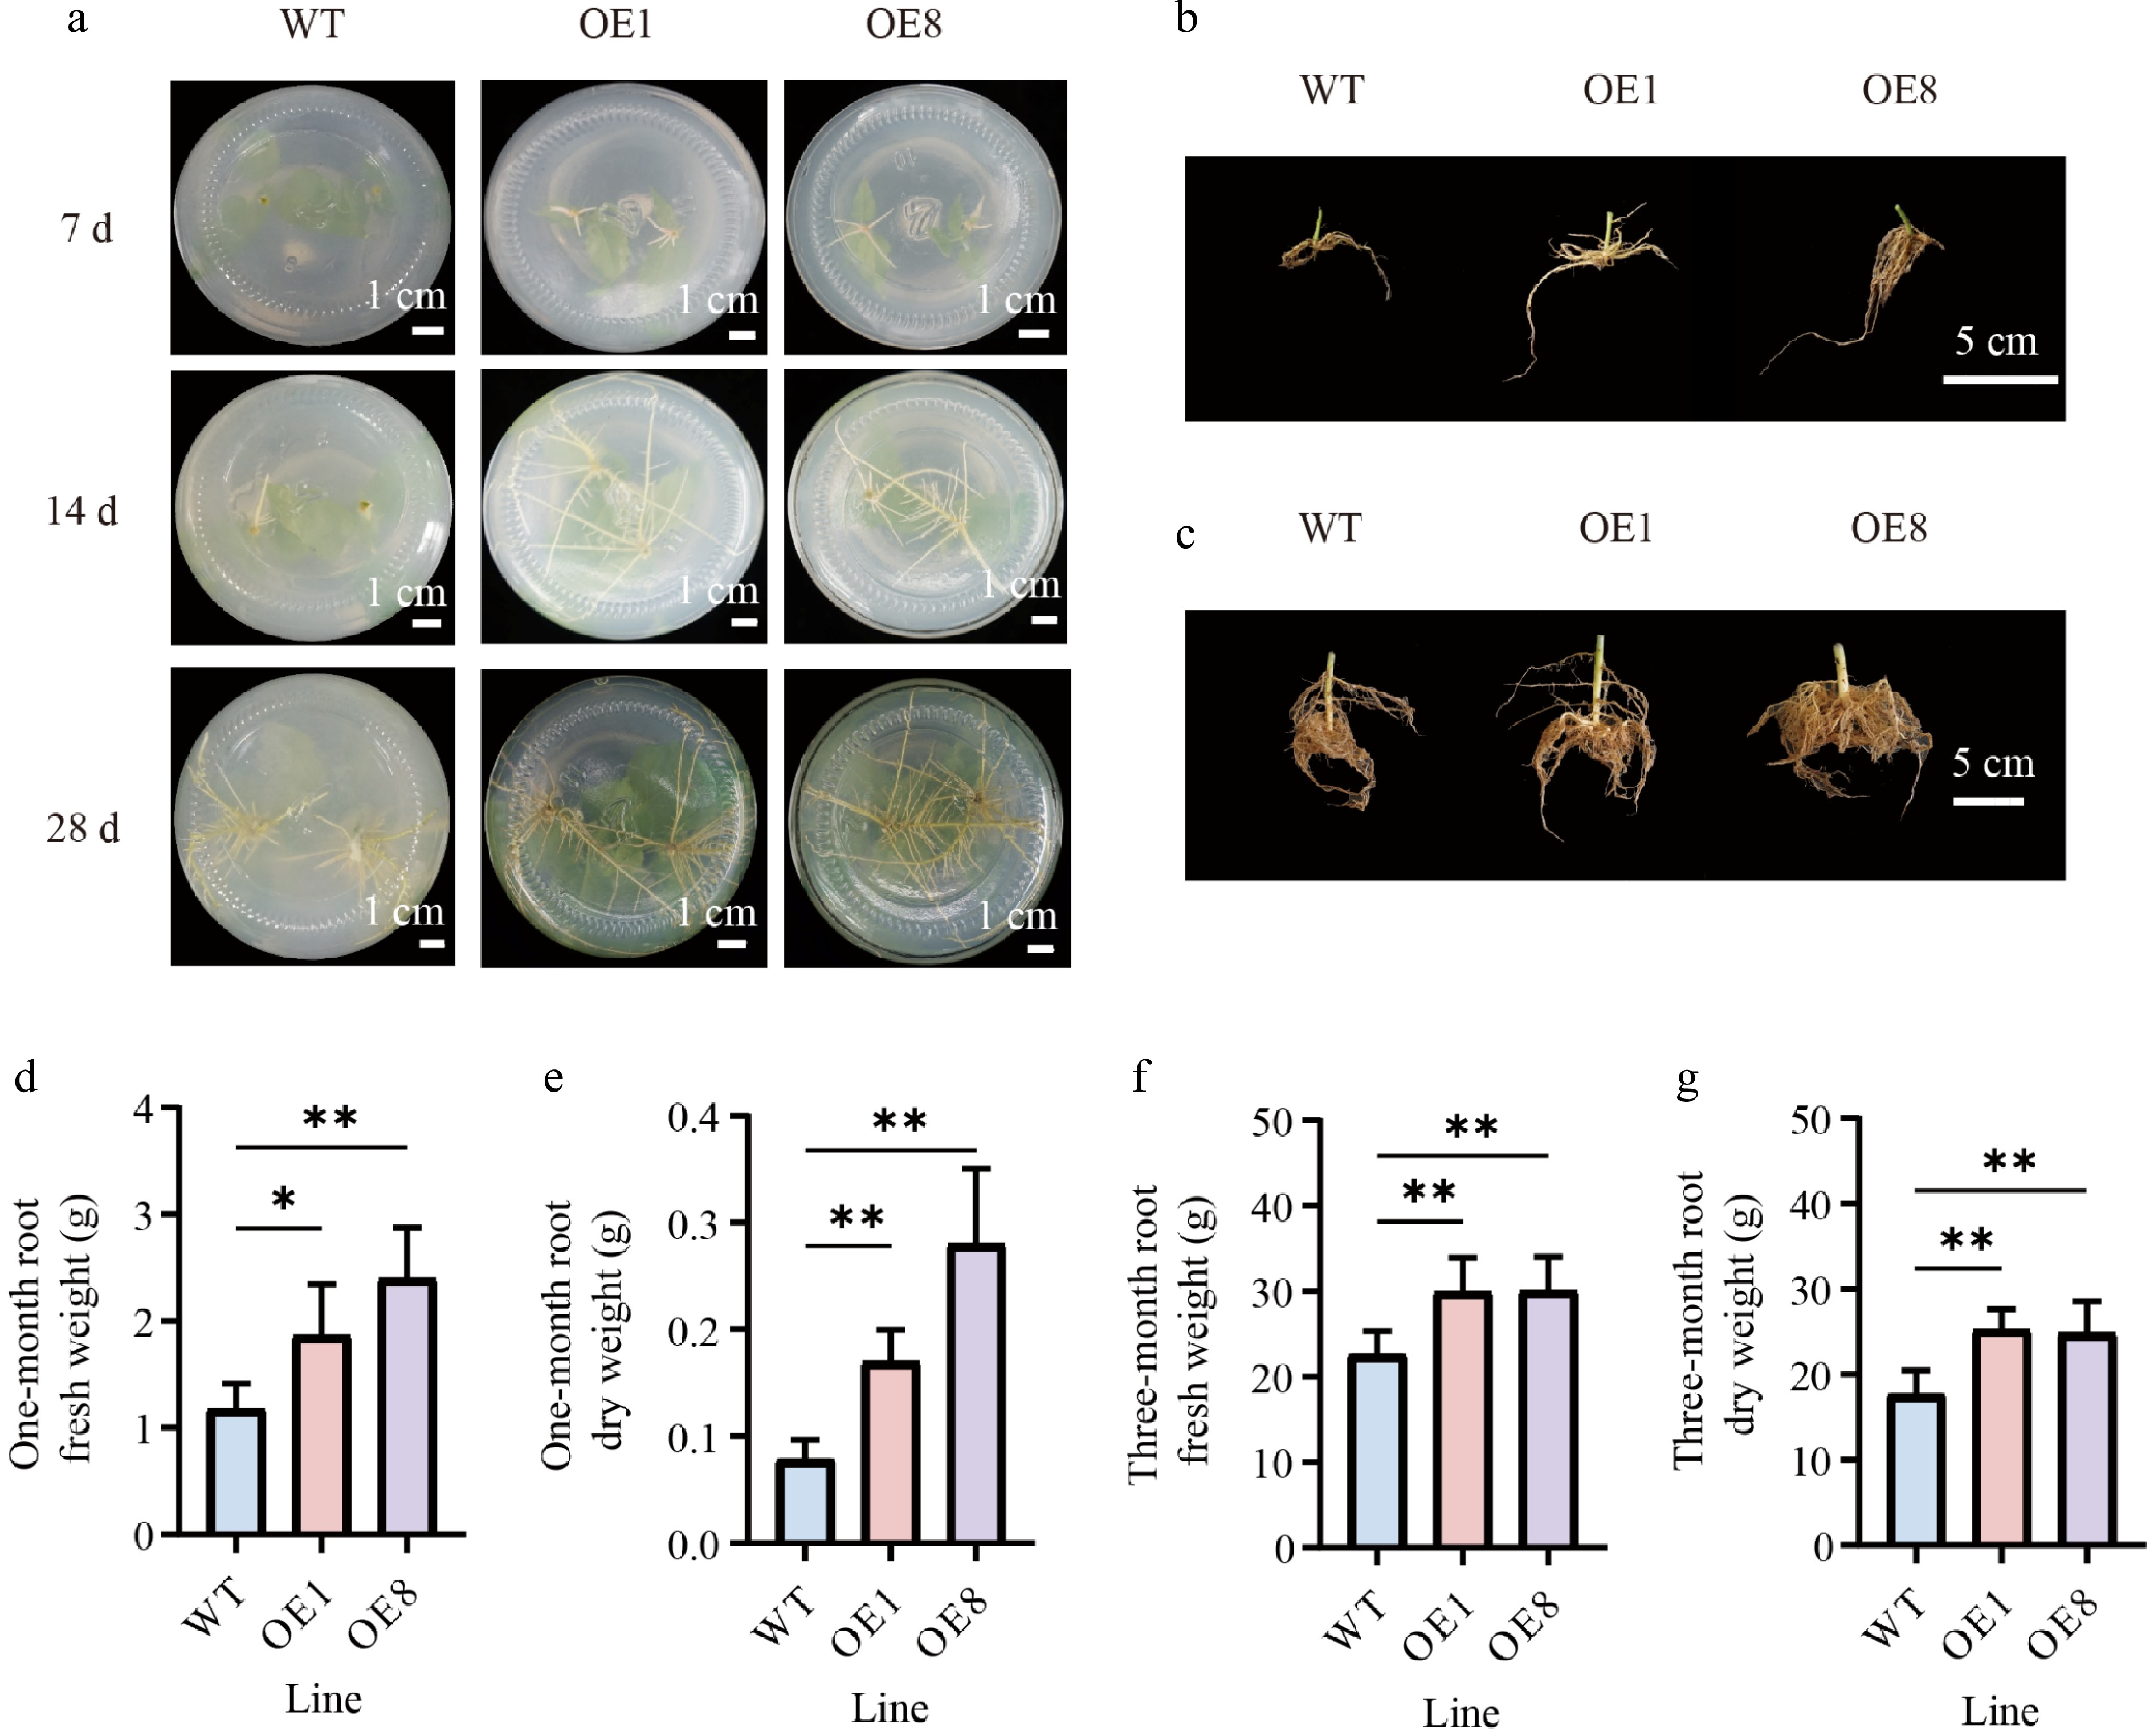
Figure 5.
Overexpressing PtoHsfB1 promoted root growth in transgenic poplars. (a) Growth of adventitious roots in OE and WT plants at different time points under tissue culture conditions. Scale bar = 1 cm. (b) The root phenotype of one-month-old plantlets. Scale bar = 5 cm. (c) The root phenotype of three-month-old plantlets. Scale bar = 5 cm. (d) The root fresh weight of one-month-old plantlets. (e) The root dry weight of one-month-old plantlets. (f) The root fresh weight of three-month-old plantlets. (g) The root dry weight of three-month-old plantlets.
-
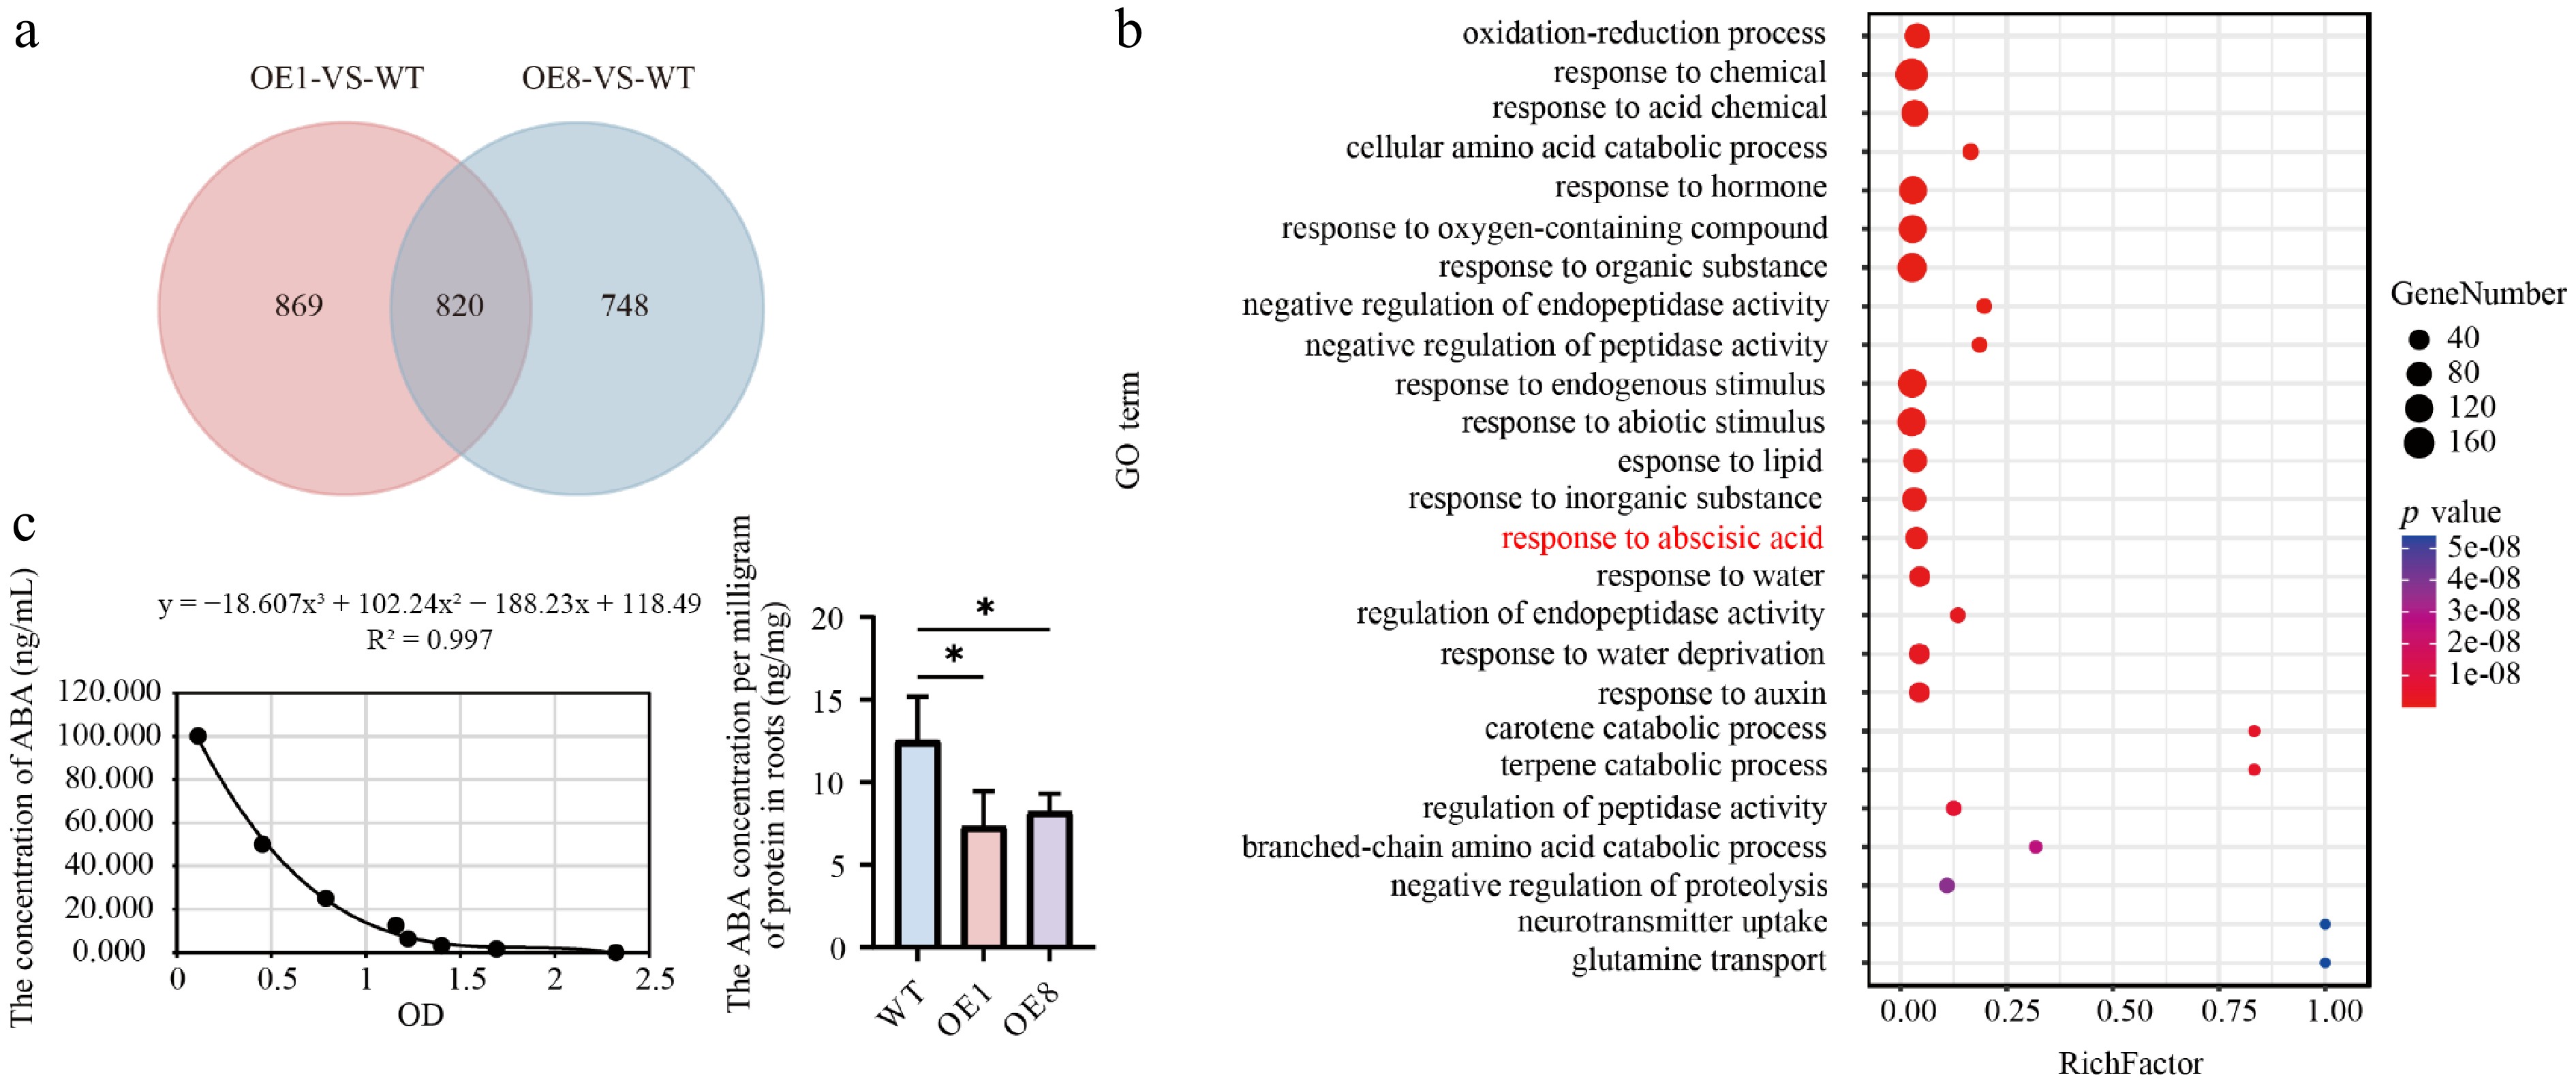
Figure 6.
Transcriptome analysis and ABA content detection. (a) Venn diagram analysis of the OE1-VS-WT and OE8-VS-WT comparative groupings. (b) GO enrichment analysis of 820 DEGs depicts dots where their sizes reflect the number of enriched genes. Larger dots indicate a higher gene count. The color of the dots reflects the significance level of the enrichment; dots with a redder hue correspond to smaller Q values, indicating greater significance in the enrichment degree. (c) Left shows the ABA standard curve. The fitting method is polynomial, and the fitting equation is y = −18.607x3 + 102.24x2 − 188.23x + 118.49, R2 = 0.997, right shows ABA content in root tissues.
-
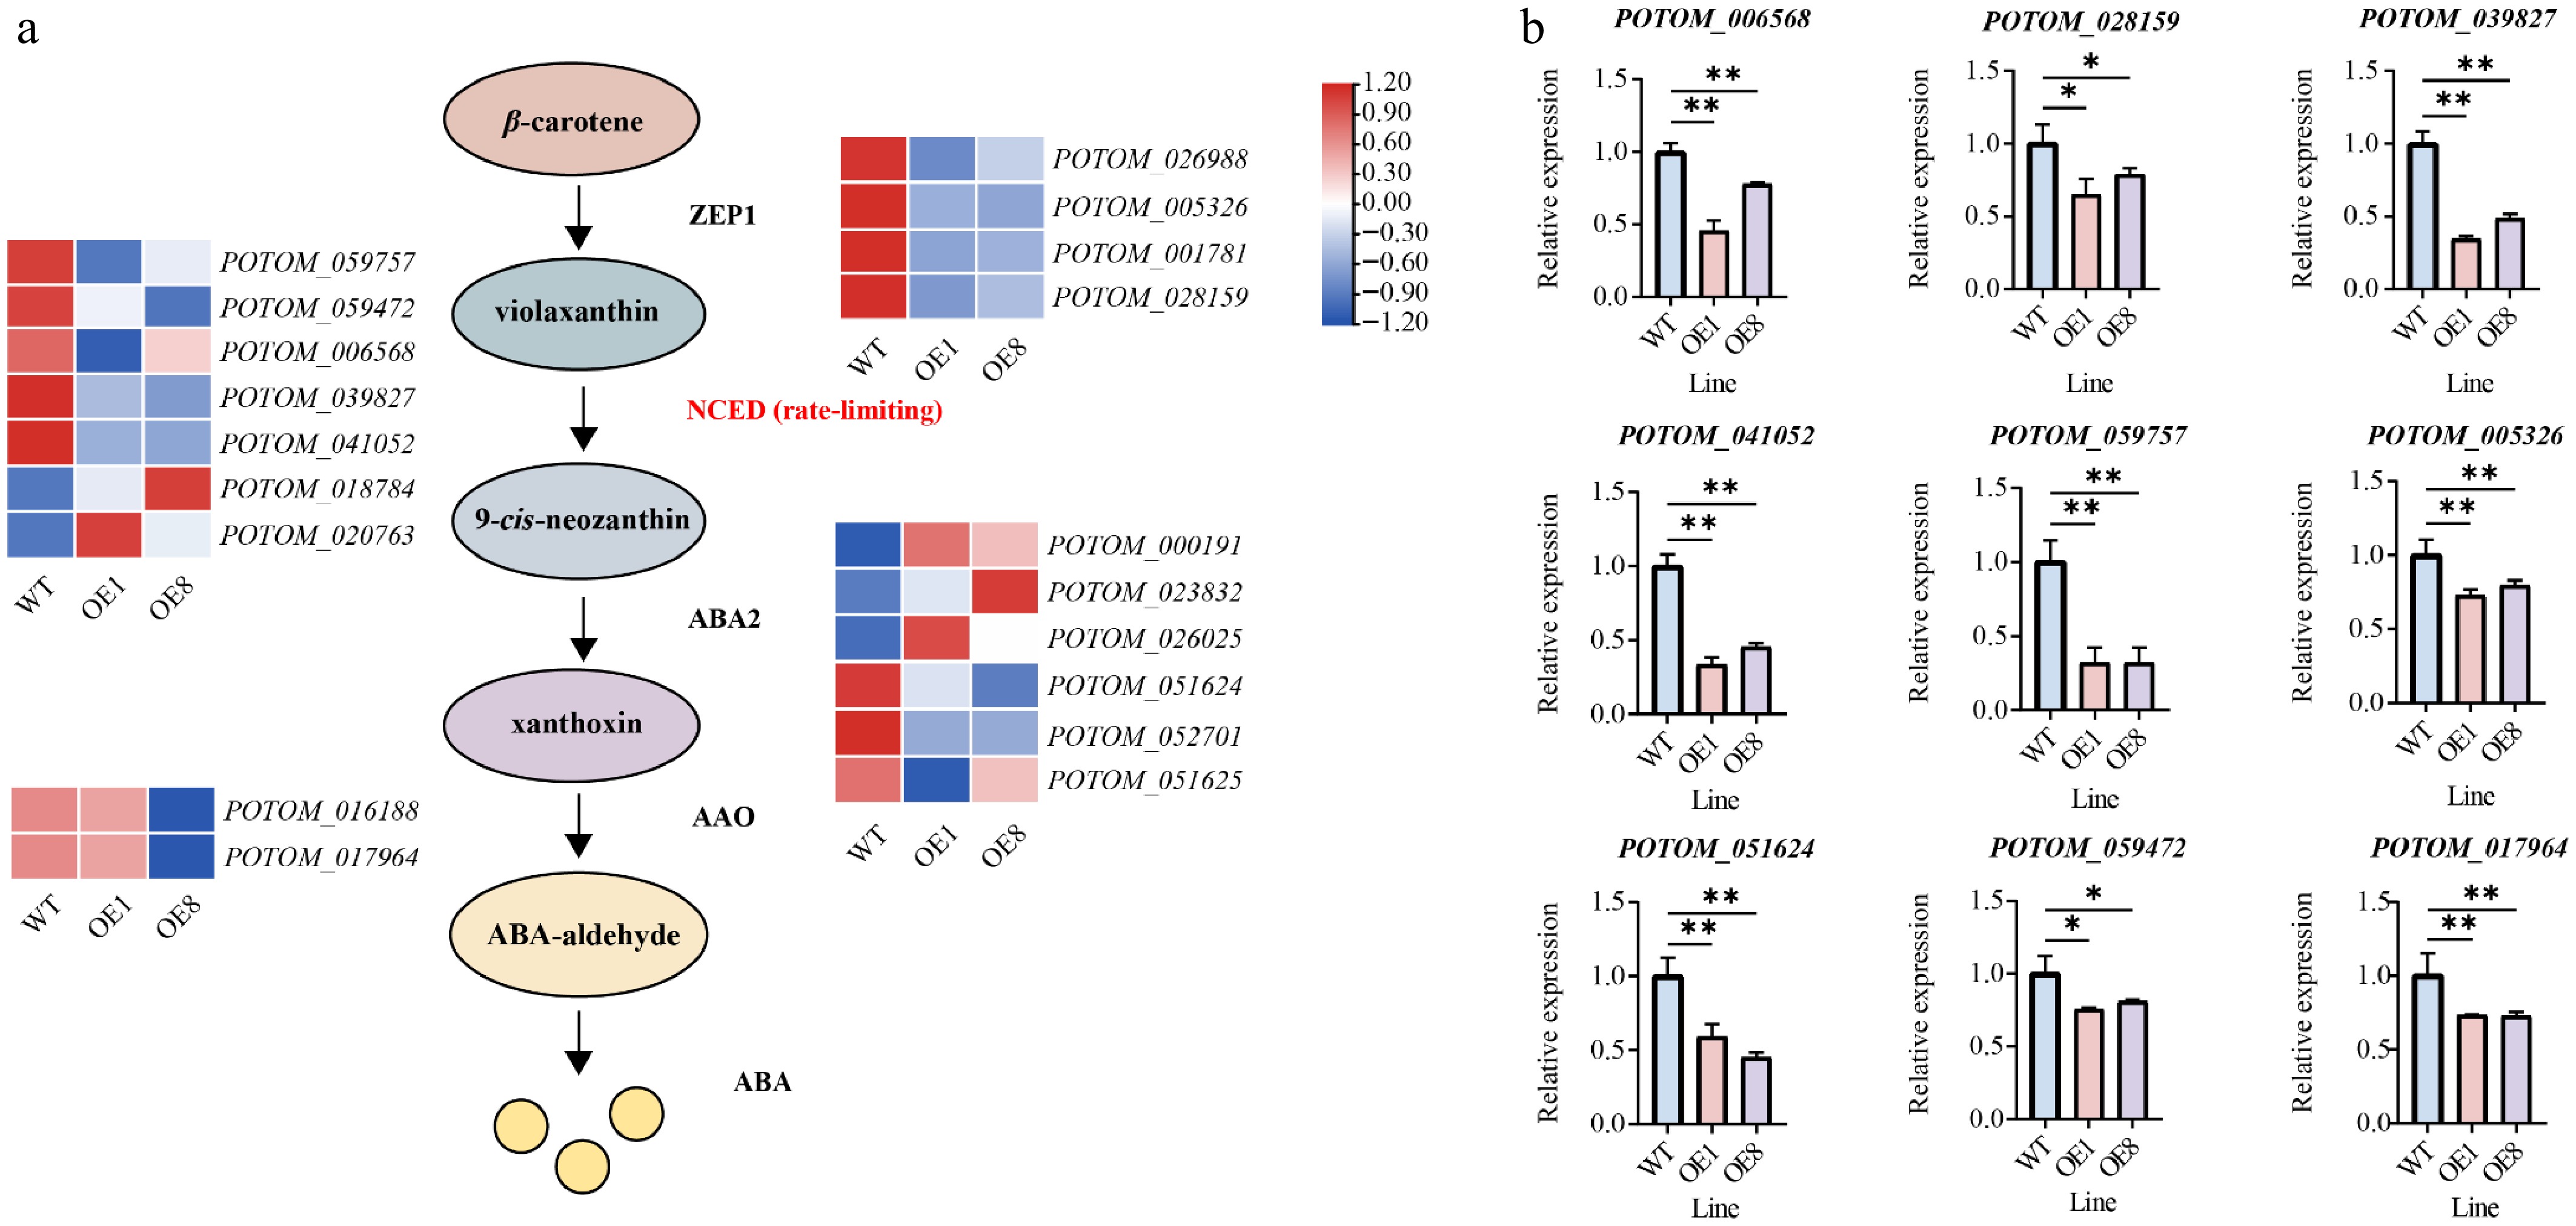
Figure 7.
PtoHsfB1 overexpressing represses ABA biosynthesis. (a) Gene expression is presented in the heatmap. Red and blue represent higher and lower gene expression levels. (b) The relative expression of nine selected ABA biosynthesis related genes.
-
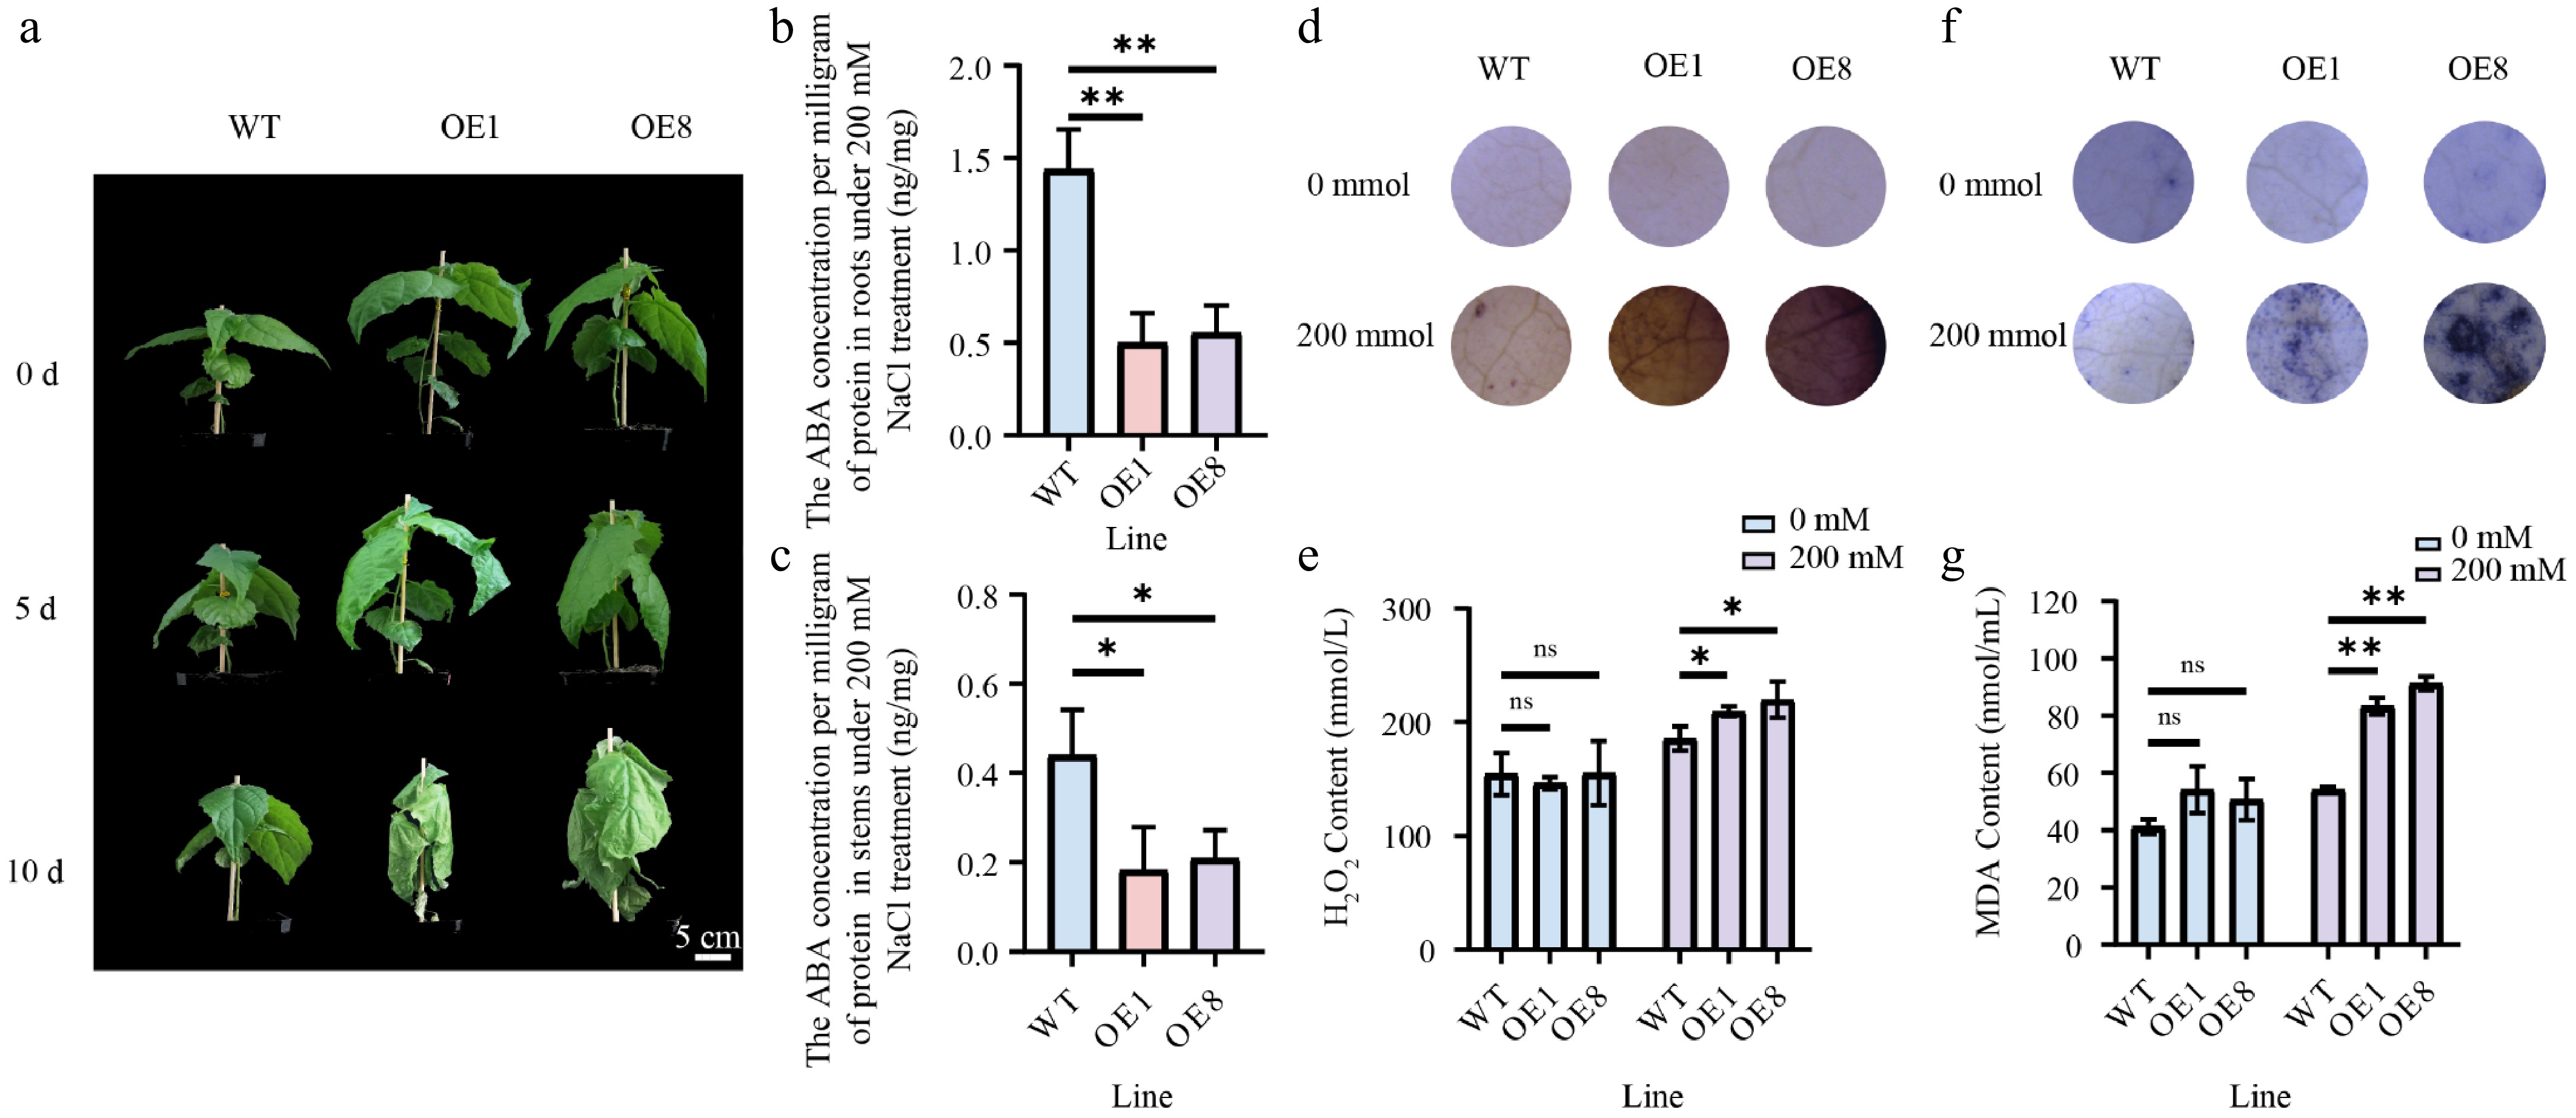
Figure 8.
Overexpressing PtoHsfB1 reduced salt tolerance under 200 mM NaCl. (a) The phenotypes of plantlets. Scale Bar = 5 cm. (b) ABA content in root tissues. (c) ABA contents in stem tissue. (d) DAB staining. (e) H2O2 content. (f) NBT staining. (g) MDA content.
Figures
(8)
Tables
(0)