-
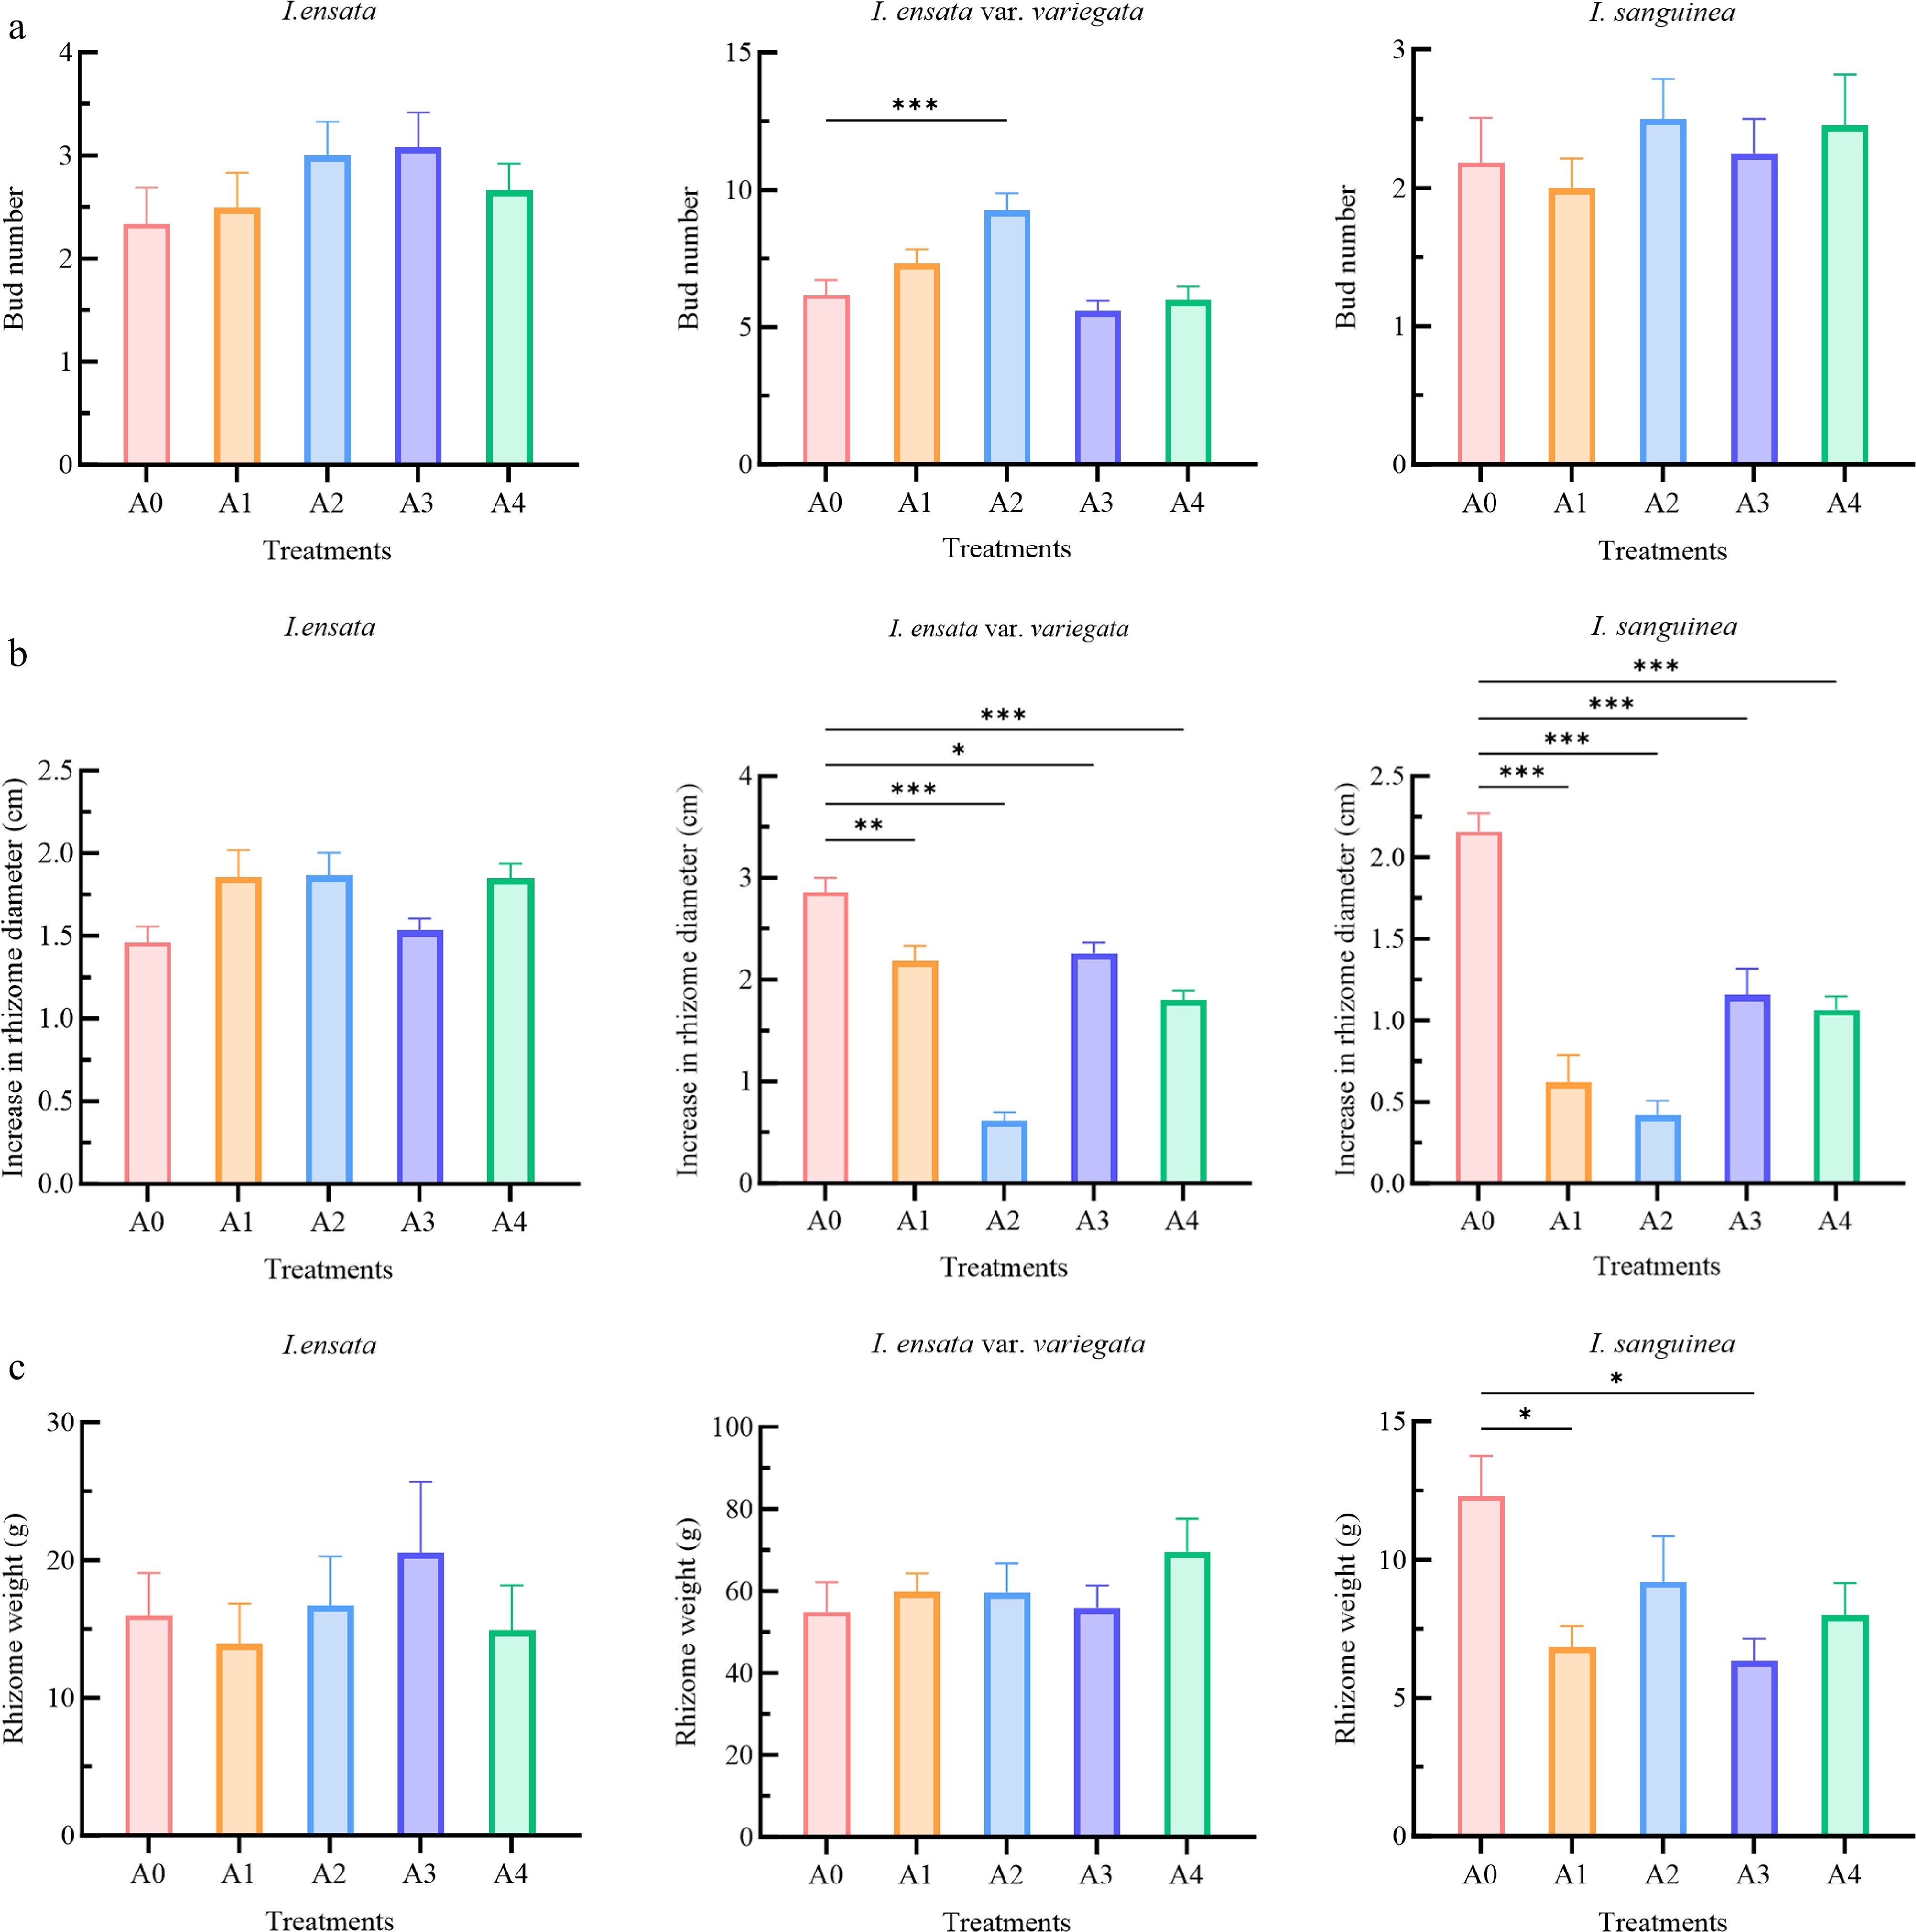
Figure 1.
Effects of plant growth regulator treatments on (a) bud number, (b) increase in rhizome diameter, and (c) rhizome weight in three Iris species (I. ensata, I. ensata var. variegata, and I. sanguinea). The treatments included: A0 (control group), A1 (low concentration of 6-BA, 1,000 mg/L), A2 (high concentration of 6-BA, 2,000 mg/L), A3 (low concentration of PC, 500 mg/L), and A4 (high concentration of PC, 1,000 mg/L). Each bar represents the mean (n = 12) ± standard error. The significant differences within each species compared to the A0 (control group) were analyzed using Tukey's HSD test following one-way ANOVA (* p < 0.05, ** p < 0.01, *** p < 0.001).
-
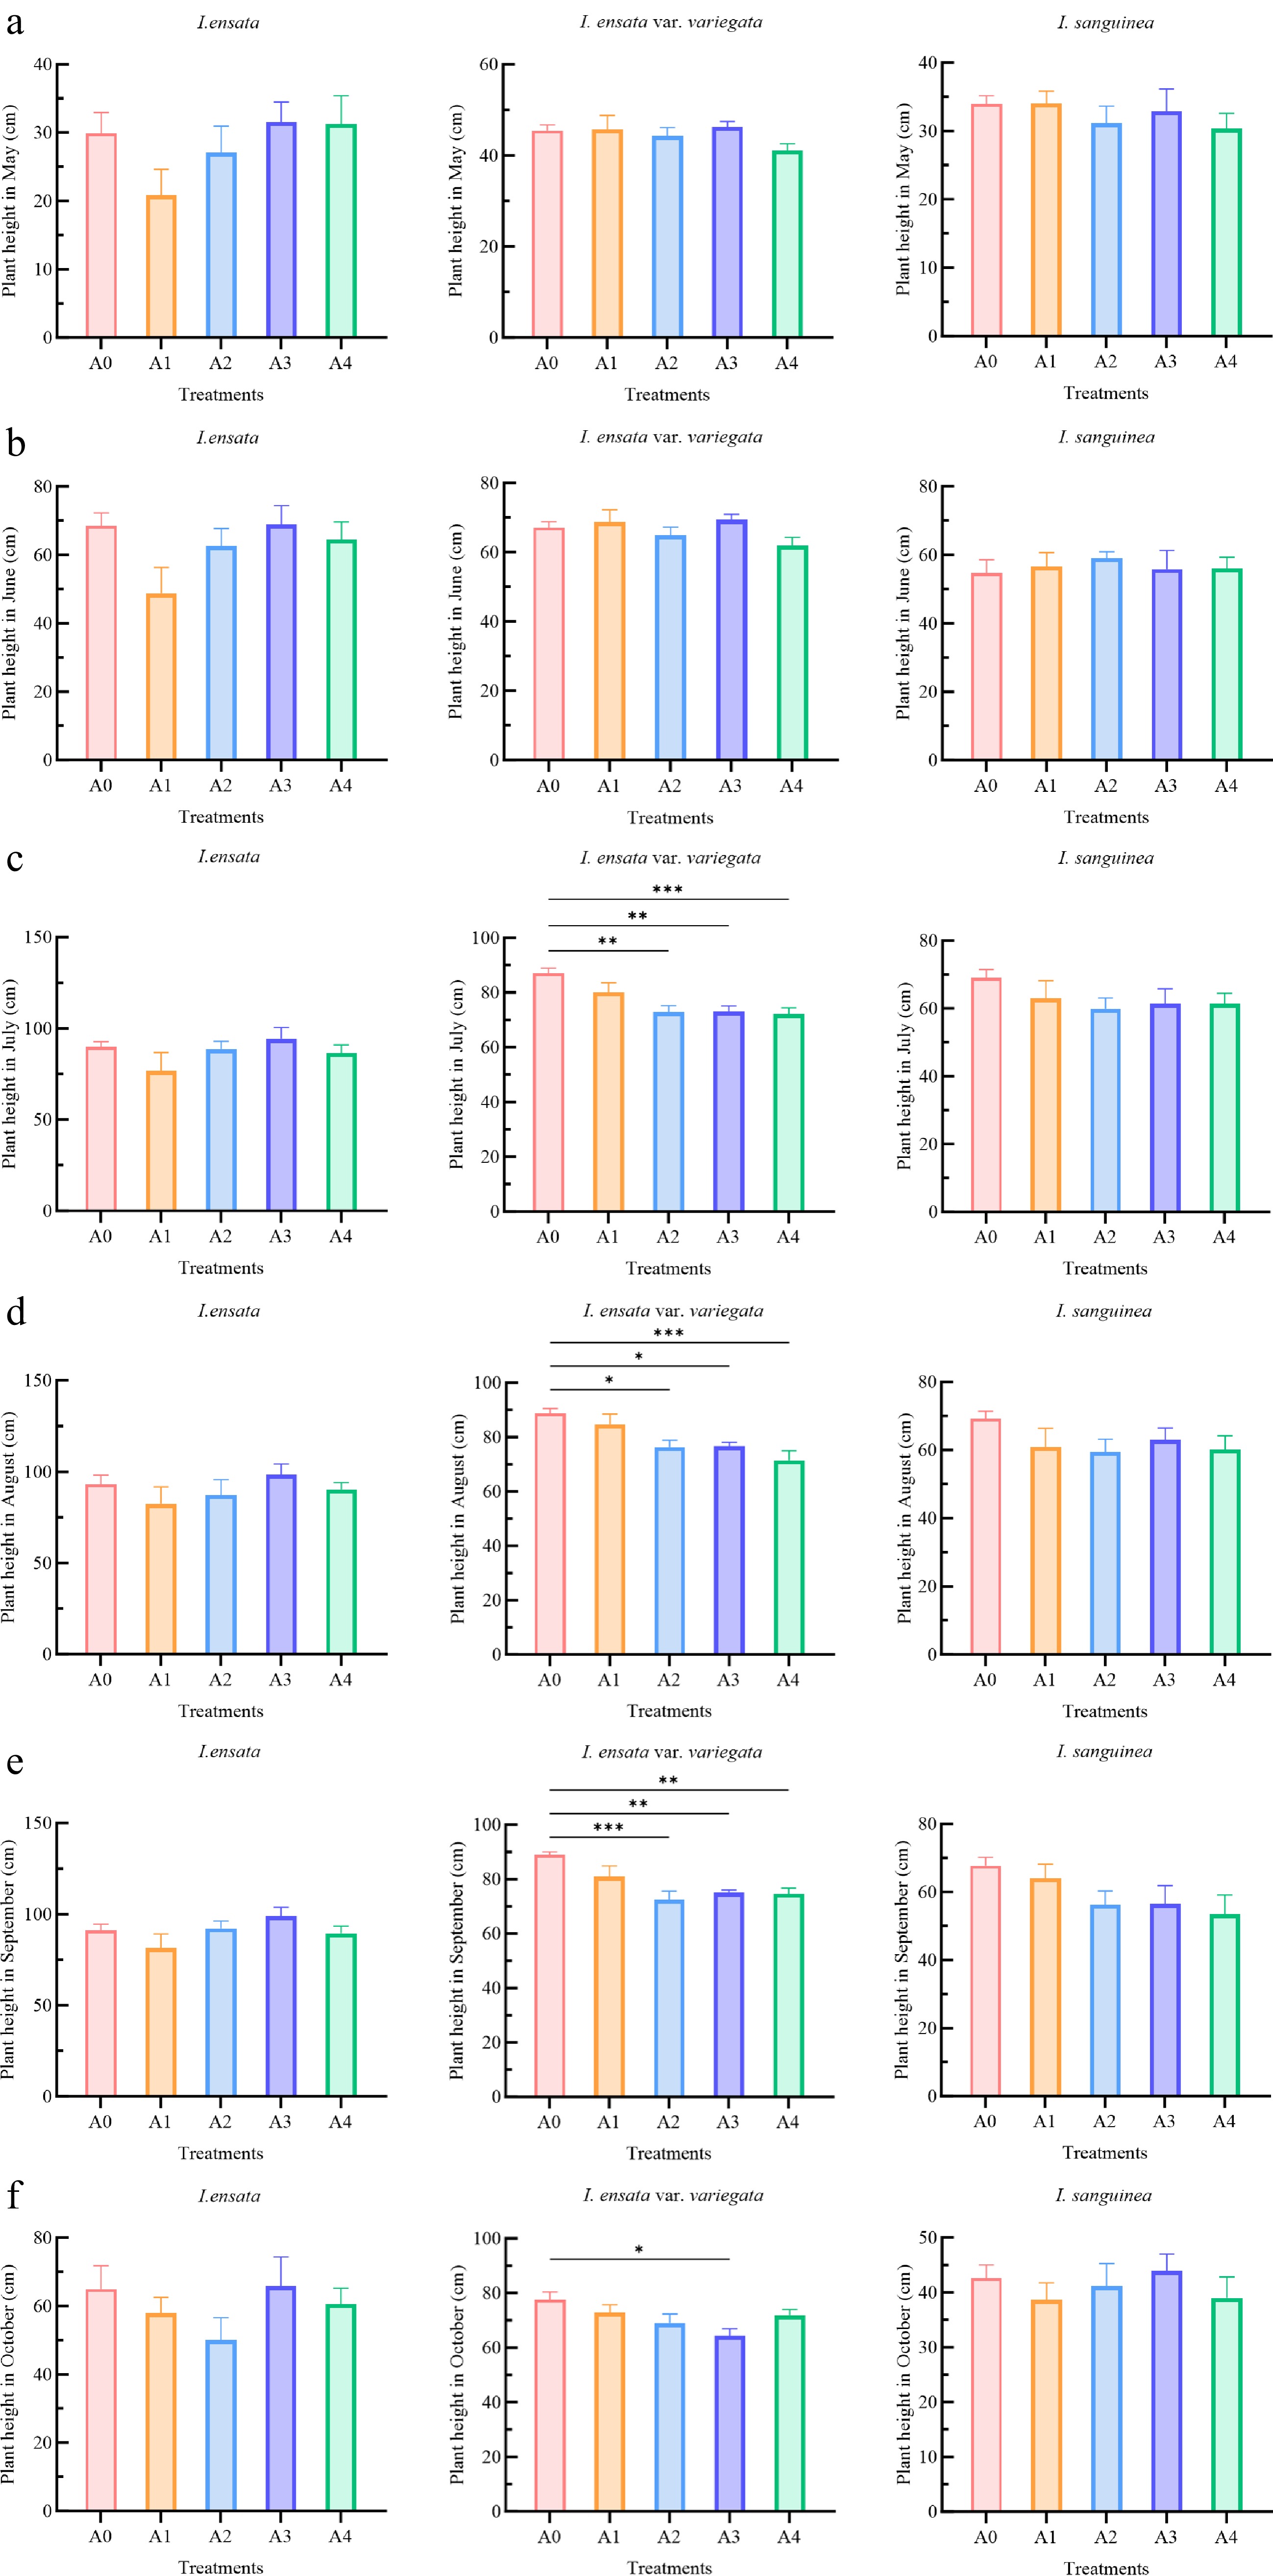
Figure 2.
Effects of plant growth regulator treatments on plant height of three Iris species (I. ensata, I. ensata var. variegata, and I. sanguinea) during the growing season. The treatments included: A0 (control group), A1 (low concentration of 6-BA, 1,000 mg/L), A2 (high concentration of 6-BA, 2,000 mg/L), A3 (low concentration of PC, 500 mg/L), and A4 (high concentration of PC, 1,000 mg/L). (a) May; (b) June; (c) July; (d) August; (e) September; and (f) October. Each bar represents the mean (n = 12) ± standard error. The significant differences within each species compared to the A0 (control group) were analyzed using Tukey's HSD test following one-way ANOVA (* p < 0.05, ** p < 0.01, *** p < 0.001).
-
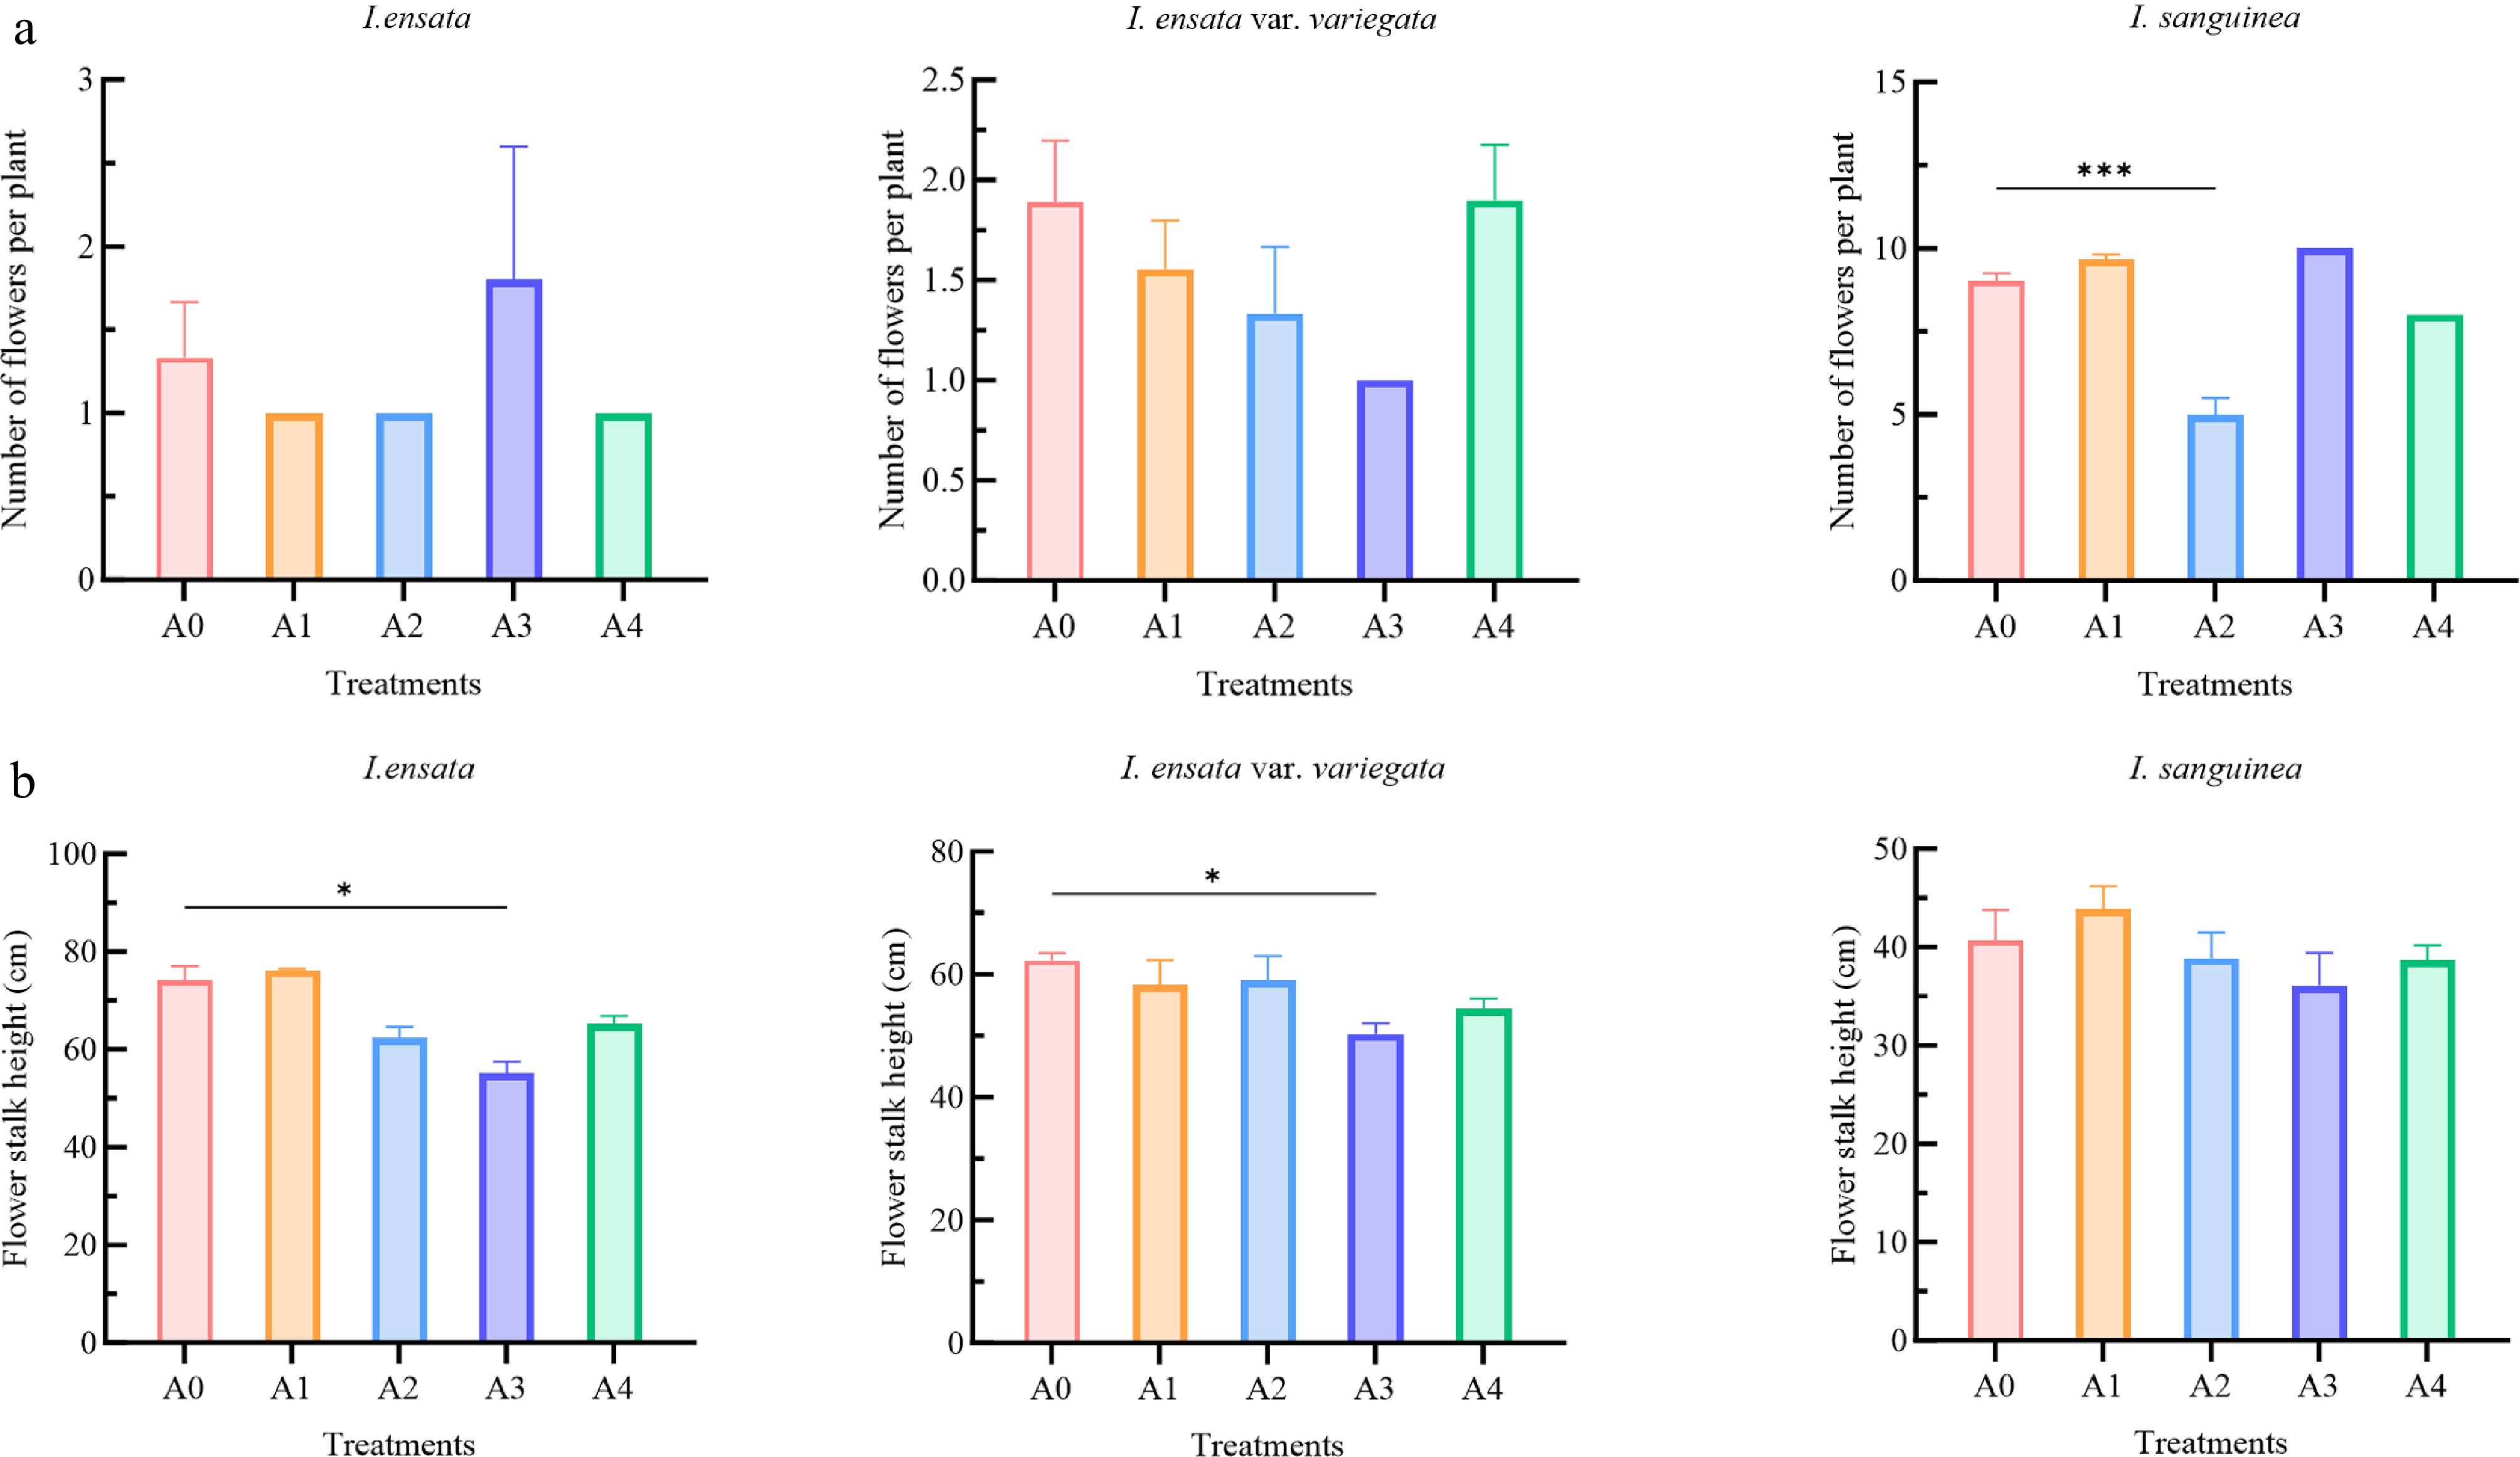
Figure 3.
Effects of plant growth regulator treatments on (a) number of flowers per plant, and (b) flower stalk height in three Iris species (I. ensata, I. ensata var. variegata, and I. sanguinea). The treatments included: A0 (control group), A1 (low concentration of 6-BA, 1,000 mg/L), A2 (high concentration of 6-BA, 2,000 mg/L), A3 (low concentration of PC, 500 mg/L), and A4 (high concentration of PC, 1,000 mg/L). Each bar represents an average (n = 12) ± standard error. The significant differences within each species compared to the A0 (control group) were analyzed using Tukey's HSD test following one-way ANOVA (* p < 0.05, ** p < 0.01, *** p < 0.001).
-
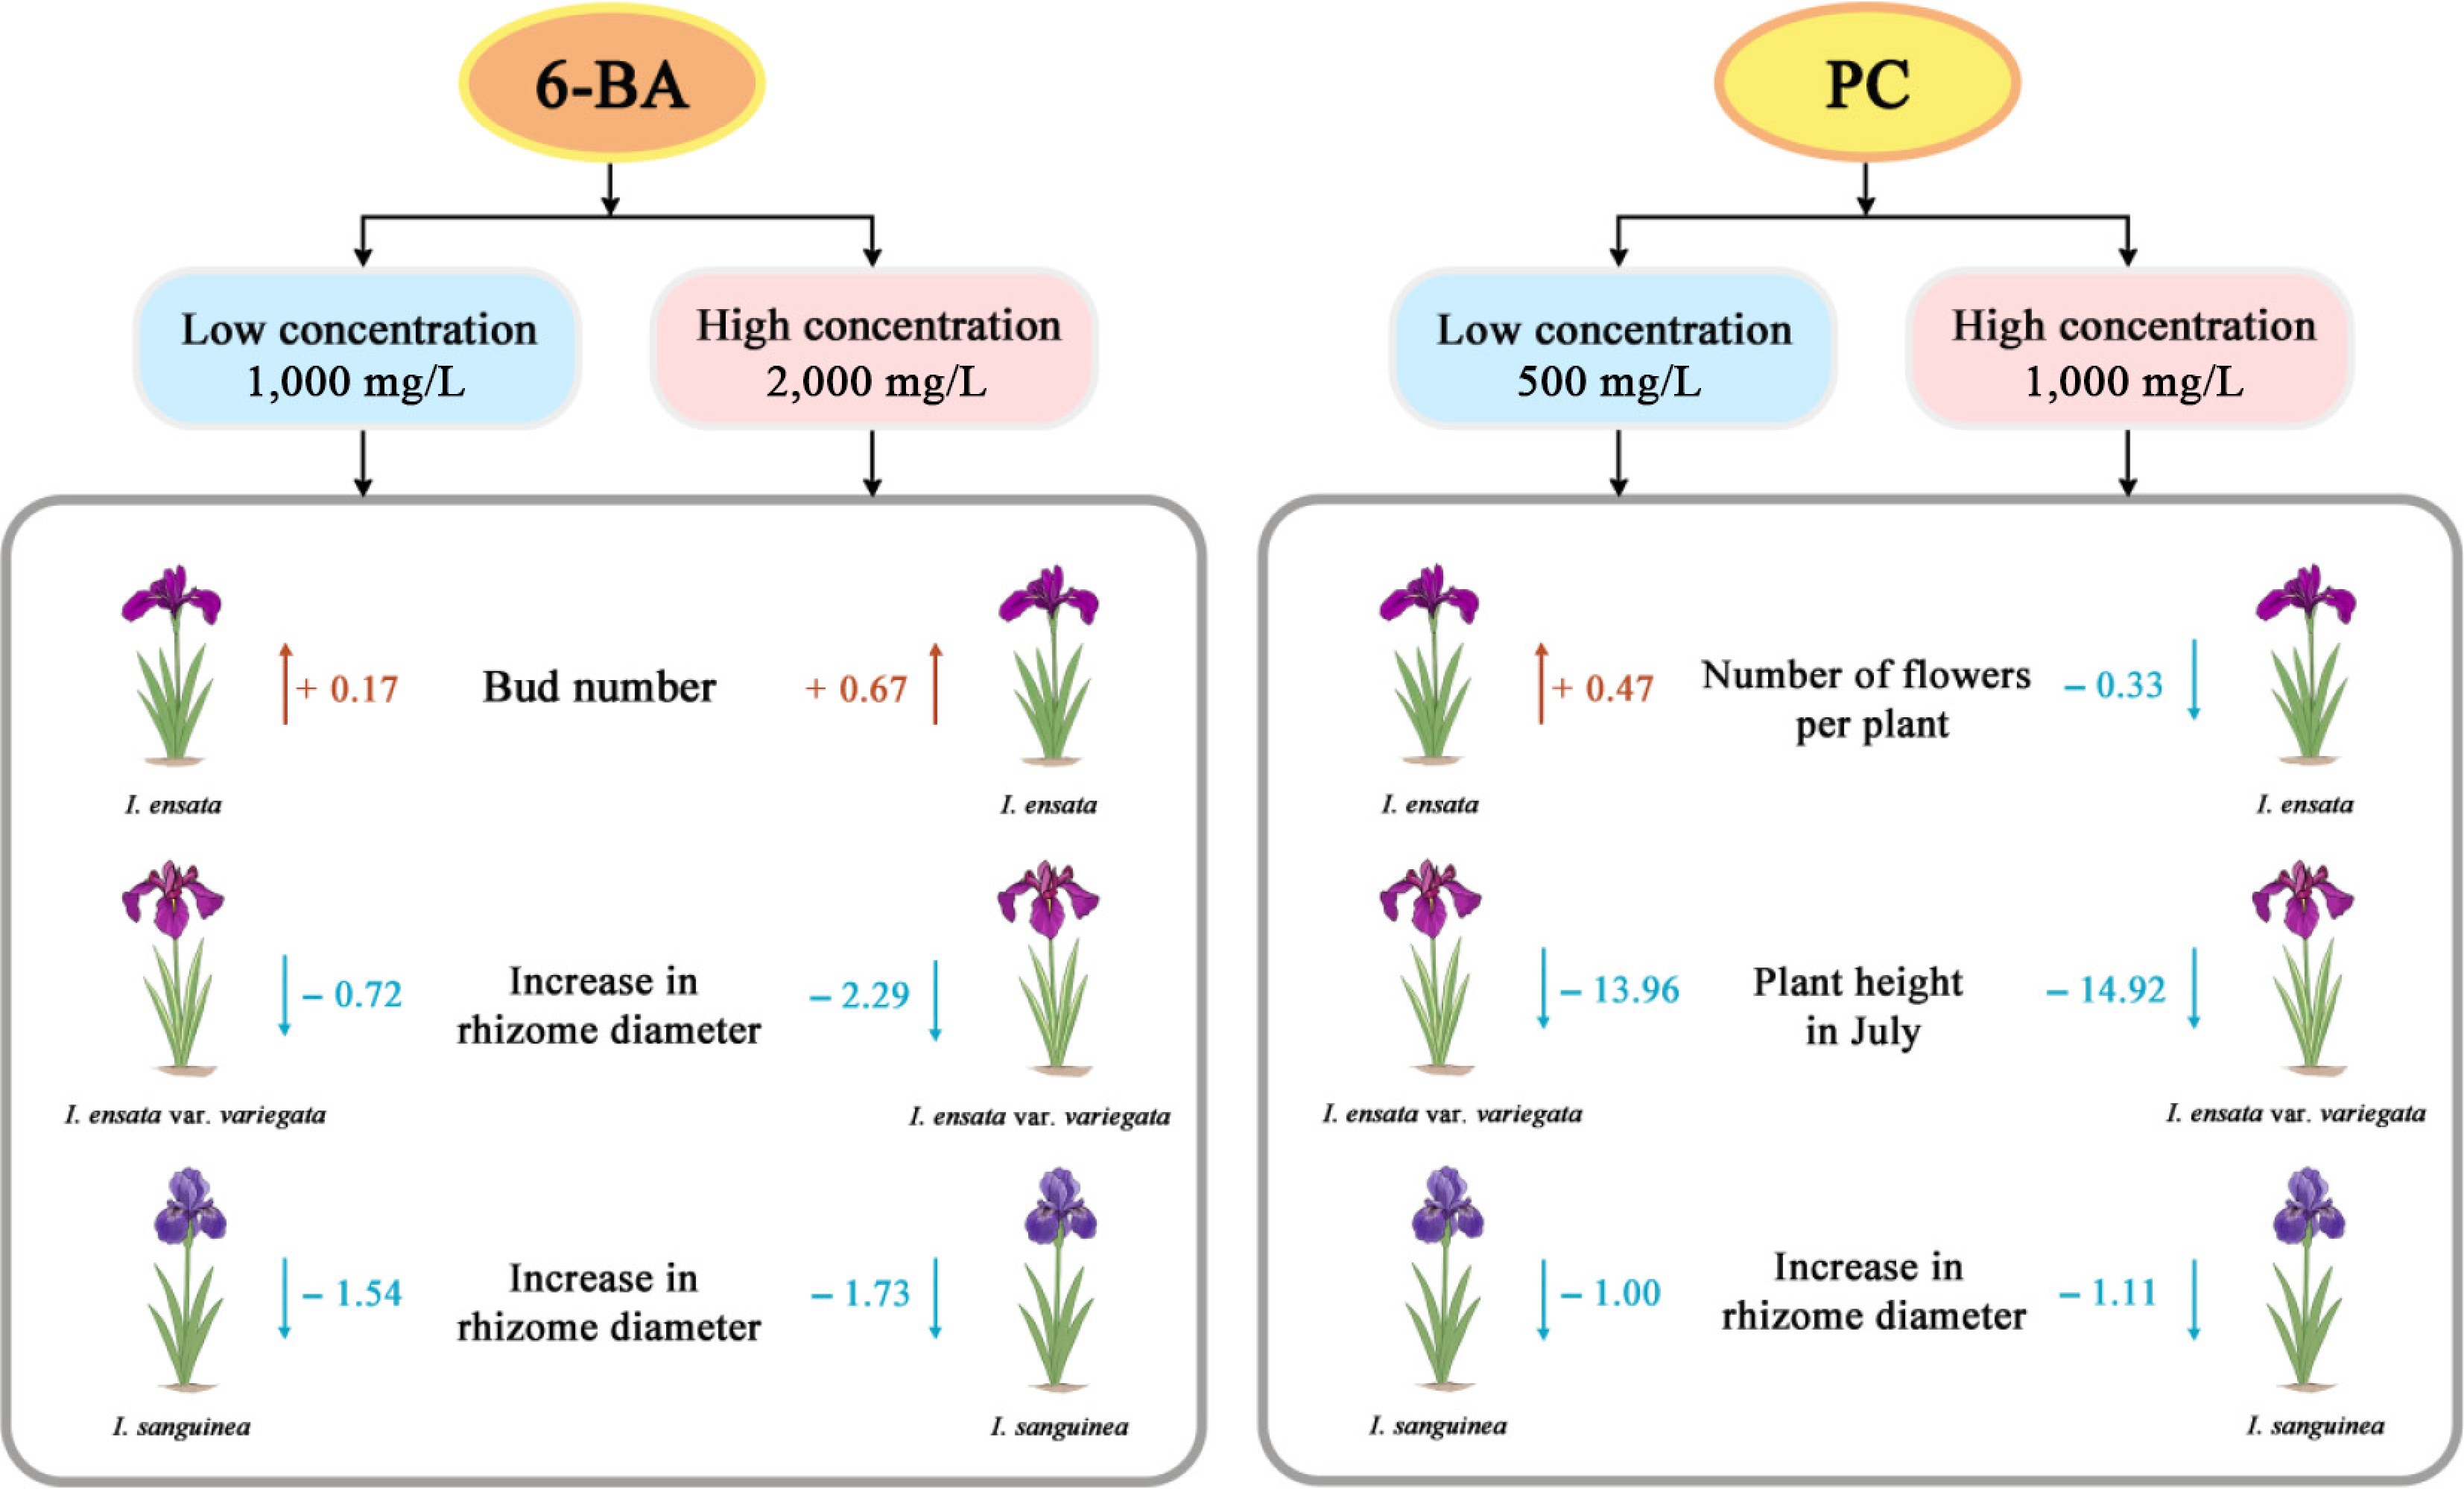
Figure 4.
Changes in key growth parameters of three Iris species (I. ensata, I. ensata var. variegata, and I. sanguinea) in response to plant growth regulator treatments. The most significant indicators identified from the dataset are presented. Treatments included two concentrations of 6-BA (1,000 and 2,000 mg/L), and PC (500 and 1,000 mg/L). Values represent the changes relative to the control.
-
Treatment Plant growth regulator Application concentration A0 − − A1 6-BA 1,000 mg/L A2 6-BA 2,000 mg/L A3 PC 500 mg/L A4 PC 1,000 mg/L 6-BA, 6-Benzylaminopurine; PC, Prohexadione-Ca. Treatment A0 served as the control group, where plants were treated with distilled water. Each treatment received 1,000 mL per application on Oct. 30, Nov. 30, and Dec. 30, 2019, and on Jan. 30 and Feb. 29, 2020. Table 1.
Experimental treatments and application concentrations of PGRs.
-
Iris species Bud number Plant
height
in MayPlant
height
in JunePlant
height
in JulyPlant
height
in Aug.Plant
height
in Sep.Plant
height
in Oct.Number of
flowers per
plantFlower
stalk
heightIncrease in
rhizome
diameterRhizome
weightIris species 1 −0.062 0.152* −0.168* −0.538** −0.559** −0.649** −0.369** 0.835** −0.761** −0.045 −0.104 Bud number −0.062 1 0.484** 0.271** 0.111 0.122 0.104 0.409** −0.568** 0.417** 0.370** 0.727** Plant height in May 0.152* 0.484** 1 0.612** 0.372** 0.297** 0.271** 0.317** −0.286** 0.252* 0.283** 0.501** Plant height in June −0.168* 0.271** 0.612** 1 0.675** 0.571** 0.548** 0.259** −0.315** 0.129 0.137 0.281** Plant height in July −0.538** 0.111 0.372** 0.675** 1 0.865** 0.899** 0.367** −0.455** 0.293** 0.137 0.163* Plant height in Aug. −0.559** 0.122 0.297** 0.571** 0.865** 1 0.872** 0.351** −0.499** 0.360** 0.128 0.174* Plant height in Sep. −0.649** 0.104 0.271** 0.548** 0.899** 0.872** 1 0.453** −0.528** 0.483** 0.149 0.198* Plant height in Oct. −0.369** 0.409** 0.317** 0.259** 0.367** 0.351** 0.453** 1 −0.564** 0.553** 0.192* 0.458** Number of flowers per plant 0.835** −0.568** −0.286** −0.315** −0.455** −0.499** −0.528** −0.564** 1 −0.688** −0.232* −0.544** Flower stalk height −0.761** 0.417** 0.252* 0.129 0.293** 0.360** 0.483** 0.553** −0.688** 1 0.229 0.357** Increase in rhizome diameter −0.045 0.370** 0.283** 0.137 0.137 0.128 0.149 0.192* −0.232* 0.229 1 0.520** Rhizome weight −0.104 0.727** 0.501** 0.281** 0.163* 0.174* 0.198* 0.458** −0.544** 0.357** 0.520** 1 * Significant (p < 0.05), ** Highly significant (p < 0.01). Table 2.
Correlation analysis of growth indices and plant growth regulator treatments in wetland irises.
-
Treatments Bud
numberPlant
height
in MayPlant
height
in JunePlant
height
in JulyPlant
height
in Aug.Plant
height
in Sep.Plant
height
in Oct.Number of
flowers per
plantFlower
stalk
heightIncrease in
rhizome
diameterRhizome
weightTreatments 1 0.159 0.152 0.085 0.075 0.064 0.116 0.066 −0.027 −0.660* 0.020 0.051 Bud number 0.159 1 0.421** 0.379** 0.310* 0.298* 0.314* −0.058 0.095 −0.481 0.099 0.354** Plant height in May 0.152 0.421** 1 0.849** 0.671** 0.660** 0.713** 0.060 0.103 −0.582 0.358** 0.383** Plant height in June 0.085 0.379** 0.849** 1 0.836** 0.753** 0.805** 0.109 0.152 −0.451 0.201 0.361** Plant height in July 0.075 0.310* 0.671** 0.836** 1 0.853** 0.937** 0.129 0.212 −0.538 0.166 0.306* Plant height in Aug. 0.064 0.298* 0.660** 0.753** 0.853** 1 0.891** 0.086 0.258 −0.512 0.172 0.296* Plant height in Sep. 0.116 0.314* 0.713** 0.805** 0.937** 0.891** 1 0.138 0.298 −0.588 0.118 0.282* Plant height in Oct. 0.066 −0.058 0.060 0.109 0.129 0.086 0.138 1 0.185 −0.122 −0.078 −0.097 Number of flowers per plant −0.027 0.095 0.103 0.152 0.212 0.258 0.298 0.185 1 NA −0.012 0.088 Flower stalk height −0.660* −0.481 −0.582 −0.451 −0.538 −0.512 −0.588 −0.122 NA 1 −0.436 −0.511 Increase in rhizome diameter 0.020 0.099 0.358** 0.201 0.166 0.172 0.118 −0.078 −0.012 −0.436 1 0.540** Rhizome weight 0.051 0.354** 0.383** 0.361** 0.306* 0.296* 0.282* −0.097 0.088 −0.511 0.540** 1 * Significant (p < 0.05), ** Highly significant (p < 0.01).
NA indicates that it cannot be calculated because at least one variable is a constant.Table 3.
Correlation analysis of growth indices and plant growth regulator treatments in I. ensata.
-
Treatments Bud
numberPlant
height
in MayPlant
height
in JunePlant
height
in JulyPlant
height
in Aug.Plant
height
in Sep.Plant
height
in Oct.Number of
flowers per
plantFlower
stalk
heightIncrease in
rhizome
diameterRhizome
weightTreatments 1 −0.136 −0.171 −0.161 −0.512** −0.535** −0.477** −0.275* −0.038 −0.613** −0.027 0.291* Bud number −0.136 1 −0.186 −0.047 −0.126 −0.105 −0.159 0.063 −0.277 0.264 0.231 0.158 Plant height in May −0.171 −0.186 1 0.733** 0.633** 0.630** 0.597** 0.350** −0.127 0.350 −0.414** −0.100 Plant height in June −0.161 −0.047 0.733** 1 0.678** 0.615** 0.599** 0.423** −0.270 0.467* −0.282 −0.029 Plant height in July −0.512** −0.126 0.633** 0.678** 1 0.745** 0.796** 0.667** −0.011 0.655** 0.005 0.035 Plant height in Aug. −0.535** −0.105 0.630** 0.615** 0.745** 1 0.747** 0.416** −0.103 0.603** −0.142 −0.079 Plant height in Sep. −0.477** −0.159 0.597** 0.599** 0.796** 0.747** 1 0.643** 0.196 0.624** 0 0.027 Plant height in Oct. −0.275* 0.063 0.350** 0.423** 0.667** 0.416** 0.643** 1 0.167 0.639** 0.150 0.139 Number of flowers per plant −0.038 −0.277 −0.127 −0.270 −0.011 −0.103 0.196 0.167 1 0.118 0.031 −0.148 Flower stalk height −0.613** 0.264 0.350 0.467* 0.655** 0.603** 0.624** 0.639** 0.118 1 0.087 −0.274 Increase in rhizome diameter −0.027 0.231 −.414** −0.282 0.005 −0.142 0 0.150 0.031 0.087 1 0.407** Rhizome weight 0.291* 0.158 −0.100 −0.029 0.035 −0.079 0.027 0.139 −0.148 −0.274 0.407** 1 * Significant (p < 0.05), ** Highly significant (p < 0.01). Table 4.
Correlation analysis of growth indices and plant growth regulator treatments in I. ensata var. variegata.
-
Treatments Bud
numberPlant
height
in MayPlant
height
in JunePlant
height
in JulyPlant
height
in Aug.Plant
height
in Sep.Plant
height
in Oct.Number of
flowers per
plantFlower
stalk
heightIncrease in
rhizome
diameterRhizome
weightTreatments 1 0.116 −0.150 0.019 −0.181 −0.178 −0.343** −0.032 −0.119 −0.189 −0.521** −0.281* Bud number 0.116 1 −0.068 0.200 0.035 0.064 −0.104 −0.270* −0.142 0.059 −0.080 0.227 Plant height in May −0.150 −0.068 1 0.190 0.513** 0.109 0.312* 0.270* 0.073 0.191 0.283 0.072 Plant height in June 0.019 0.200 0.190 1 0.410** 0.103 0.203 0.014 −0.047 −0.071 0.044 0.239 Plant height in July −0.181 0.035 0.513** 0.410** 1 0.720** 0.824** 0.248 0.164 −0.056 0.395* 0.489** Plant height in Aug. −0.178 0.064 0.109 0.103 0.720** 1 0.704** 0.231 0.209 −0.063 0.436* 0.466** Plant height in Sep. −0.343** −0.104 0.312* 0.203 0.824** 0.704** 1 0.429** 0.210 0.196 0.479** 0.545** Plant height in Oct. −0.032 −0.270* 0.270* 0.014 0.248 0.231 0.429** 1 0.078 −0.006 0.056 0.002 Number of flowers per plant −0.119 −0.142 0.073 −0.047 0.164 0.209 0.210 0.078 1 0.007 0.196 −0.022 Flower stalk height −0.189 0.059 0.191 −0.071 −0.056 −0.063 0.196 −0.006 0.007 1 0.054 −0.087 Increase in rhizome diameter −0.521** −0.080 0.283 0.044 0.395* 0.436* 0.479** 0.056 0.196 0.054 1 0.661** Rhizome weight −0.281* 0.227 0.072 0.239 0.489** 0.466** 0.545** 0.002 −0.022 −0.087 0.661** 1 * Significant (p < 0.05), ** Highly significant (p < 0.01). Table 5.
Correlation analysis of growth indices and plant growth regulator treatments in I. sanguinea.
Figures
(4)
Tables
(5)