-
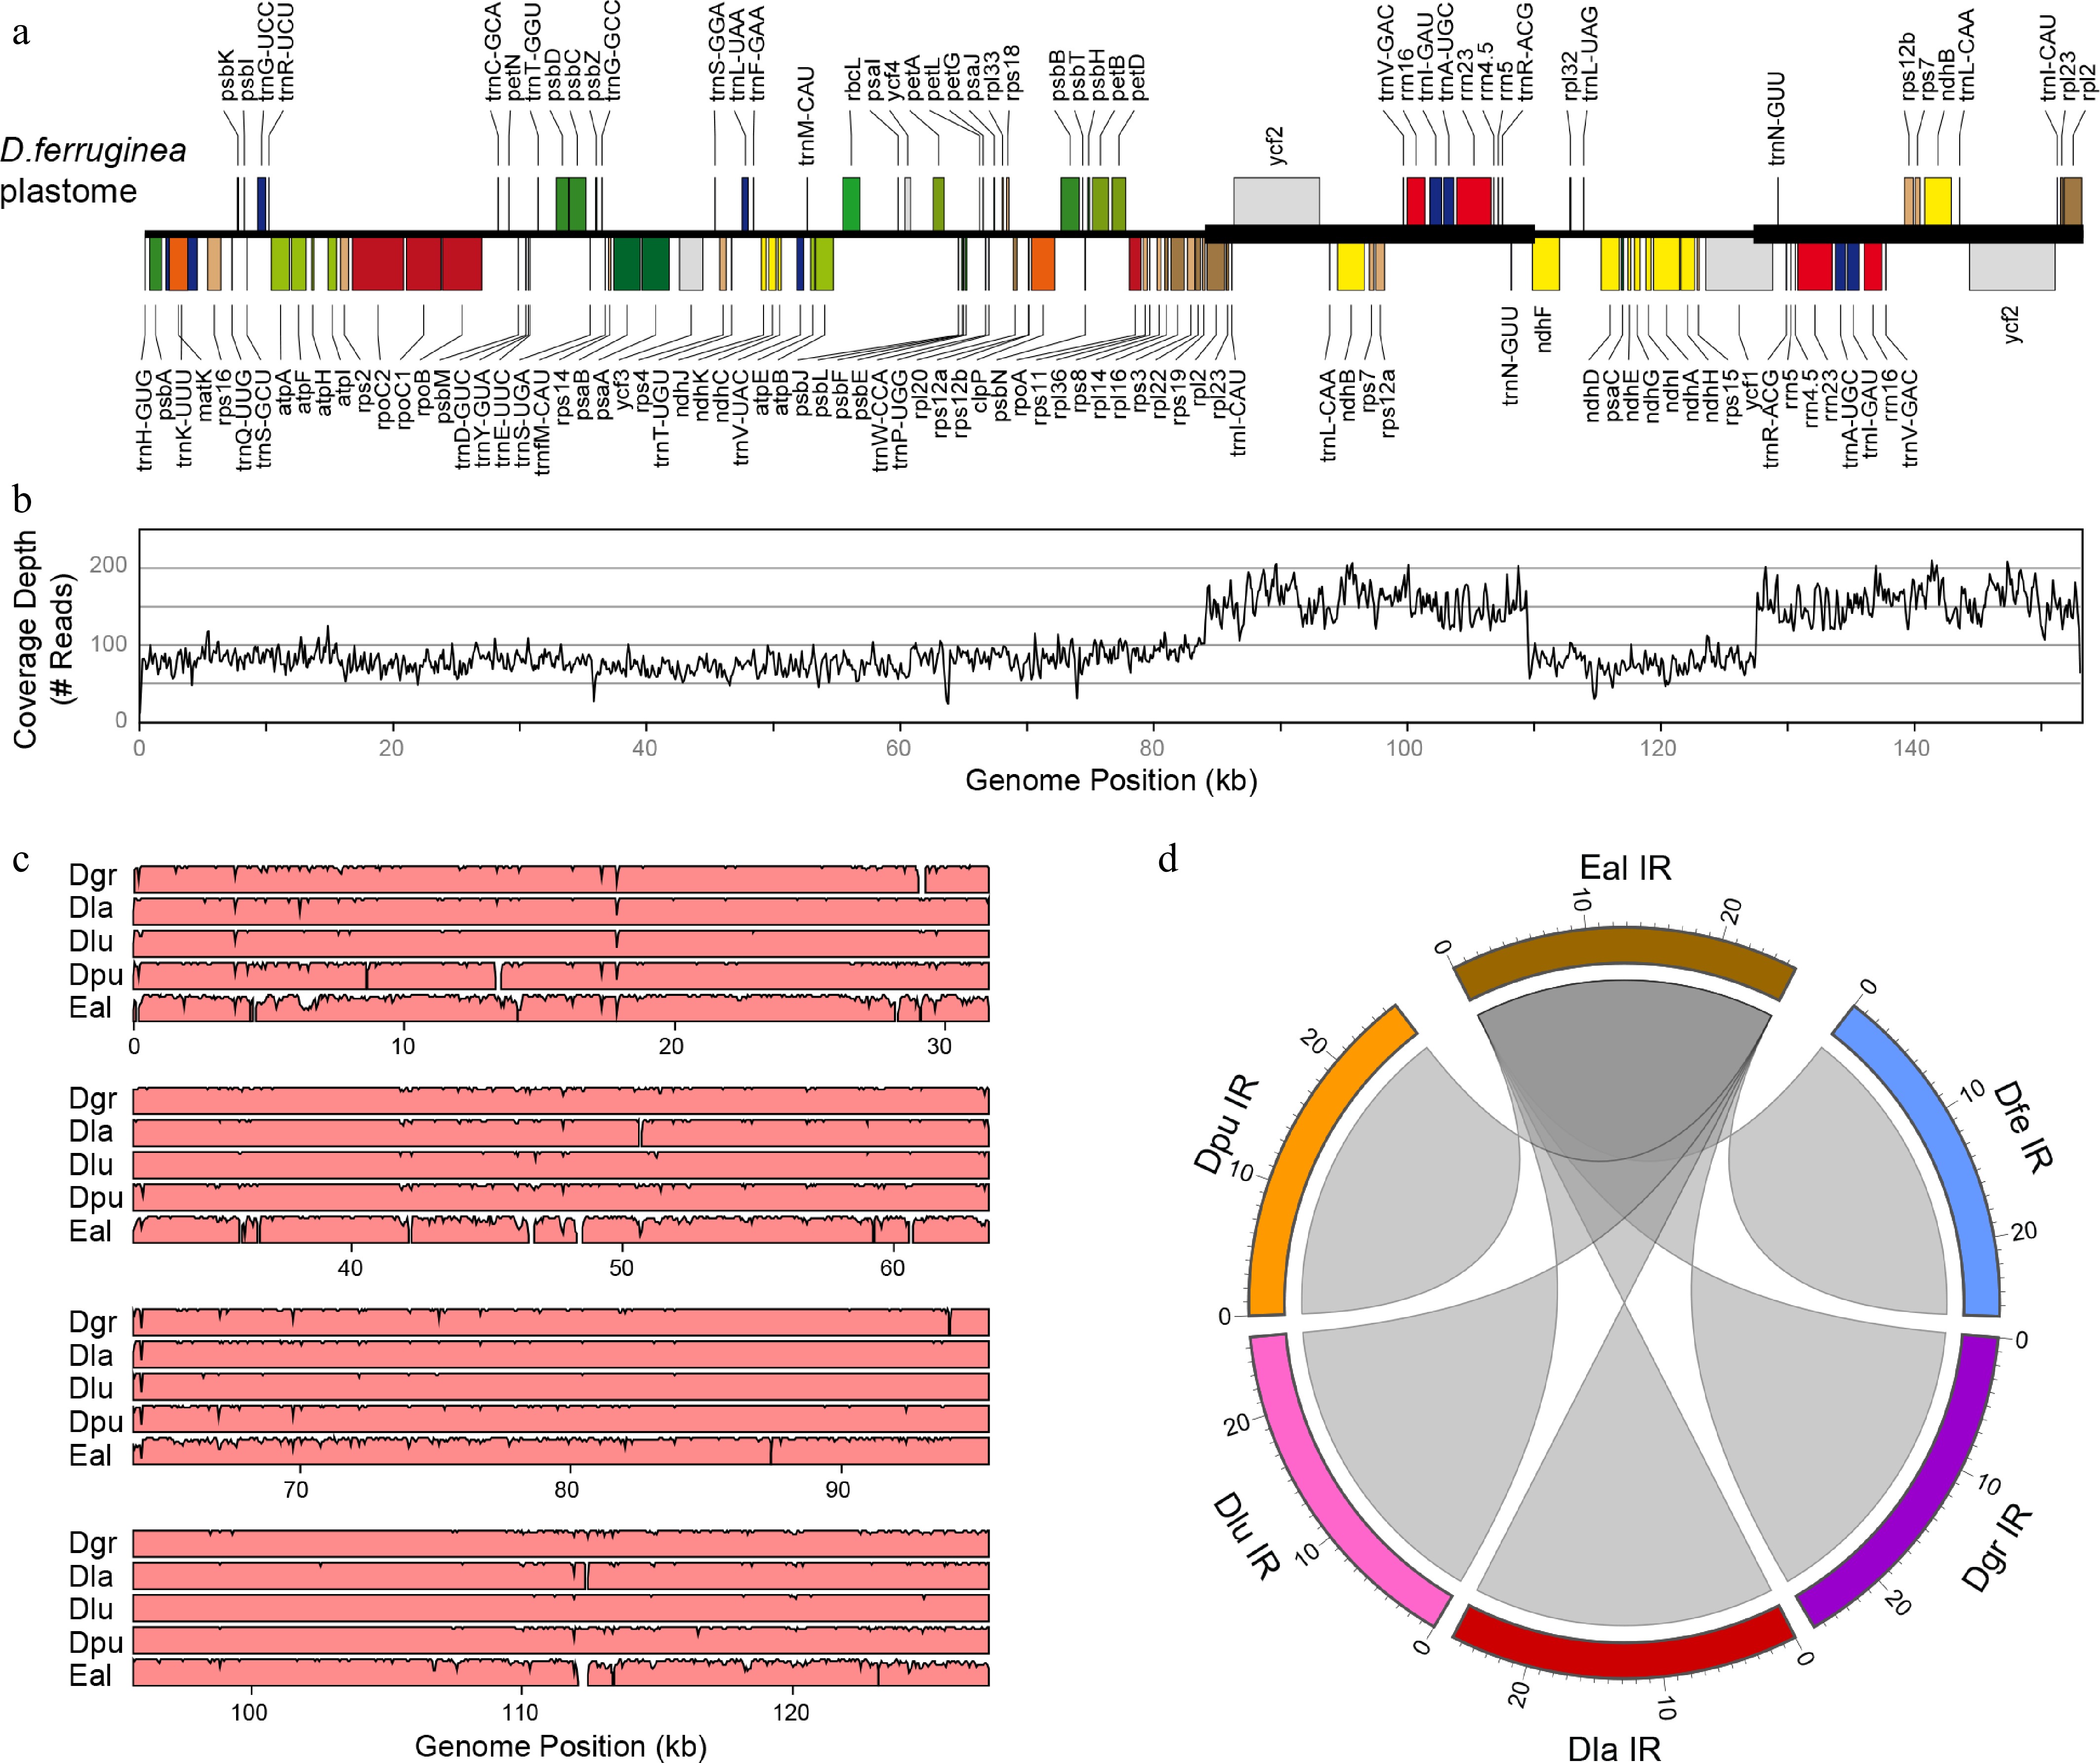
Figure 1.
Plastome analyses in Digitalideae. (a) The annotated linear genome map. The locations of the IR copies are shown with a thick horizontal line. (b) Plot showing the depth of read coverage. (c) mVISTA plot showing the sequence similarity (%) of the D. ferruginea plastome compared with the five other Digitalideae plastomes. (d) Circos plot showing the sequence homology of the E. alpinus IR compared with the five Digitalis IRs. Rulers are in kb.
-
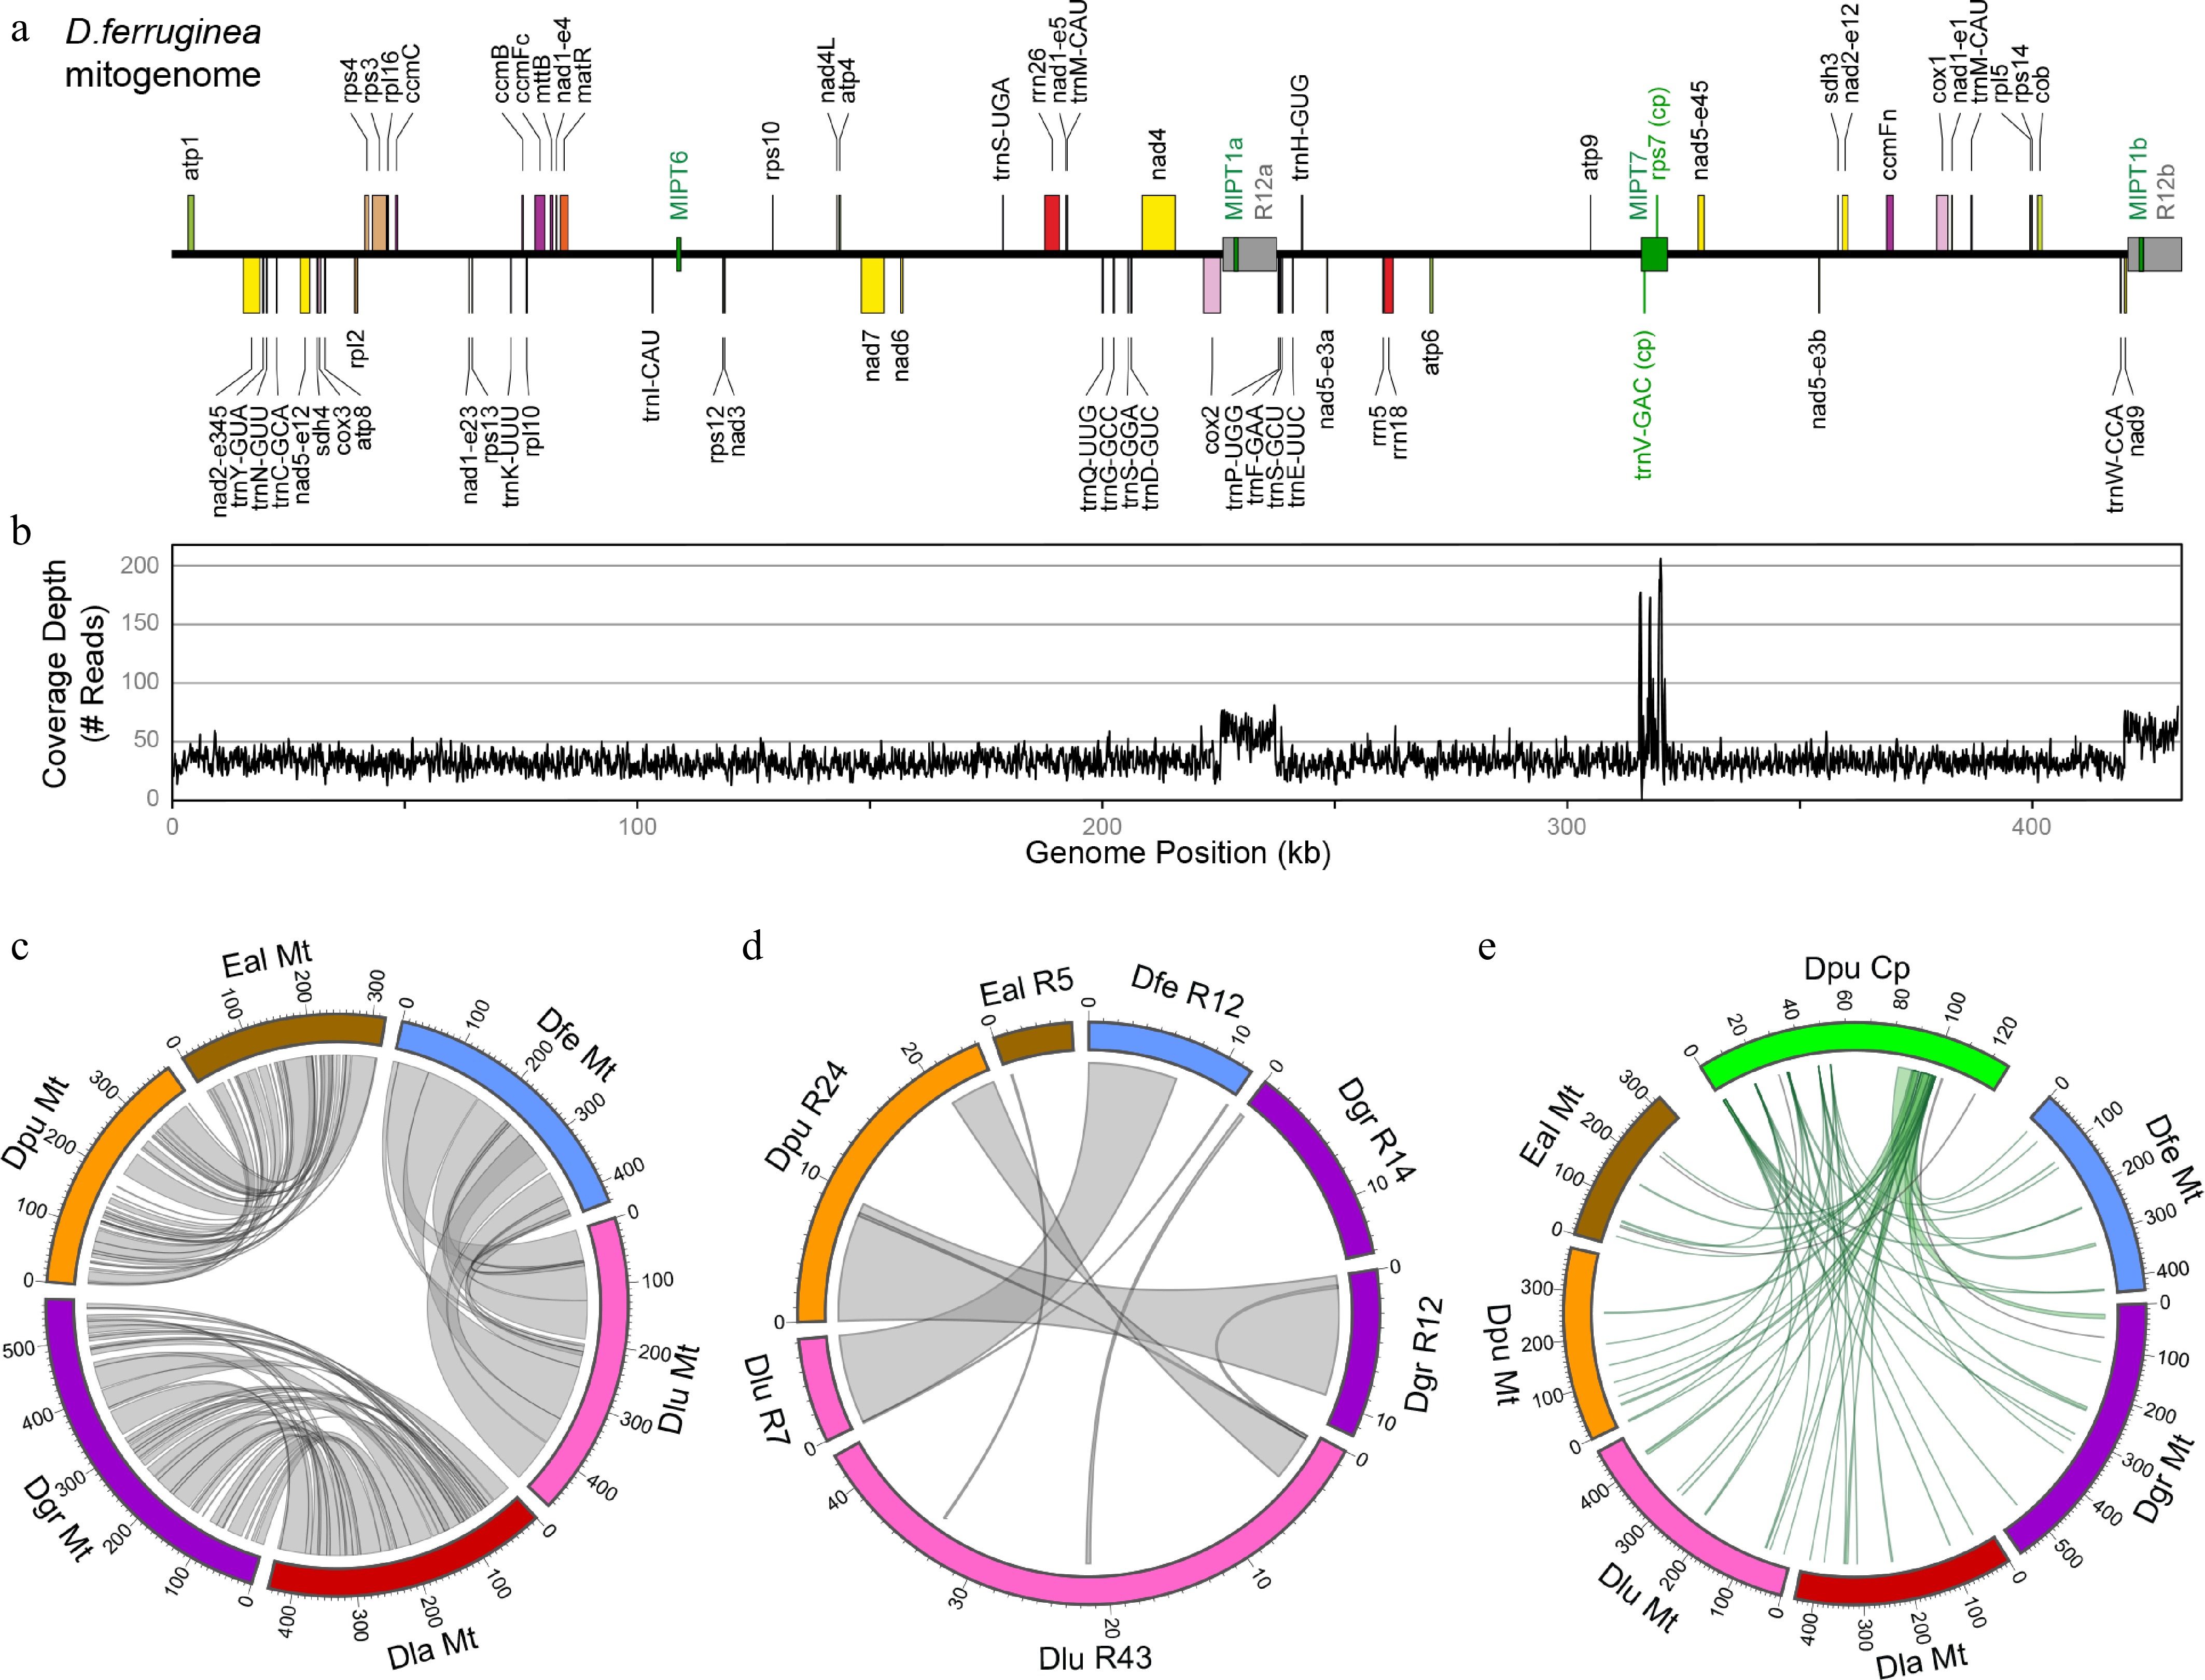
Figure 2.
Analyses of the Digitalideae mitogenome. (a) The annotated linear genome map. The locations of the large (> 1 kb) repeats (gray) and MIPTs (green) are shown as boxes centered on the main horizontal axis. (b) Depth of the read coverage plot. (c) Circos plot showing homologous segments (> 1 kb) between pairs of Digitalideae mitogenomes. (d) Circos plot showing homologous segments (> 100 bp) among the large repeats in Digitalideae mitogenomes. (e) Circos plot showing MIPTs (> 100 bp) in Digitalideae mitogenomes. Rulers are in kb for all Circos plots.
-
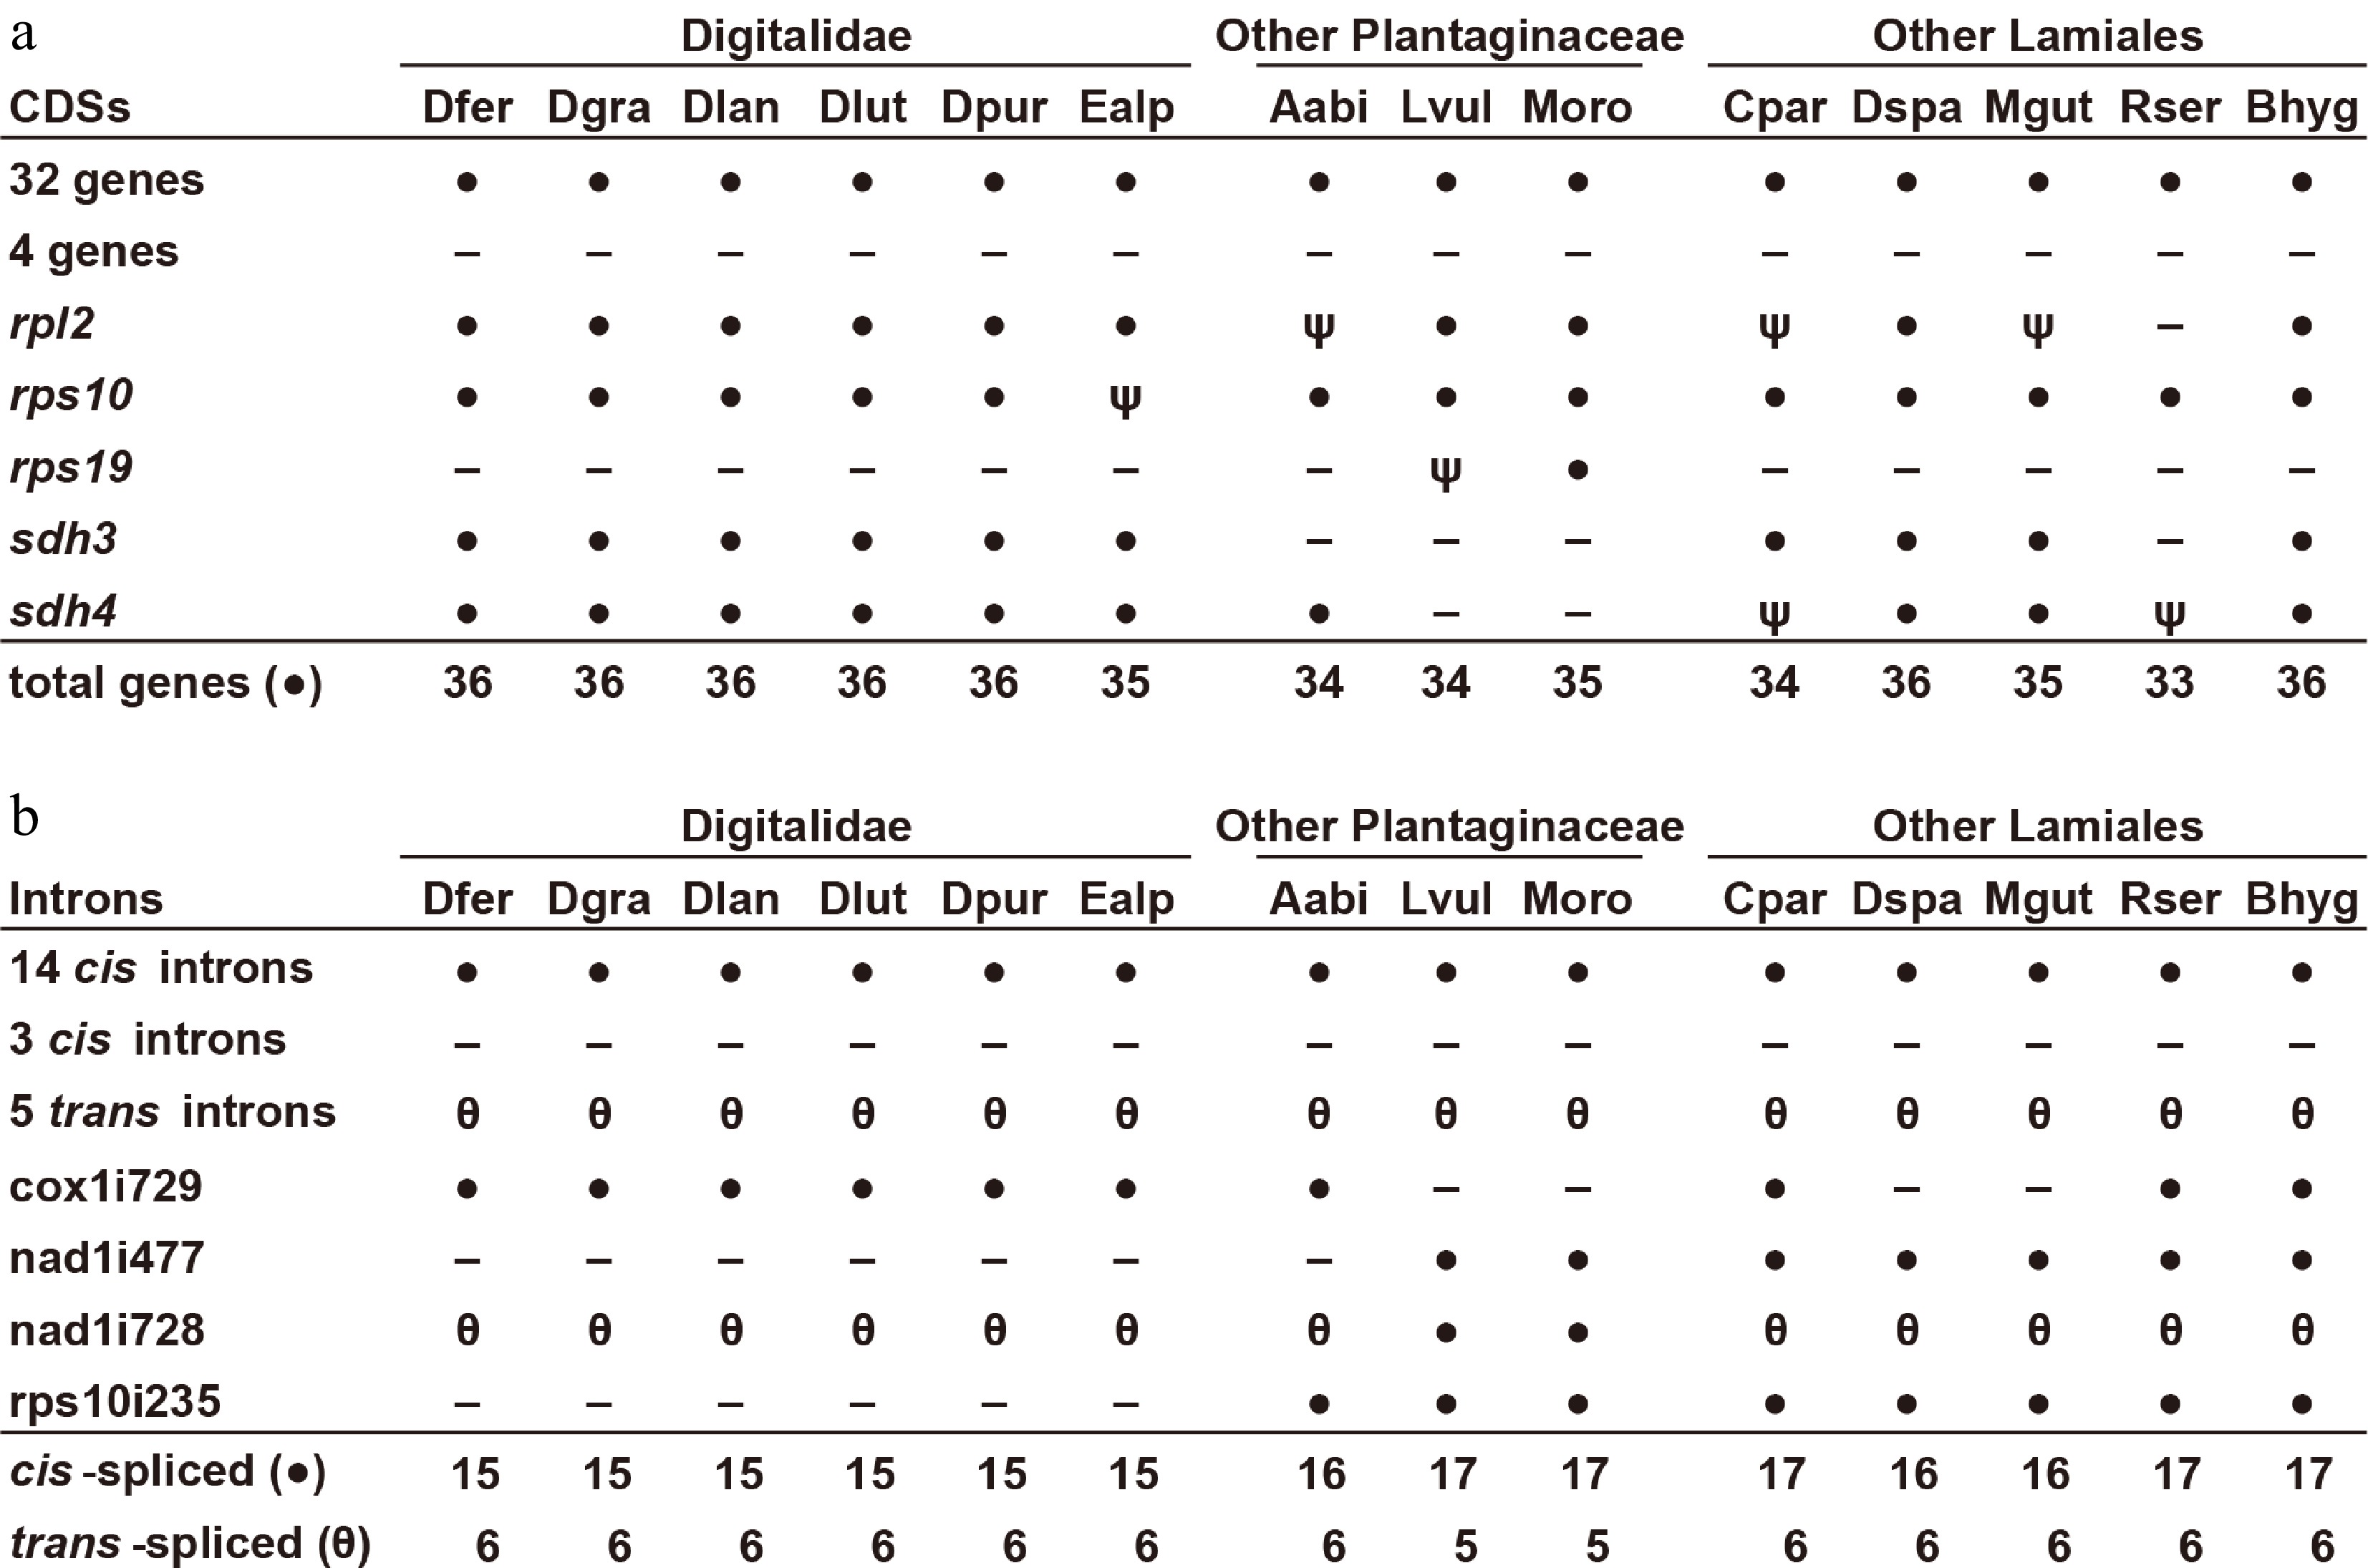
Figure 3.
Gene and intron content among Digitalideae mitogenomes. (a) CDS content. The 32 genes present (●) in all species include atp1, -4, -6, -8, and -9; ccmB, -C, -Fc, and -Fn; cob; cox1, -2, and -3; matR; mttB; nad1, -2, -3, -4, -4L, -5, -6, -7, and -9; rpl5, -10, -16; and rps3, -4, -12, -13, and -14. The four genes absent (−) from all species include rps1, -2, -7, and -11. Inferred pseudogenes (ψ) are marked. (b) Intron content. The 14 cis-spliced introns (●) present in all species include ccmFCi829; cox2i691; nad2i156, -i709, and -i1282; nad4i461, -i976, and -i1399; nad5i230 and -i1872; nad7i140, -i209, and -i917; and rps3i74. The five trans-spliced introns (θ) present in all species include nad1i394, nad1i669, nad2i542, and nad5-i1455 and -i1477. The three cis-spliced introns lost (−) from all species include cox2i373, nad7i676, and rpl2i846.
-
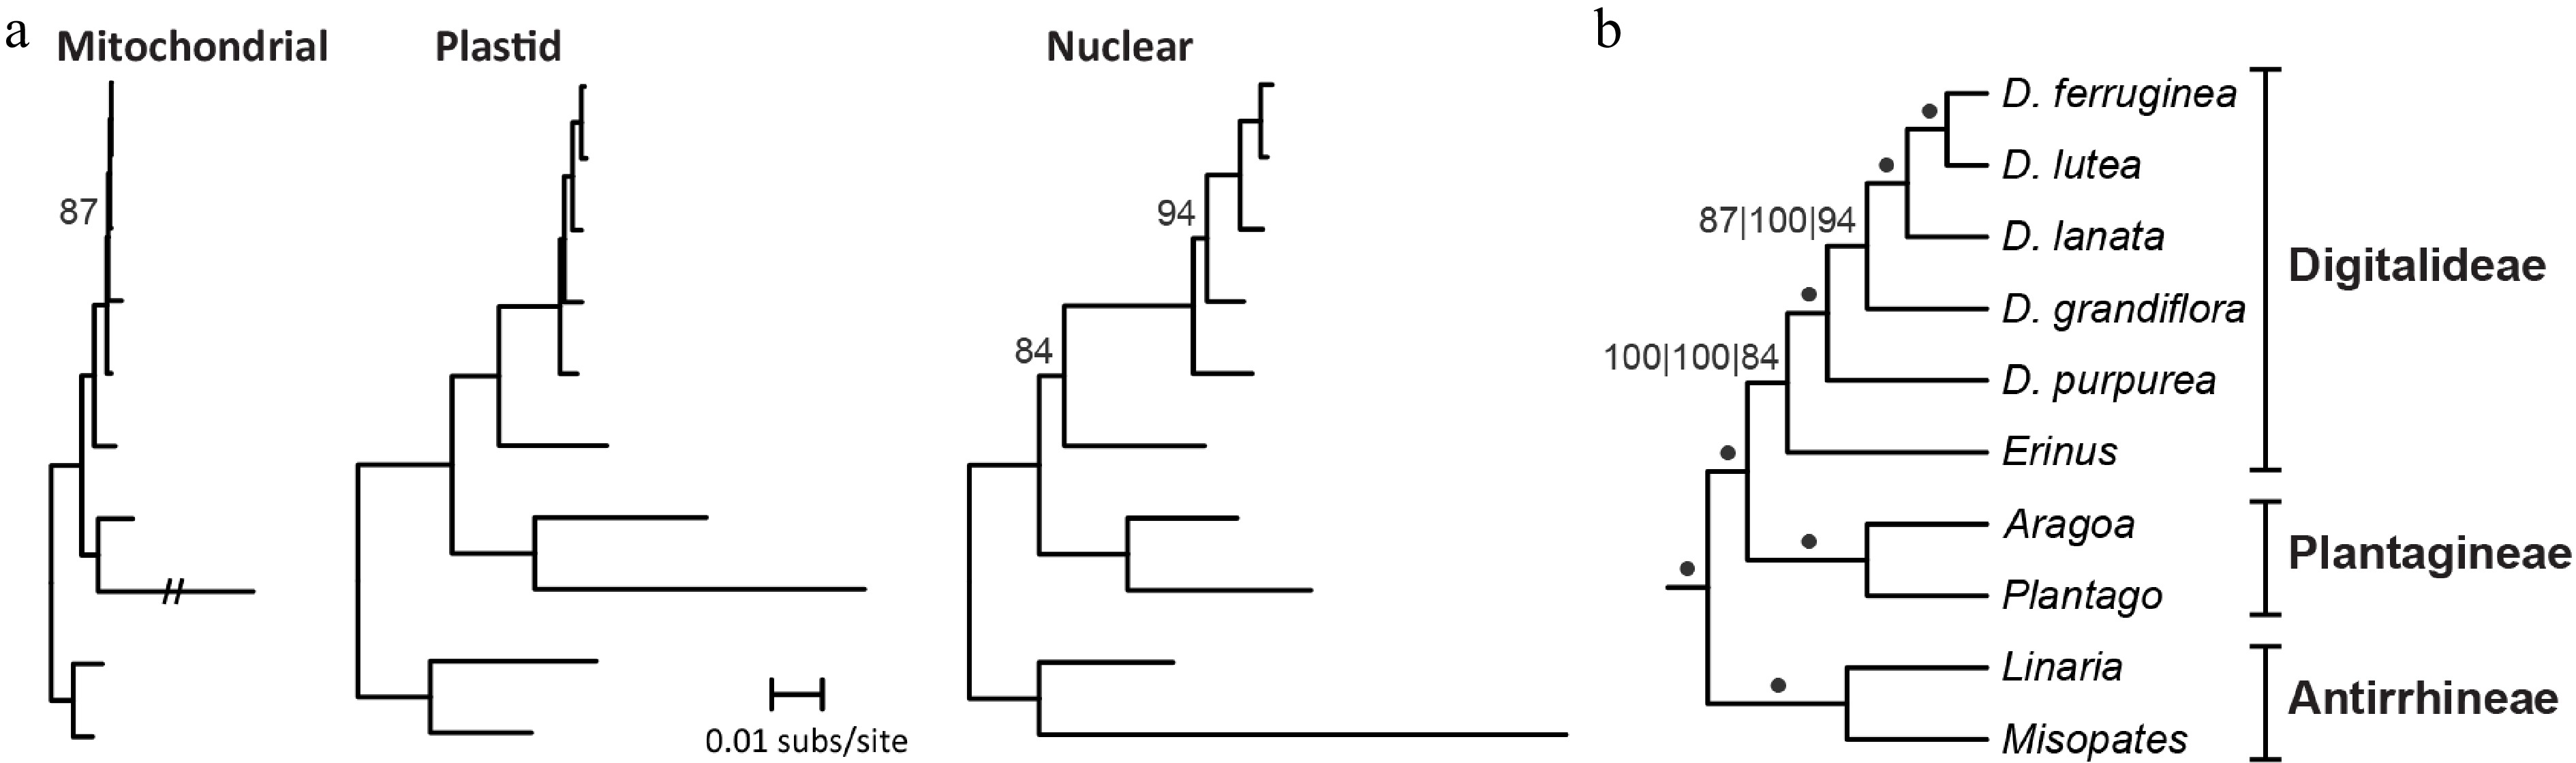
Figure 4.
Phylogenetic signal among Digitalideae genomes. (a) Phylograms of the concatenation of 32 mitochondrial CDSs, 3 rRNAs, and 20 introns present in all species (left); entire plastomes (excluding one copy of the IR) (middle); and nuclear rDNA (right). A long mitochondrial branch for Plantago ovata was reduced to 20% of the original length. All bootstrap values < 100% are listed. Outgroup taxa from Lamiales were used to root the tree but are not shown. (b) Cladogram summarizing the results from the three phylogenetic analyses. A dot indicates 100% bootstrap support from all three genome analyses. Bootstrap values for each analysis (left: mitochondrial; middle: plastome; right: nuclear rDNA) are shown if any analysis has < 100% bootstrap support. Section groupings are shown.
-
Species Chromosome (#) Size (kb) GC Repeat MIPT CDS (#) rRNA (#) tRNA (#) Introns (#) Digitalideae Digitalis ferruginea 1 431 44.9% 3.3% 2.4% 36 3 19 21 Digitalis grandiflora 1 570 44.7% 5.0% 3.2% 36 3 19 21 Digitalis lanata 1 437 45.1% 0.3% 2.5% 36 3 18 21 Digitalis lutea 1 468 44.9% 11.1% 2.3% 36 3 19 21 Digitalis purpurea 1 384 45.1% 6.5% 2.3% 36 3 18 21 Erinus alpinus 1 320 44.9% 2.2% 2.0% 35 3 19 21 Other Plantaginaceae Aragoa abietina 1 365 45.0% 0.5% 1.2% 34 3 16 22 Linaria vulgaris 2 468 44.6% 5.8% 0.5% 34 3 14 22 Misopates orontium 1 570 44.6% 1.0% 3.3% 35 3 19 22 Other Lamiales Boea hygrometrica 1 511 43.3% 0.9% 9.1% 35 3 22 23 Castilleja paramensis 1 495 43.5% 2.3% 16.1% 36 3 21 23 Dolichandrone spathacea 1 670 44.9% 3.6% 1.2% 36 3 17 22 Erythranthe guttata 1 526 45.1% 8.4% 2.8% 34 3 22 22 Rotheca serrata 1 482 45.5% 0.3% 2.7% 33 3 18 23 Table 1.
Comparison of mitogenomic characteristics for Digitalideae and related species.
Figures
(4)
Tables
(1)