-
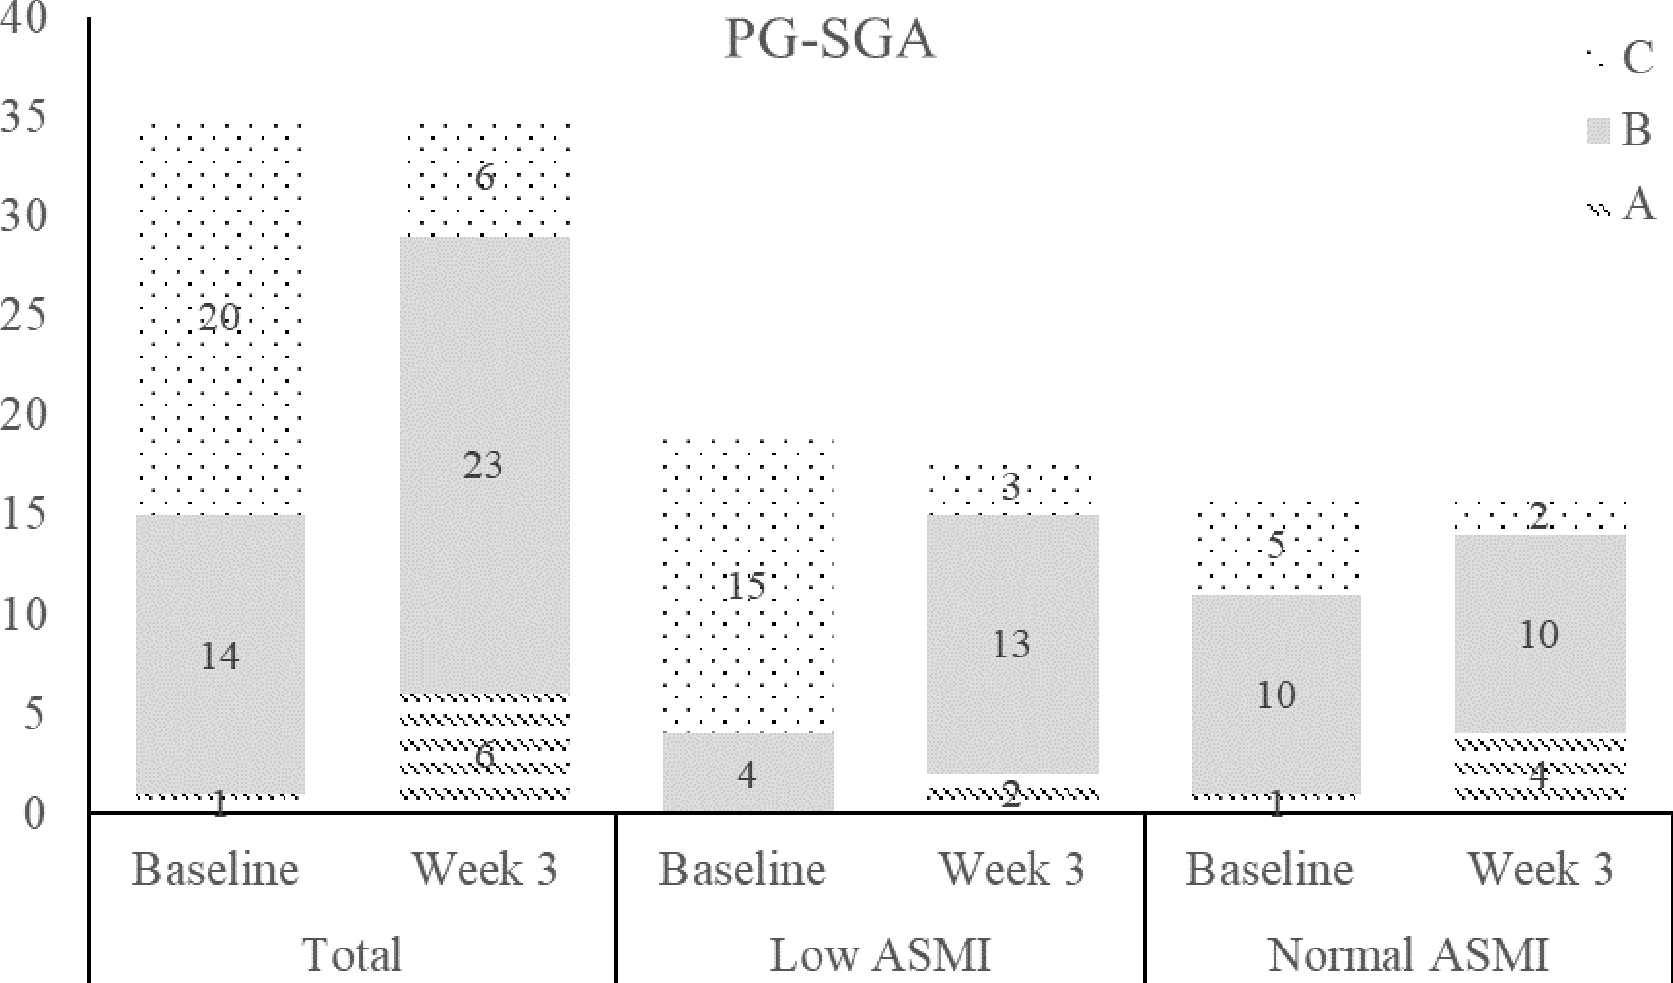
Figure 1.
Number of patients according to nutritional status evaluated by the PG-SGA at baseline and Week 3: (A) well-nourished; (B) moderately or suspected of being malnourished; (C) severely malnourished. ASMI: appendicular skeletal muscle mass.
-
Total (n) % / SD Age (years) 62.3 9.6 Sex [n (%)] Male 28 80.0 Female 7 20.0 Primary diagnosis Stomach 23 65.7 Sigmoid colon 4 11.4 Ascending colon 1 2.9 Descending colon 1 2.9 Transverse colon 1 2.9 Rectum 3 8.6 Duodenum 2 5.7 Stage I 5 14.3 II 6 17.1 III 18 51.4 IV 6 17.1 Chemotherapy No 15 42.9 Yes 20 57.1 BW status Underweight 8 22.9 Normal weight 26 74.3 Overweight 1 2.9 At risk of sarcopenia Low ASMI 19 54.3 Normal ASMI 16 45.7 Nutritional status by PG-SCAa A 1 2.9 B 14 40.0 C 20 57.1 ASMI: appendicular skeletal muscle mass index; PG-SCA: patient-generated subjective global assessment score; SD: standard deviation. Data are presented as the mean and SD or the median (interquartile range: 25%−75%). a A: well-nourished; B: moderately or suspected of being malnourished; C: severely malnourished. Table 1.
Baseline characteristics of study patients (n = 35).
-
Baseline Week 3 Change p-Valuea Bodyweight (kg) 55.2 (7.0) 55.6 (7.3) 0.4 0.818 Body mass index (kg/m2) 20.0 (2.0) 20.1 (2.1) 0.1 0.909 Total body water (L) 32.8 (5.3) 32.2 (5.2) −0.6 0.646 Skeletal muscle mass (kg) 23.5 (4.1) 23.6 (4.1) 0.1 0.924 ASM (kg) 18.5 (3.0) 18.7 (2.9) 0.2 0.749 Fat mass (kg) 10.3 (8.2, 14.0) 11.1 (9.2, 14.3) 0.8 0.856 Body fat (%) 19.3 (14.4, 23.6) 19.5 (17.1, 25.7) 0.2 0.589 Visceral fat area (cm2) 53.1 (44.1, 68.0) 53.8 (44.4, 68.6) 0.7 0.819 C-reactive protein (mg/L) 1.7 (0.7, 3.3) 1.9 (0.9, 3.9) 0.2 0.727 Albumin (g/L) 41.0 (38.8, 43.0) 40.8 (38.9, 42.3) −0.2 0.589 SII 291.8
(192.5, 447.2)278.6
(221.7, 351.3)−13.2 0.574 PNI 49.00 (45.9, 51.2) 47.4 (46.4, 49.5) −1.6 0.570 ASM: appendicular skeletal muscle mass; SII: systemic immune–inflammation index; PNI: prognostic nutritional index. Data are presented as the mean (standard deviation) or median (interquartile range: 25%−75%). a p-Values were examined by Paired Student's t-test and the Wilcoxon–Whitney U- test between the baseline and Week 3 of ONS. Table 2.
Comparison of anthropometry, body composition and inflammatory parameters at baseline and after 3-week oral nutritional supplements.
-
Low ASMI Normal ASMI Baseline Week 3 Change p-Valuea Baseline Week 3 Change p-Valuea Total Bodyweight (kg) 51.0 (48.9, 56.7) 51.3 (48.1, 55.7) 0.3 0.761 58.6 (55.3, 66.1) 60.0 (57.0, 66.8) 1.4 0.577 BMI (kg/m2) 19.0 (17.5, 19.6) 18.3 (17.8, 19.4) −0.7 0.693 21.9 (20.3, 22.6) 21.9 (20.4, 22.3) 0.0 0.759 Total body water (L) 31.9 (29.9, 34.9) 30.6 (28.4, 33.4) −1.3 0.459 34.0 (31.3, 36.9) 34.5 (31.4, 36.8) 0.5 0.751 SMM (kg) 22.2 (21.5, 25.8) 22.2 (20.7, 24.5) 0.0 0.750 24.8 (22.1, 26.9) 25.4 (23.1, 26.9) 0.6 0.679 Fat mass (kg) 9.6 (7.0, 10.7) 9.6 (7.9, 10.3) 0.0 0.988 13.6 (10.3, 15.8) 13.0 (11.1,17.1) −0.4 0.627 Body fat (%) 19.0 (13.7, 20.7) 18.4 (16.5, 20.0) −0.6 0.855 22.6 (17.1, 27.7) 21.8 (18.3, 26.6) −0.8 0.665 Visceral fat area (cm2) 46.3 (39.1,53.1) 45.0 (34.7, 53.2) −1.3 0.915 65.5 (53.5, 75.0) 65.1 (55.0,80.7) −0.4 0.901 No chemotherapy Bodyweight (kg) 50.4 (49.4, 59.2) 49.8 (48.2, 54.5) −0.6 0.563 57.8 (56.0, 58.8) 58.5 (57.0, 61.0) 0.7 0.515 BMI (kg/m2) 19.3 (17.8, 20.1) 18.9 (17.6, 19.9) −0.4 0.657 21.9 (20.6, 22.3) 20.7 (20.1, 22.3) −1.2 1.000 Total body water (L) 30.1 (29.9, 34.9) 30.1 (28.9, 30.6) 0.0 0.464 32.6 (29.1, 34.3) 34.5 (29.9, 36.9) 1.9 0.569 SMM (kg) 21.6 (21.5, 25.7) 21.9 (21.0, 22.2) 0.3 0.688 23.3 (21.4, 25.2) 25.4 (21.9, 26.9) 2.1 0.570 Fat mass (kg) 9.6 (8.2, 11.7) 8.7 (8.0, 15.3) −0.9 0.689 13.6 (12.4, 14.0) 12.4 (11.1, 13.8) −1.2 0.515 Body fat (%) 19.1(14.4, 19.6) 17.4 (16.6, 25.6) −1.7 0.859 23.6 (21.1, 26.1) 20.9 (17.6, 25.3) −2.7 0.570 Visceral fat area (cm2) 46.5 (40.9, 54.8) 42.5 (36.8, 80.8) −4.0 0.657 66.0 (58.8, 73.4) 58.0 (51.5, 71.5) −8.0 0.465 Chemotherapy Bodyweight (kg) 51.7 (48.9, 53.4) 52.6 (47.5, 55.7) −0.9 0.624 60.2 (54.5, 67.5) 61.5 (55.0, 67.6) 1.3 0.597 BMI (kg/m2) 18.4 (17.5, 19.0) 18.2 (17.8, 19.1) −0.2 0.935 21.8 (20.0, 23.2) 22.0 (20.4, 23.7) 0.2 0.503 Total body water (L) 32.2 (28.4, 35.2) 32.2 (28.0, 34.2) 0.0 0.965 34.3 (32.9, 36.9) 35.3 (31.4, 36.8) 1.0 0.967 SMM (kg) 23.1 (22.2, 25.8) 23.7 (20.1, 25.4) 0.6 0.838 24.9 (22.8, 27.3) 25.9 (23.1, 27.2) 1.0 0.805 Fat mass (kg) 9.8 (6.5, 10.3) 9.7 (9.1, 10.2) −0.1 0.902 13.5 (9.2, 16.2) 14.7 (11.0, 17.1) 1.2 0.438 Body fat (%) 17.2 (13.3, 20.7) 18.7 (13.7, 20.0) 1.5 0.838 22.4 (15.8, 29.4) 24.7 (19.1, 28.4) 2.3 0.342 Visceral fat area (cm2) 45.4 (33.2, 53.1) 45.9 (34.7, 53.0) 0.5 0.806 65.0 (53.0, 82.5) 67.5 (55.2, 88.5) 2.5 0.439 SMM: skeletal muscle mass; ASMI: appendicular skeletal muscle mass index. Data are presented as the median with interquartile range (25%−75%). a p-Values were examined by the Wilcoxon–Whitney U-test between baseline and after 3 weeks of ONS. Table 3.
Comparison of anthropometry and body composition at baseline and Week 3 after tumor-specialized ONS, stratified by sarcopenia status and chemotherapy status.
-
Low ASMI Normal ASMI Baseline Week 3 Change p-Valuea Baseline Week 3 Change p-Valuea Total CRP (mg/L) 1.8 (0.64, 8.6) 1.9 (1.3, 8.0) 0.1 0.498 1.7 (0.72,3.3) 1.2 (0.63, 3.9) −0.5 0.872 ALB (g/L) 40.9 (39.0, 44.2) 39.7 (38.1, 40.7) −1.2 0.355 41.3 (38.8, 42.7) 41.3 (40.8, 42.8) 0.0 0.752 SII 291.4 (192.5, 386.7) 264.7 (189.8, 385.9) −26.7 0.786 315.3 (221.9, 447.2) 292.3 (228.6, 351.3) −22.9 0.631 PNI 47.9 (46.5, 49.5) 47.0 (45.3, 48.4) −1.0 0.173 49.5 (45.5, 51.2) 49.3 (47.4, 52.1) −0.2 0.716 No chemotherapy CRP (mg/L) 1.9 (0.69, 14.9) 1.9 (0.48, 8.0) 0.0 0.655 2.7 (0.51, 2.8) 2.4 (0.43, 5.7) −0.3 0.584 ALB (g/L) 39.2 (38.4, 40.9) 38.7 (36.9, 39.2) −0.5 0.454 42.7 (38.7, 42.7) 42.1 (39.8, 43.1) −0.6 0.855 SII 215.3 (159.5, 363.7) 275.7 (210.7, 359.7) 60.4 0.670 405.7 (221.9, 622.2) 308.3 (212.3, 353.2) −97.5 0.685 PNI 46.7 (45.9, 47.9) 45.7 (43.9, 47.0) −1.1 0.336 49.7 (49.2, 51.2) 49.8 (47.4, 52.1) 0.1 0.927 Chemotherapy CRP (mg/L) 1.6 (0.58, 2.3) 2.2 (1.4, 8.0) 0.6 0.247 1.6 (0.96, 3.3) 1.2 (0.75, 3.1) −0.4 0.665 ALB (g/L) 44.2 (39.6, 45.5) 40.4 (38.8, 41.7) −3.8 0.297 41 (40.1, 41.7) 41.3 (40.8, 42.3) 0.3 0.596 SII 370.0 (254.1, 497.7) 261.7 (175.4, 450.2) −108.3 0.488 291.8 (248.6, 402.7) 280.3 (235.5, 323.2) −11.5 0.630 PNI 49.5 (47.6, 52.0) 47.4 (46.3, 49.4) −2.1 0.118 48.1 (45.5, 50.2) 48.3 (47.3, 52.4) 0.2 0.711 CRP: C-reactive protein; ALB: albumin; SII: the systemic immune-inflammation index; PNI: prognostic nutritional index. Data are presented as the median with interquartile range (25%−75%). a p-Values were examined by the Wilcoxon–Whitney U-test between baseline and after 3 weeks of ONS. Table 4.
Comparison of immune and inflammatory parameters at baseline and after 3 weeks of ONS, stratified by sarcopenia status and chemotherapy status.
Figures
(1)
Tables
(4)