-
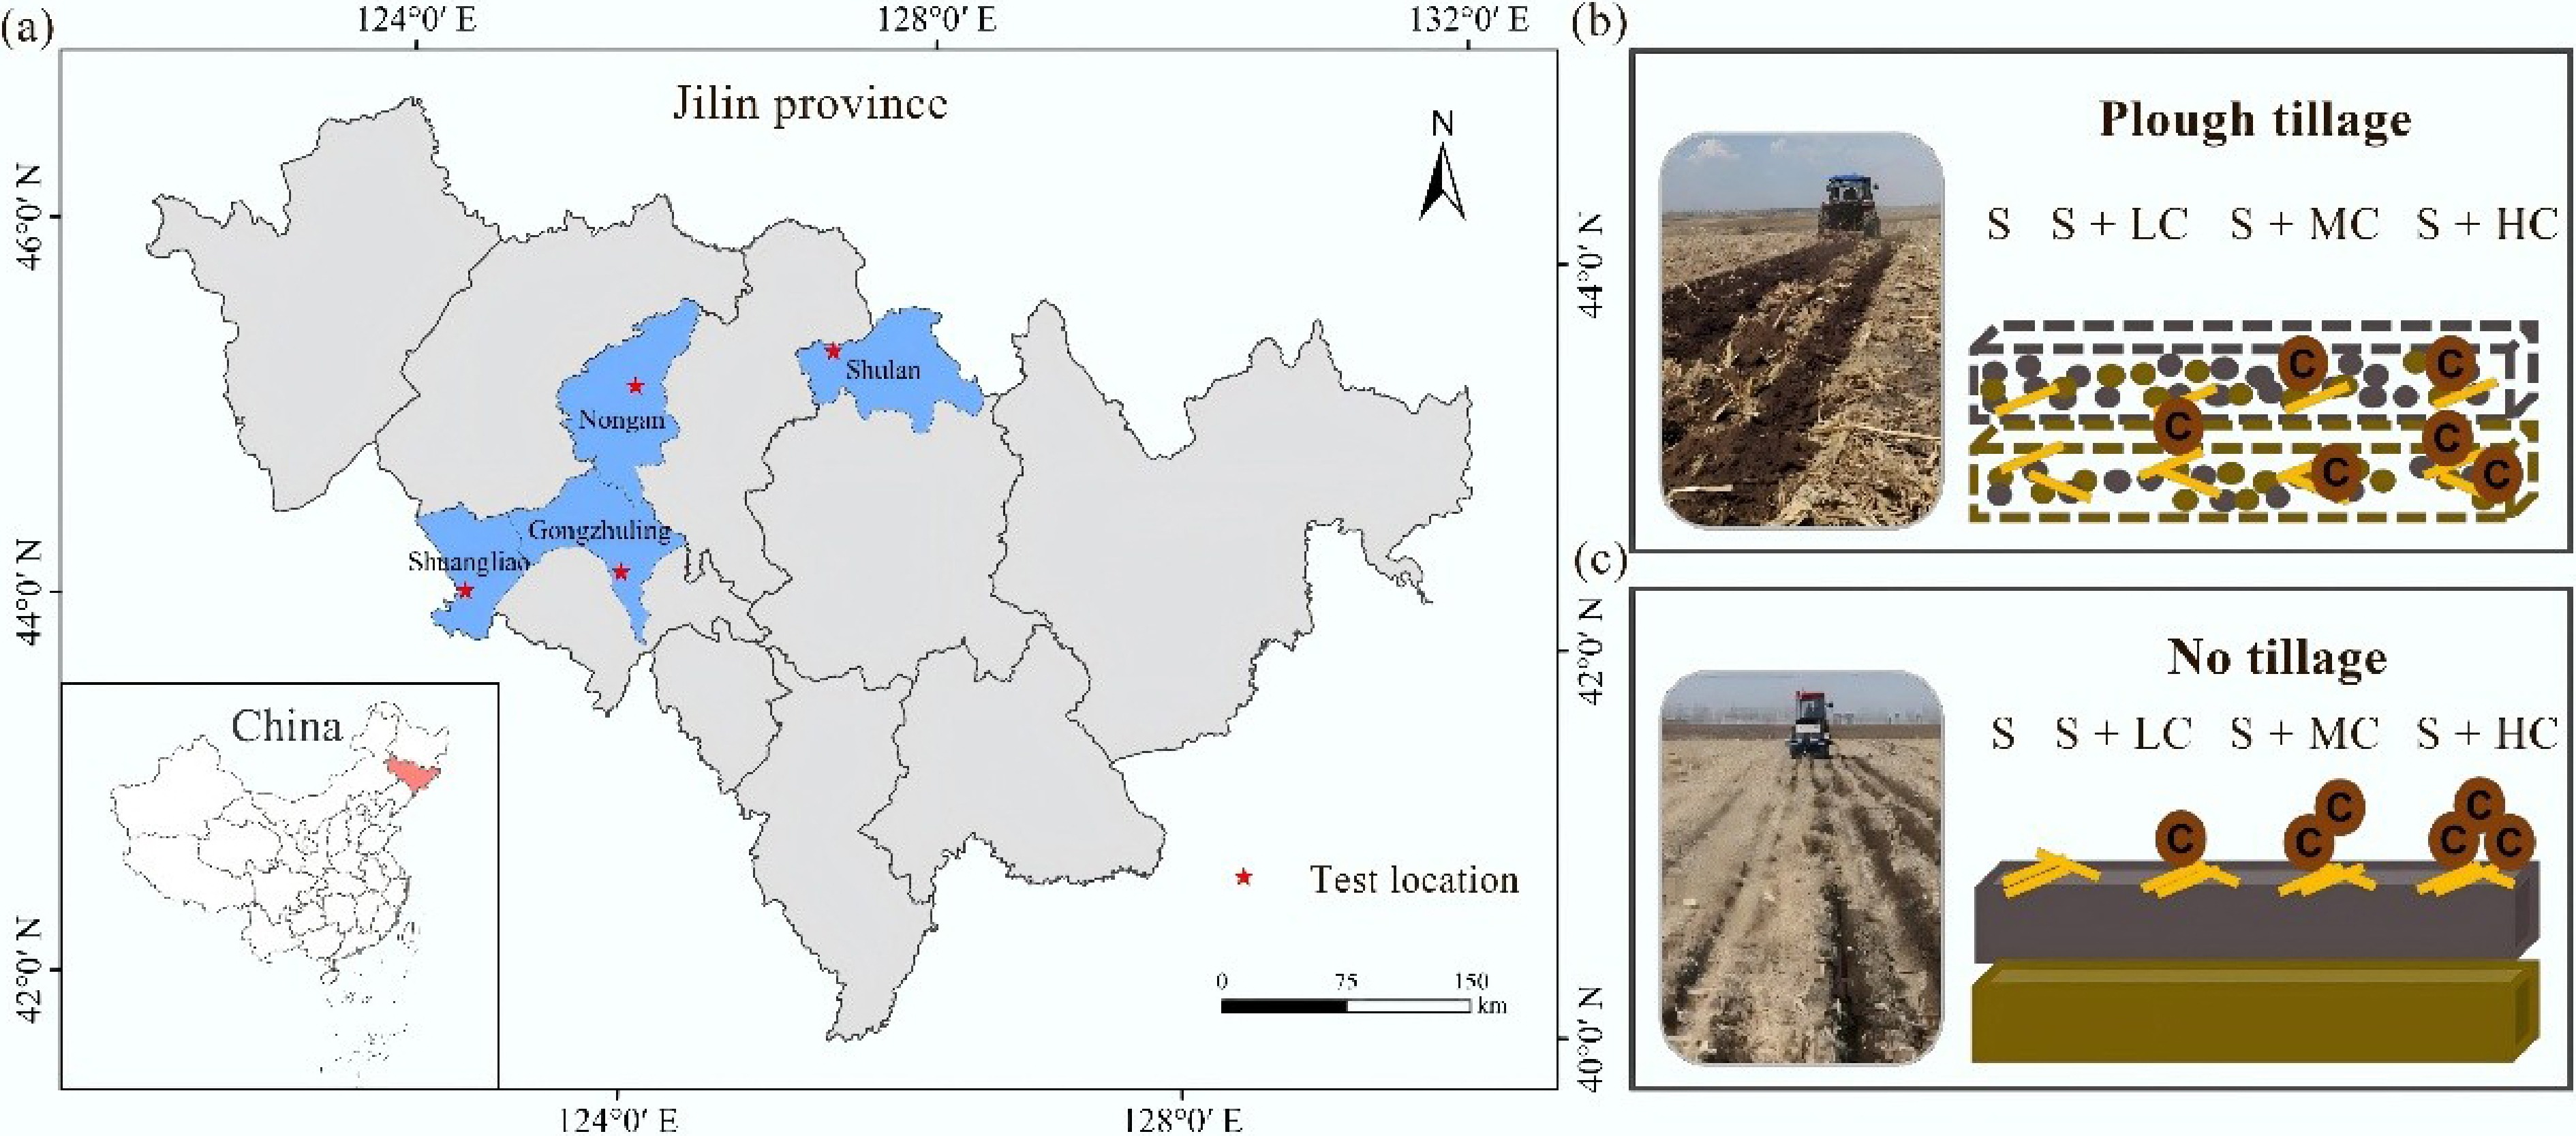
Figure 1.
(a) The experimental area's location. Chart of carbon inputs in different soil layers under (b) plough tillage and (c) no tillage.
-
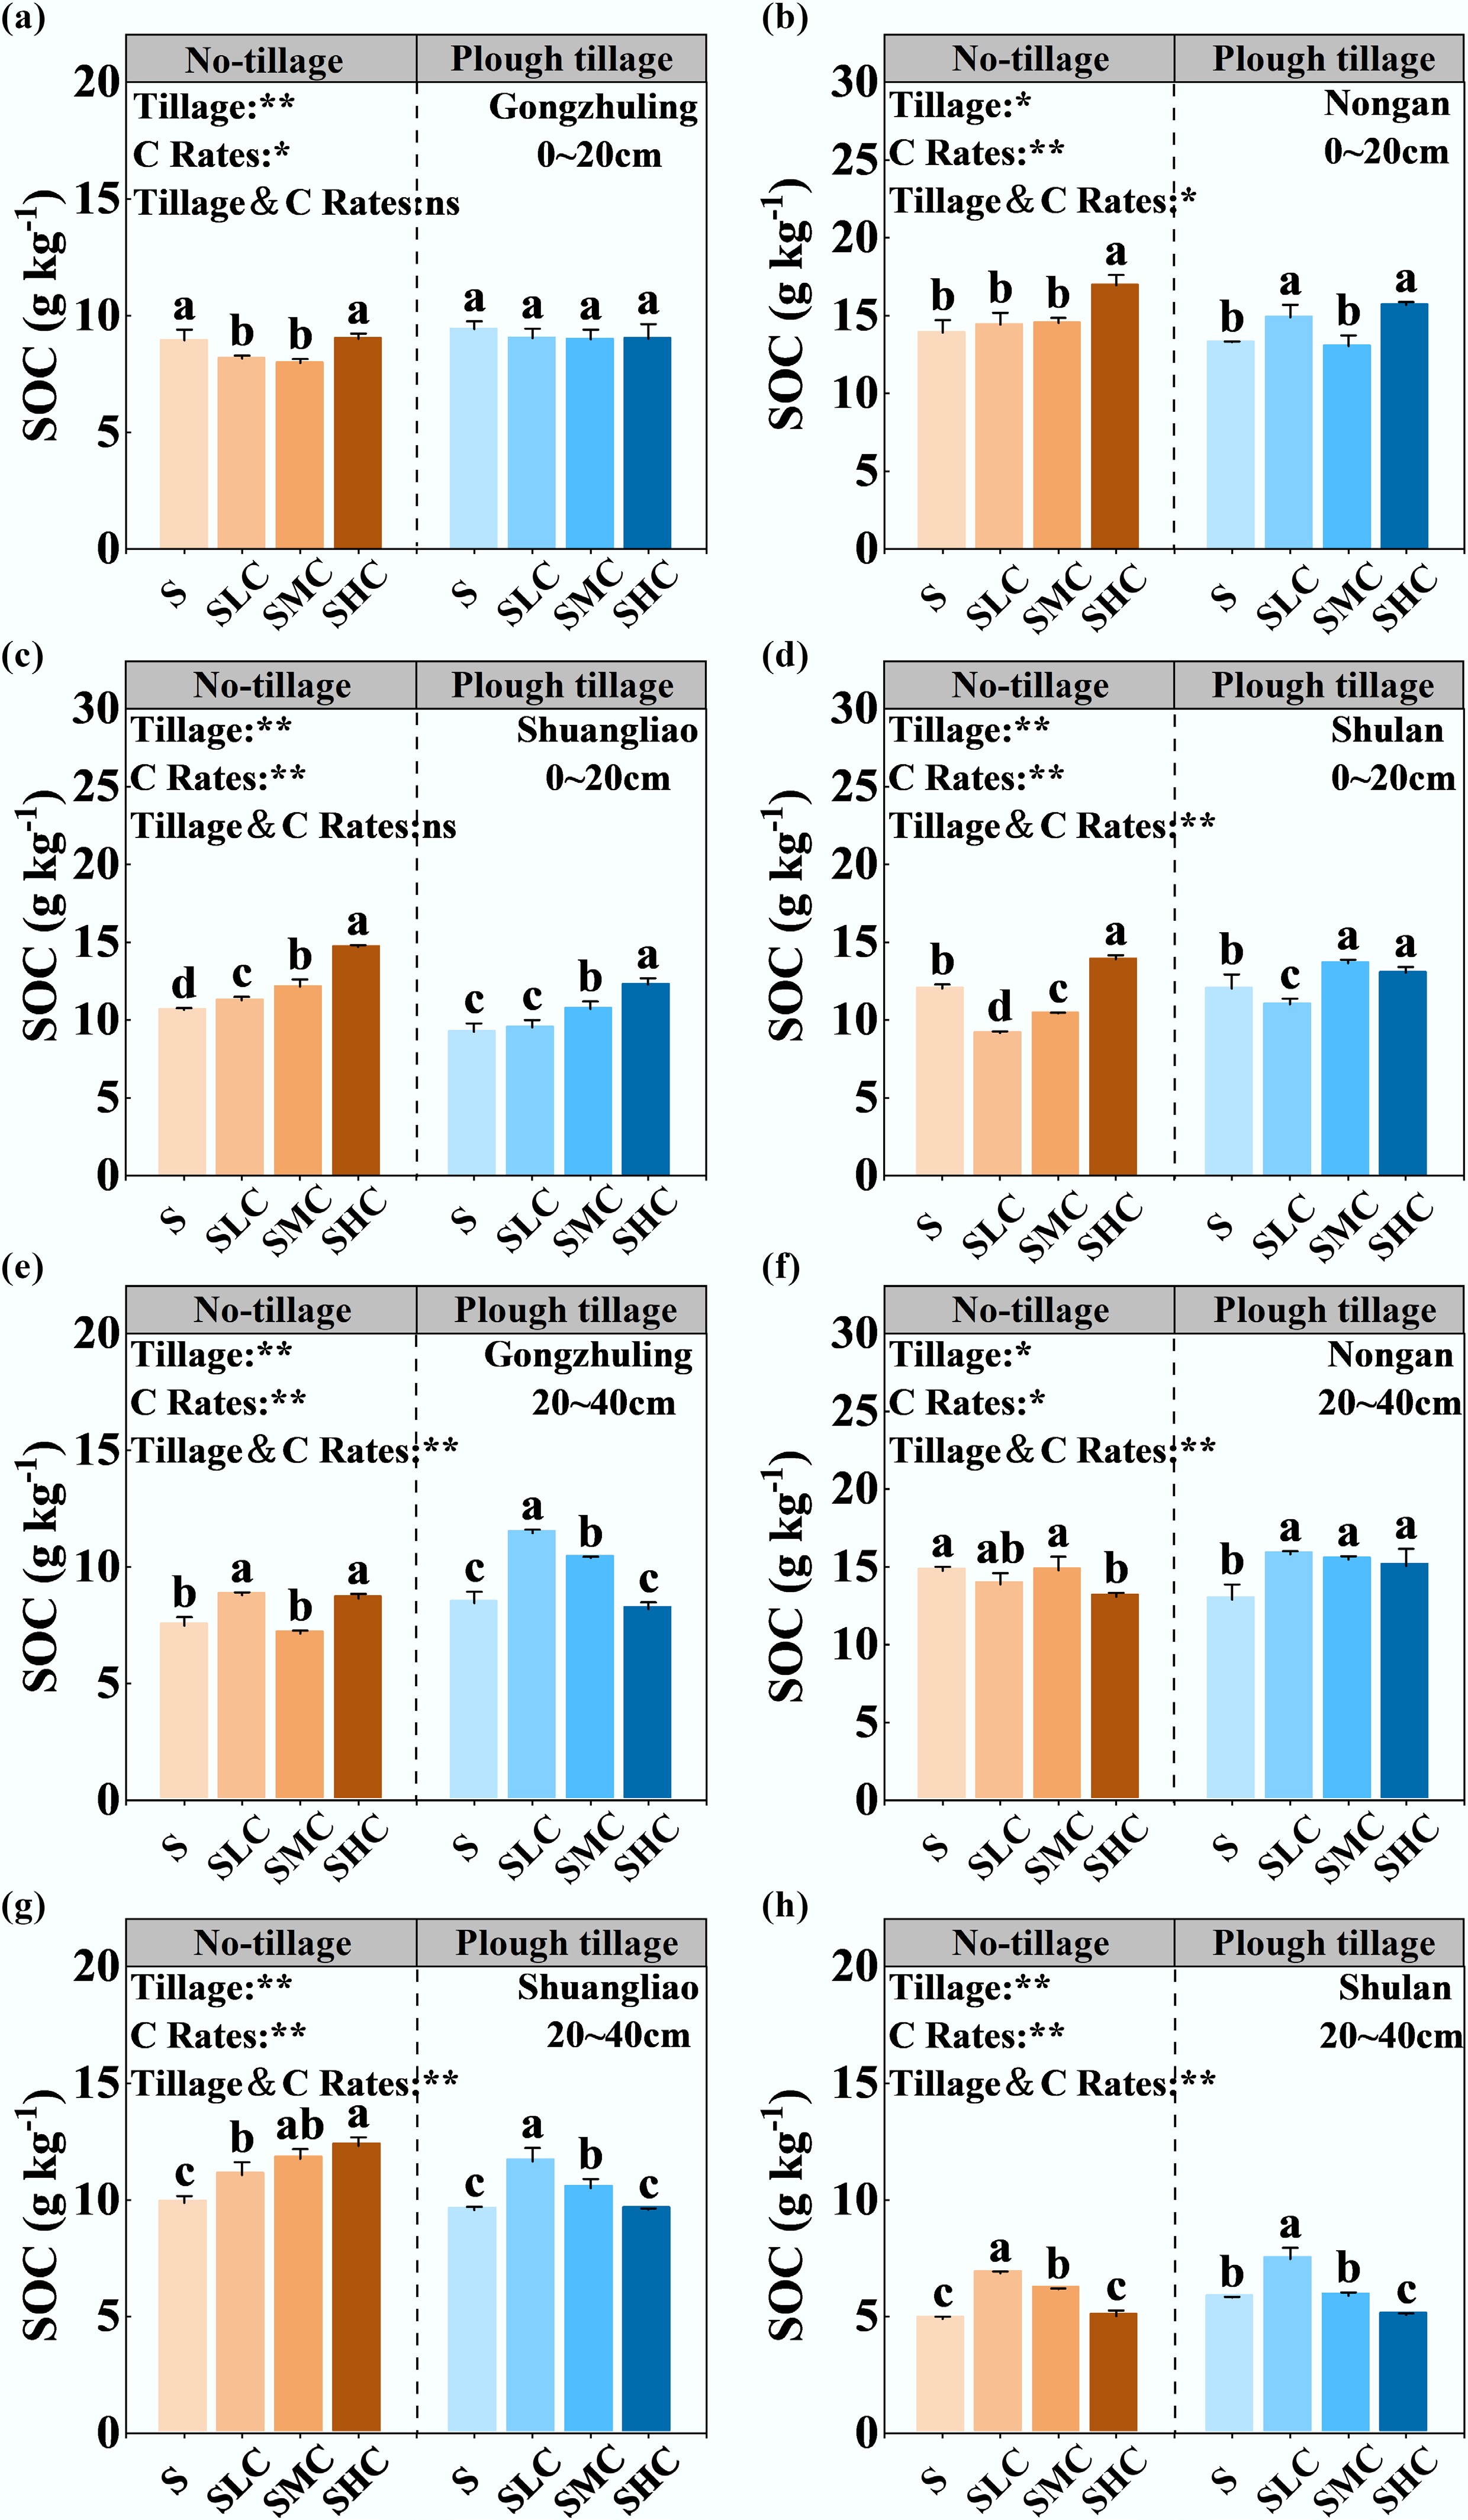
Figure 2.
SOC content as affected by tillage and carbon input. SOC content of topsoil in (a) Gongzhuling, (b) Nongan, (c) Shuangliao, and (d) Shulan. SOC content of subsoil in (e) Gongzhuling, (f) Nongan, (g) Shuangliao, and (h) Shulan. Bars (mean ± standard deviation [SD], n = 3). Bars with different lowercase letters are significantly different among different treatments (p < 0.05). The main and the interactive effects of tillage (Tillage) and carbon input rate (C Rates) are shown: **, p < 0.01; *, p < 0.05; ns, not significant at p > 0.05.
-
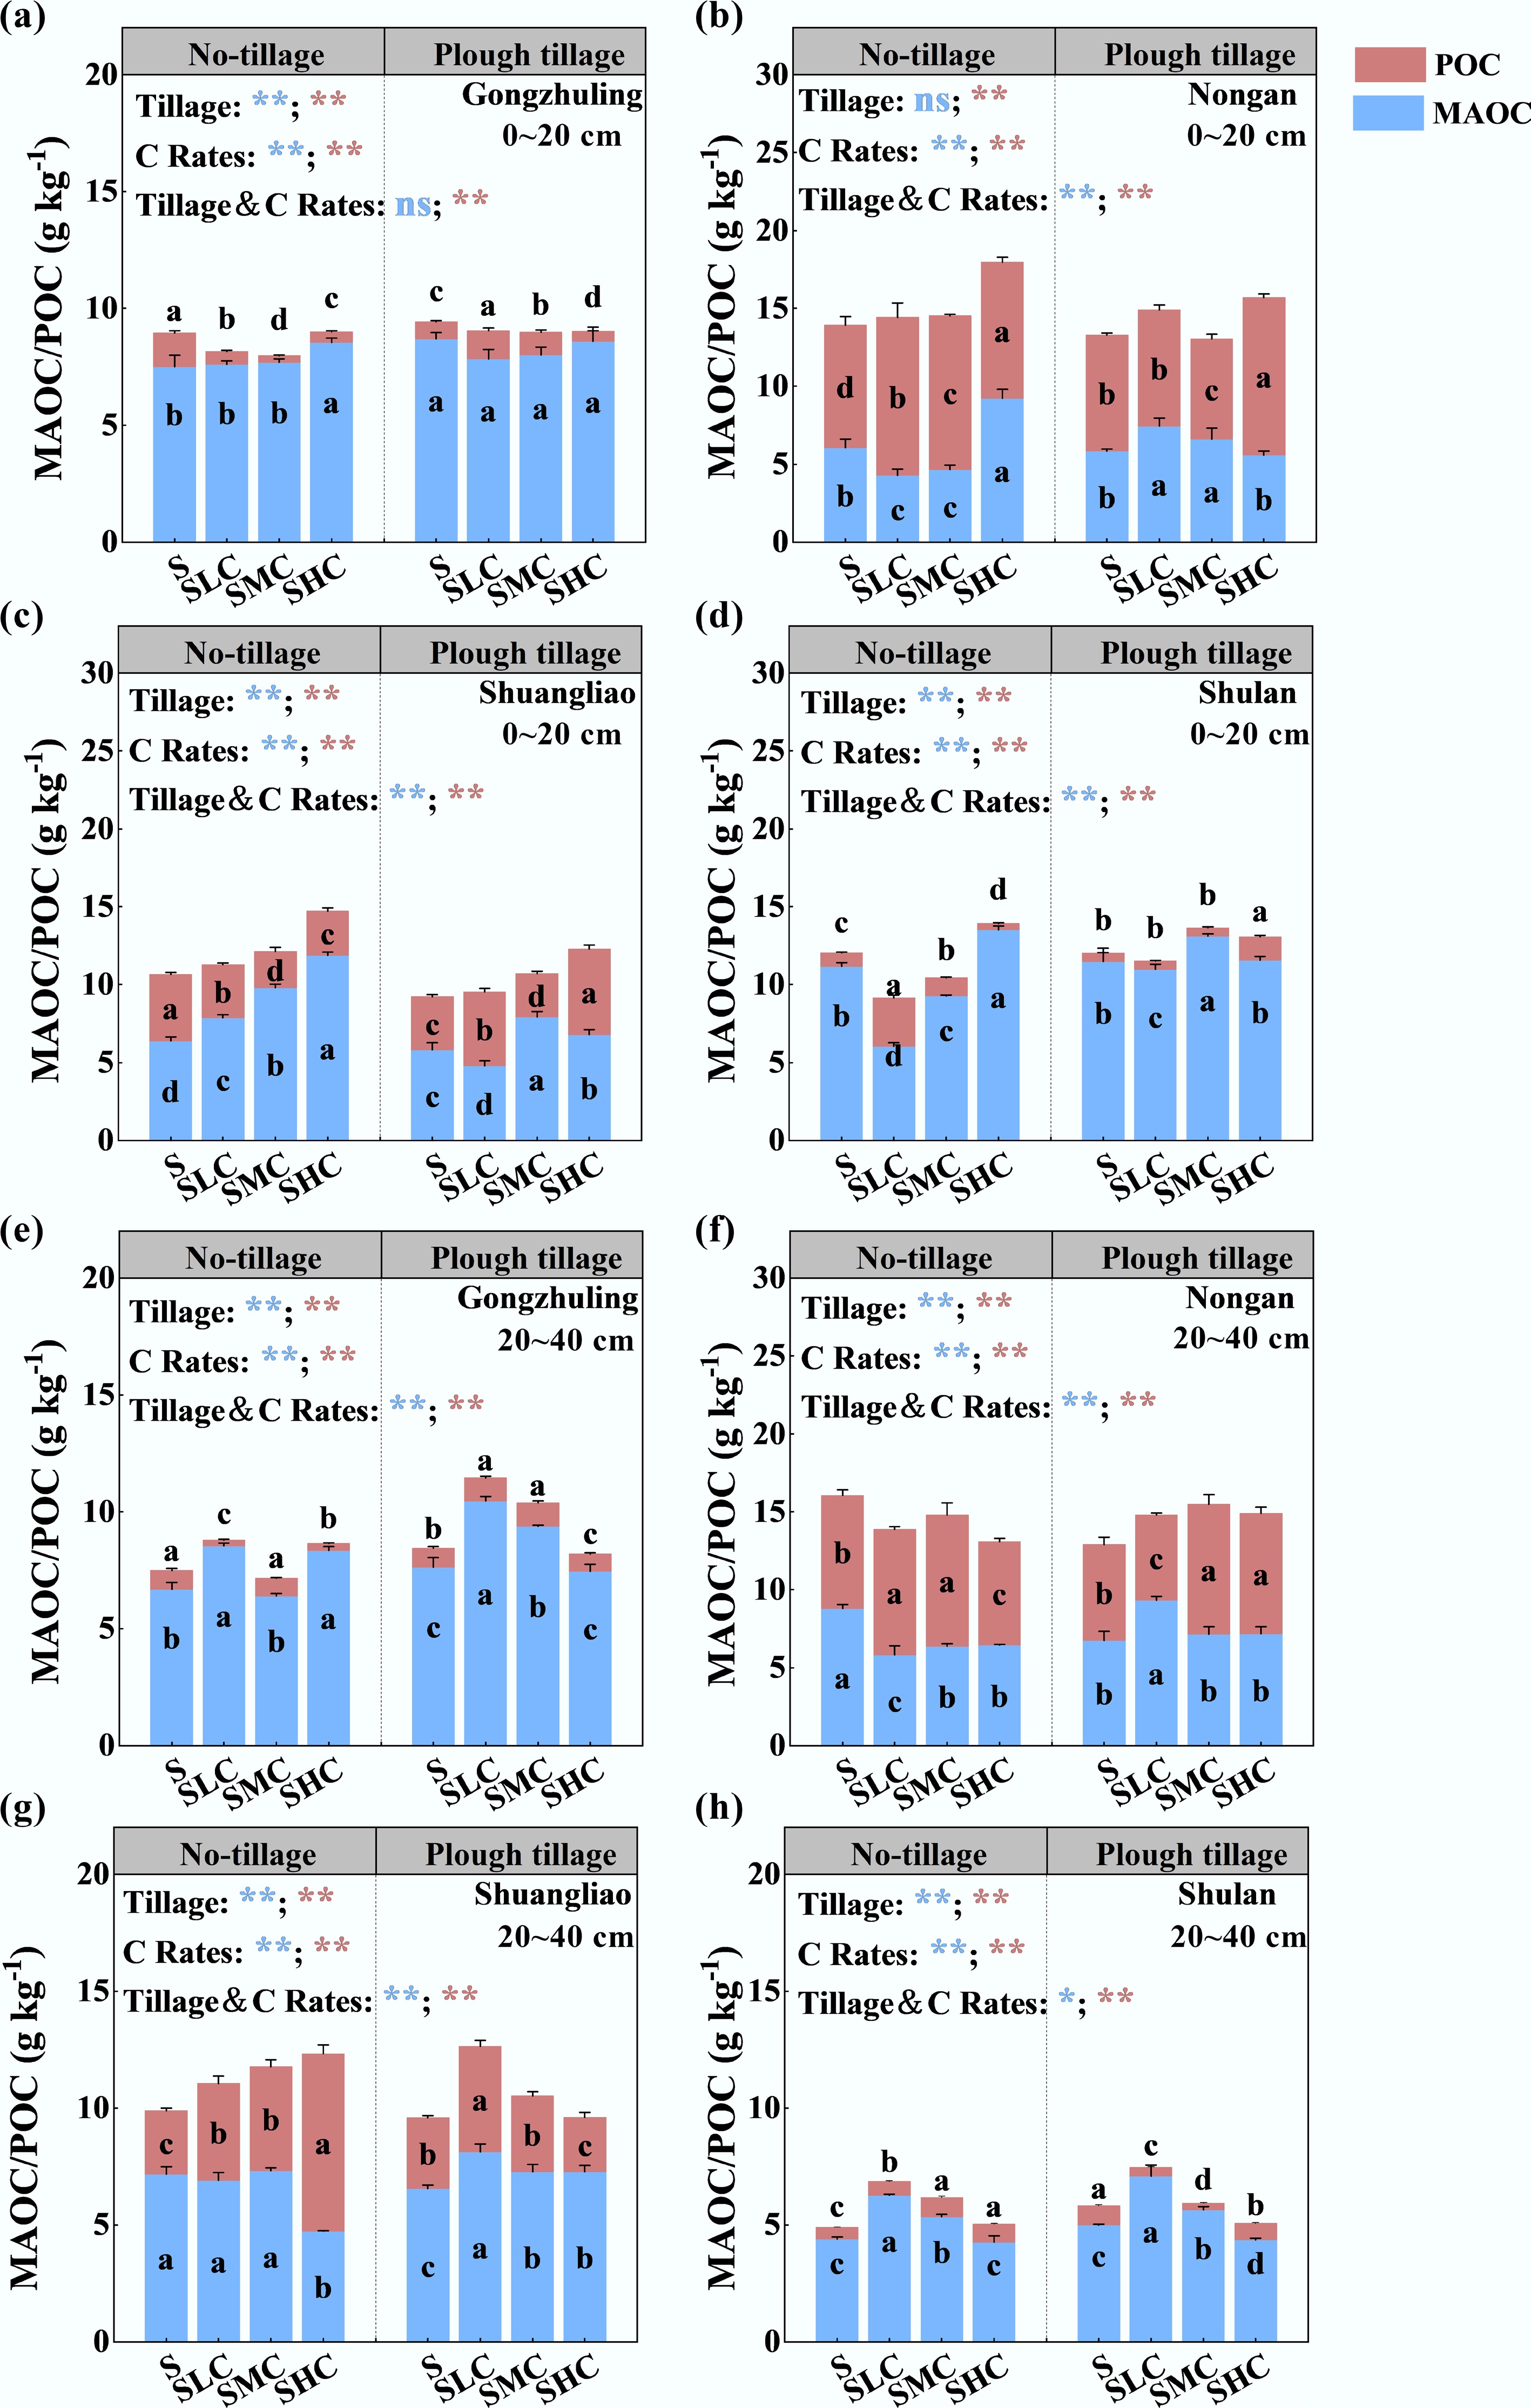
Figure 3.
Effects of different tillage and carbon inputs on the distribution of POC and MAOC in the soil. The content of POC and MAOC in the topsoil of (a) Gongzhuling, (b) Nongan, (c) Shuangliao, and (d) Shulan. The content of POC and MAOC in the subsoil of (e) Gongzhuling, (f) Nongan, (g) Shuangliao, and (h) Shulan. The lowercase letters in the blue and red columns represent the differences between treatments (p < 0.05, n = 3), and the line segments on the column represent the standard deviations of POC and MAOC. The main and interactive effects of tillage (Tillage) and the carbon input rate (C Rates) are shown separately for MAOC (blue) and POC (red): **, p < 0.01; *, p < 0.05; ns, not significant at p > 0.05.
-
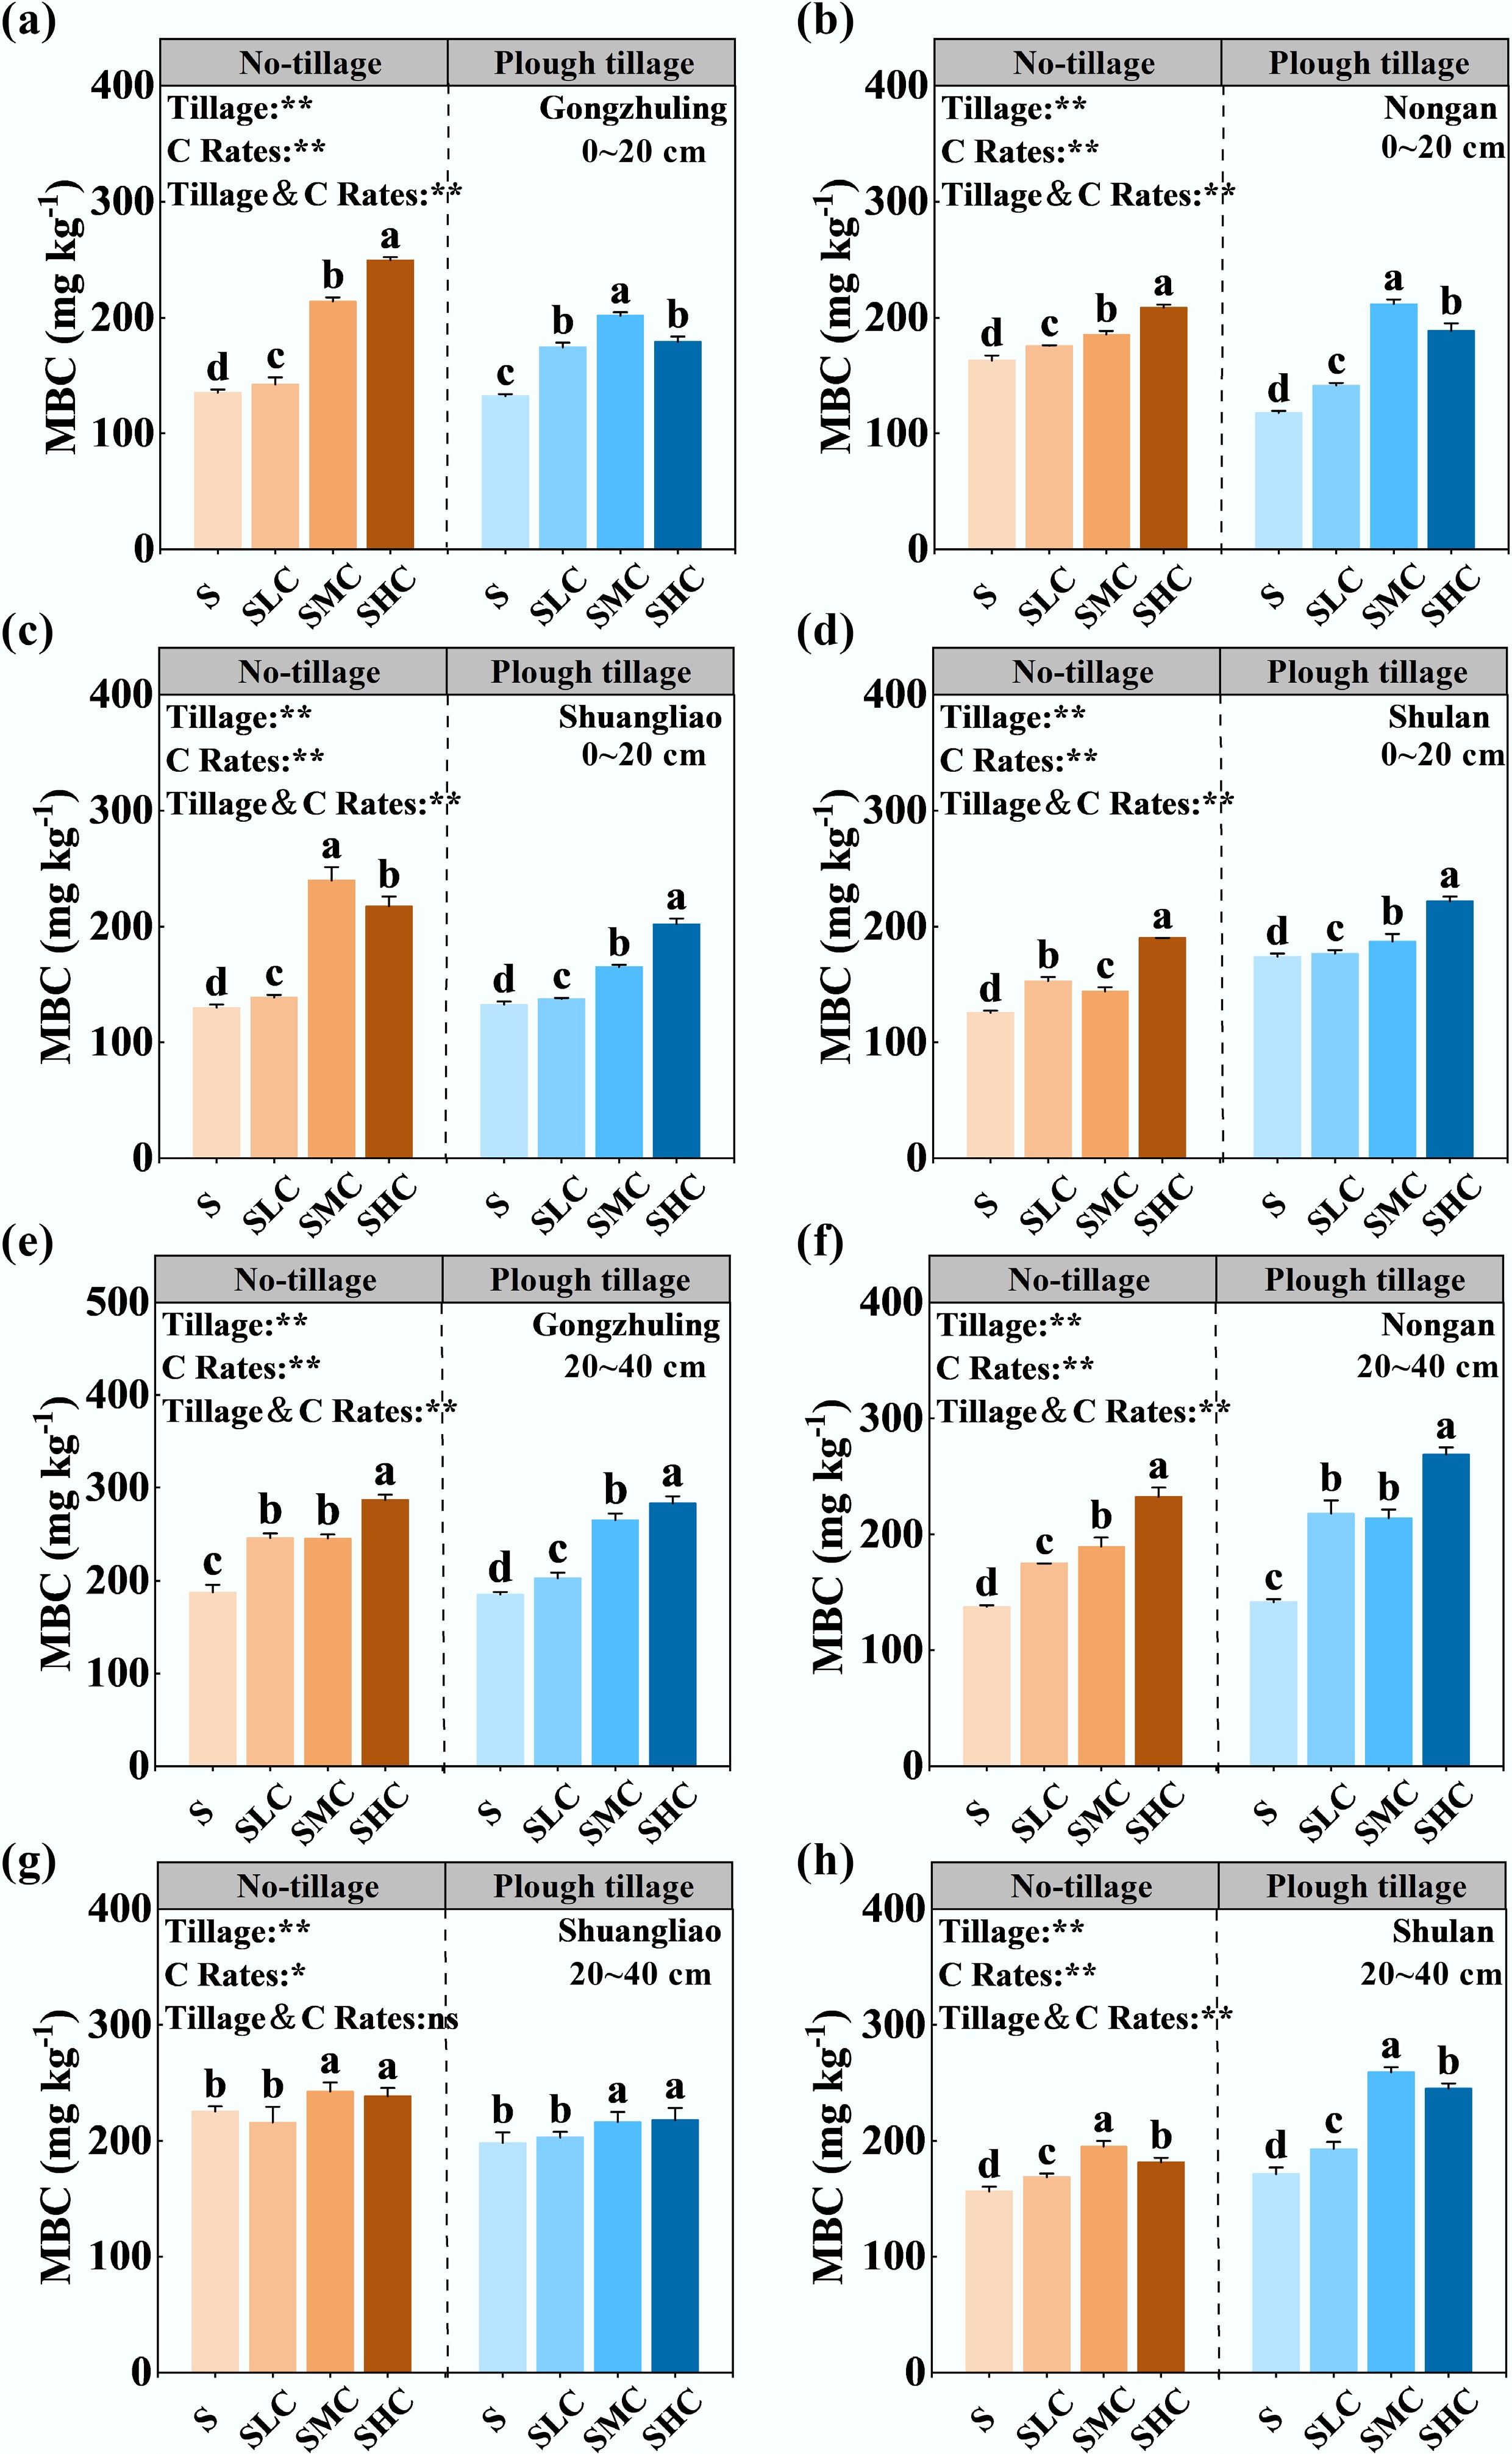
Figure 4.
Effects of tillage and carbon input on MBC. The MBC content of topsoil in (a) Gongzhuling, (b) Nongan, (c) Shuangliao, and (d) Shulan. MBC content of subsoil in (e) Gongzhuling, (f) Nongan, (g) Shuangliao, and (h) Shulan. Bars (mean ± SD, n = 3) with different lowercase letters are significantly differentamong treatments (p < 0.05). The main and interactive effects of tillage (Tillage) and carbon input rate (C Rates) are shown: **, p < 0.01; *, p < 0.05; ns, not significant at p > 0.05.
-
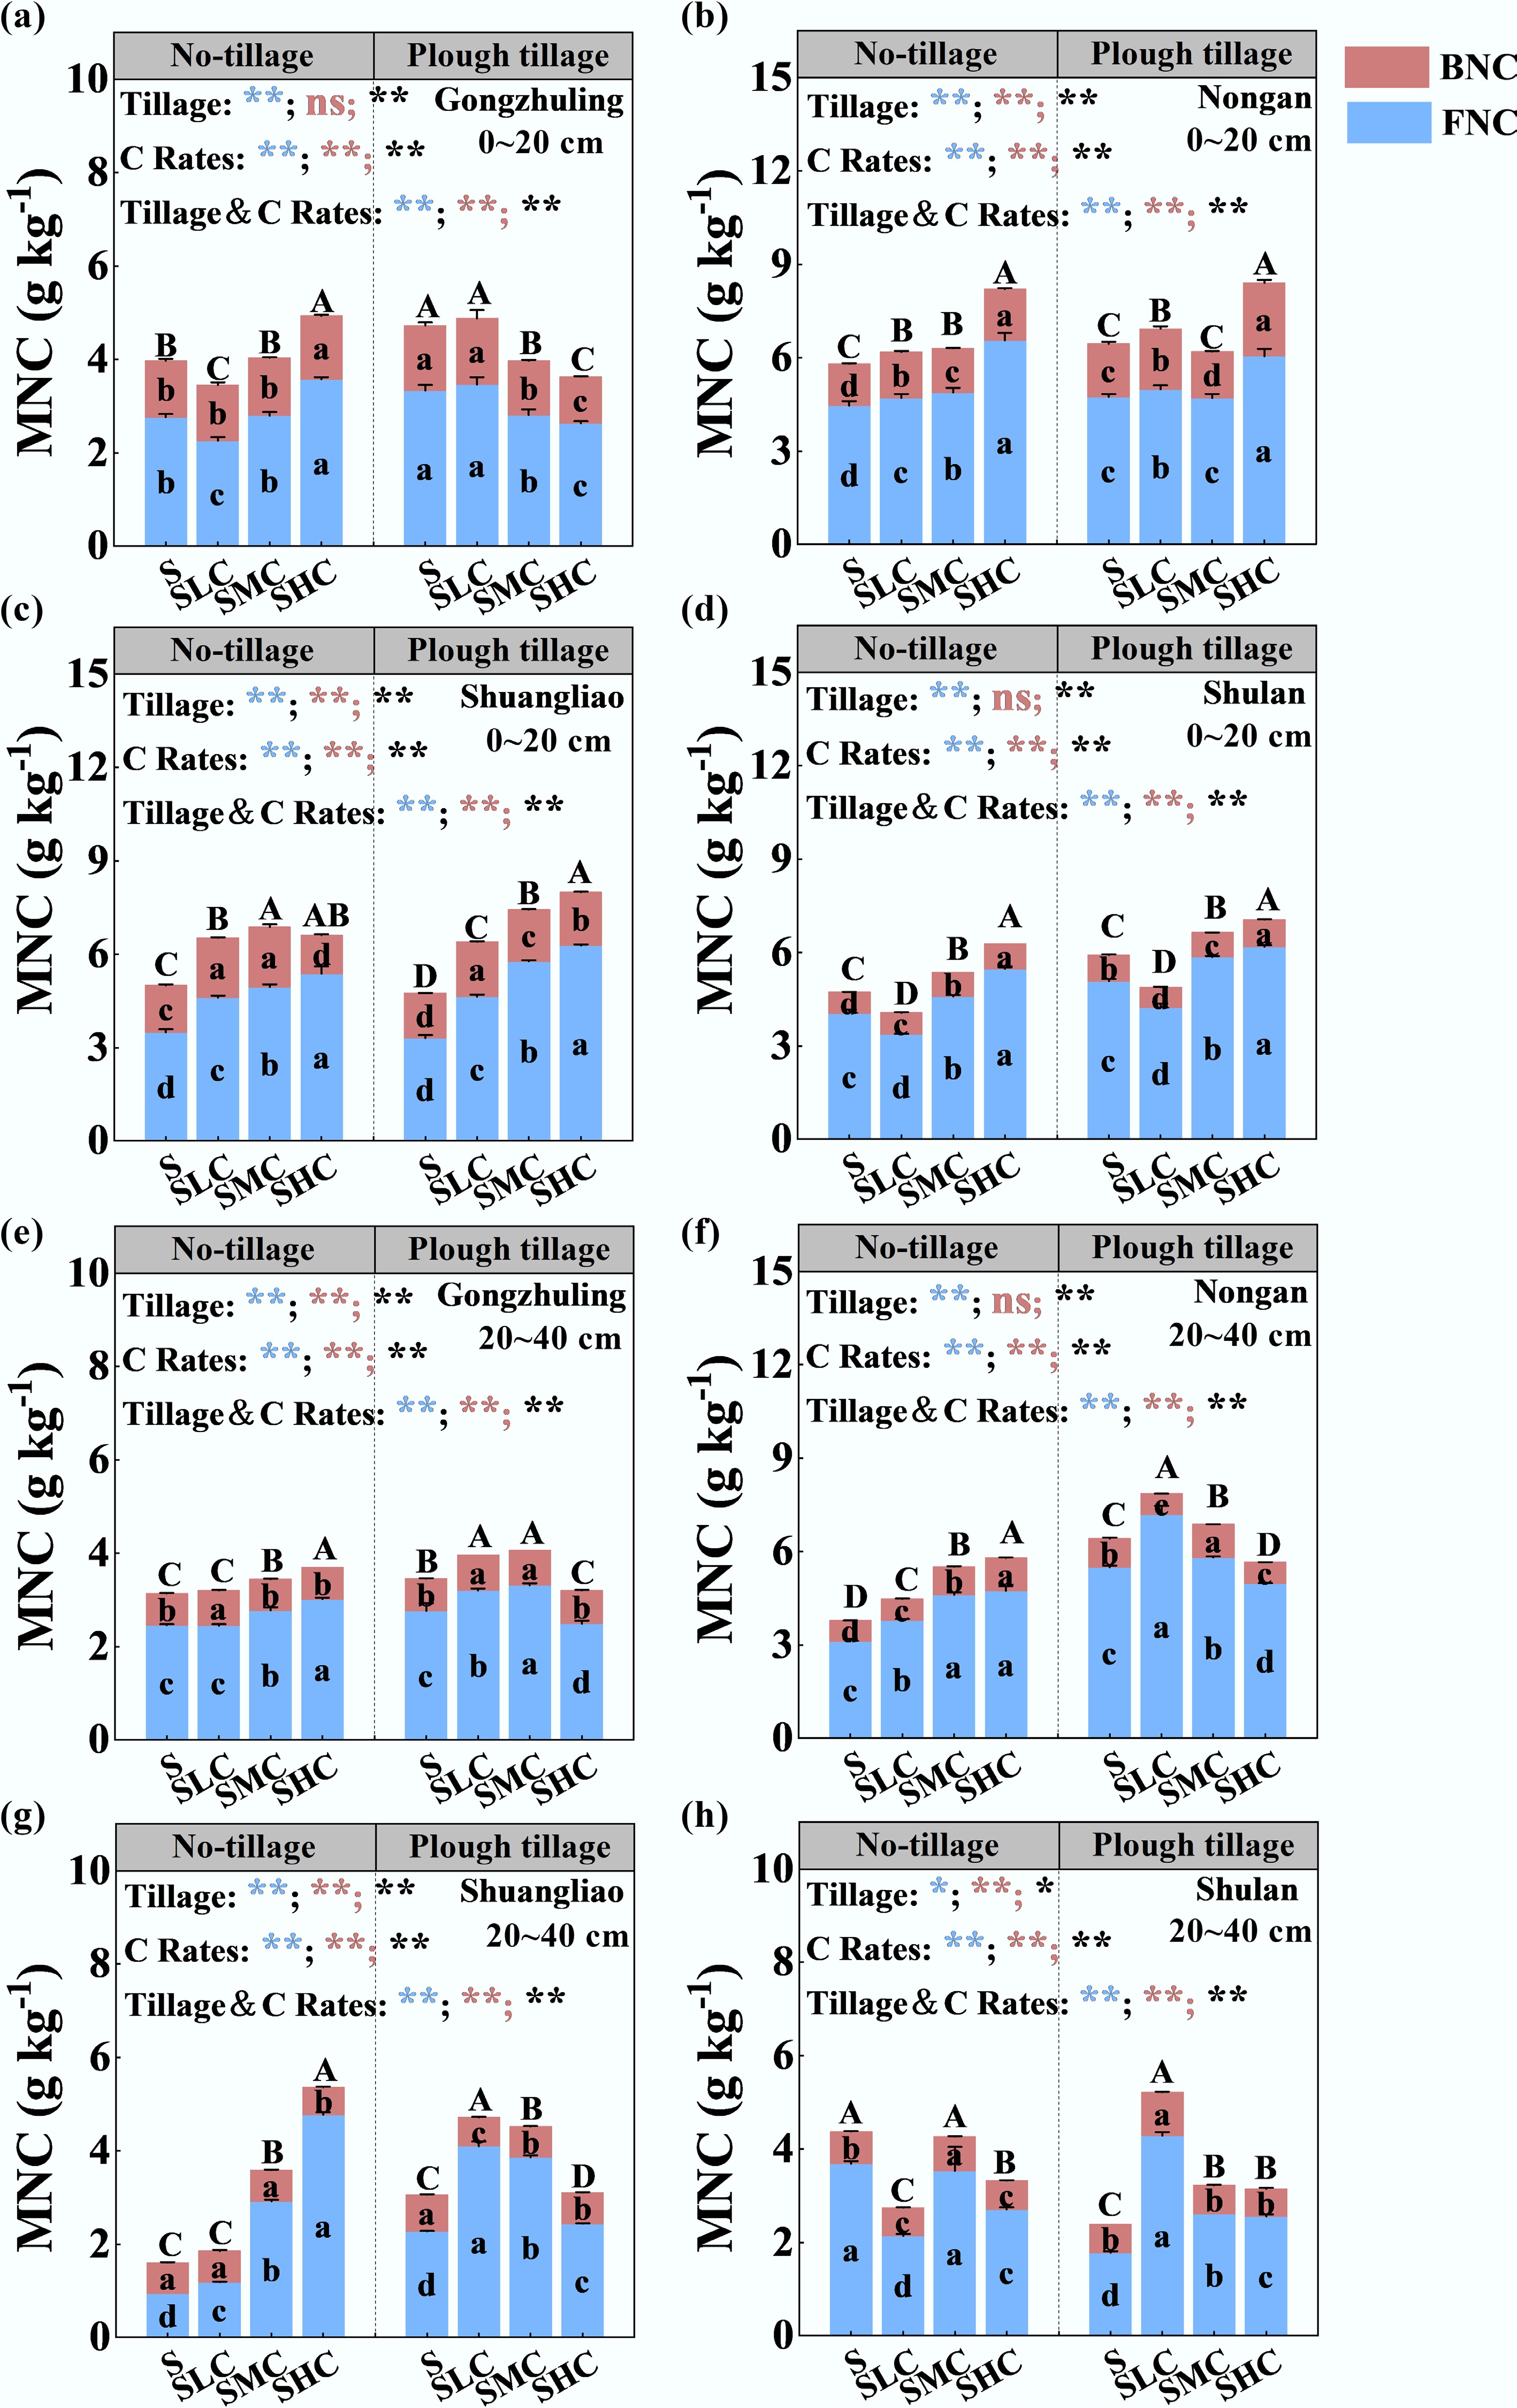
Figure 5.
Contents of BNC, FNC, and MNC under different tillage treatments and C rates. The MNC content of topsoil in (a) Gongzhuling, (b) Nongan, (c) Shuangliao, and (d) Shulan. MNC content of subsoil in (e) Gongzhuling, (f) Nongan, (g) Shuangliao, and (h) Shulan. For each necromass carbon type, bars (mean ± SD, n = 3) with different lowercase letters are significantly different among treatments (p < 0.05). Letters for FNC, BNC, and MNC are colored blue, red, and black, respectively. The main and interactive effects of tillage (Tillage) and carbon input rate (C Rates) are shown separately for FNC, BNC, and MNC: **, p < 0.01; *, p < 0.05; ns, not significant at p > 0.05.
-
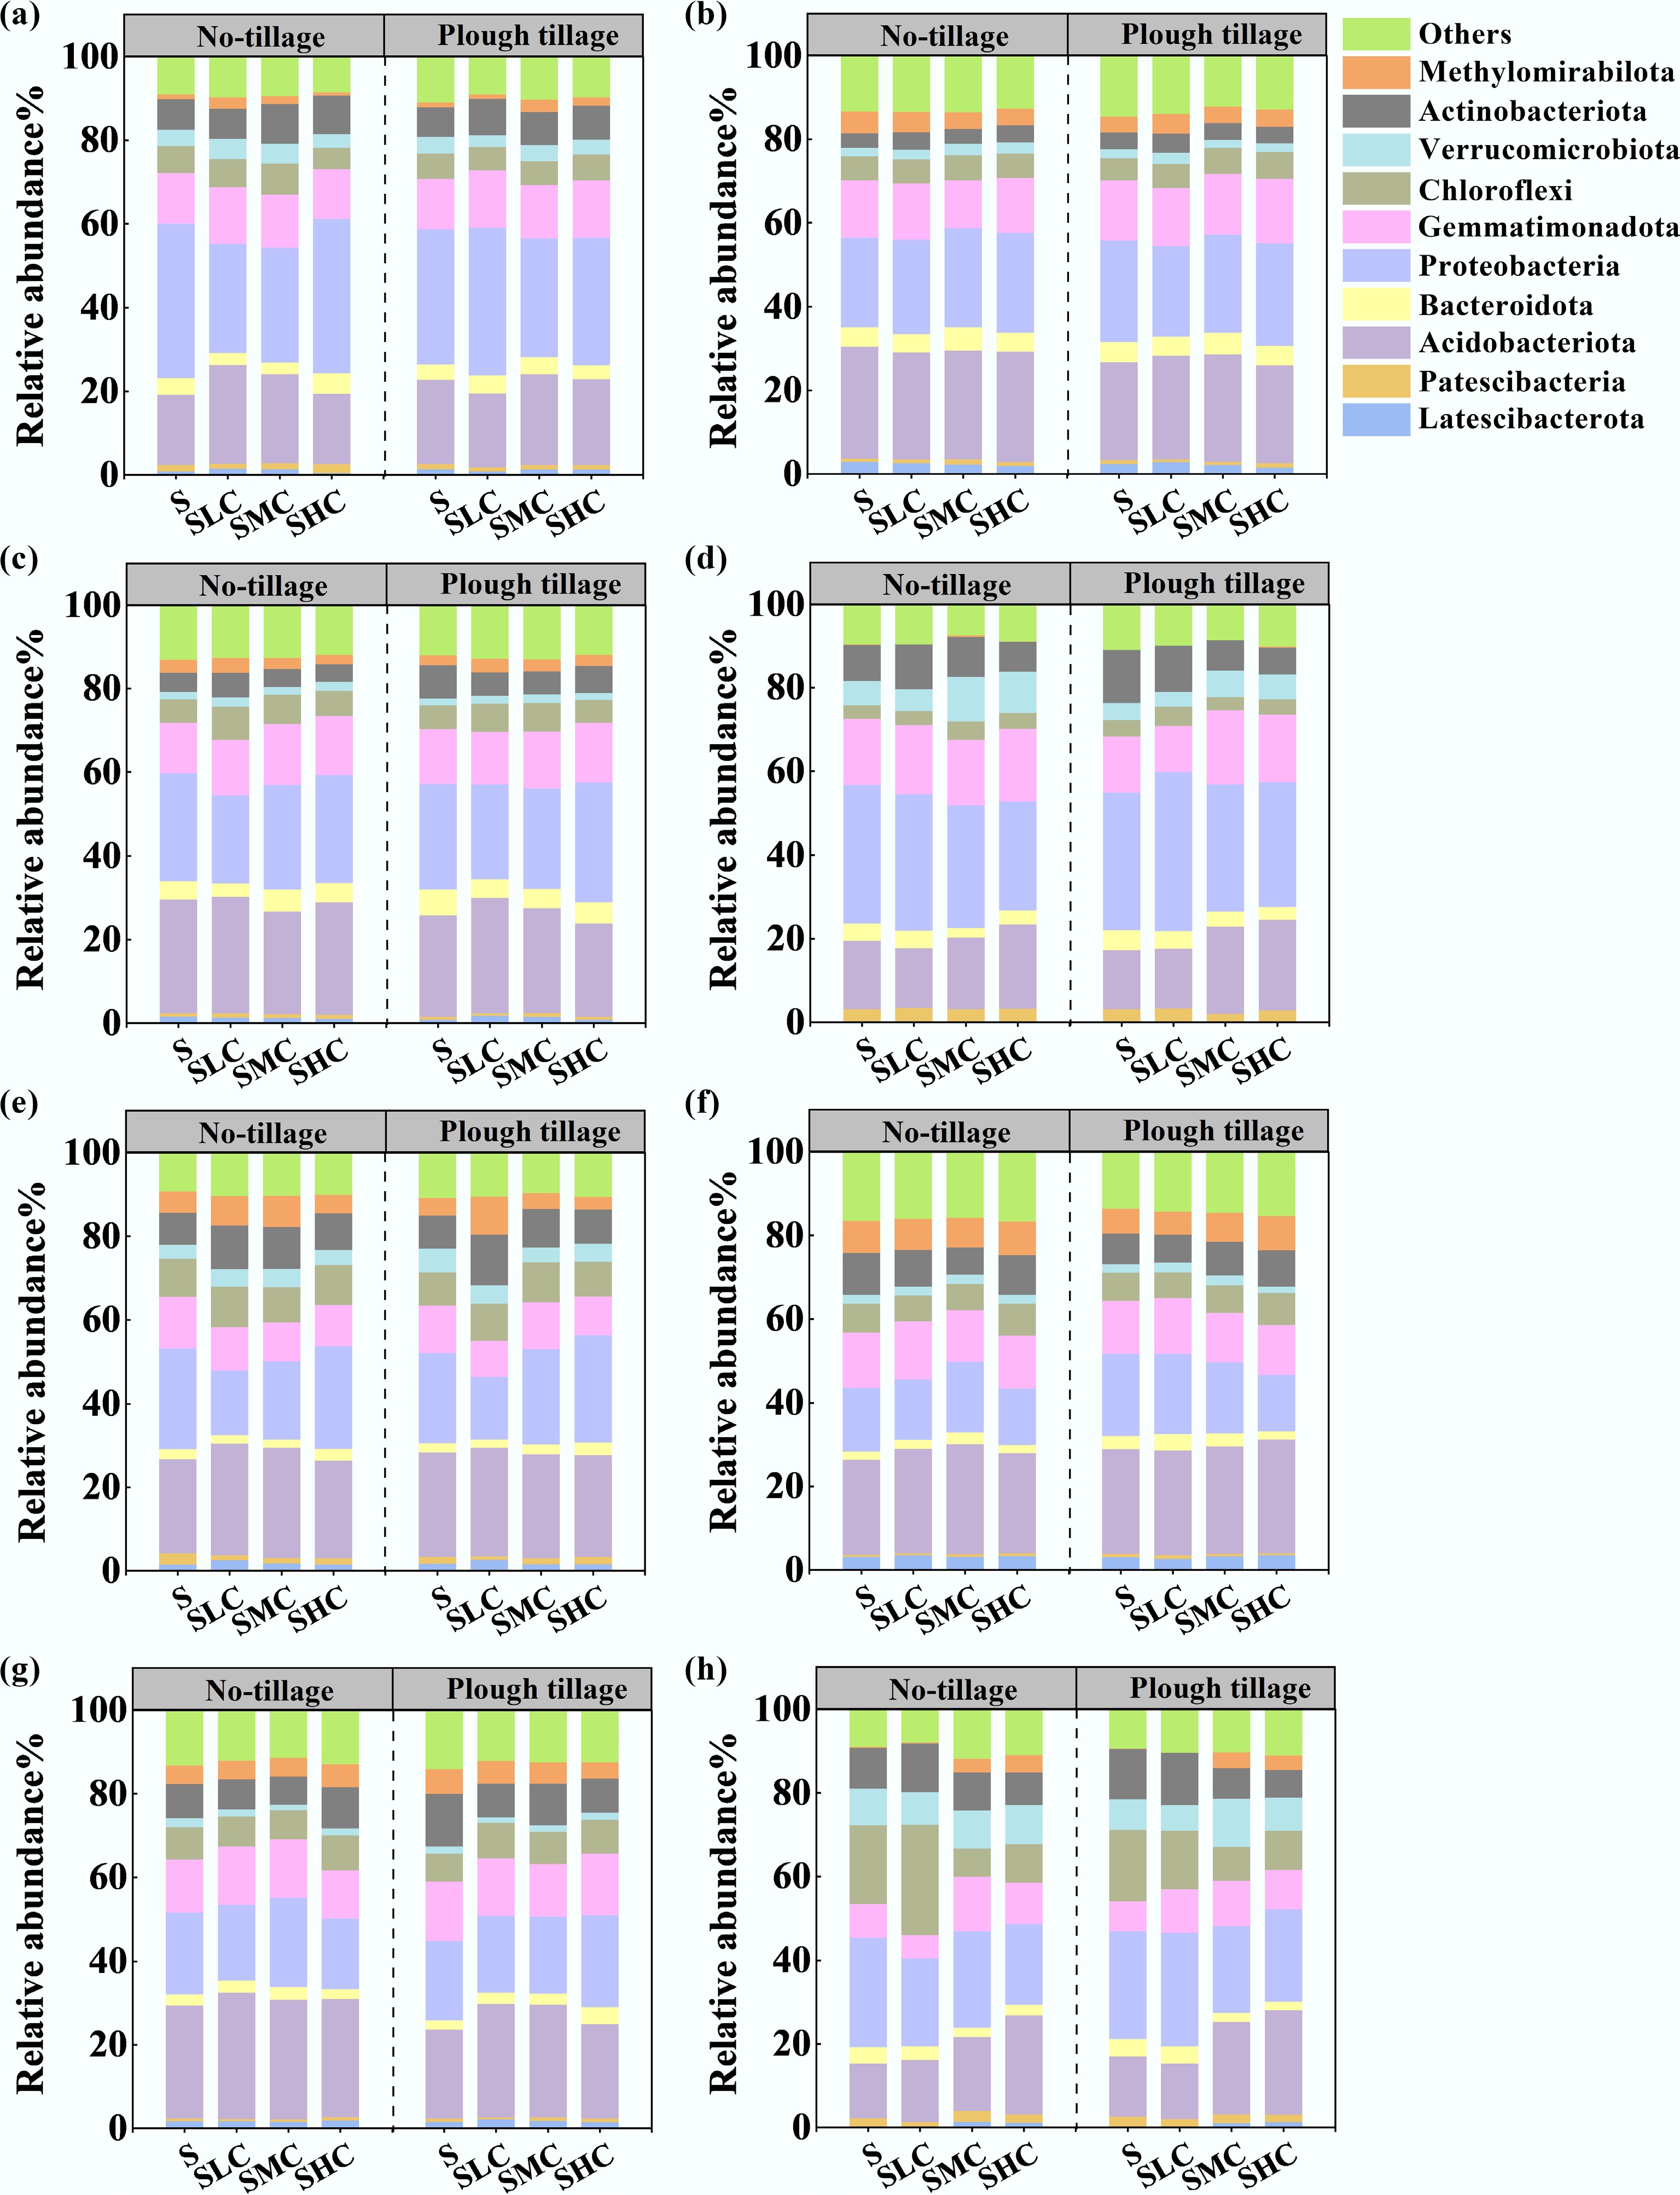
Figure 6.
Relative abundance of bacterial community composition in (a)–(d) the topsoil and (e)–(h) subsoil across the four experimental sites: (a), (e) Gongzuling, (b), (f) Nonggang, (c), (g) Shuangliao, and (d), (h) Shulan.
-
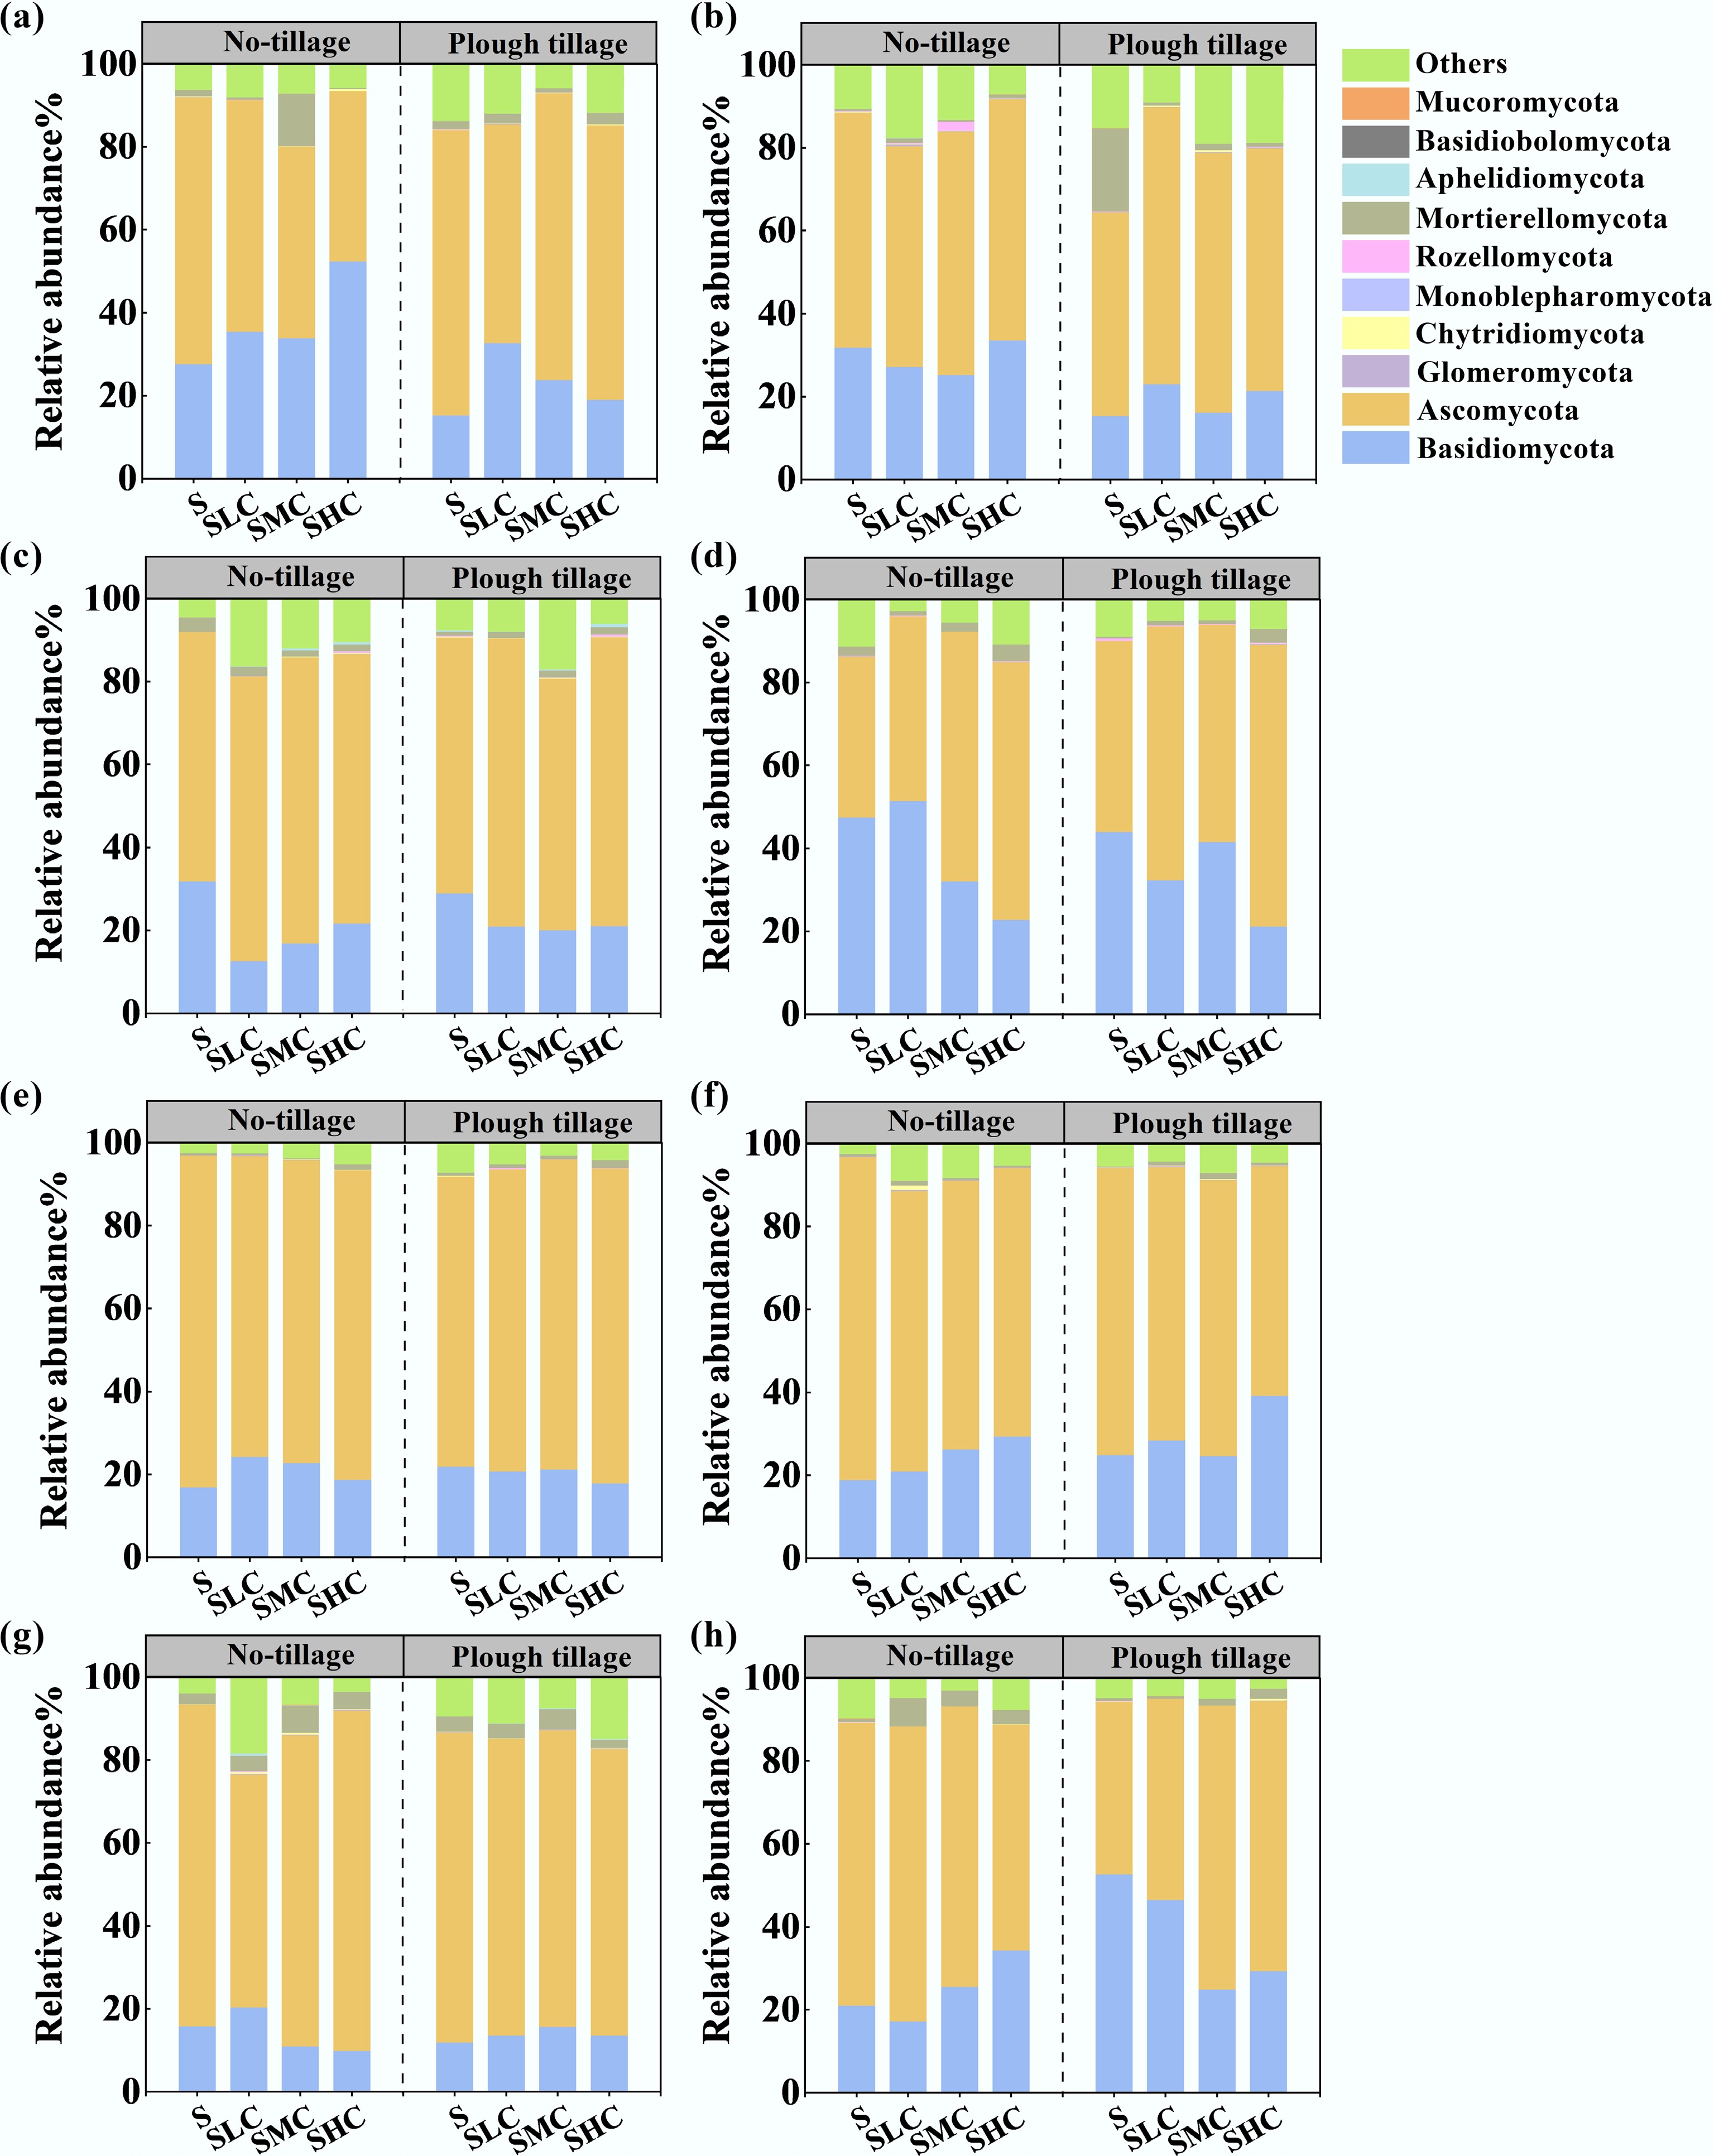
Figure 7.
Relative abundance of the fungal community composition in the (a)–(d) topsoil and (e)–(h) subsoil across the four experimental sites: (a), (e) Gongzuling, (b), (f) Nonggang, (c), (g) Shuangliao, and (d), (h) Shulan.
-
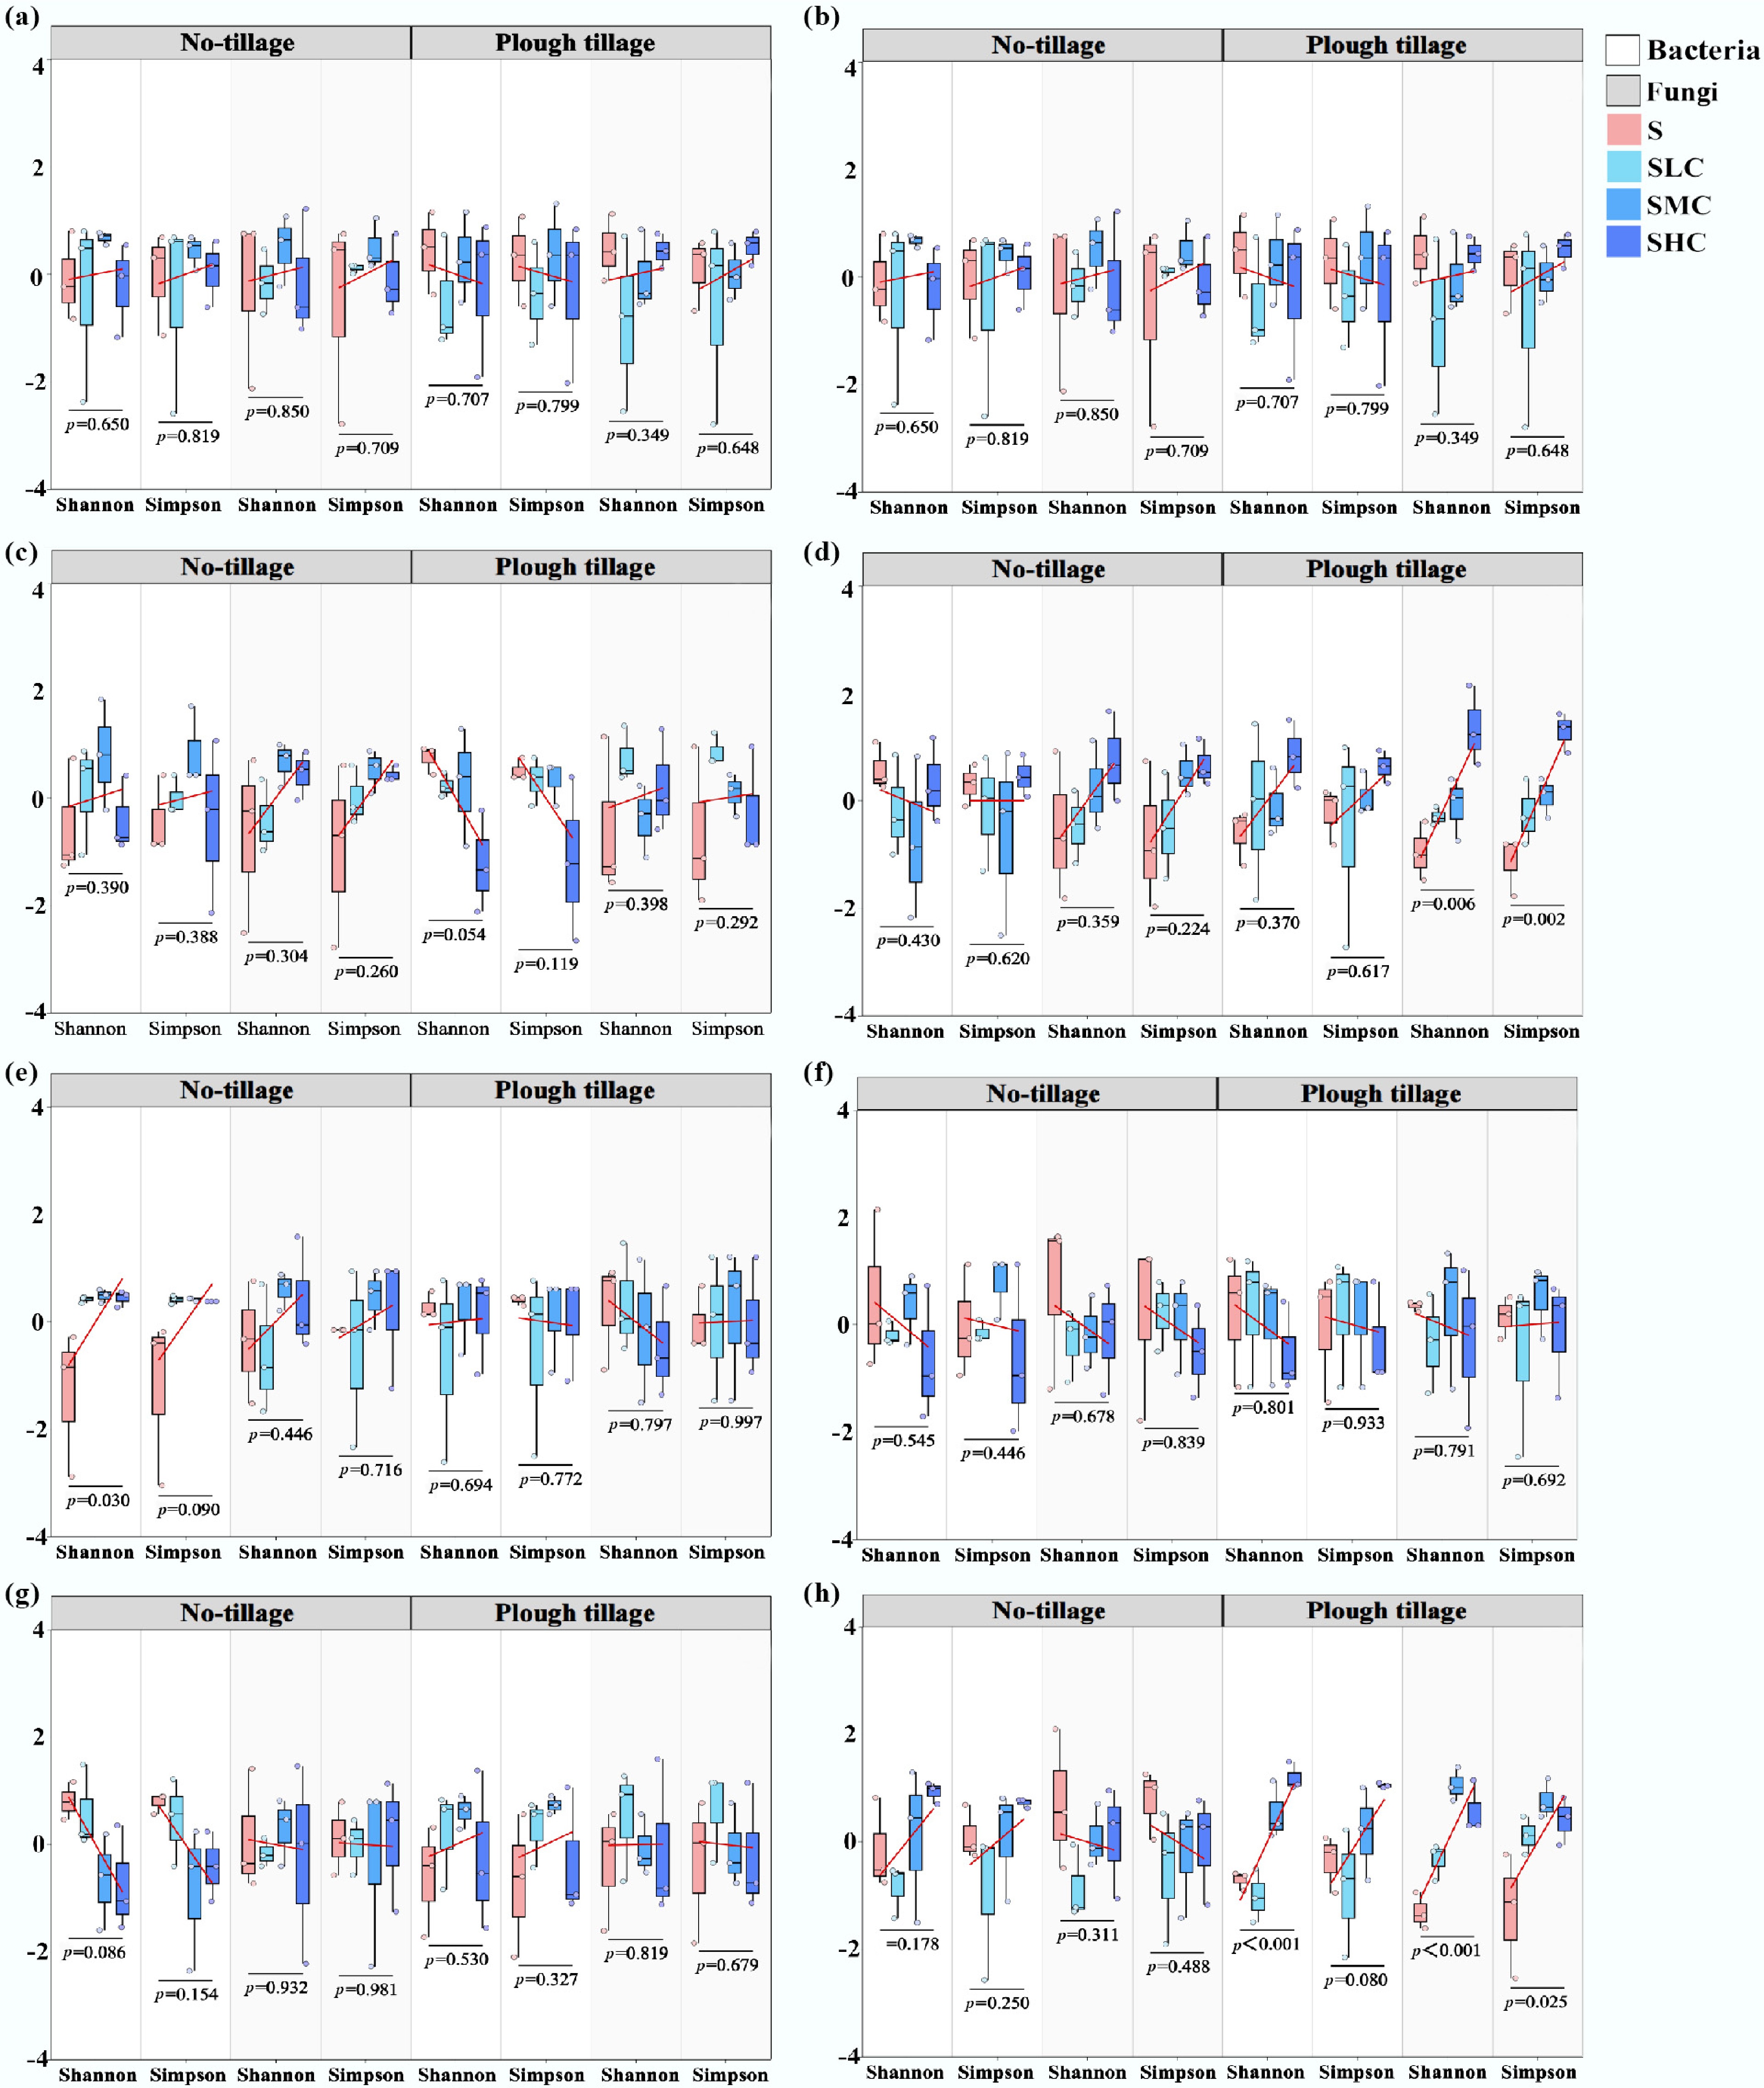
Figure 8.
The α diversity of bacterial and fungal communities in (a)–(d) the topsoil and (e)–(h) the subsoil across the four experimental sites: (a), (e) Gongzhuling, (b), (f) Nongan, (c), (g) Shuangliao, and (d), (h) Shulan. Data are normalized Z-scores. Red lines represent the trend lines obtained by linear fitting, and the associated p-values indicate the significance of the difference in fungal and bacterial α diversity between treatments.
-
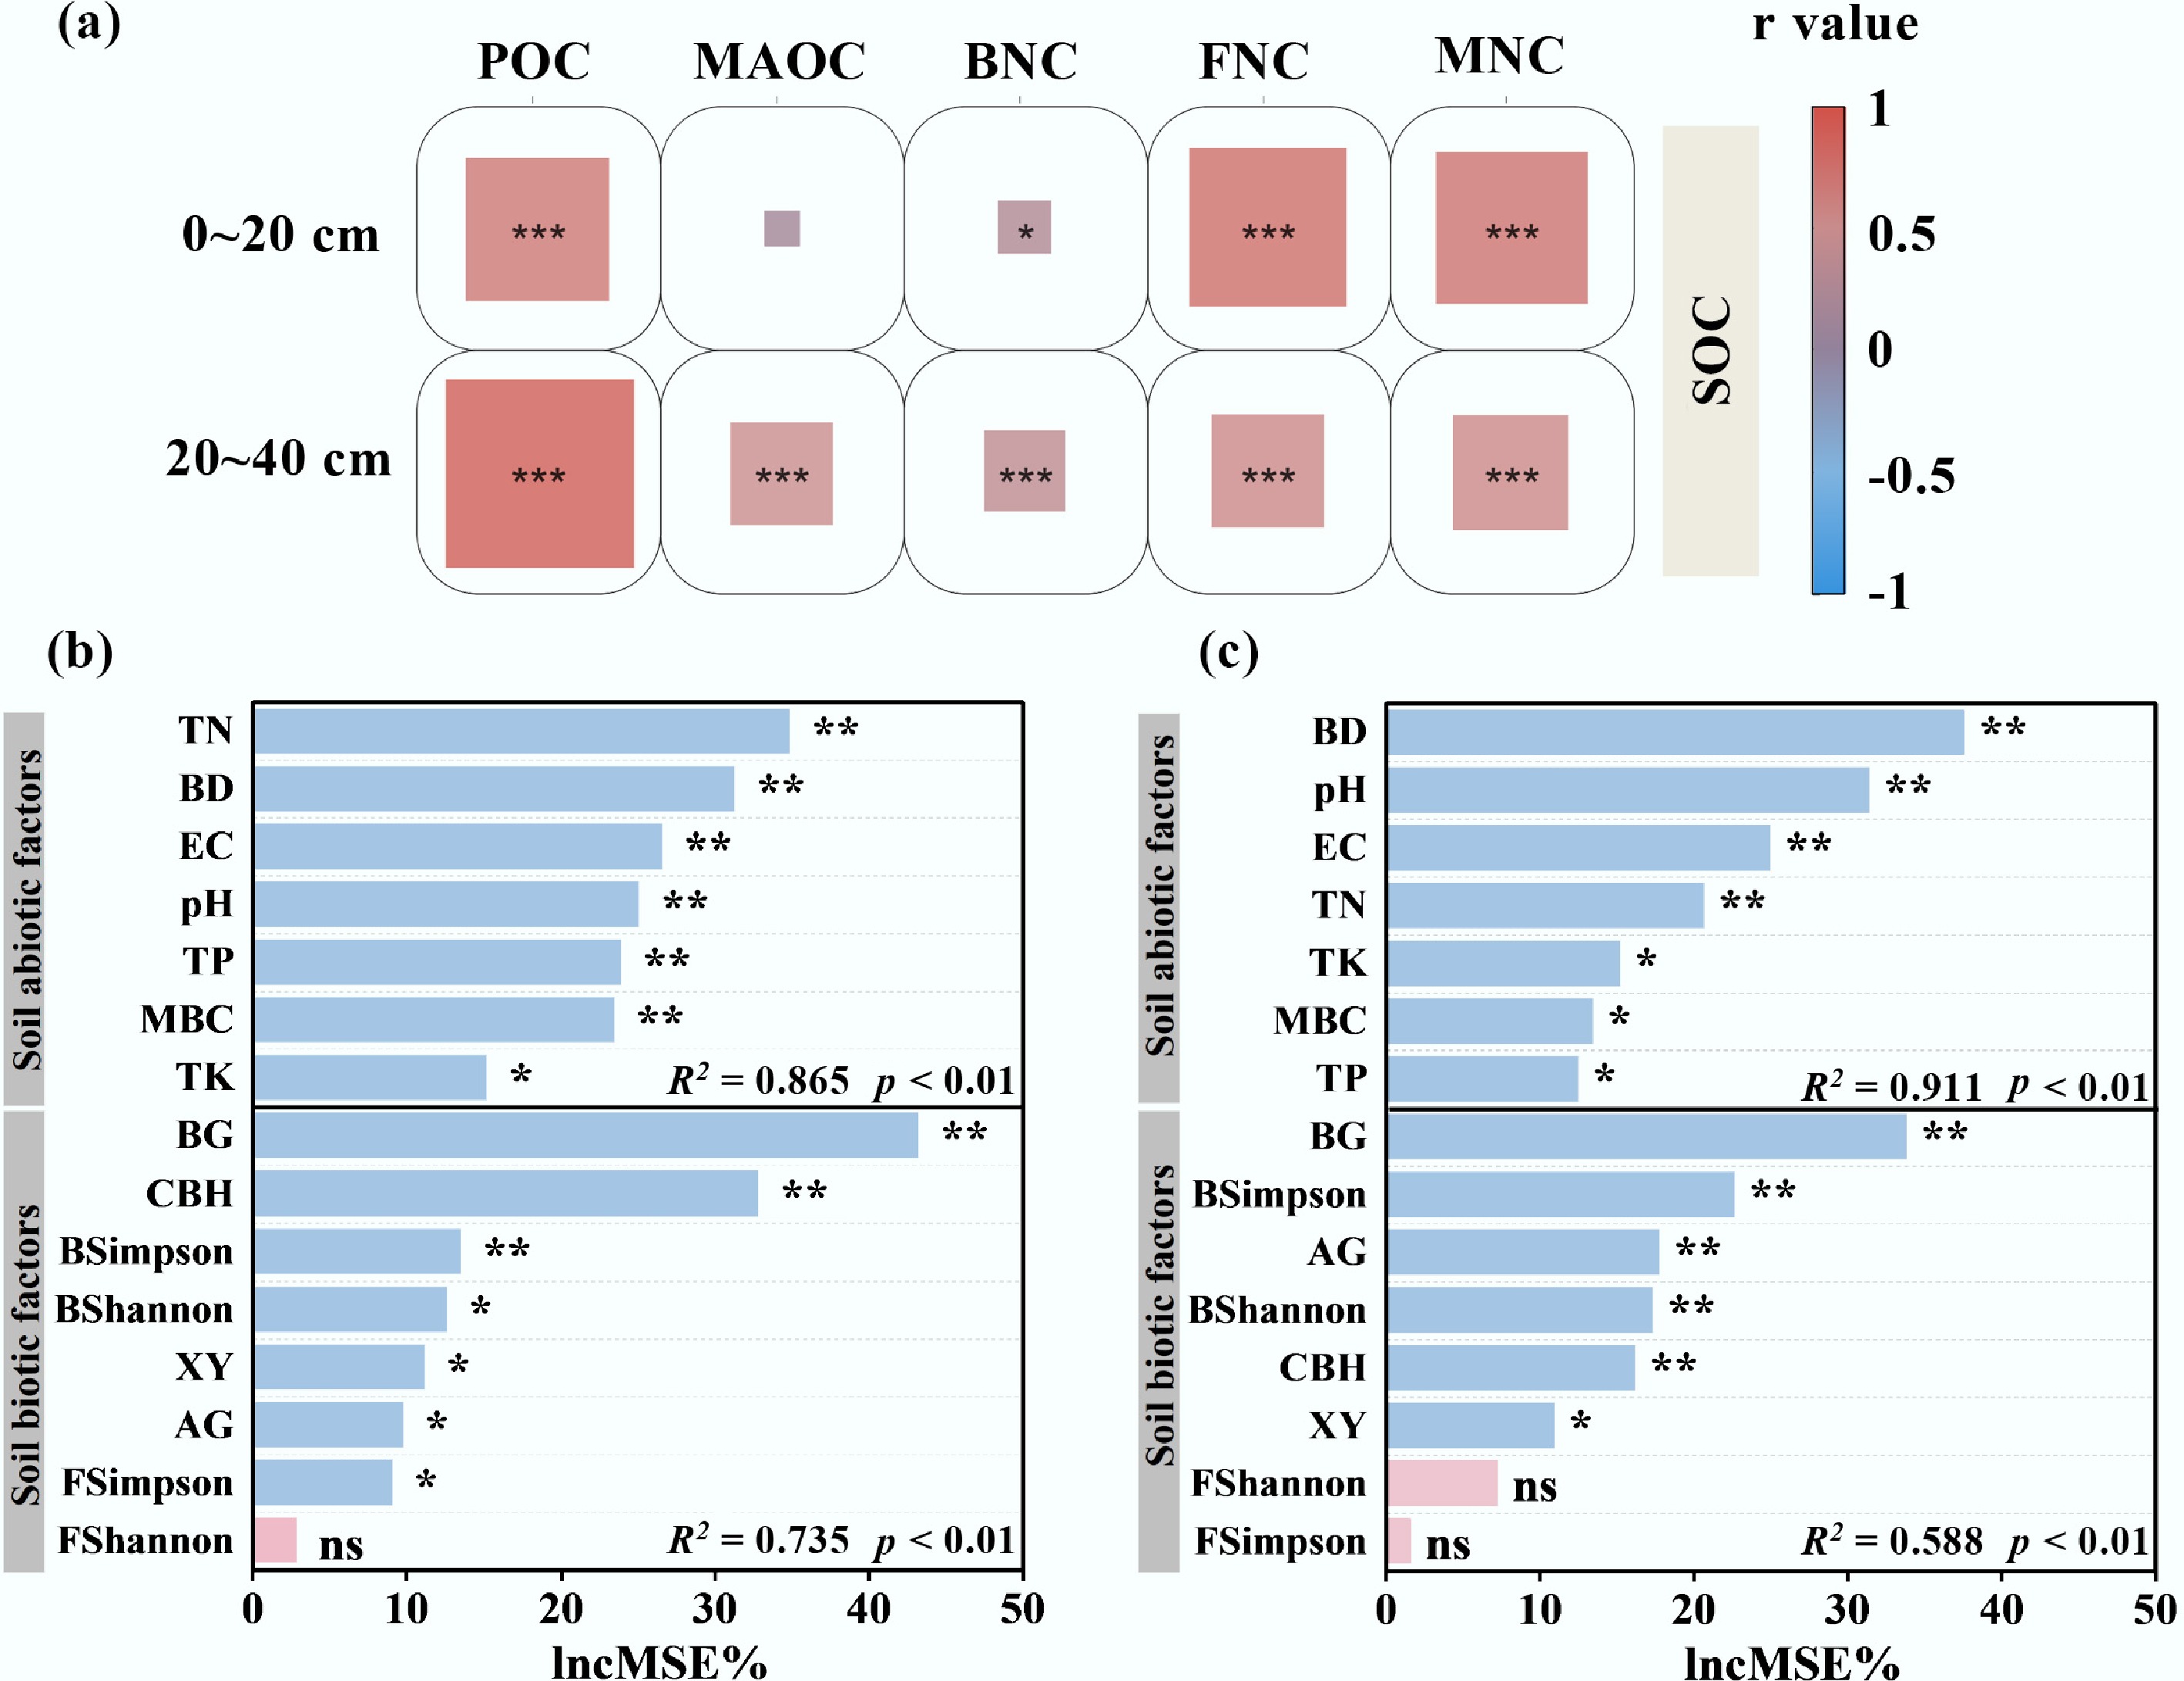
Figure 9.
(a) Relationships between SOC and individual carbon components were analyzed using Pearson's correlation. Random forest models were applied to evaluate the importance of biotic and abiotic factors to SOC in the (b) topsoil and (c) subsoil. Significance levels: *** p < 0.001, ** p < 0.01, * p < 0.05; ns, not significant.
-
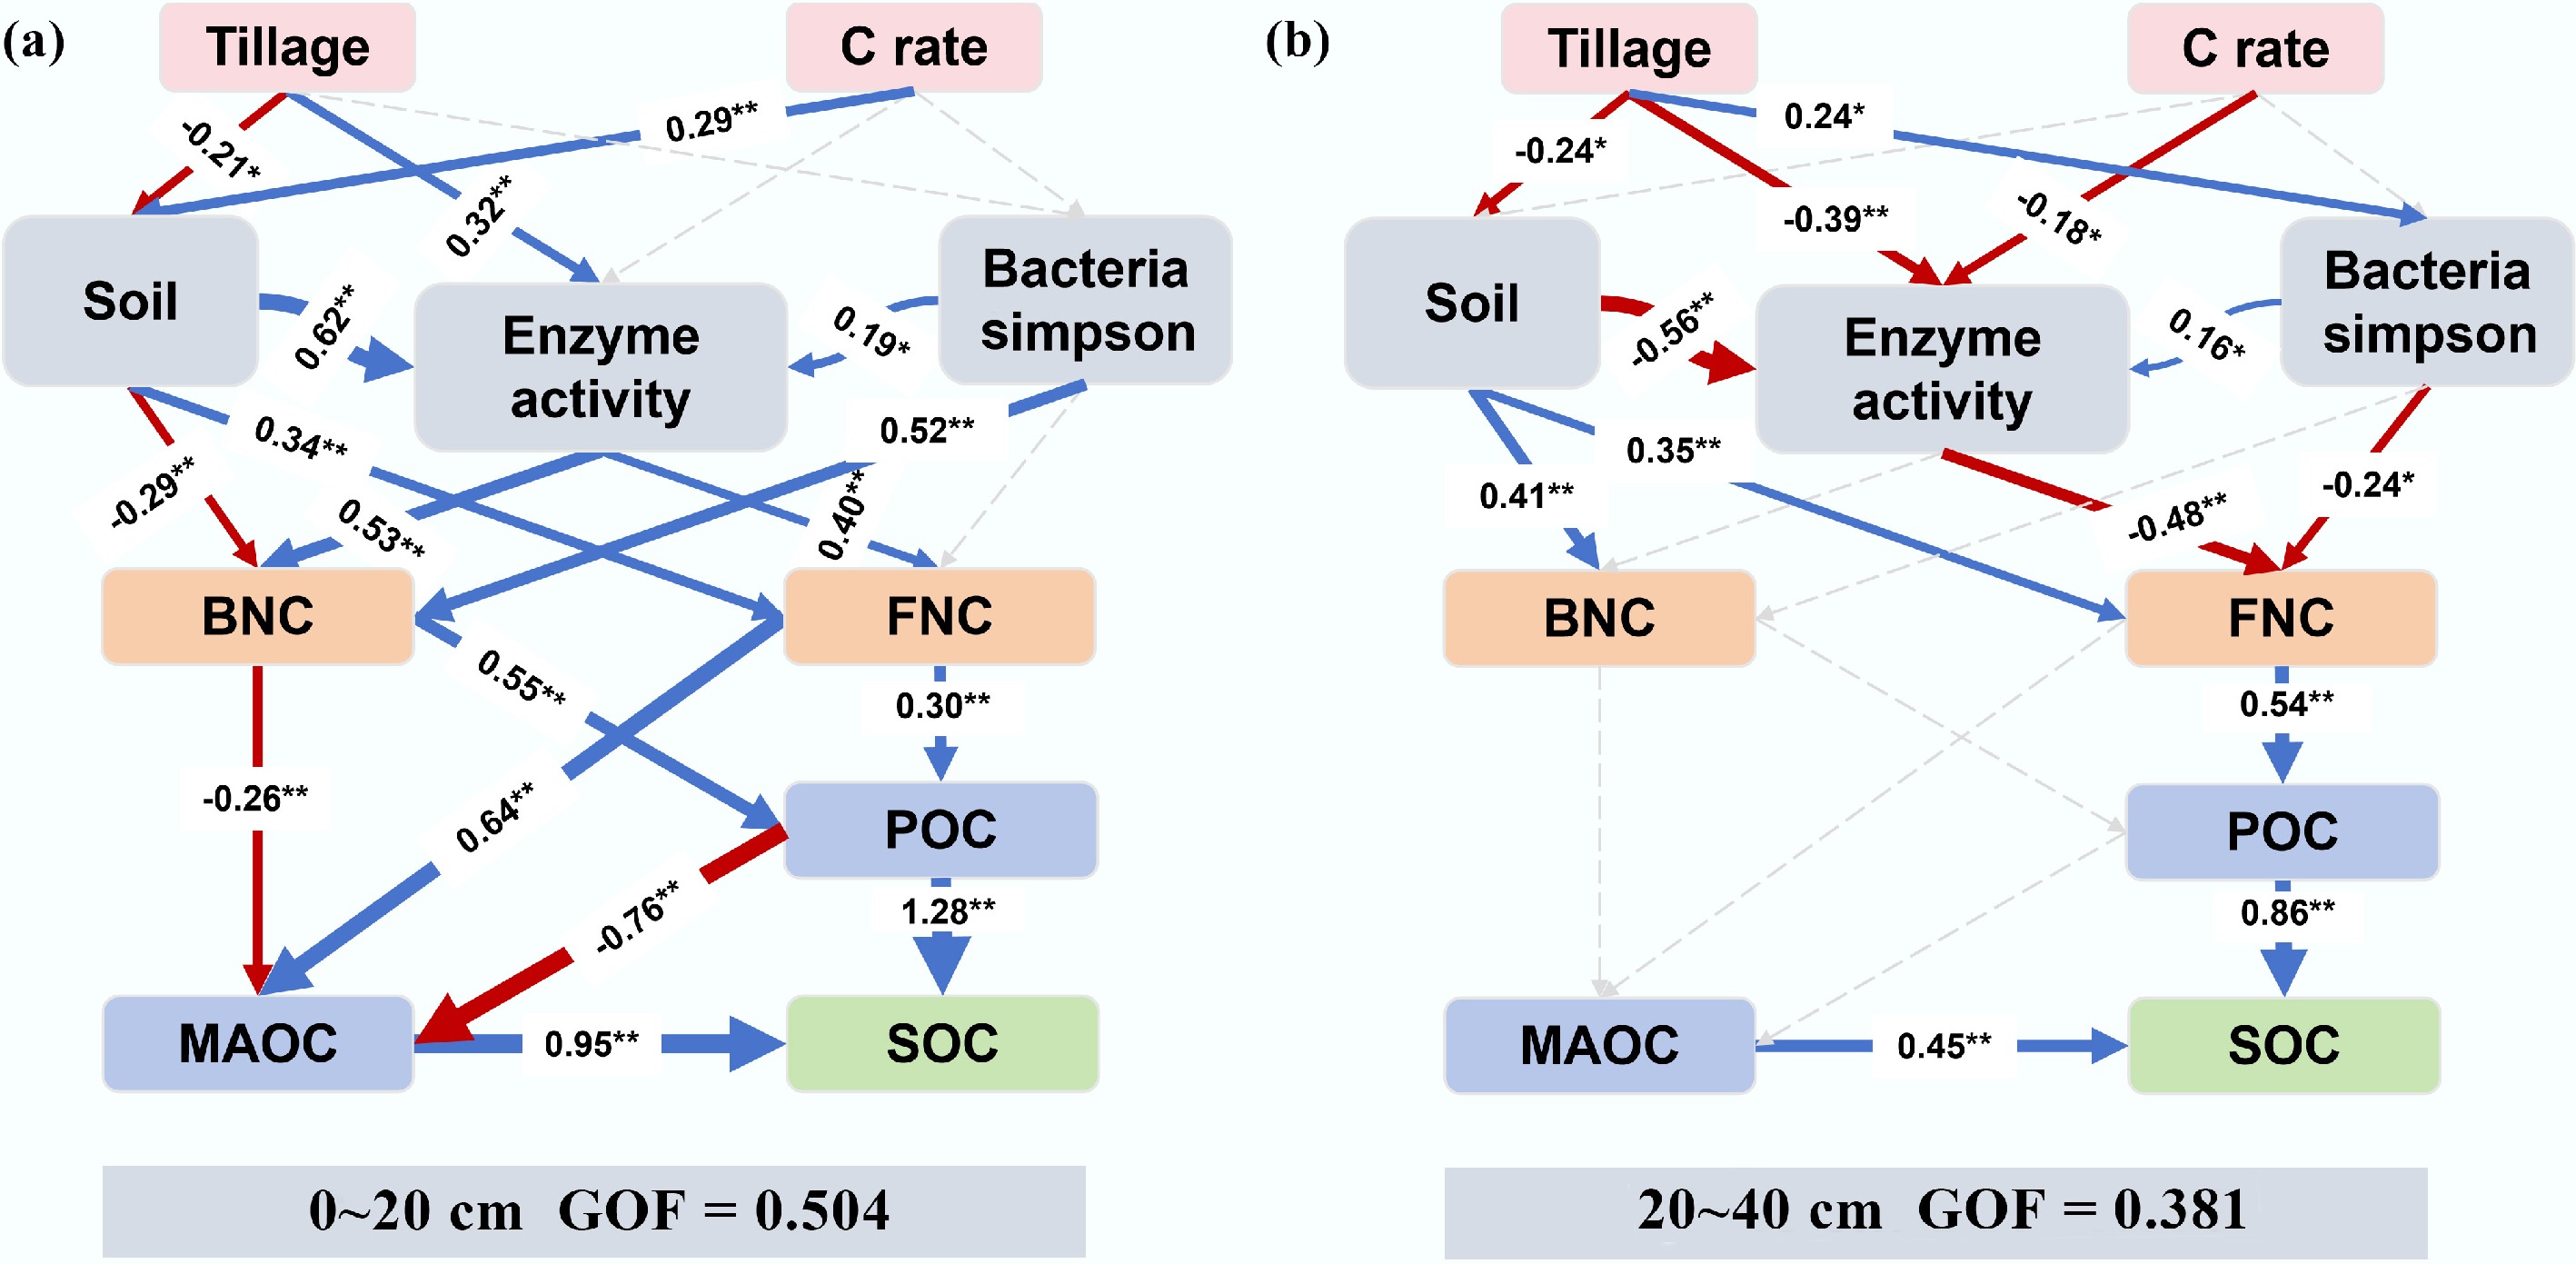
Figure 10.
Relationships between SOC and its components, FNC, and BNC in the (a) topsoil and (b) subsoil, as analyzed by partial least squares path modeling. The arrows' widths correspond to the strength of the causal relationship; numbers are standardized path coefficients. Blue and red lines indicate positive and negative paths, respectively. Solid and dashed lines denote significant (p < 0.05) and nonsignificant paths, respectively: *, p < 0.05, **, p < 0.01. The R2 values indicate the proportion of variance explained for each factor. Models were assessed using the goodness of fit.
-
Soil layer Site Soil bulk density
(g cm−3)pH
(1:2.5)Soil organic carbon
(g kg−1)Total nitrogen
(g kg−1)Total phosphorus
(g kg−1)Total potassium
(g kg−1)Sand
(%)Silt
(%)Clay
(%)Longitude and latitude Soil type 0–20 cm Gongzhuling 1.3 5.9 9.0 0.59 0.64 10.2 35.4 40.9 23.7 43°58' N, 124°76' E Loamy clay Nongan 1.4 8.1 15.7 0.82 0.91 12.8 34.3 41.1 24.6 44°05' N, 124°51' E Clay loam Shuangliao 1.5 8.3 10.7 0.73 0.97 10.7 34.3 42.2 23.5 43°64' N, 123°58' E Sandy loam Shulan 1.4 5.4 11.1 0.83 1.04 12.5 37.3 44.2 18.5 44°51' N, 126°71' E Sandy clay loam 20–40 cm Gongzhuling 1.6 6.4 8.6 0.58 0.71 10.9 34.4 41.7 23.8 Nongan 1.5 8.1 16.3 0.69 0.63 10.4 33.3 41.7 25.1 Shuangliao 1.5 8.4 10.7 0.57 0.57 11.8 35.5 39.7 24.7 Shulan 1.6 5.8 4.9 0.86 0.70 12.9 37.1 40.9 21.9 Table 1.
Field experiment site description and properties in the initial 0–40 cm
Figures
(10)
Tables
(1)