-
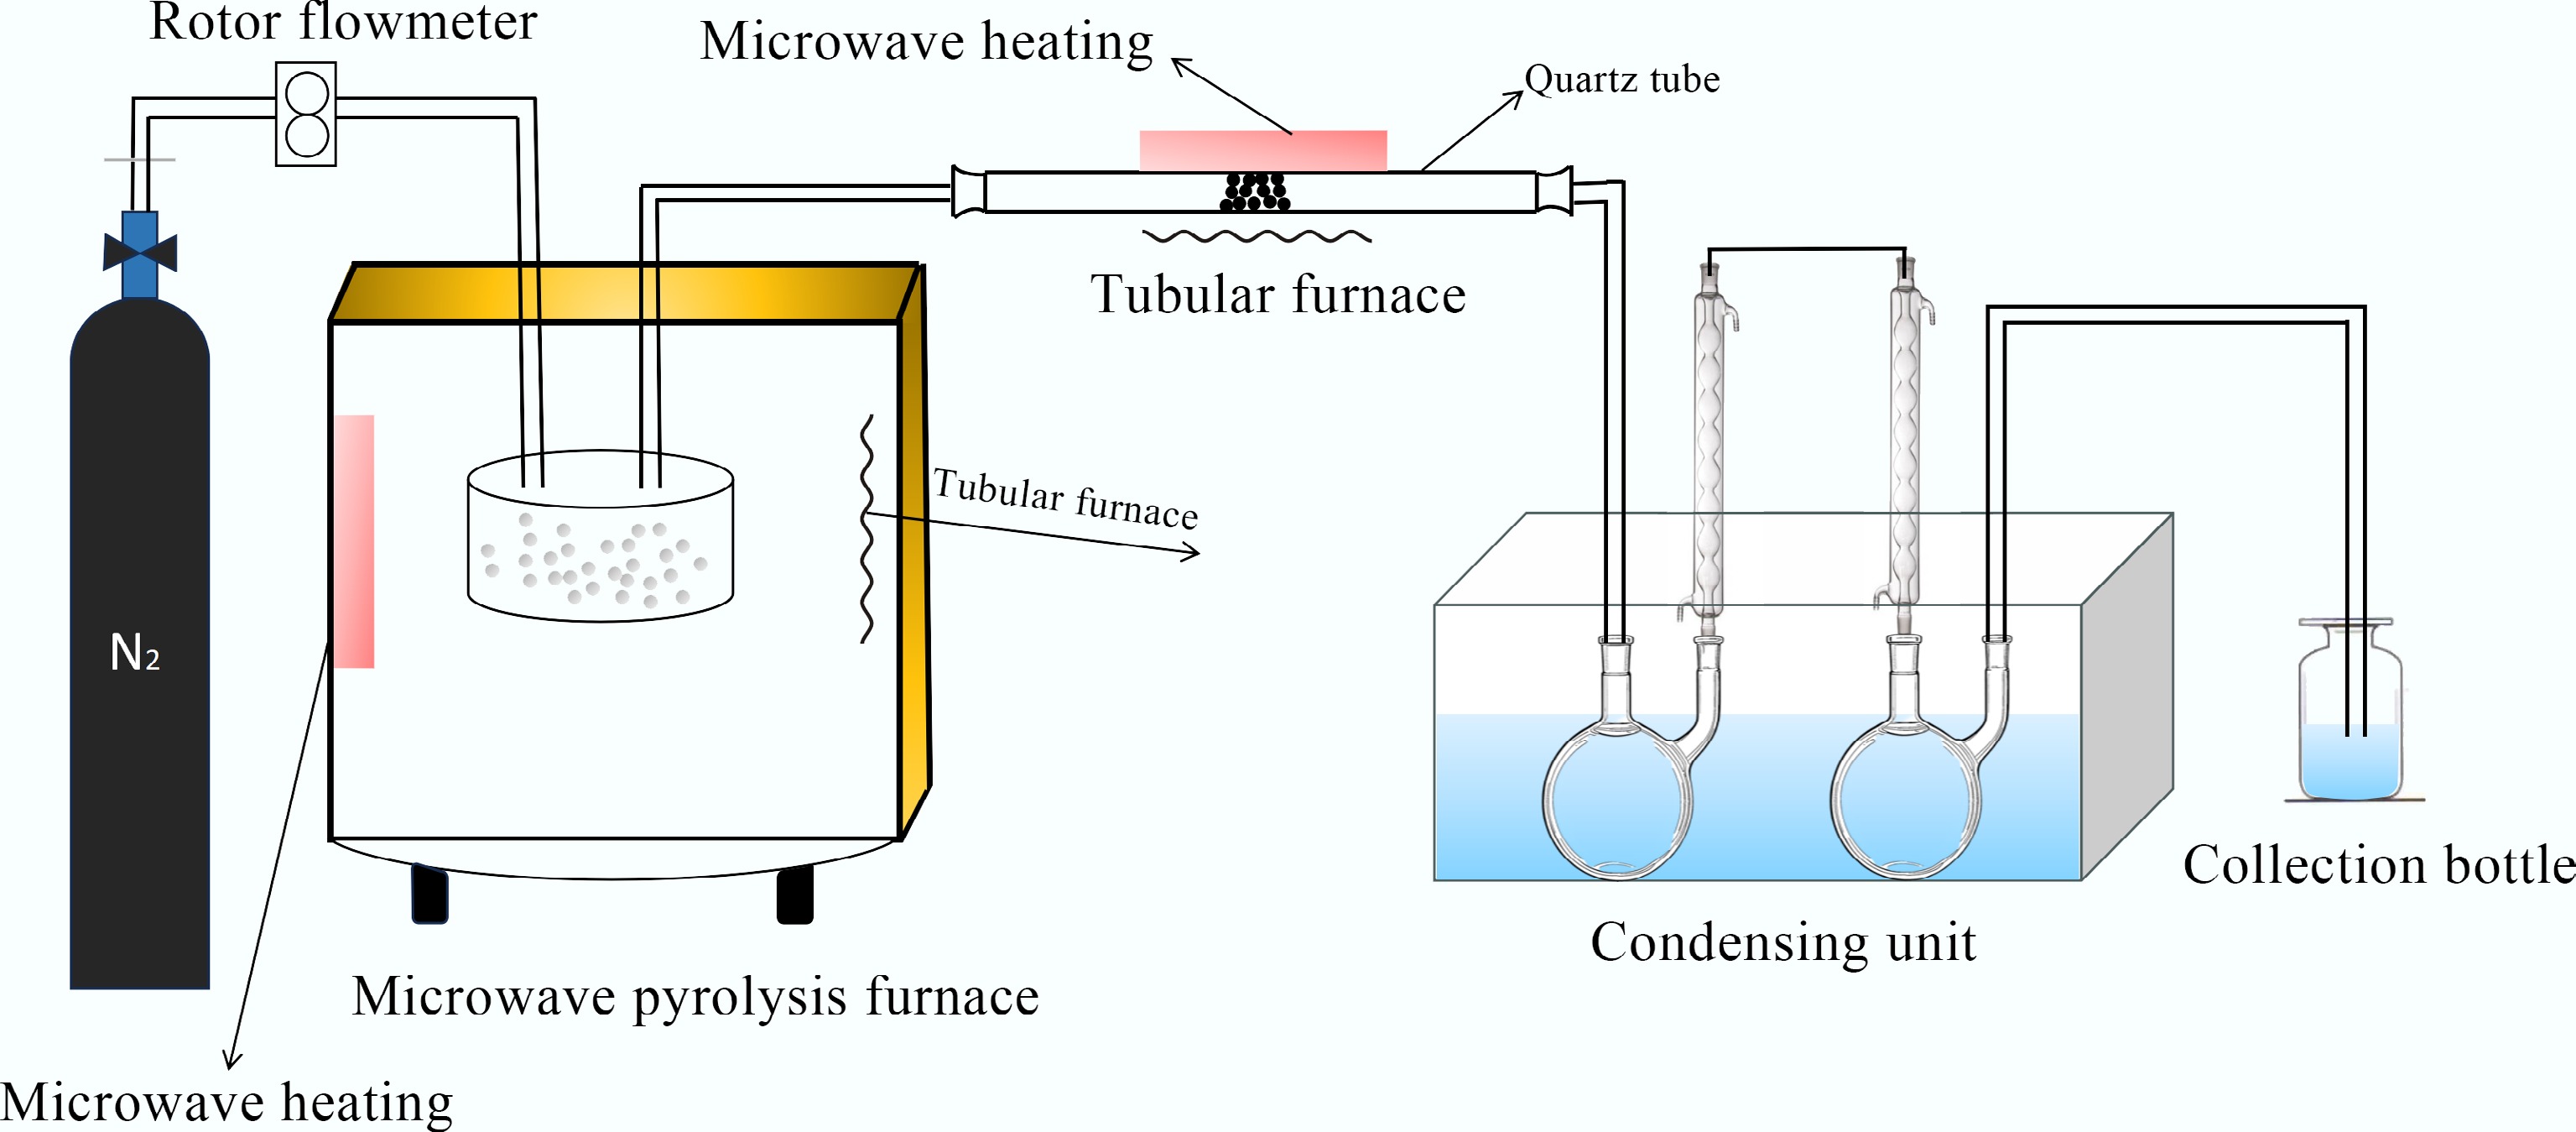
Figure 1.
Microwave ex-situ catalytic pyrolysis device.
-
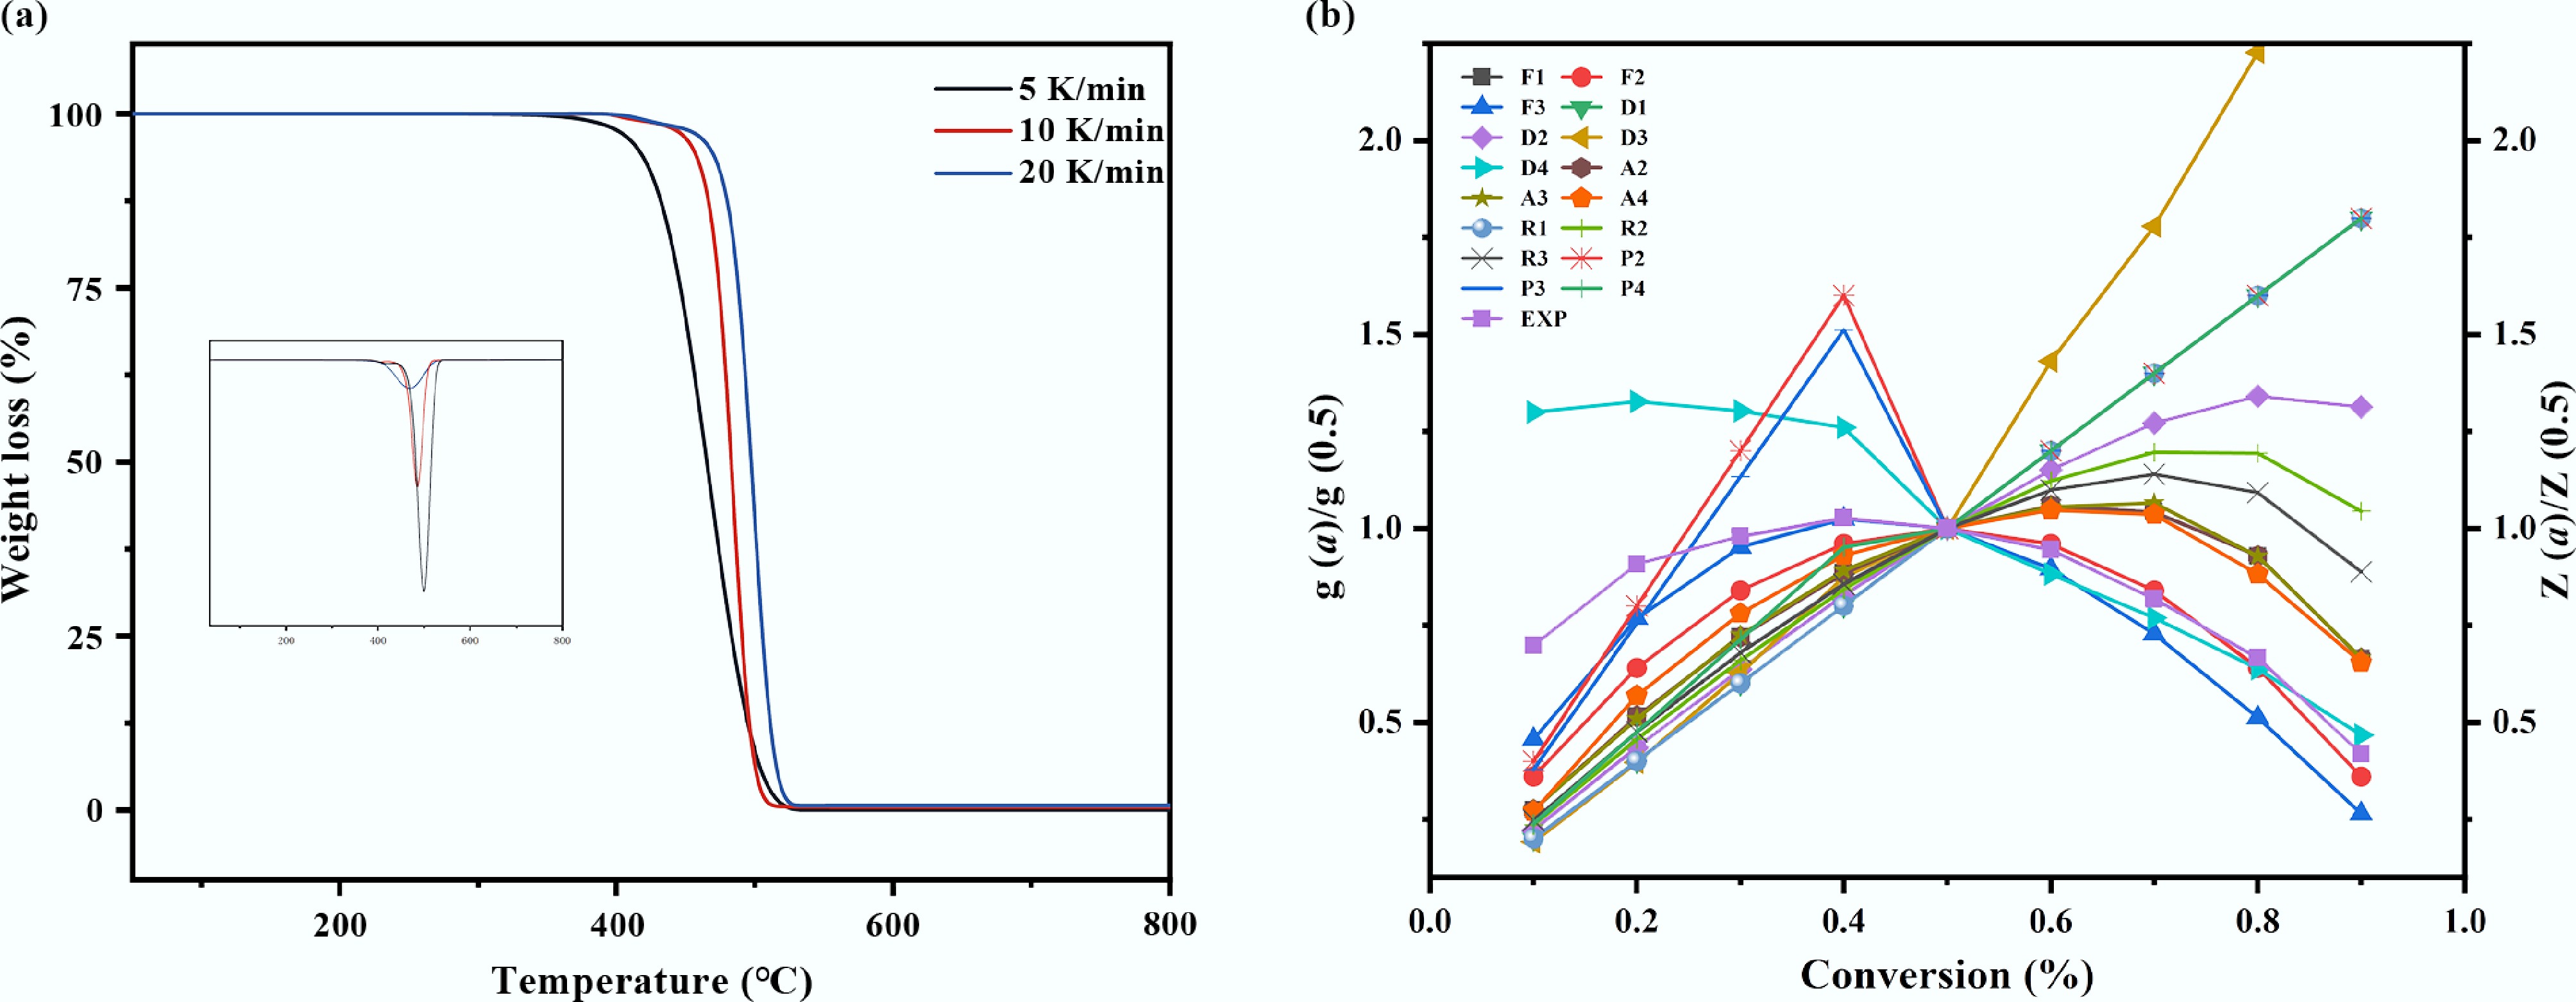
Figure 2.
Thermal decomposition of mulch film. (a) TG analysis of plastic mulch at different heating rates, (b) model fitting diagram of Criado method for plastic mulch.
-
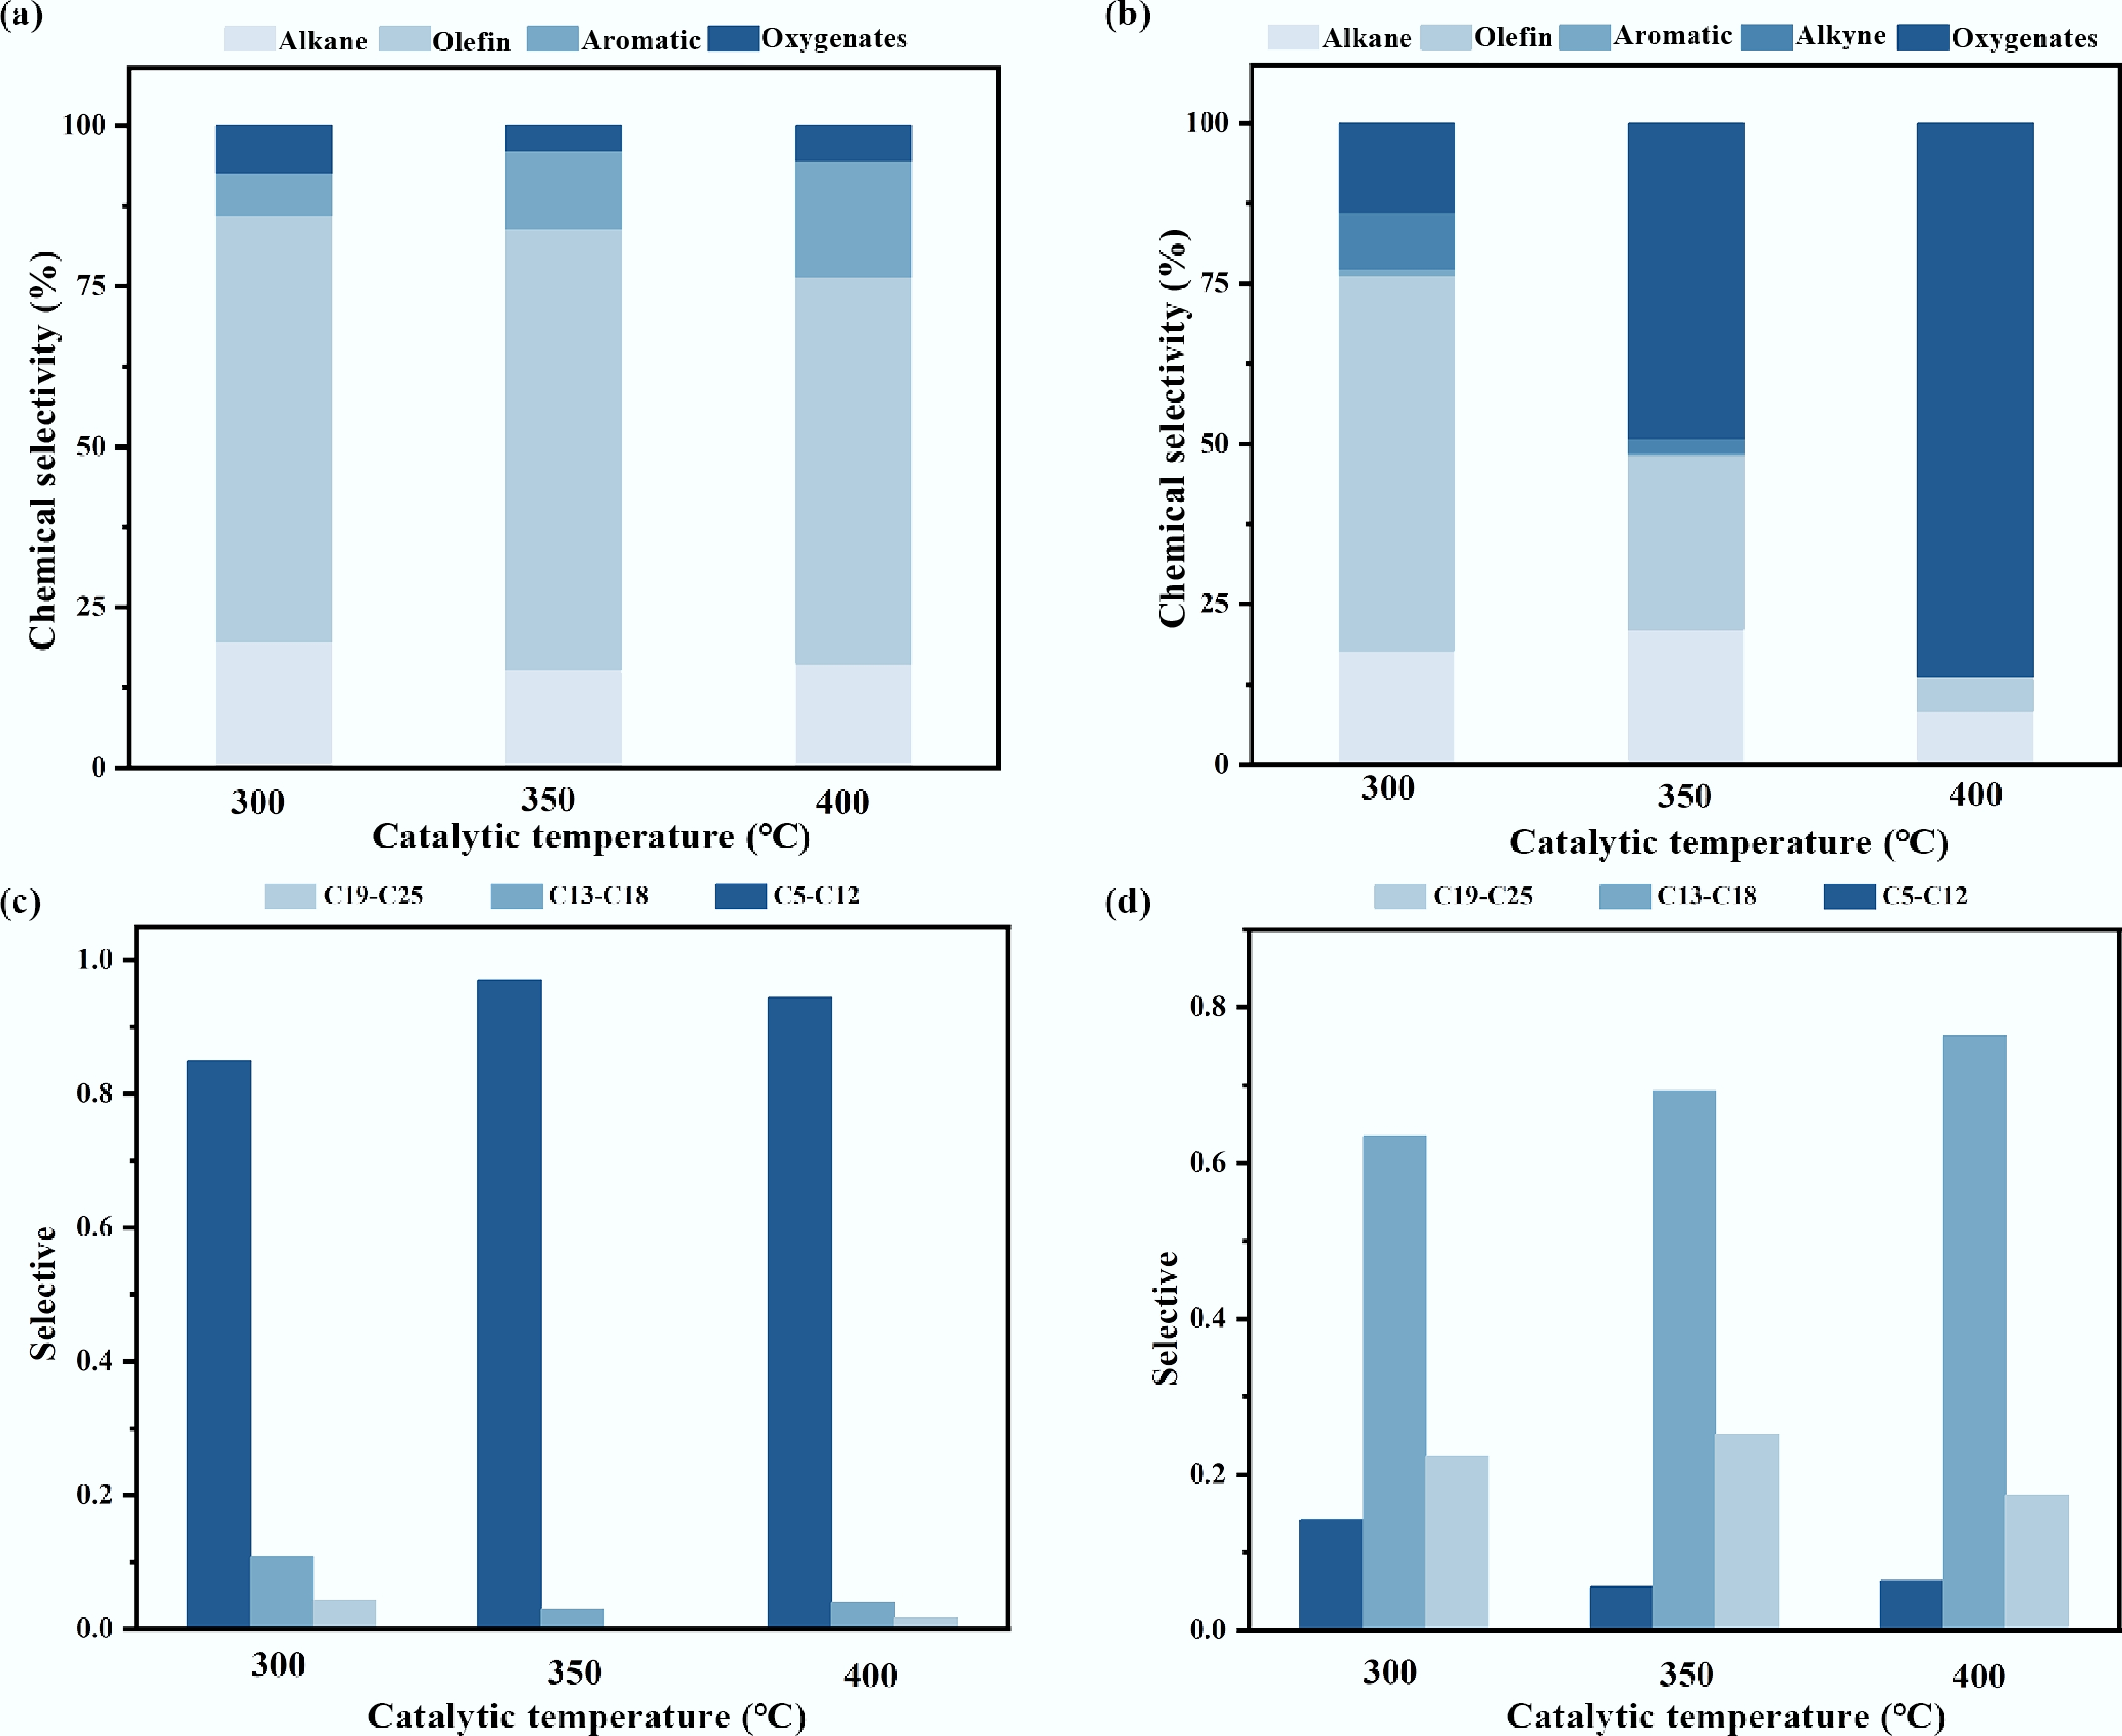
Figure 3.
Product analysis in ex-situ catalytic pyrolysis: (a) Selective of pyrolysis oil components; (b) Selective of tar components in catalysts; (c) The carbon number distribution of the pyrolysis oil components; (d) Carbon number of tar in the catalyst.
-
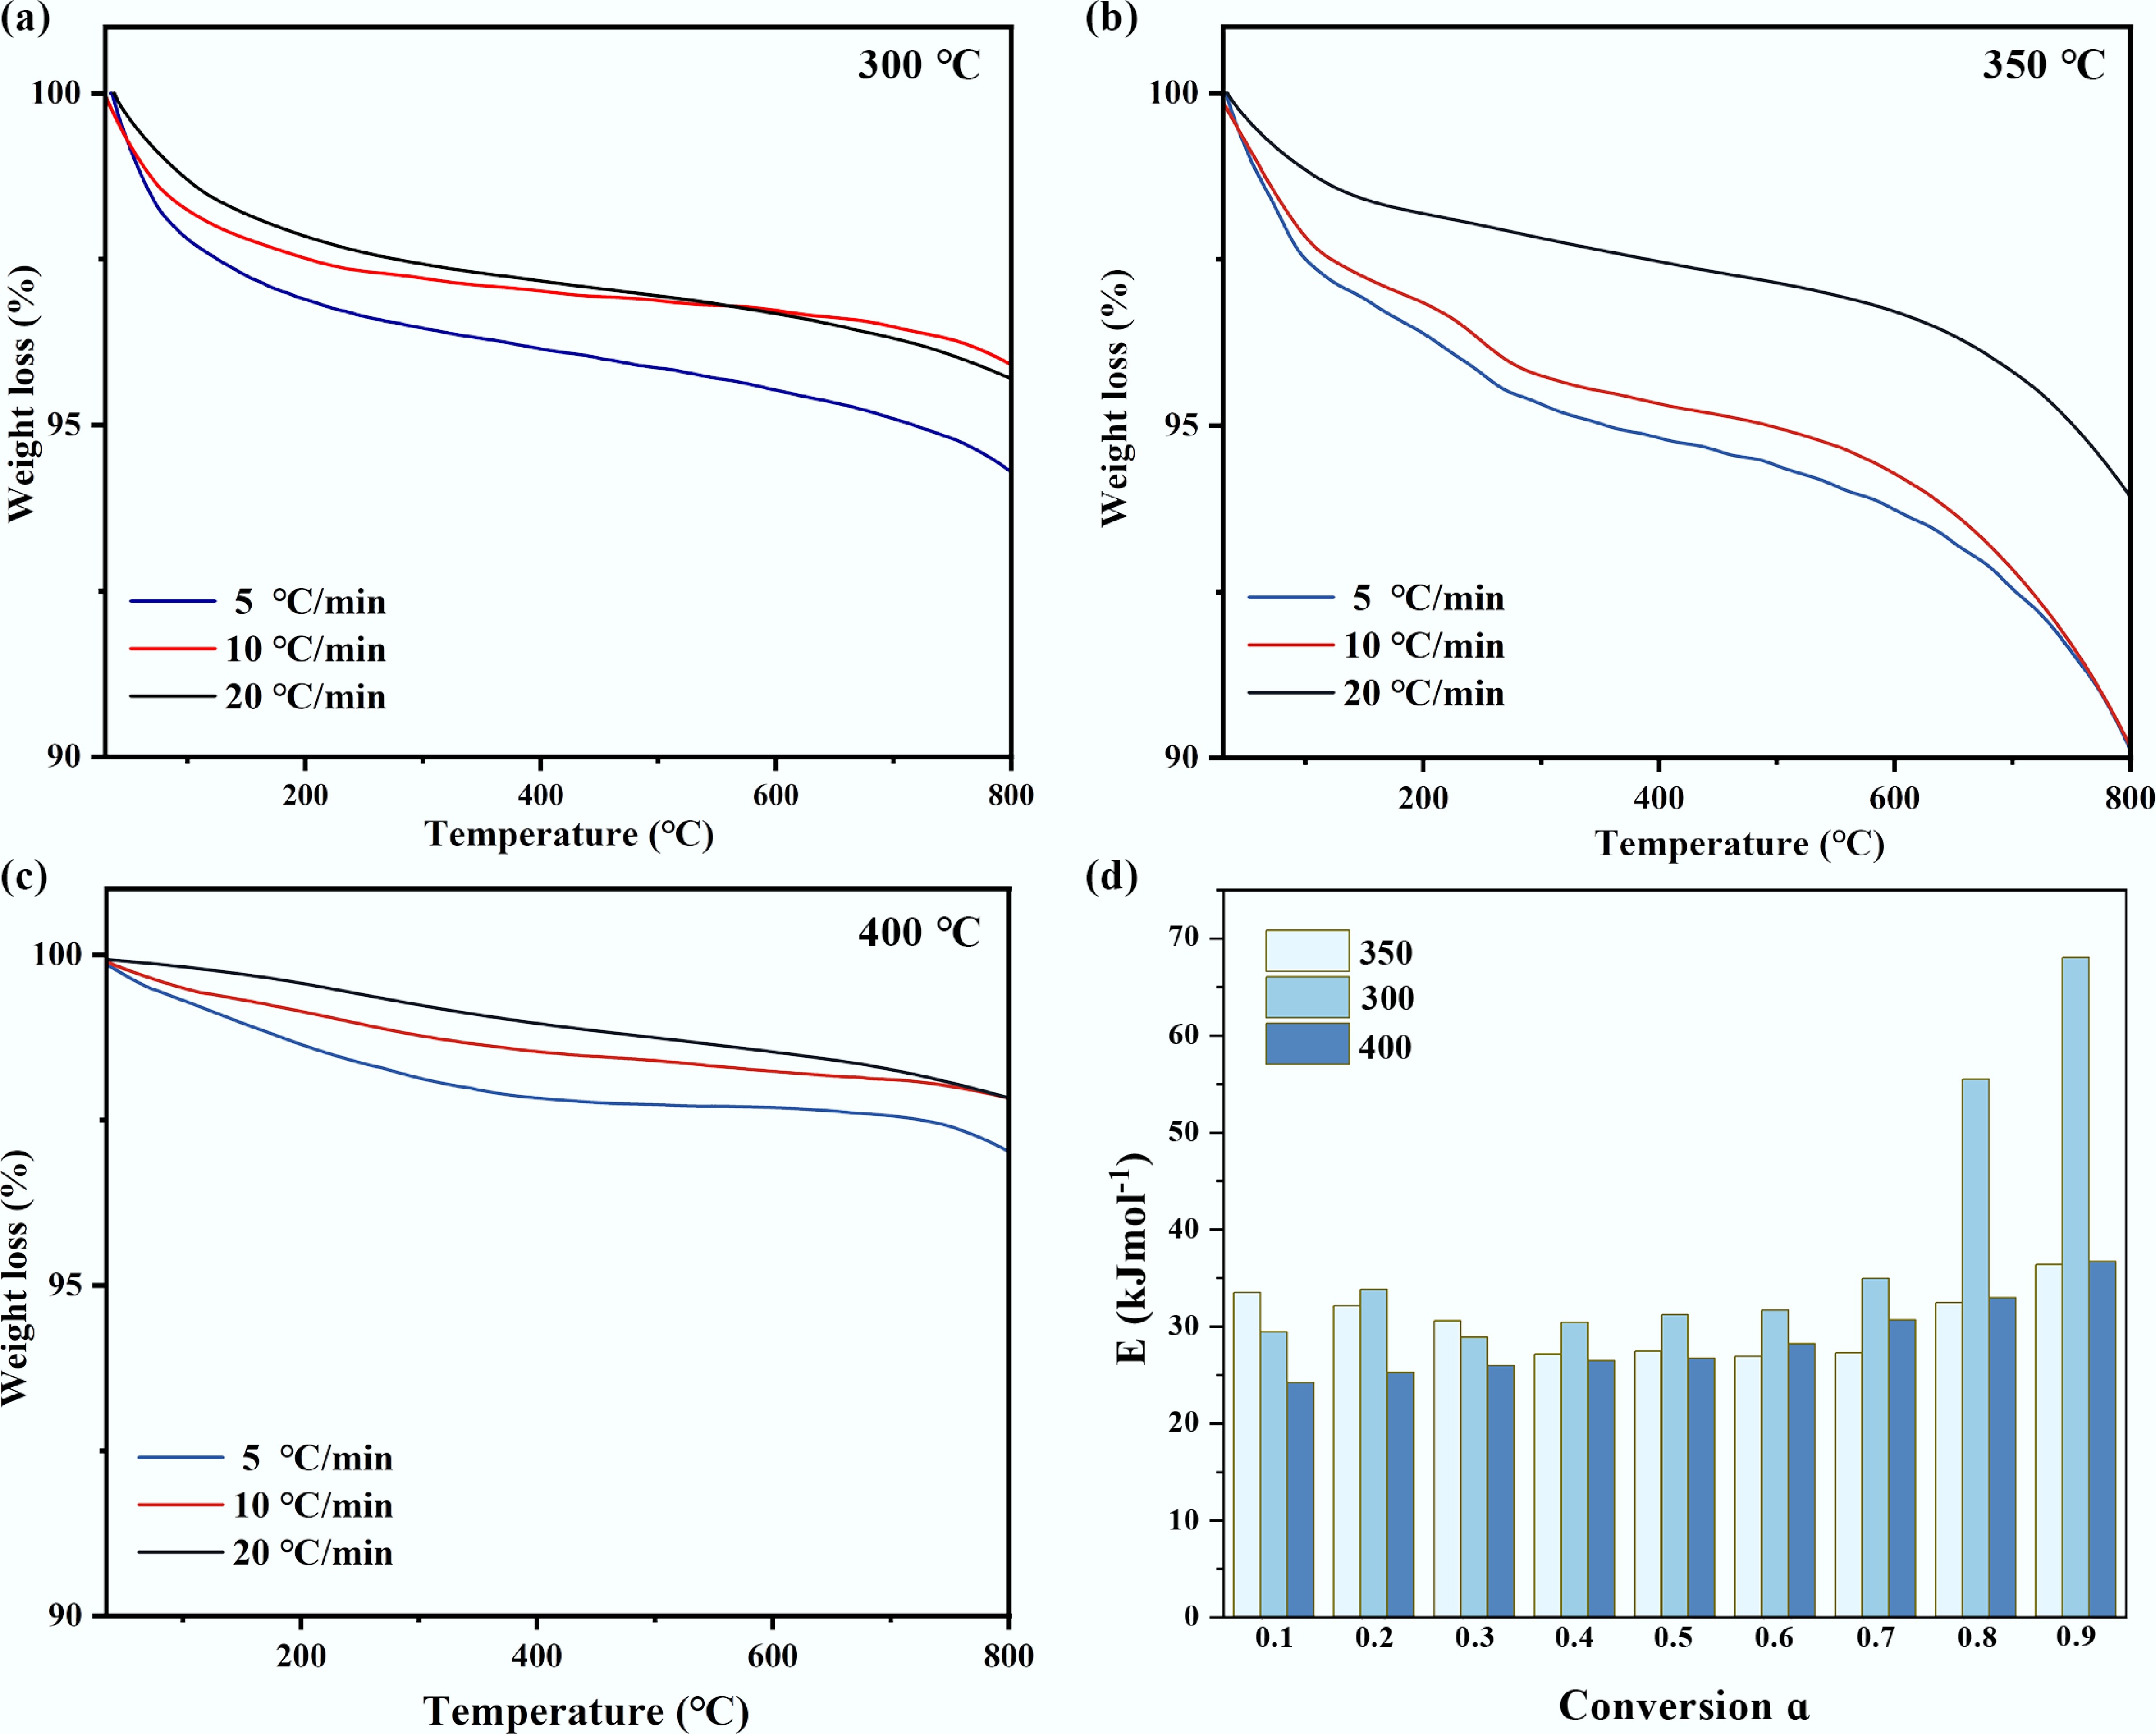
Figure 4.
TG of waste catalysts at different catalytic temperatures: (a) 300 °C, (b) 350 °C, (c) 400 °C, (d) activation energy distribution of tar obtained by the model-free method of pyrolysis kinetics.
-
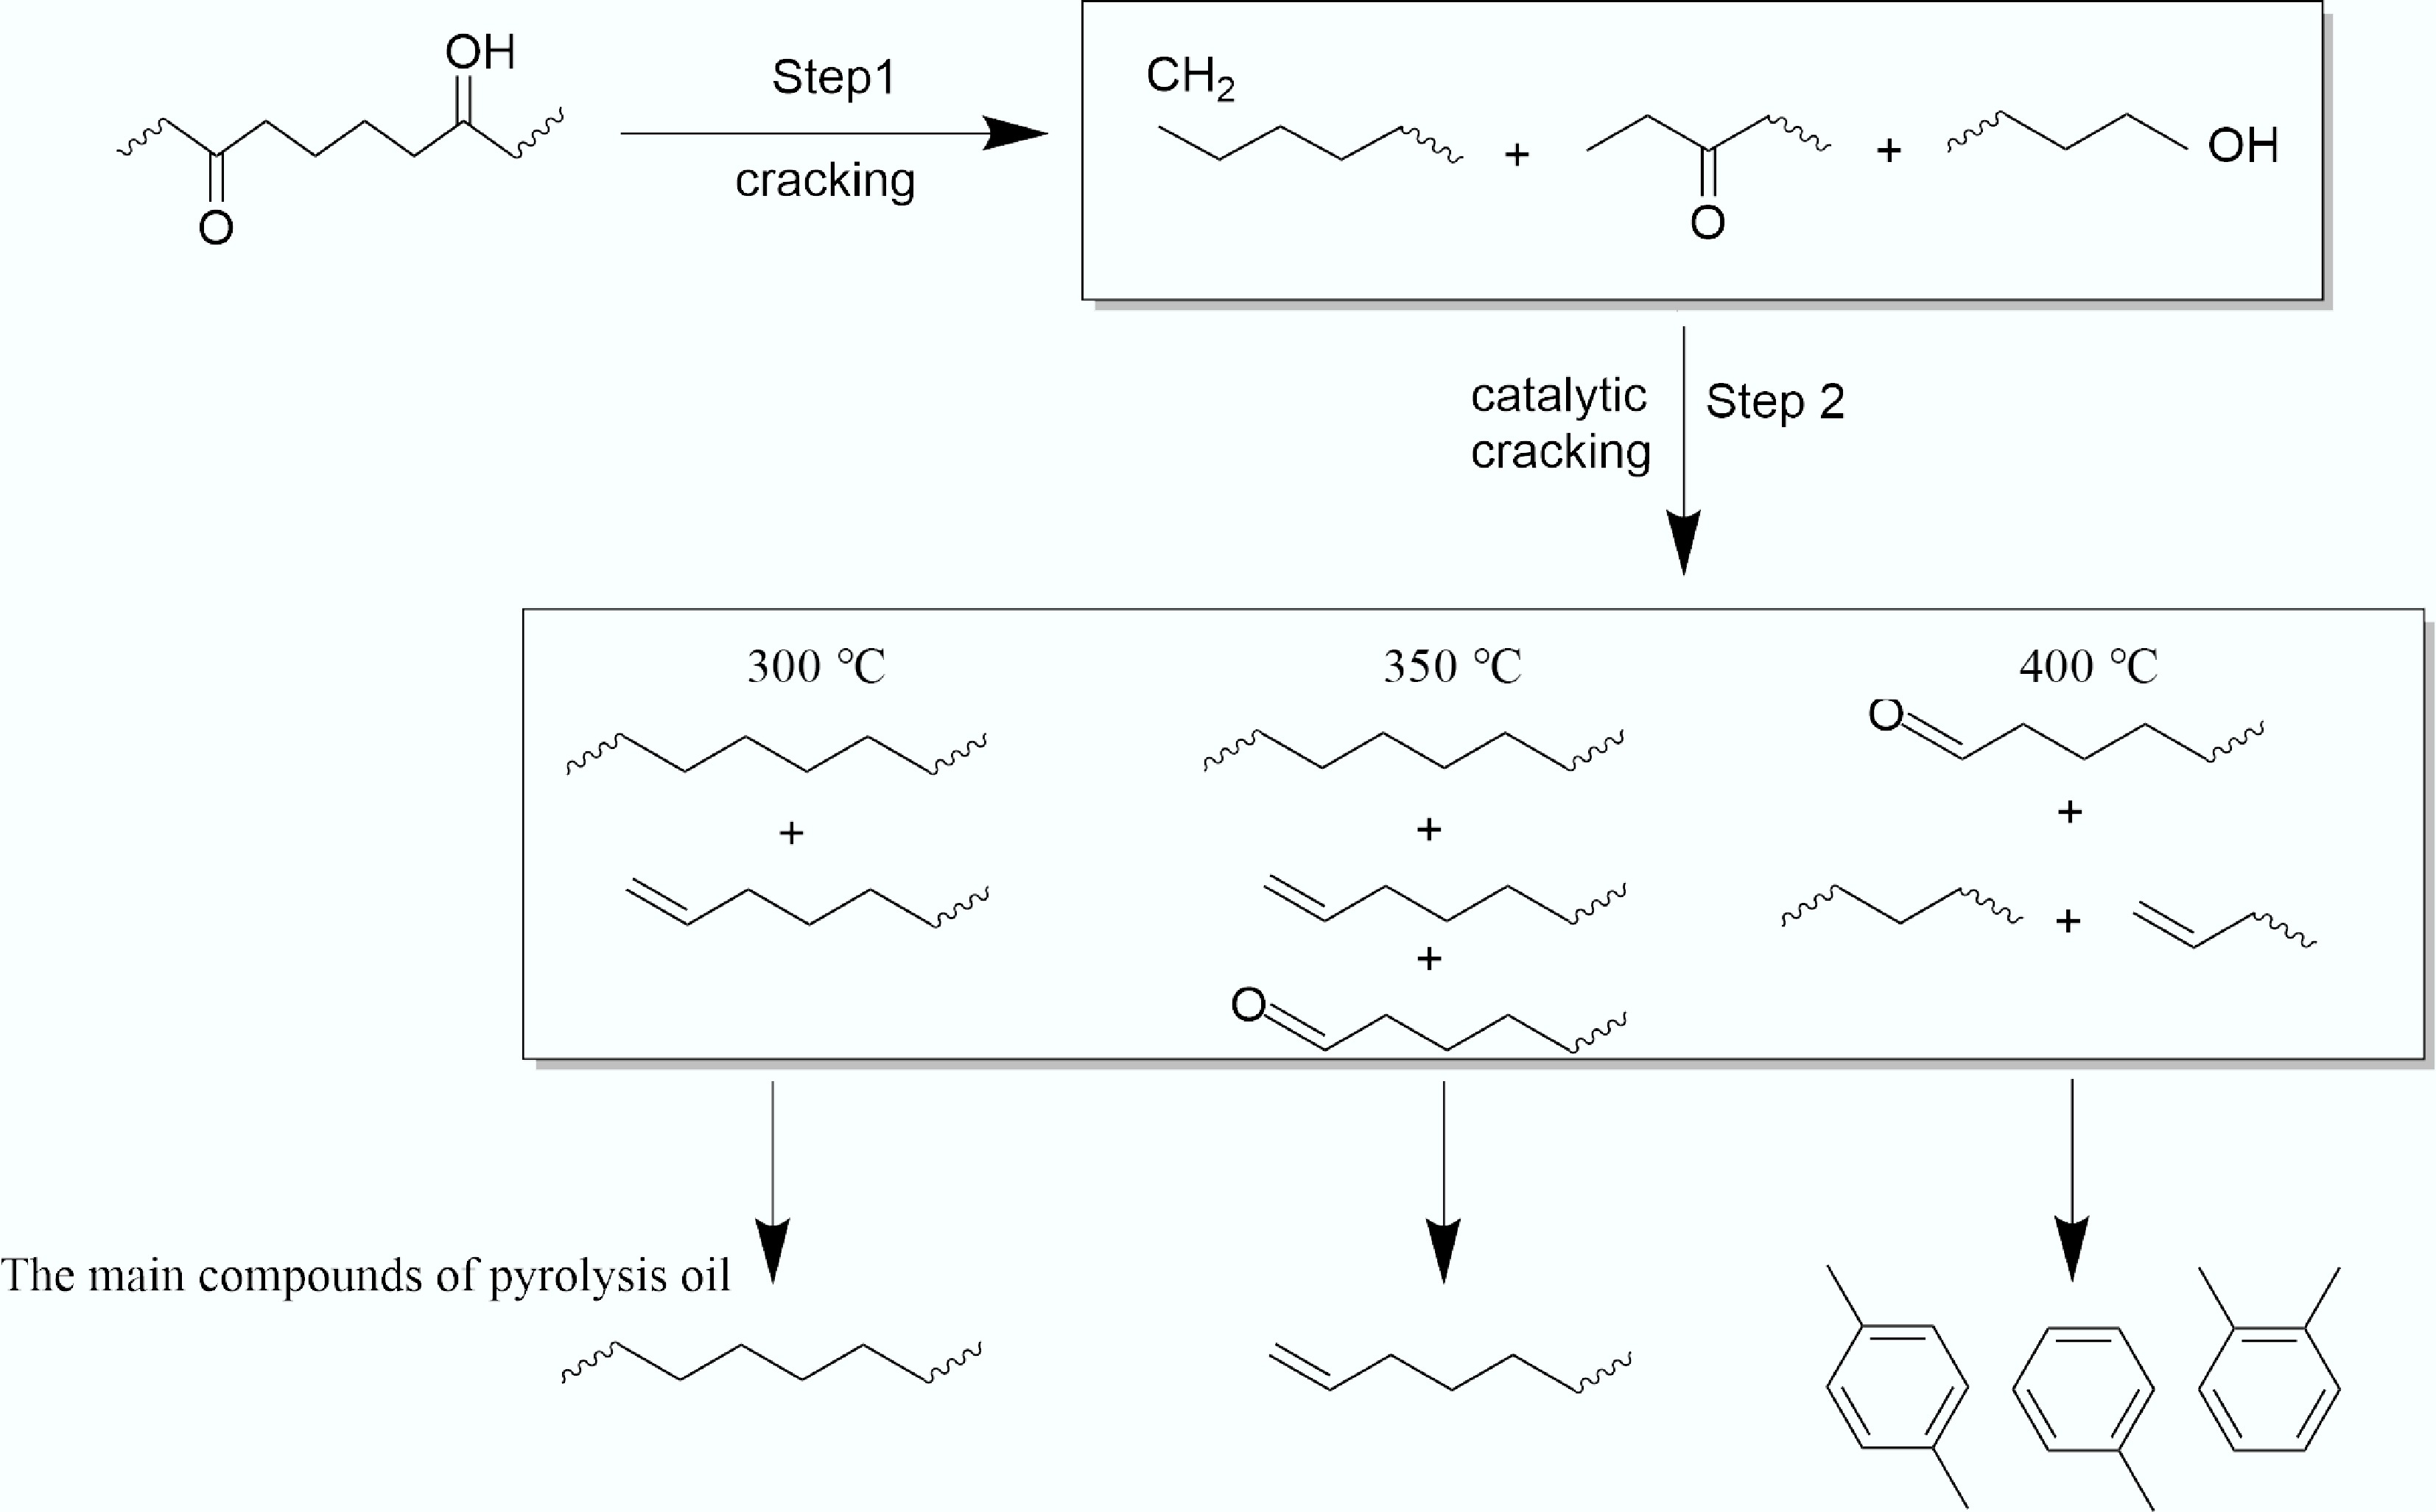
Figure 5.
Mechanism of tar formation in ex-situ catalytic pyrolysis of WPF.
-
Mechanism model Differential form f(α) Integral form g(α) Order of reaction First order (F1) 1 – α –ln (1 – α) Second order (F2) (1 – α)2 (1 – α)−1 – 1 Third order (F3) (1 – α)3 [(1 – α)−2 – 1]/2 Diffusion models One-dimensional diffusion (D1) 1/2α α2 Two-dimensional diffusion (D2) [–ln(1 – α)]−1 [(1 – α) ln(1 – α)] + α Three-dimensional diffusion, Jandel (D3) 3(1 – α)2/3/[2(1 –
(1 – α)1/3)][1 – (1 – α)1/3]2 Diffusion control (D4) 3/2[(1 – α)−1/3 – 1] 1 – (2α/3) – (1 – α)2/3 Nucleation growth models Two-dimensional (A2) 2(1 – α)[–ln(1 – α)]1/2 [–ln(1 – α)]1/2 Three-dimensional (A3) 3(1 – α)[–ln(1 – α)]3/2 [–ln(1 – α)]1/3 Four-dimensional (A4) 4(1 – α)[–ln(1 – α)]3/4 [–ln(1 – α)]1/4 Geometrical contraction models One dimension (R1) 1 α Two dimensions (R2) 2(1 – α)1/2 1 – (1 – α)1/2 Three dimensions (R3) 3(1 – α)2/3 1 – (1 – α)1/3 Experimental nucleation models Power law (P2) 2α1/2 Α1/2 Power law (P3) 3α2/3 Α1/3 Power law (P4) 4α3/4 Α1/4 Table 1.
Theoretical kinetic models for solid-state kinetics with expressions for f(α) and g(α) functions
-
Conversion FWO KAS STA E (kJ/mol) R2 E (kJ/mol) R2 E (kJ/mol) R2 0.1 227.3 0.99855 226 0.9984 234 0.9984 0.2 233.7 0.99713 232 0.9969 224 0.9969 0.3 237.5 0.99388 236 0.9933 226 0.9934 0.4 238.5 0.99357 237 0.9929 234 0.9930 0.5 239.1 0.99534 236 0.9952 232 0.9949 0.6 237 0.99775 235 0.9975 235 0.9976 0.7 233.1 0.99968 231 0.9997 229 0.9997 0.8 228.9 0.99972 227 0.9997 223 0.9997 0.9 220.6 0.99603 220 0.9955 206 0.9956 Table 2.
Apparent activation energy (Eɑ, kJ/mol) values of WPF pyrolysis with the FWO, KAS, and Starink methods
-
Conversion FWO KAS STA E (kJ/mol) R2 E (kJ/mol) R2 E (kJ/mol) R2 0.1 38.61 0.948 31.50 0.966 30.49 0.973 0.2 36.97 0.981 29.36 0.989 30.12 0.982 0.3 35.79 0.976 27.59 0.987 28.41 0.978 0.4 32.71 0.971 23.94 0.986 24.81 0.973 0.5 33.36 0.922 24.06 0.963 24.99 0.929 0.6 33.15 0.924 23.36 0.966 24.34 0.931 0.7 33.92 0.942 23.44 0.976 24.49 0.948 0.8 39.68 0.996 28.31 0.997 29.44 0.996 0.9 41.57 0.964 33.18 0.978 34.42 0.966 Table 3.
Apparent activation energy (Ea, kJ/mol) values of 300 °C tar pyrolysis with the FWO, KAS, and Starink methods
-
Conversion FWO KAS STA E (kJ/mol) R2 E (kJ/mol)) R2 E (kJ/mol) R2 0.1 26.84 0.993 33.93 0.990 27.55 0.990 0.2 31.08 0.993 38.60 0.988 31.83 0.988 0.3 26.03 0.994 33.85 0.989 26.79 0.989 0.4 27.33 0.989 35.72 0.979 28.17 0.980 0.5 27.95 0.983 36.86 0.967 28.84 0.969 0.6 28.14 0.974 37.91 0.948 29.12 0.952 0.7 31.07 0.956 41.75 0.916 32.13 0.922 0.8 51.16 0.968 62.99 0.949 52.34 0.951 0.9 63.29 0.975 76.27 0.962 64.59 0.964 Table 4.
Apparent activation energy (Ea, kJ/mol) values of 350 °C tar pyrolysis with the FWO, KAS, and Starink methods
-
Conversion FWO KAS STA E (kJ/mol) R2 E (kJ/mol) R2 E (kJ/mol) R2 0.1 28.92 0.992 21.53 0.989 22.27 0.989 0.2 30.16 0.993 22.38 0.990 23.16 0.990 0.3 31.22 0.991 22.86 0.986 23.84 0.988 0.4 31.96 0.995 23.33 0.994 24.20 0.994 0.5 32.49 0.998 23.40 0.998 24.31 0.998 0.6 34.30 0.999 24.67 0.998 25.64 0.999 0.7 37.15 0.999 26.93 0.998 27.95 0.998 0.8 39.86 0.999 29.02 1.000 30.10 0.999 0.9 44.06 0.999 32.44 0.998 33.60 0.998 Table 5.
Apparent activation energy (Ea, kJ/mol) values of 400 °C tar pyrolysis with the FWO, KAS, and Starink methods
Figures
(5)
Tables
(5)