-
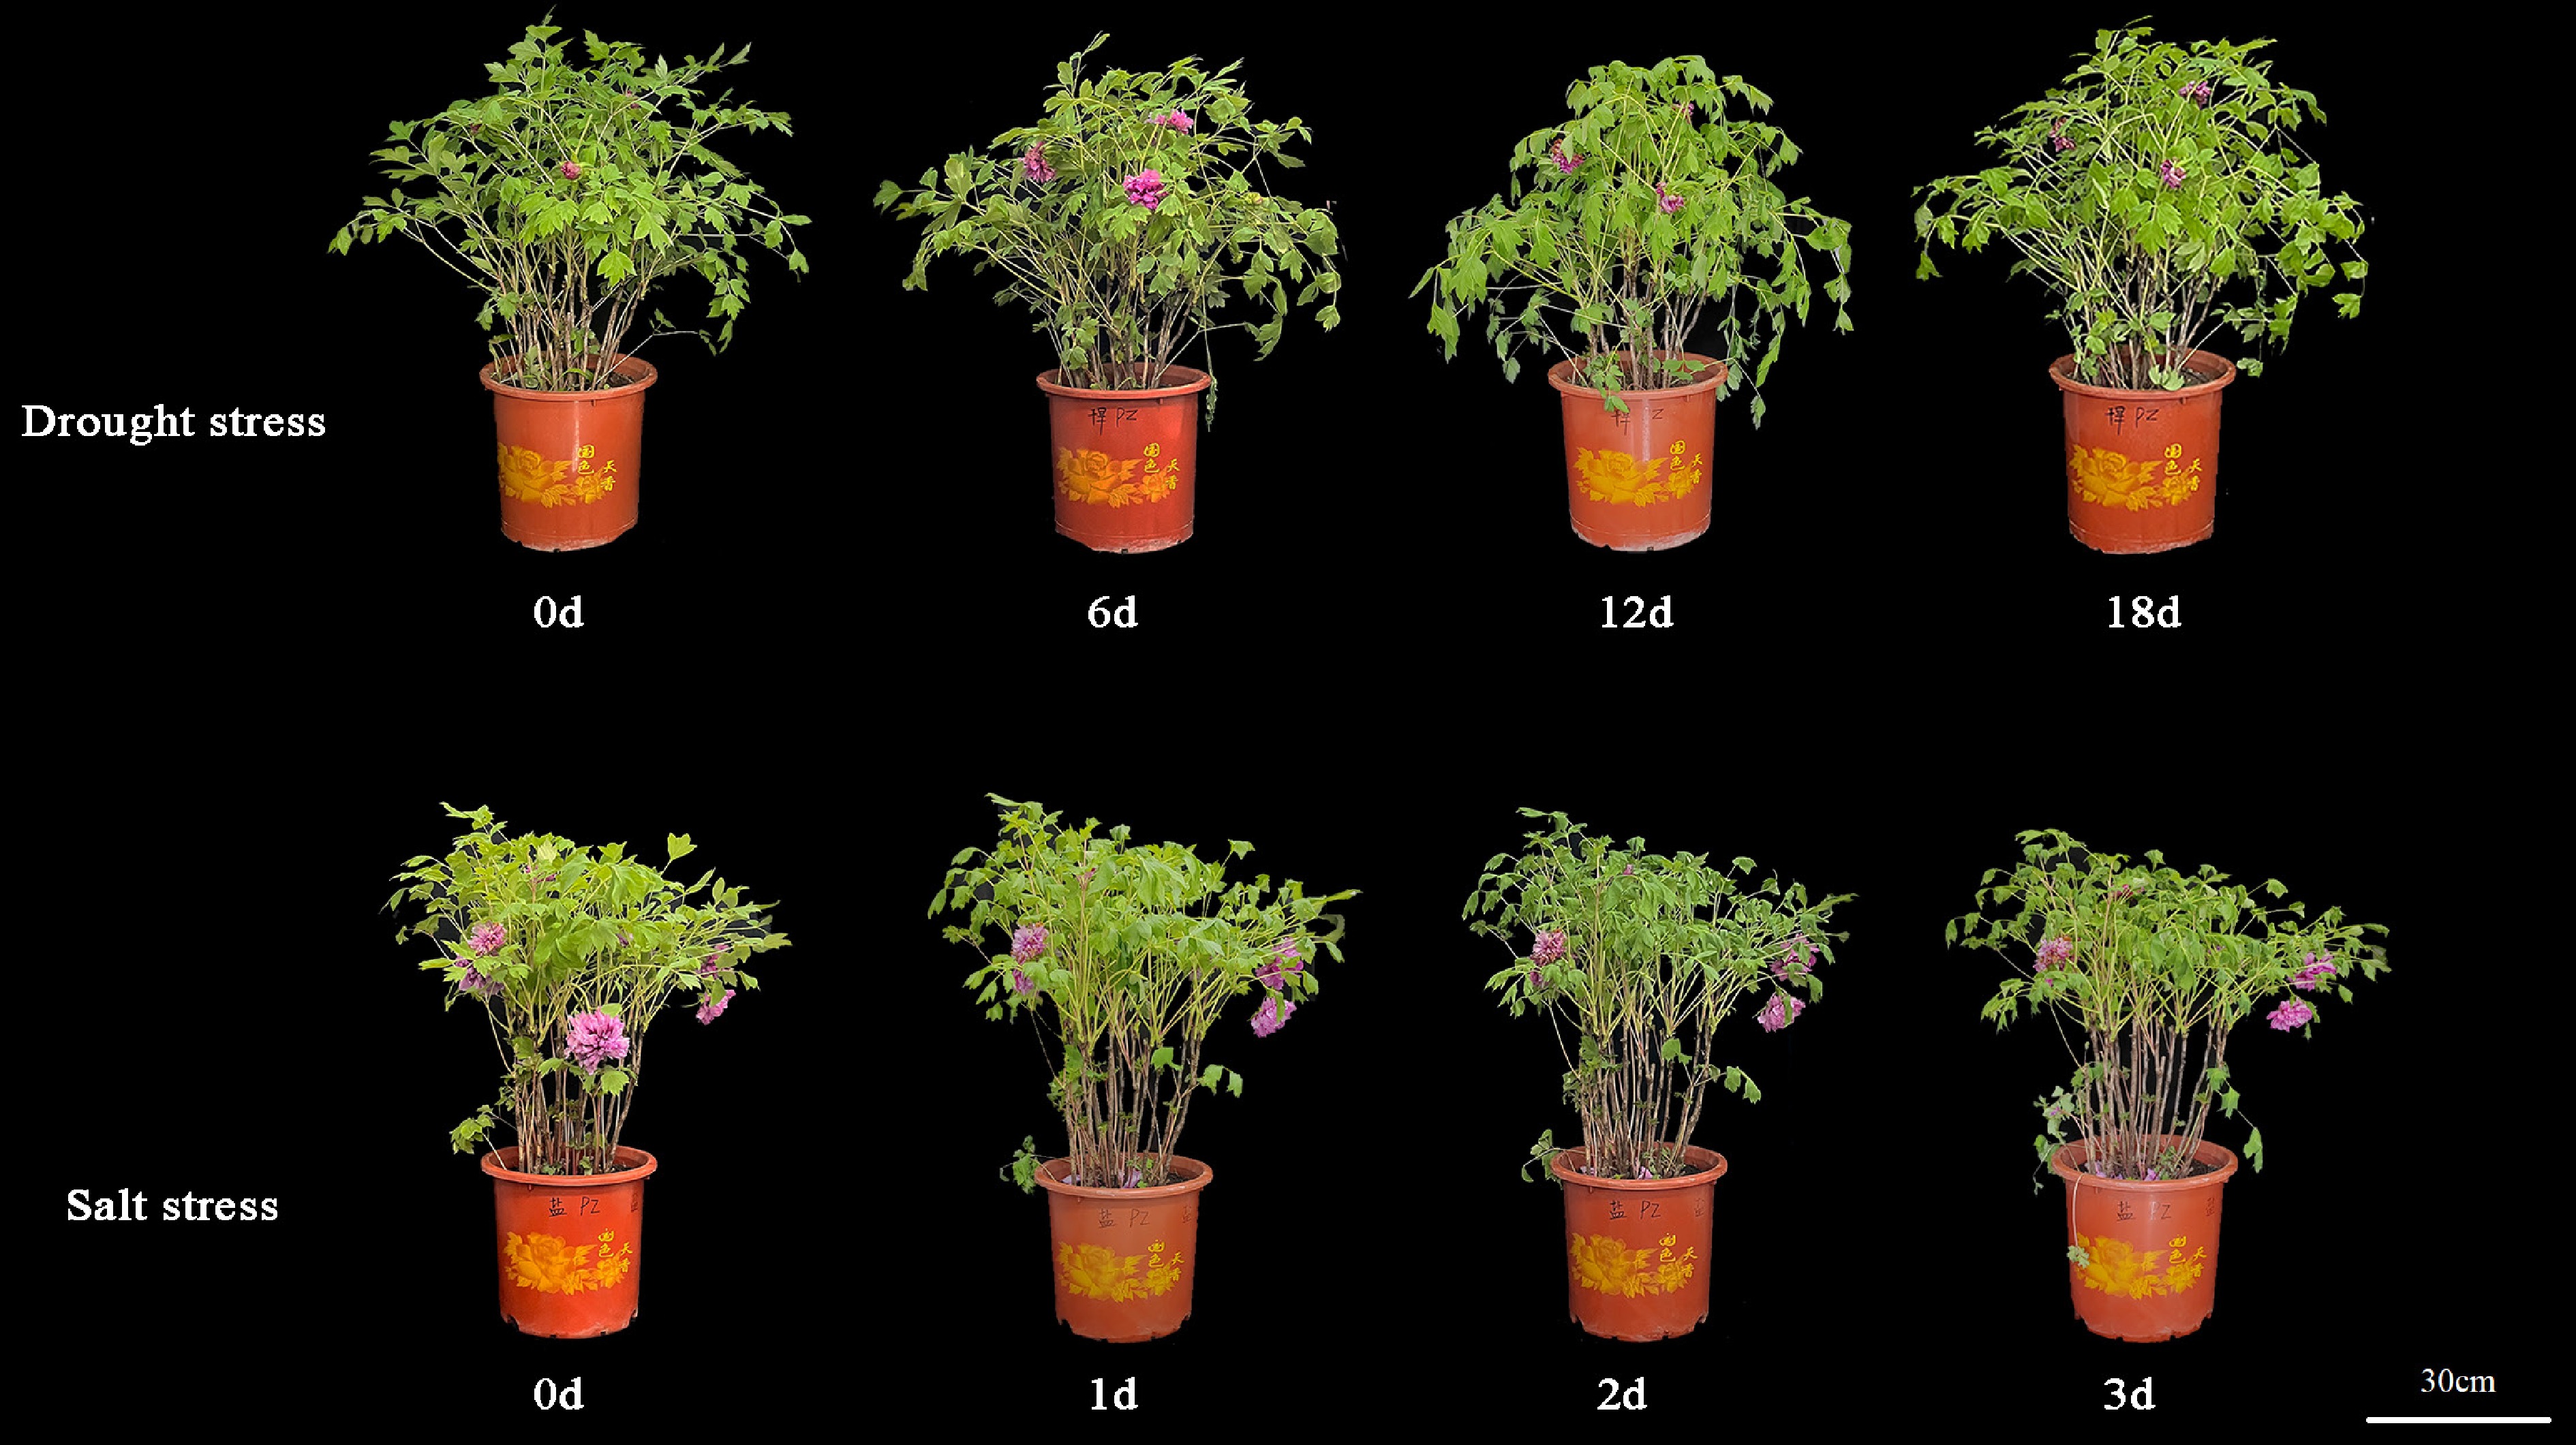
Figure 1.
Morphological differences of P. suffruticosa 'Luoyang Hong' plants under drought and salt stress. The numbers indicate days after treatment. The horizontal bar represents 30 cm.
-
-
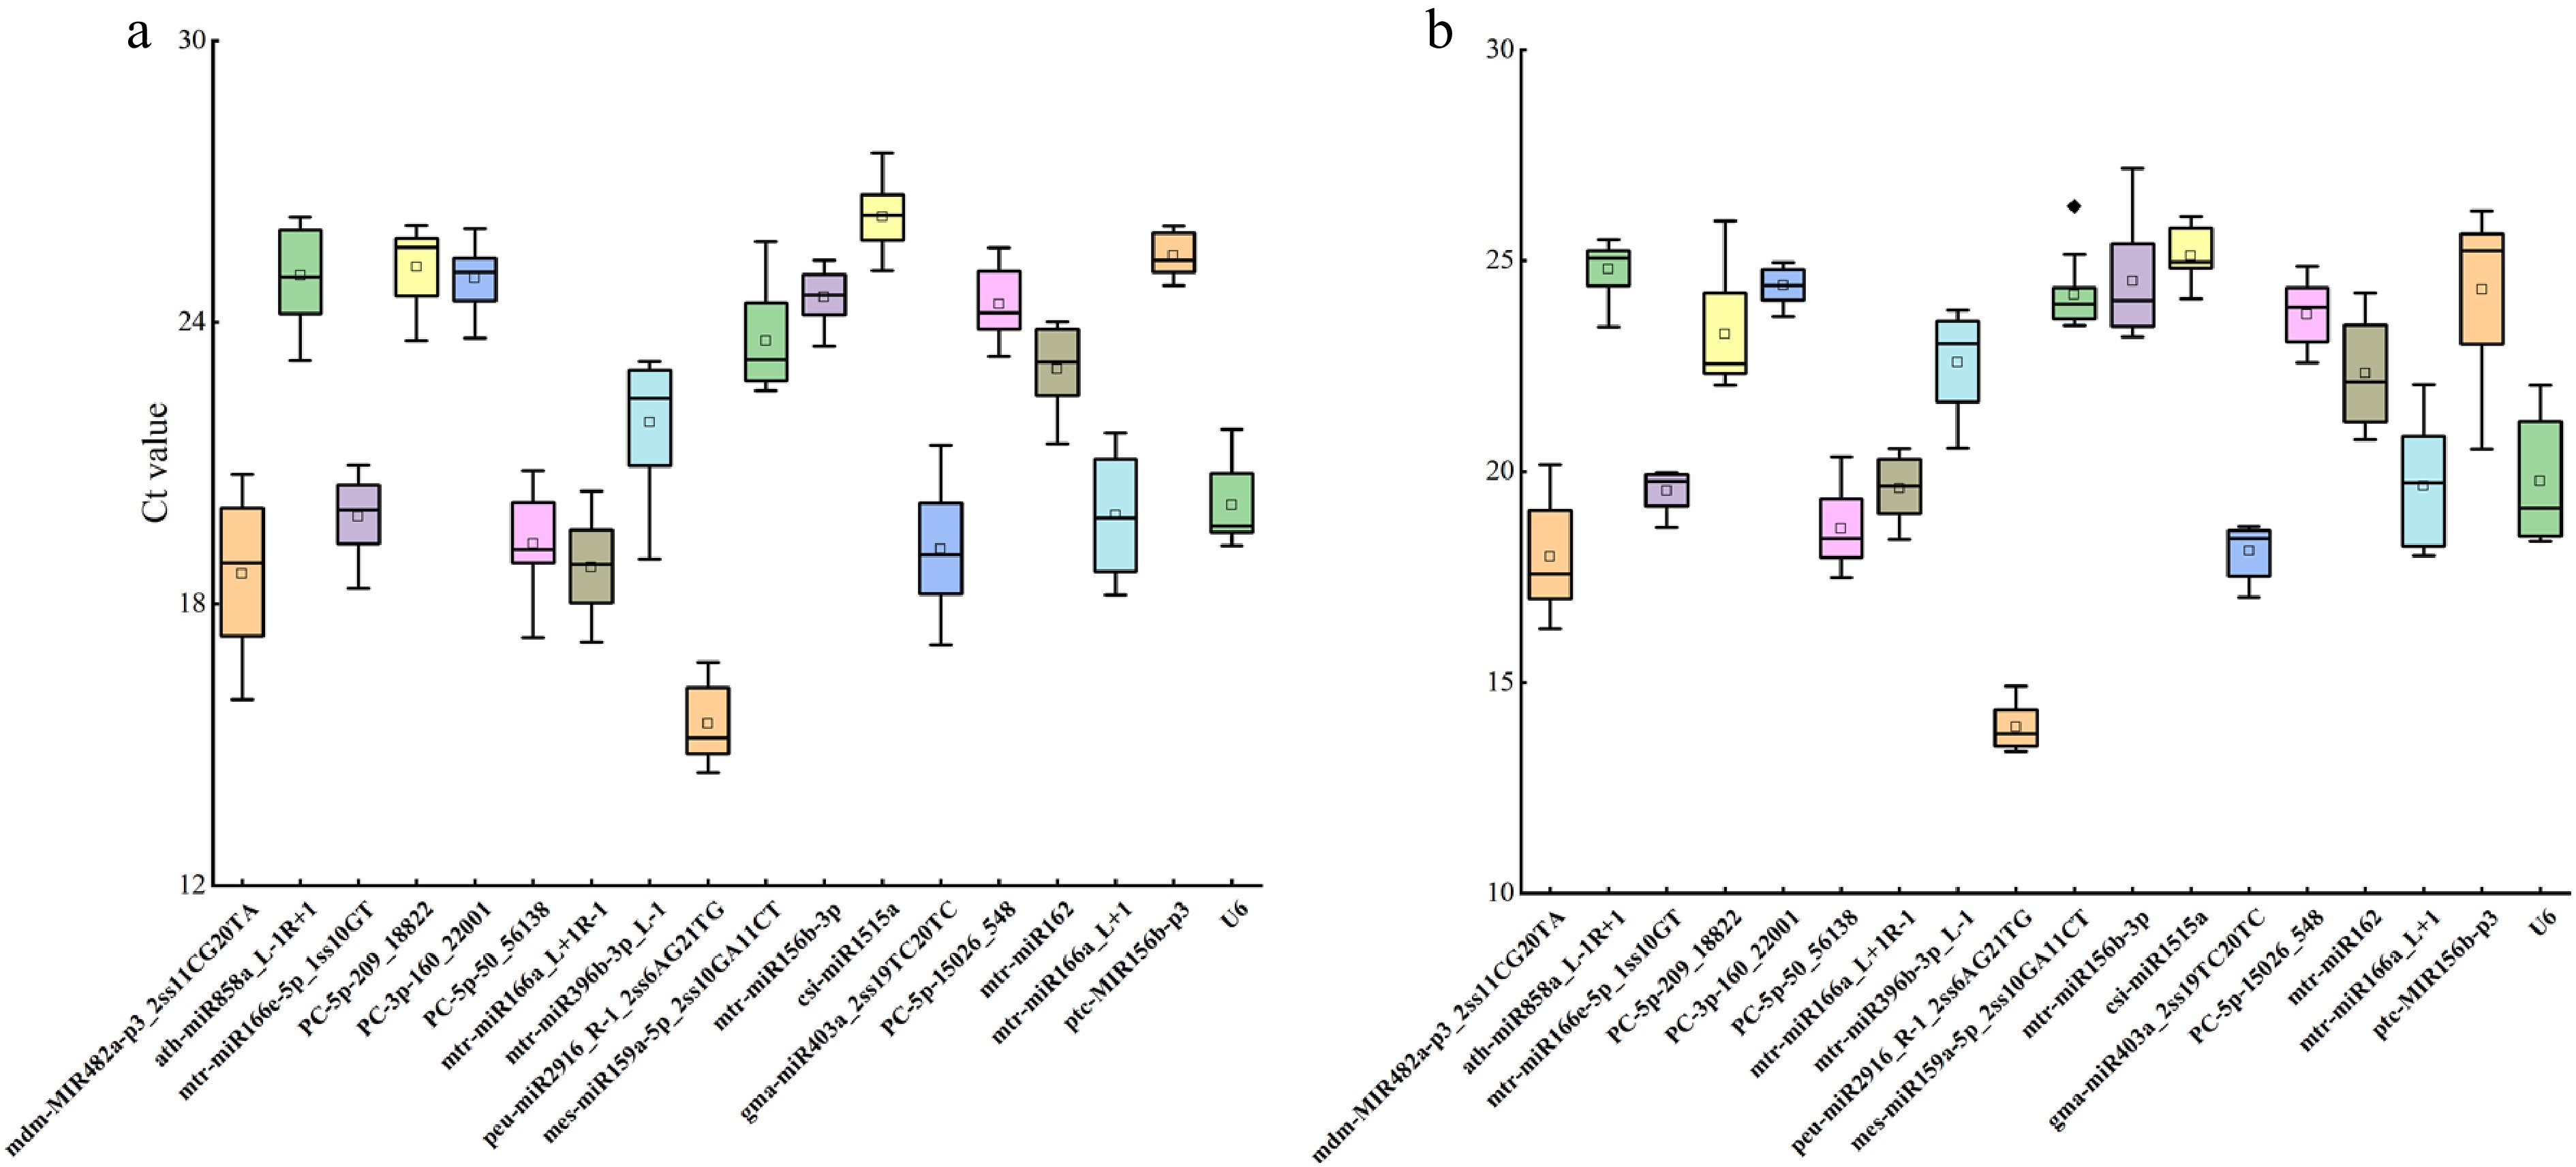
Figure 3.
Expression levels of miRNAs in 18 candidate parameters. (a) Expression levels under drought stress. (b) Expression levels under salt stress. Box-whisker plot showing the CT variation among 18 test samples. A line across the box depicts the median. In each box, the upper and lower edges indicate the 25th and 75th percentiles. Whiskers go from the minimal to maximal value or, if the distance from the first quartile to the minimum CT value is more than 1.5 times the interquartile range (IQR), from the smallest value included within the IQR to the first quartile.
-
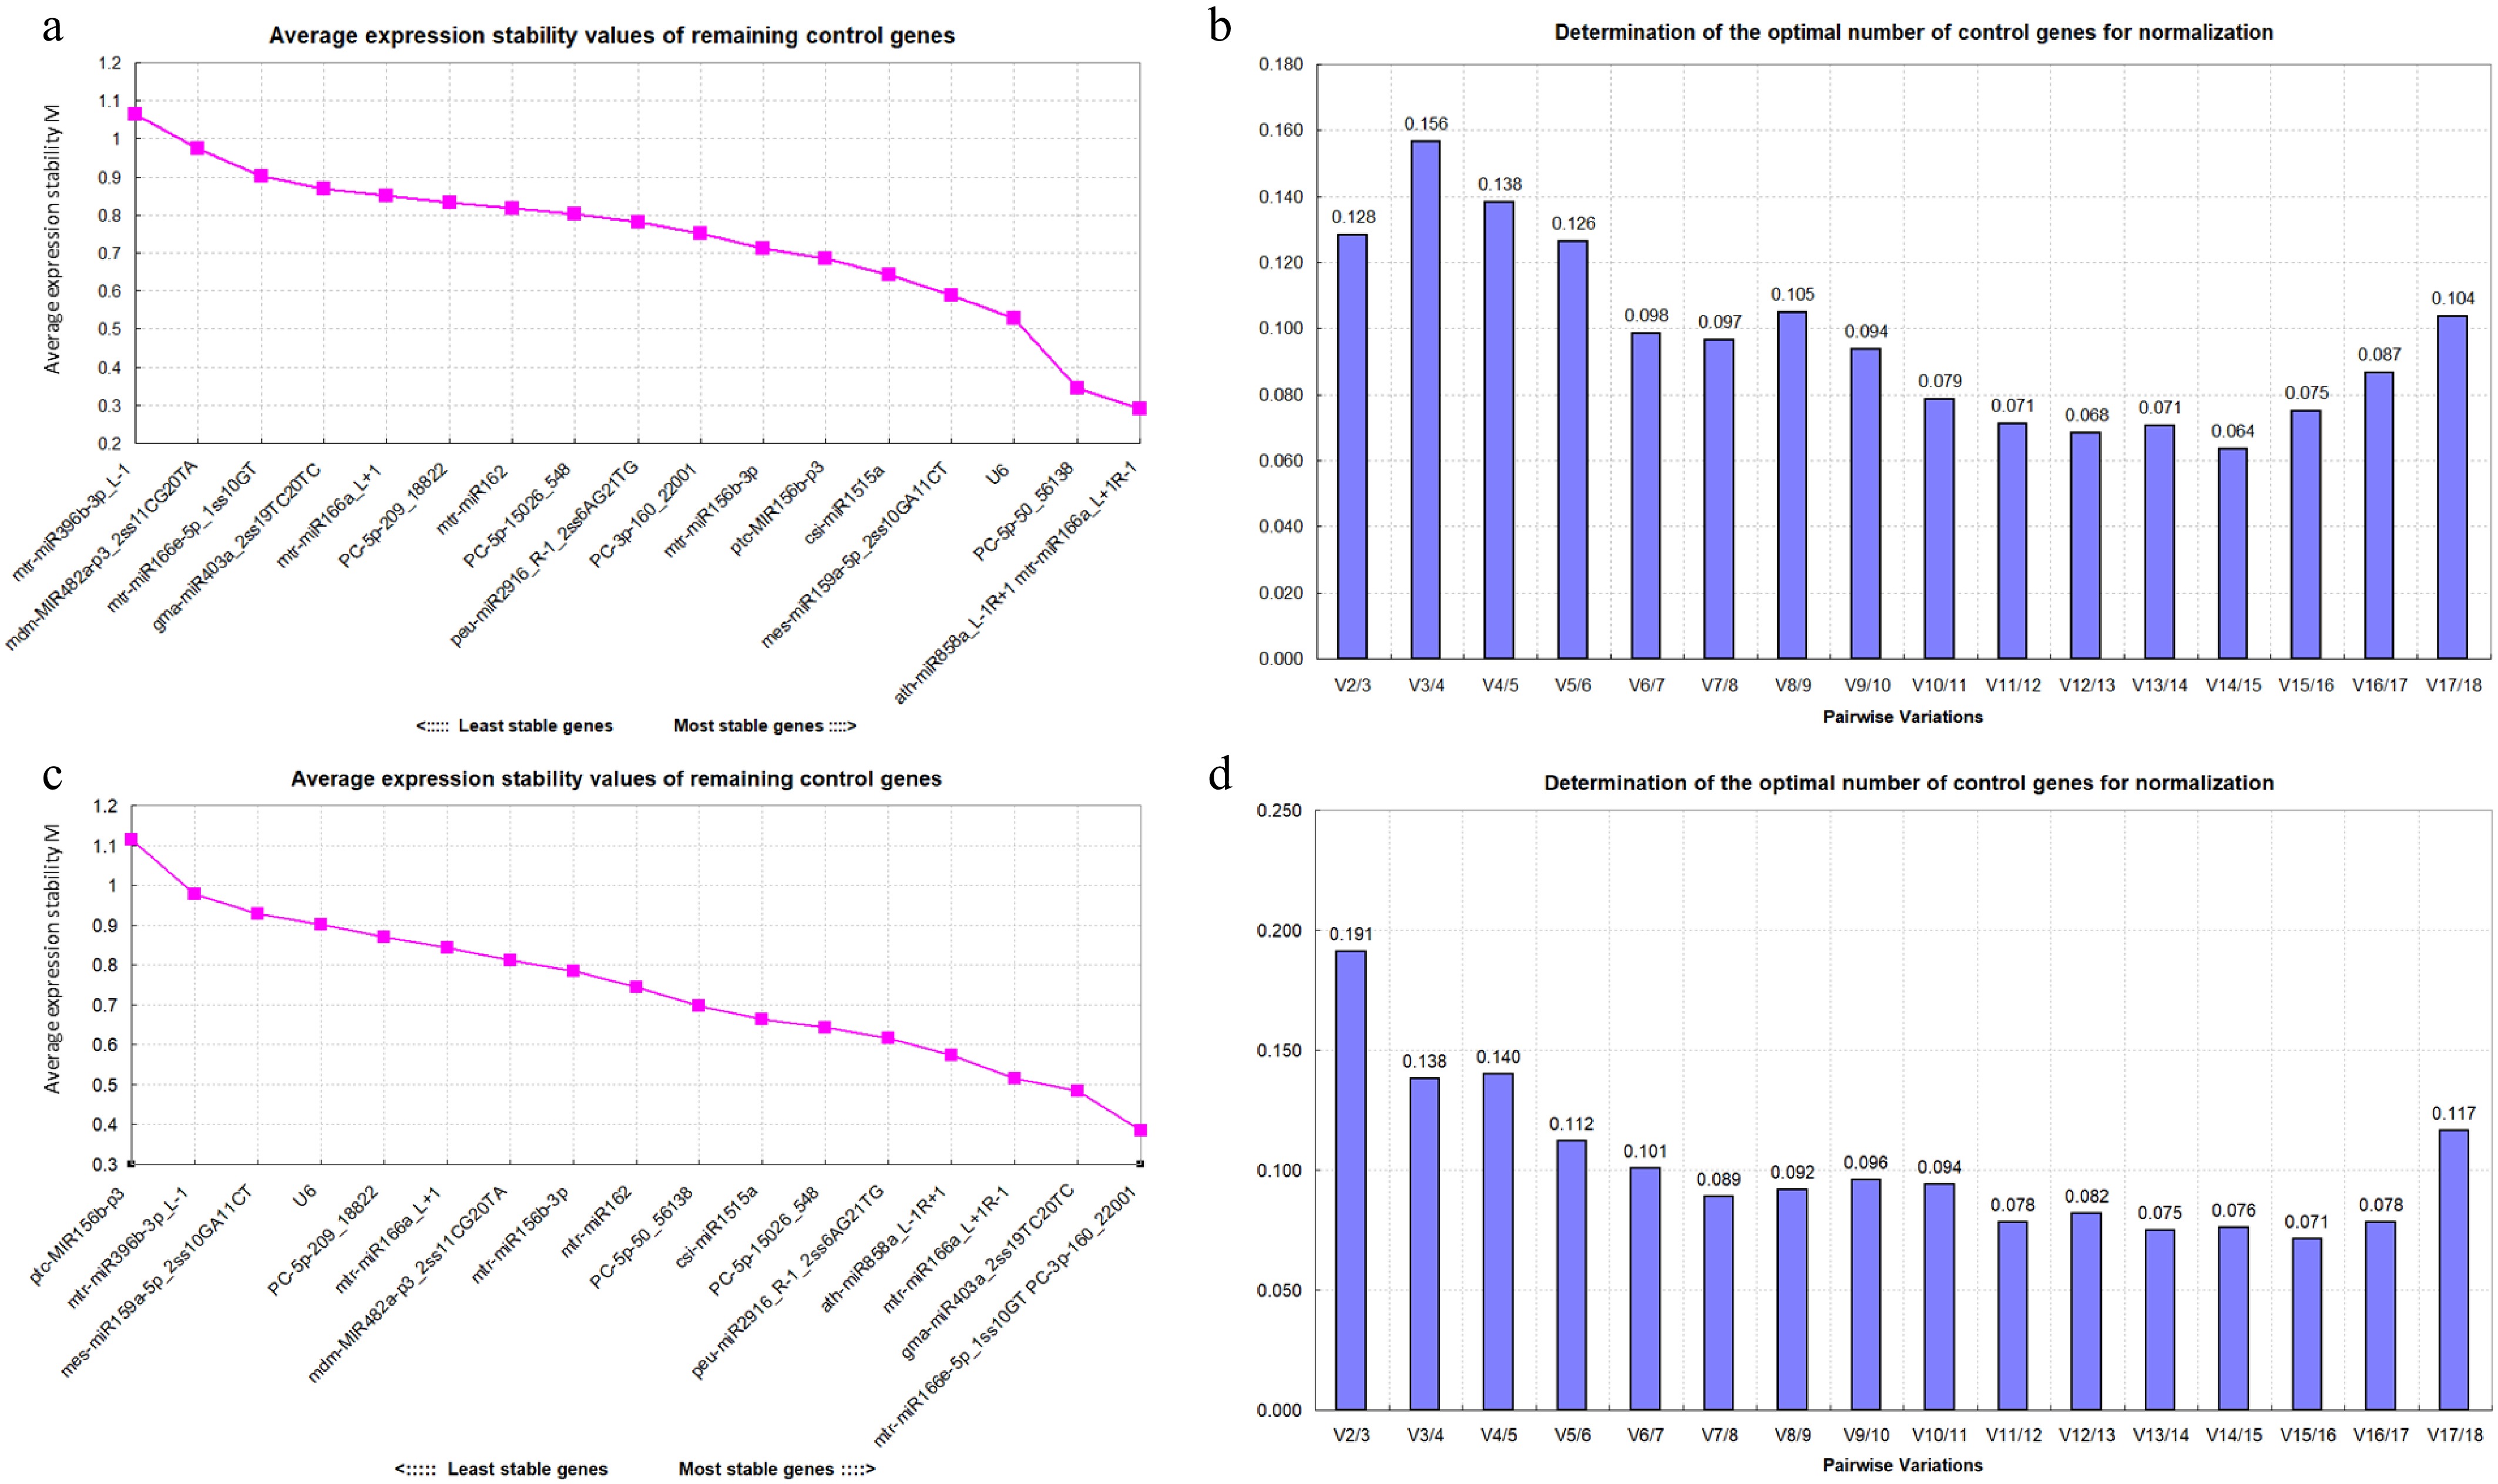
Figure 4.
(a) Expression stability of 18 candidate reference miRNAs analyzed in drought stress. The most stable miRNA is shown on the right and the least stable miRNA is shown on the left. (b) Pairwise variations of 18 candidate reference miRNAs in drought stress. (c) Expression stability of 18 candidate reference miRNAs analyzed in salt stress. The most stable miRNA is shown on the right and the least stable miRNA is shown on the left. (d) Pairwise variations of 18 candidate reference miRNAs in salt stress.
-
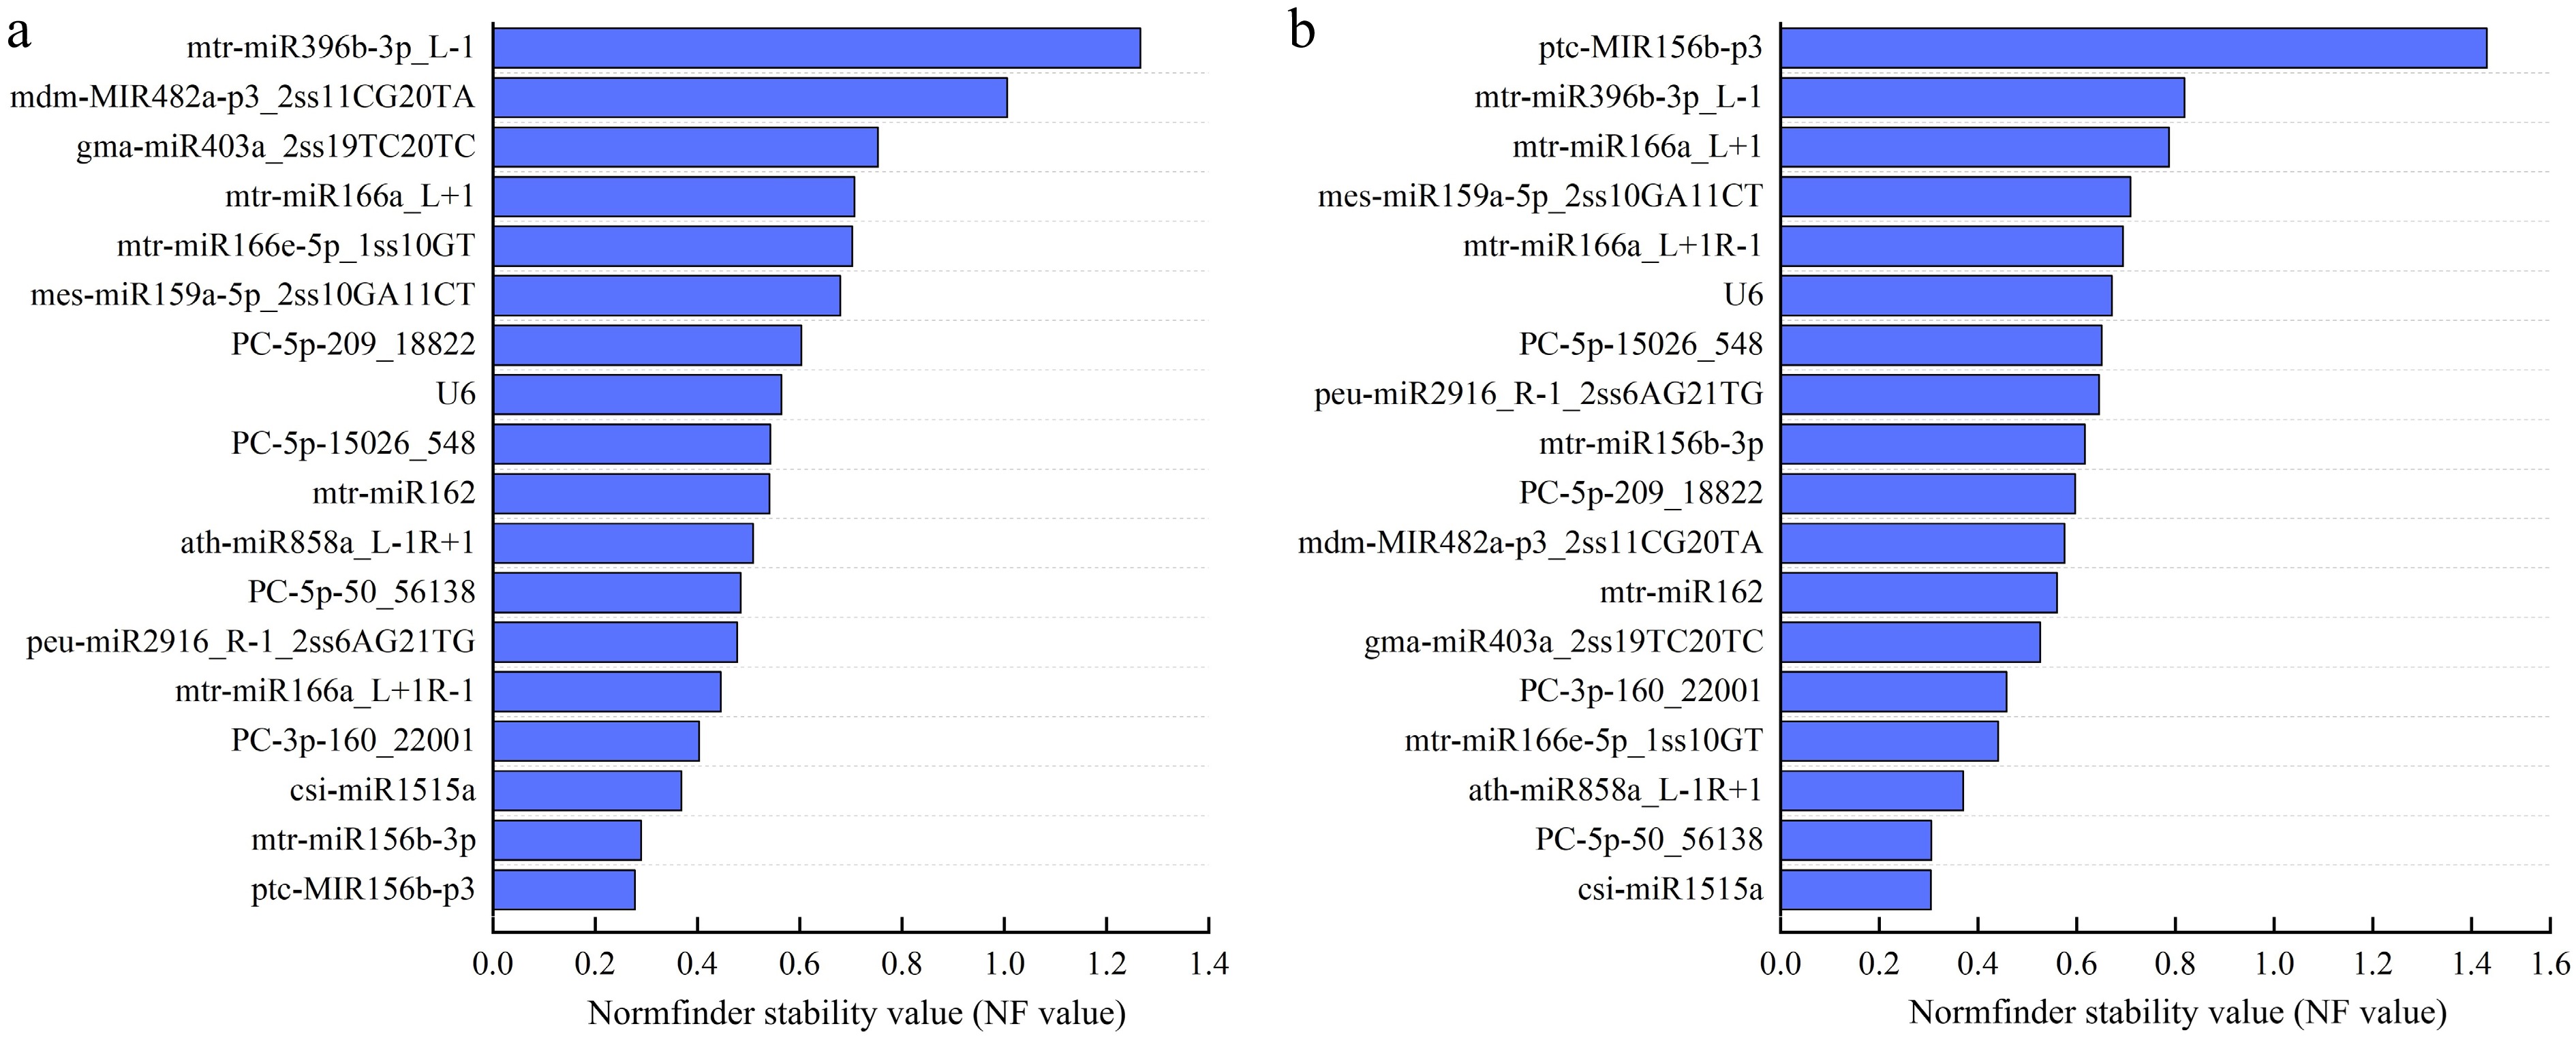
Figure 5.
Normfinder stability values of 18 candidate reference miRNAs. (a) Normfinder stability values under drought stress. (b) Normfinder stability values under salt stress. The abscissa represents different Normfinder stability values, and the ordinate represents different candidate reference miRNAs name.
-
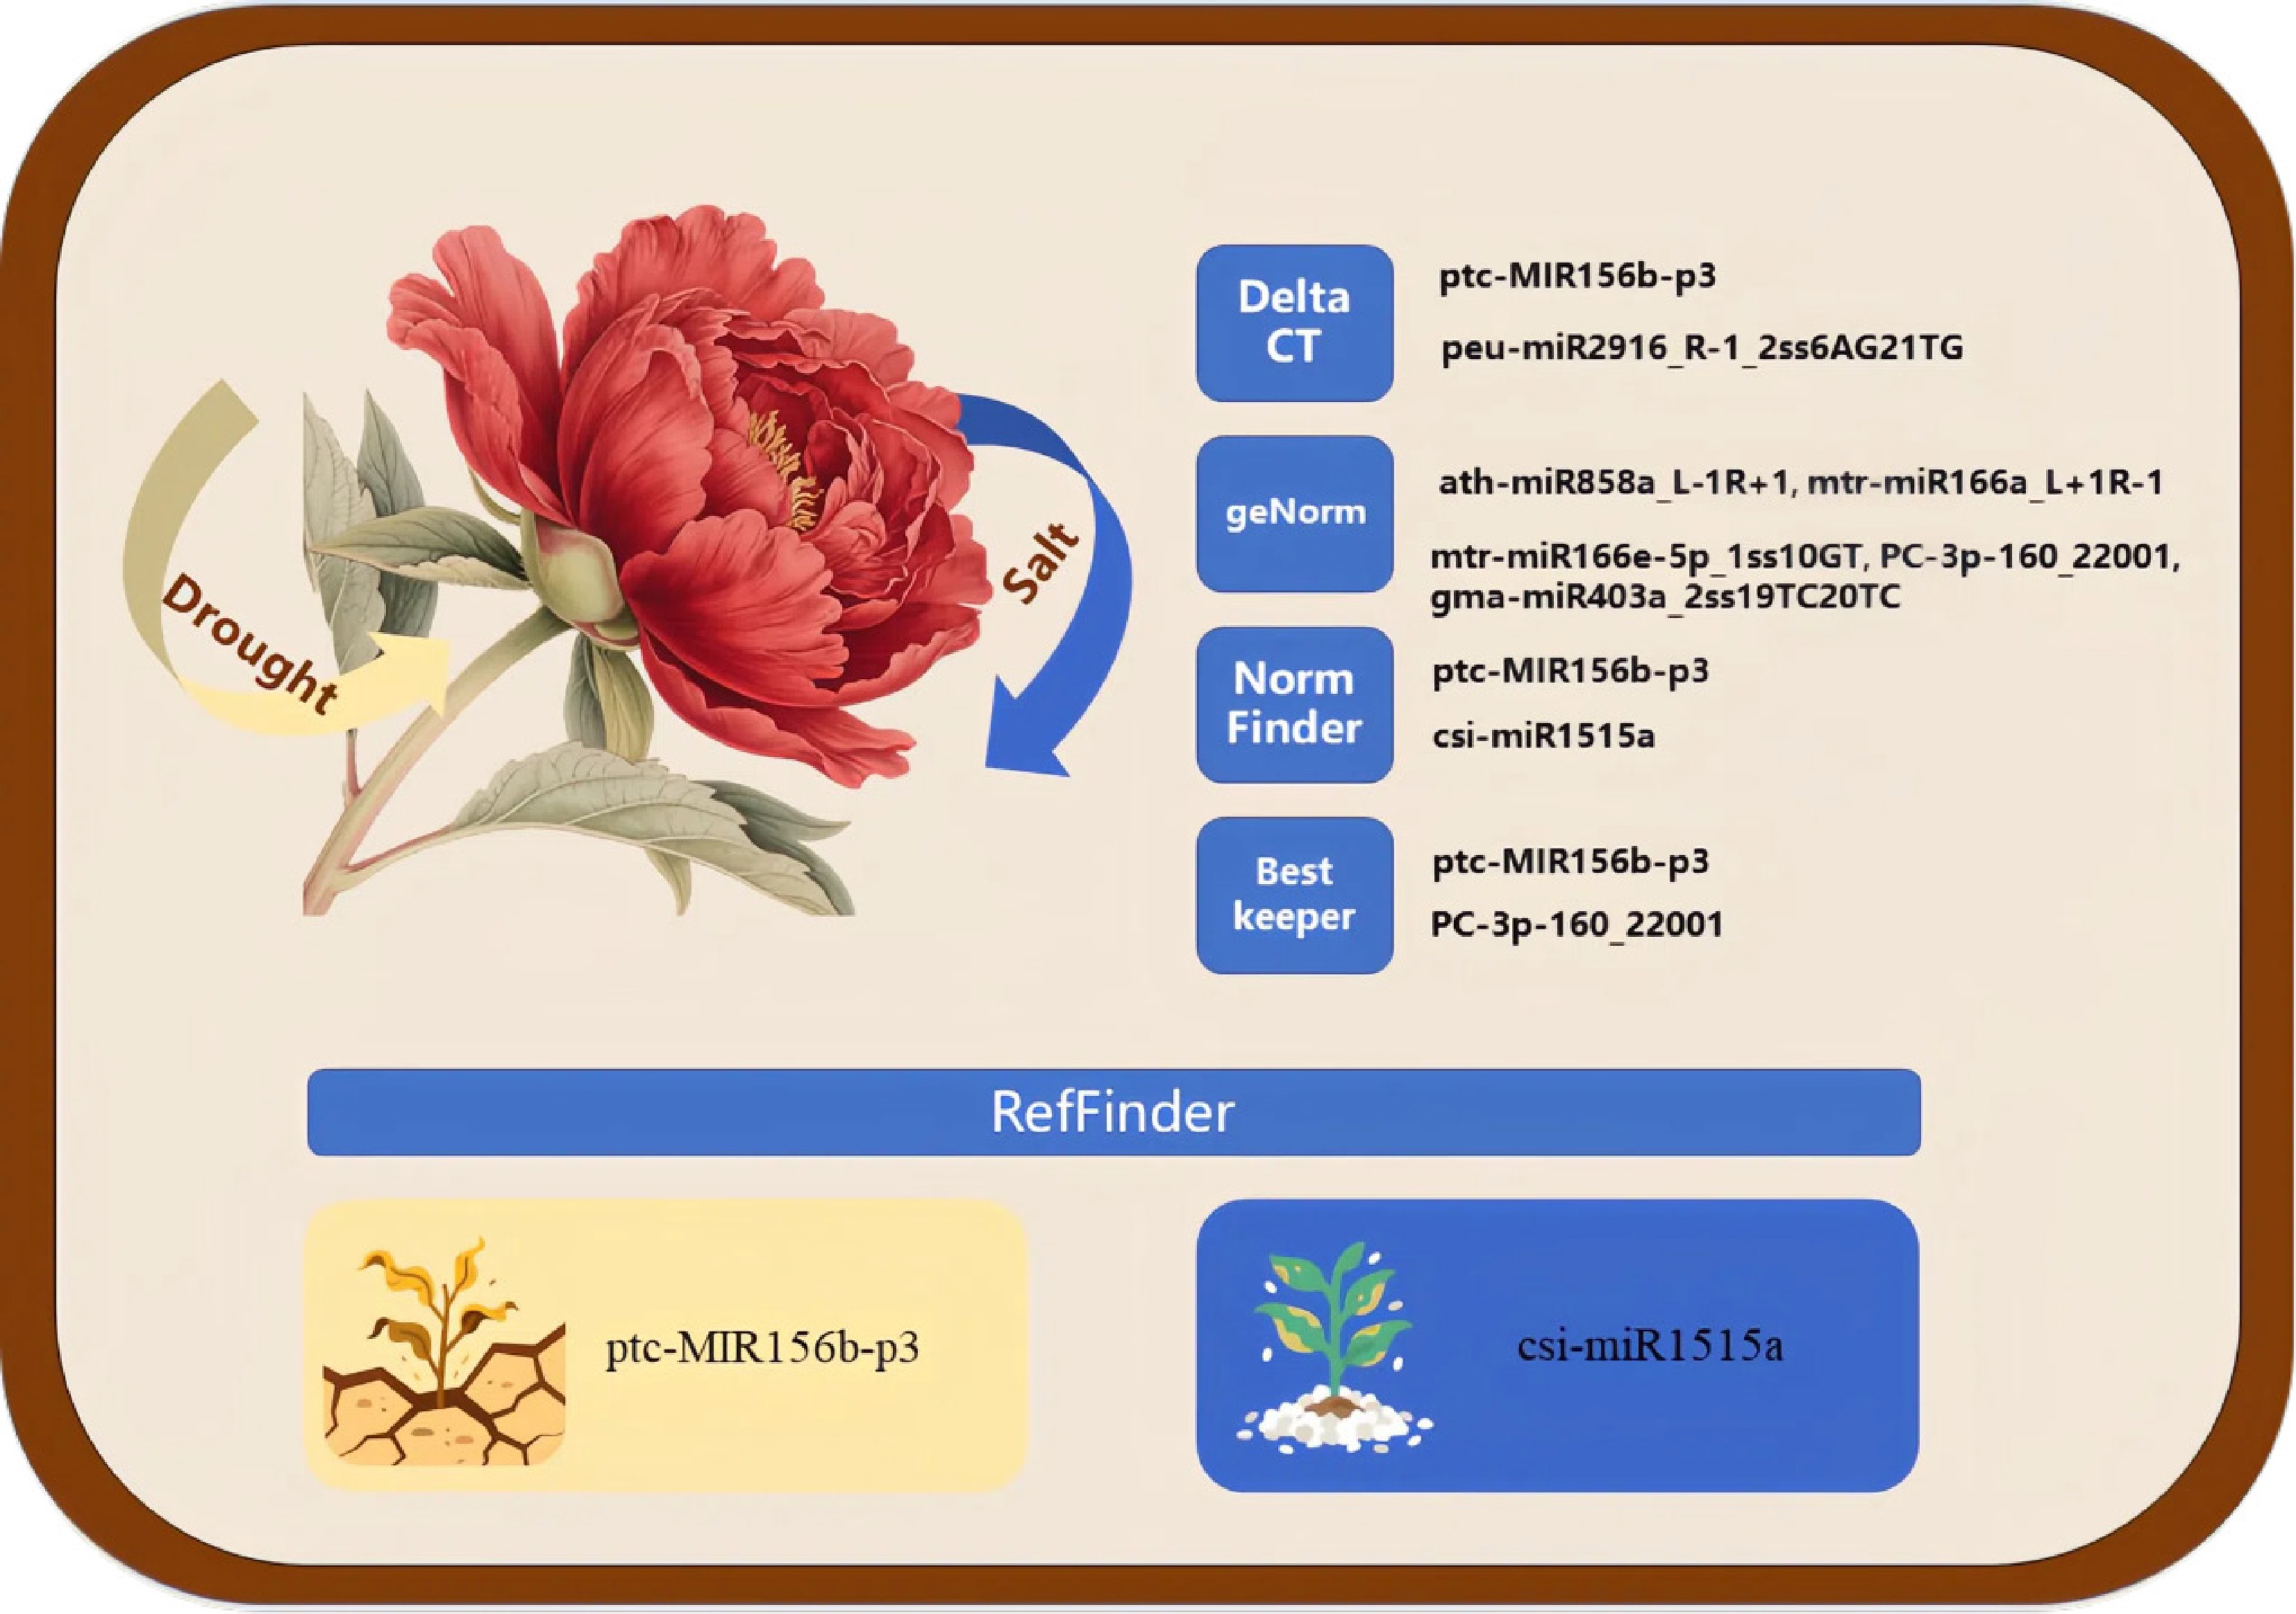
Figure 6.
Conceptual figure. The yellow and blue arrows represent drought stress and salt stress, respectively. The right panels show the optimal reference miRNAs identified by Delta CT, GeNorm, NormFinder, and BestKeeper analyses, respectively. The bottom panel displays the top-ranked reference miRNA determined by a comprehensive analysis with RefFinder.
-
miRNAs miRNA sequence (5'–3') Primer F sequence (5'–3') csi-miR1515a TCATTTTTGCGTGCAATGATCC CCCGTTTGCGTGCTATGATCC PC-5p-15026_548 TGCCCTCTTCTTTTCACCCATT CTGCCCTCTTCTTTTCACCCAT gma-miR403a_2ss19TC20TC TTAGATTCACGCACAAACCCG CCAGATTCACGCACAAACCC mtr-miR156b-3p TGCTCACTCTCTATCTGTCACC CCGCACTCTCTATCTGTCACC ptc-MIR156b-p3 TGCTCACTCTCTATCTGTCACC CCGCACTCTCTATCTGTCACC PC-5p-50_56138 TGACGGAGAGAGAGAGCACAC TGACGGAGAGAGAGAGCACAC mtr-miR166e-5p_1ss10GT GGAATGTTGTCTGGCTCGAGG GGAATGTTGTCTGGCTCGTGG mtr-miR166a_L+1R-1 CTCGGACCAGGCTTCATTCCC GTGTTCGGACCAGGCTTCATT PC-5p-209_18822 TTTGCATAGACCATCTAGCGG CCCTTGCATCGACCATCTAGC mtr-miR162 TCGATAAACCTCTGCATCCAG CCTCGATAAACCTCTGCGTCC mtr-miR166a_L+1 CTCGGACCAGGCTTCATTCCCC GCGCTCGGACCAGGCTTCATT PC-3p-160_22001 TTTACGTTGCCTTTCTTCCTC CCTTACCTTGCCTTTCTTCCTC mes-miR159a-5p_2ss10GA11CT AGCTGCTGAATTATGGATCCC GGGCTGGCTGCTGAATTATGG peu-miR2916_R-1_2ss6AG21TG TGGGGGCTCGAAGACGATCAGA CTGAATTGGGGGCTCGAAGAC ath-miR858a_L-1R+1 TTCGTTGTCTGTTCGACCTTG CCCGTTGTCTGTTCTACCTTG mdm-MIR482a-p3_2ss11CG20TA TCTTCCCAAGGCCGCCCATACC TTATTCCCAAGGCCGCCCAT mtr-miR396b-3p_L-1 TTCAATAAAGCTGTGGGAAG GGTCAATAAGGCTGTGGGAAG U6 (snRNA) ACAGAGAAGATTAGCATGGCC Table 1.
Primers sequence of 18 candidate RGs for qRT-PCR.
-
miRNAs CV (%) SD r Rank ptc-MIR156b-p3 1.45 0.37 0.745 1 mtr-miR156b-3p 1.93 0.47 0.542 2 PC-3p-160_22001 1.98 0.50 0.711 3 csi-miR1515a 2.14 0.56 0.723 4 PC-5p-15026_548 2.60 0.63 0.324 5 PC-5p-209_18822 2.88 0.73 0.423 6 peu-miR2916_R-1_2ss6AG21TG 4.72 0.73 0.592 7 mtr-miR162 3.23 0.74 0.351 8 PC-5p-50_56138 4.03 0.78 0.631 9 U6(snRNA) 3.87 0.78 0.847 10 mtr-miR166e-5p_1ss10GT 4.00 0.79 0.487 11 mtr-miR166a_L+1R-1 4.25 0.80 0.701 12 ath-miR858a_L-1R+1 3.62 0.91 0.713 13 mes-miR159a-5p_2ss10GA11CT 3.86 0.91 0.242 14 gma-miR403a_2ss19TC20TC 5.65 1.08 0.946 15 mtr-miR166a_L+1 5.64 1.12 0.844 16 mtr-miR396b-3p_L-1 5.55 1.21 0.092 17 mdm-MIR482a-p3_2ss11CG20TA 7.16 1.33 0.881 18 Table 2.
Bestkeeper analyzed the miRNAs sequencing of 18 candidate internal parameters in drought stress.
-
miRNAs CV (%) SD r Rank PC-3p-160_22001 1.47 0.36 0.400 1 mtr-miR166e-5p_1ss10GT 2.21 0.43 0.636 2 peu-miR2916_R-1_2ss6AG21TG 3.13 0.44 −0.005 3 csi-miR1515a 2.08 0.52 0.774 4 ath-miR858a_L-1R+1 2.10 0.52 0.752 5 gma-miR403a_2ss19TC20TC 2.94 0.53 0.311 6 mes-miR159a-5p_2ss10GA11CT 2.35 0.57 0.182 7 mtr-miR166a_L+1R-1 2.96 0.58 0.105 8 PC-5p-15026_548 2.71 0.64 0.190 9 PC-5p-50_56138 4.16 0.78 0.933 10 mtr-miR396b-3p_L-1 4.31 0.97 0.299 11 mtr-miR162 4.69 1.05 0.846 12 mtr-miR156b-3p 4.43 1.09 0.910 13 mdm-MIR482a-p3_2ss11CG20TA 6.21 1.12 0.944 14 PC-5p-209_18822 4.97 1.16 0.866 15 mtr-miR166a_L+1 6.43 1.26 0.823 16 U6(snRNA) 6.67 1.32 0.889 17 ptc-MIR156b-p3 7.26 1.76 0.446 18 Table 3.
Bestkeeper analyzed the miRNAs sequencing of 18 candidate internal parameters in salt stress.
-
Rank RefFinder Geometric mean 1 ptc-MIR156b-p3 2.06 2 mtr-miR156b-3p 2.51 3 mtr-miR166a_L+1R-1 3.66 4 PC-5p-50_56138 4.05 5 csi-miR1515a 4.43 6 PC-3p-160_22001 5.51 7 ath-miR858a_L-1R+1 6.36 8 U6(snRNA) 8.11 9 peu-miR2916_R-1_2ss6AG21TG 8.82 10 PC-5p-15026_548 9.2 11 mtr-miR166a_L+1 10.18 12 mtr-miR162 10.54 13 PC-5p-209_18822 10.89 14 mes-miR159a-5p_2ss10GA11CT 11.56 15 gma-miR403a_2ss19TC20TC 11.58 16 mtr-miR166e-5p_1ss10GT 14.34 17 mdm-MIR482a-p3_2ss11CG20TA 17.24 18 mtr-miR396b-3p_L-1 17.74 Table 4.
The 18 candidate internal parameters were sorted by comprehensive miRNAs analysis in drought stress.
-
Rank RefFinder Geometric mean 1 csi-miR1515a 2.83 2 PC-3p-160_22001 2.94 3 mtr-miR166e-5p_1ss10GT 3.36 4 PC-5p-50_56138 3.66 5 gma-miR403a_2ss19TC20TC 3.83 6 ath-miR858a_L-1R+1 3.87 7 mtr-miR166a_L+1R-1 5.94 8 peu-miR2916_R-1_2ss6AG21TG 6.67 9 mtr-miR162 8.76 10 PC-5p-15026_548 9.96 11 mdm-MIR482a-p3_2ss11CG20TA 9.96 12 mtr-miR156b-3p 10.89 13 PC-5p-209_18822 12.01 14 mes-miR159a-5p_2ss10GA11CT 12.4 15 mtr-miR166a_L+1 15.19 16 U6(snRNA) 15.2 17 mtr-miR396b-3p_L-1 15.25 18 ptc-MIR156b-p3 18 Table 5.
The 18 candidate internal parameters were sorted by comprehensive miRNAs analysis in salt stress.
Figures
(6)
Tables
(5)