-
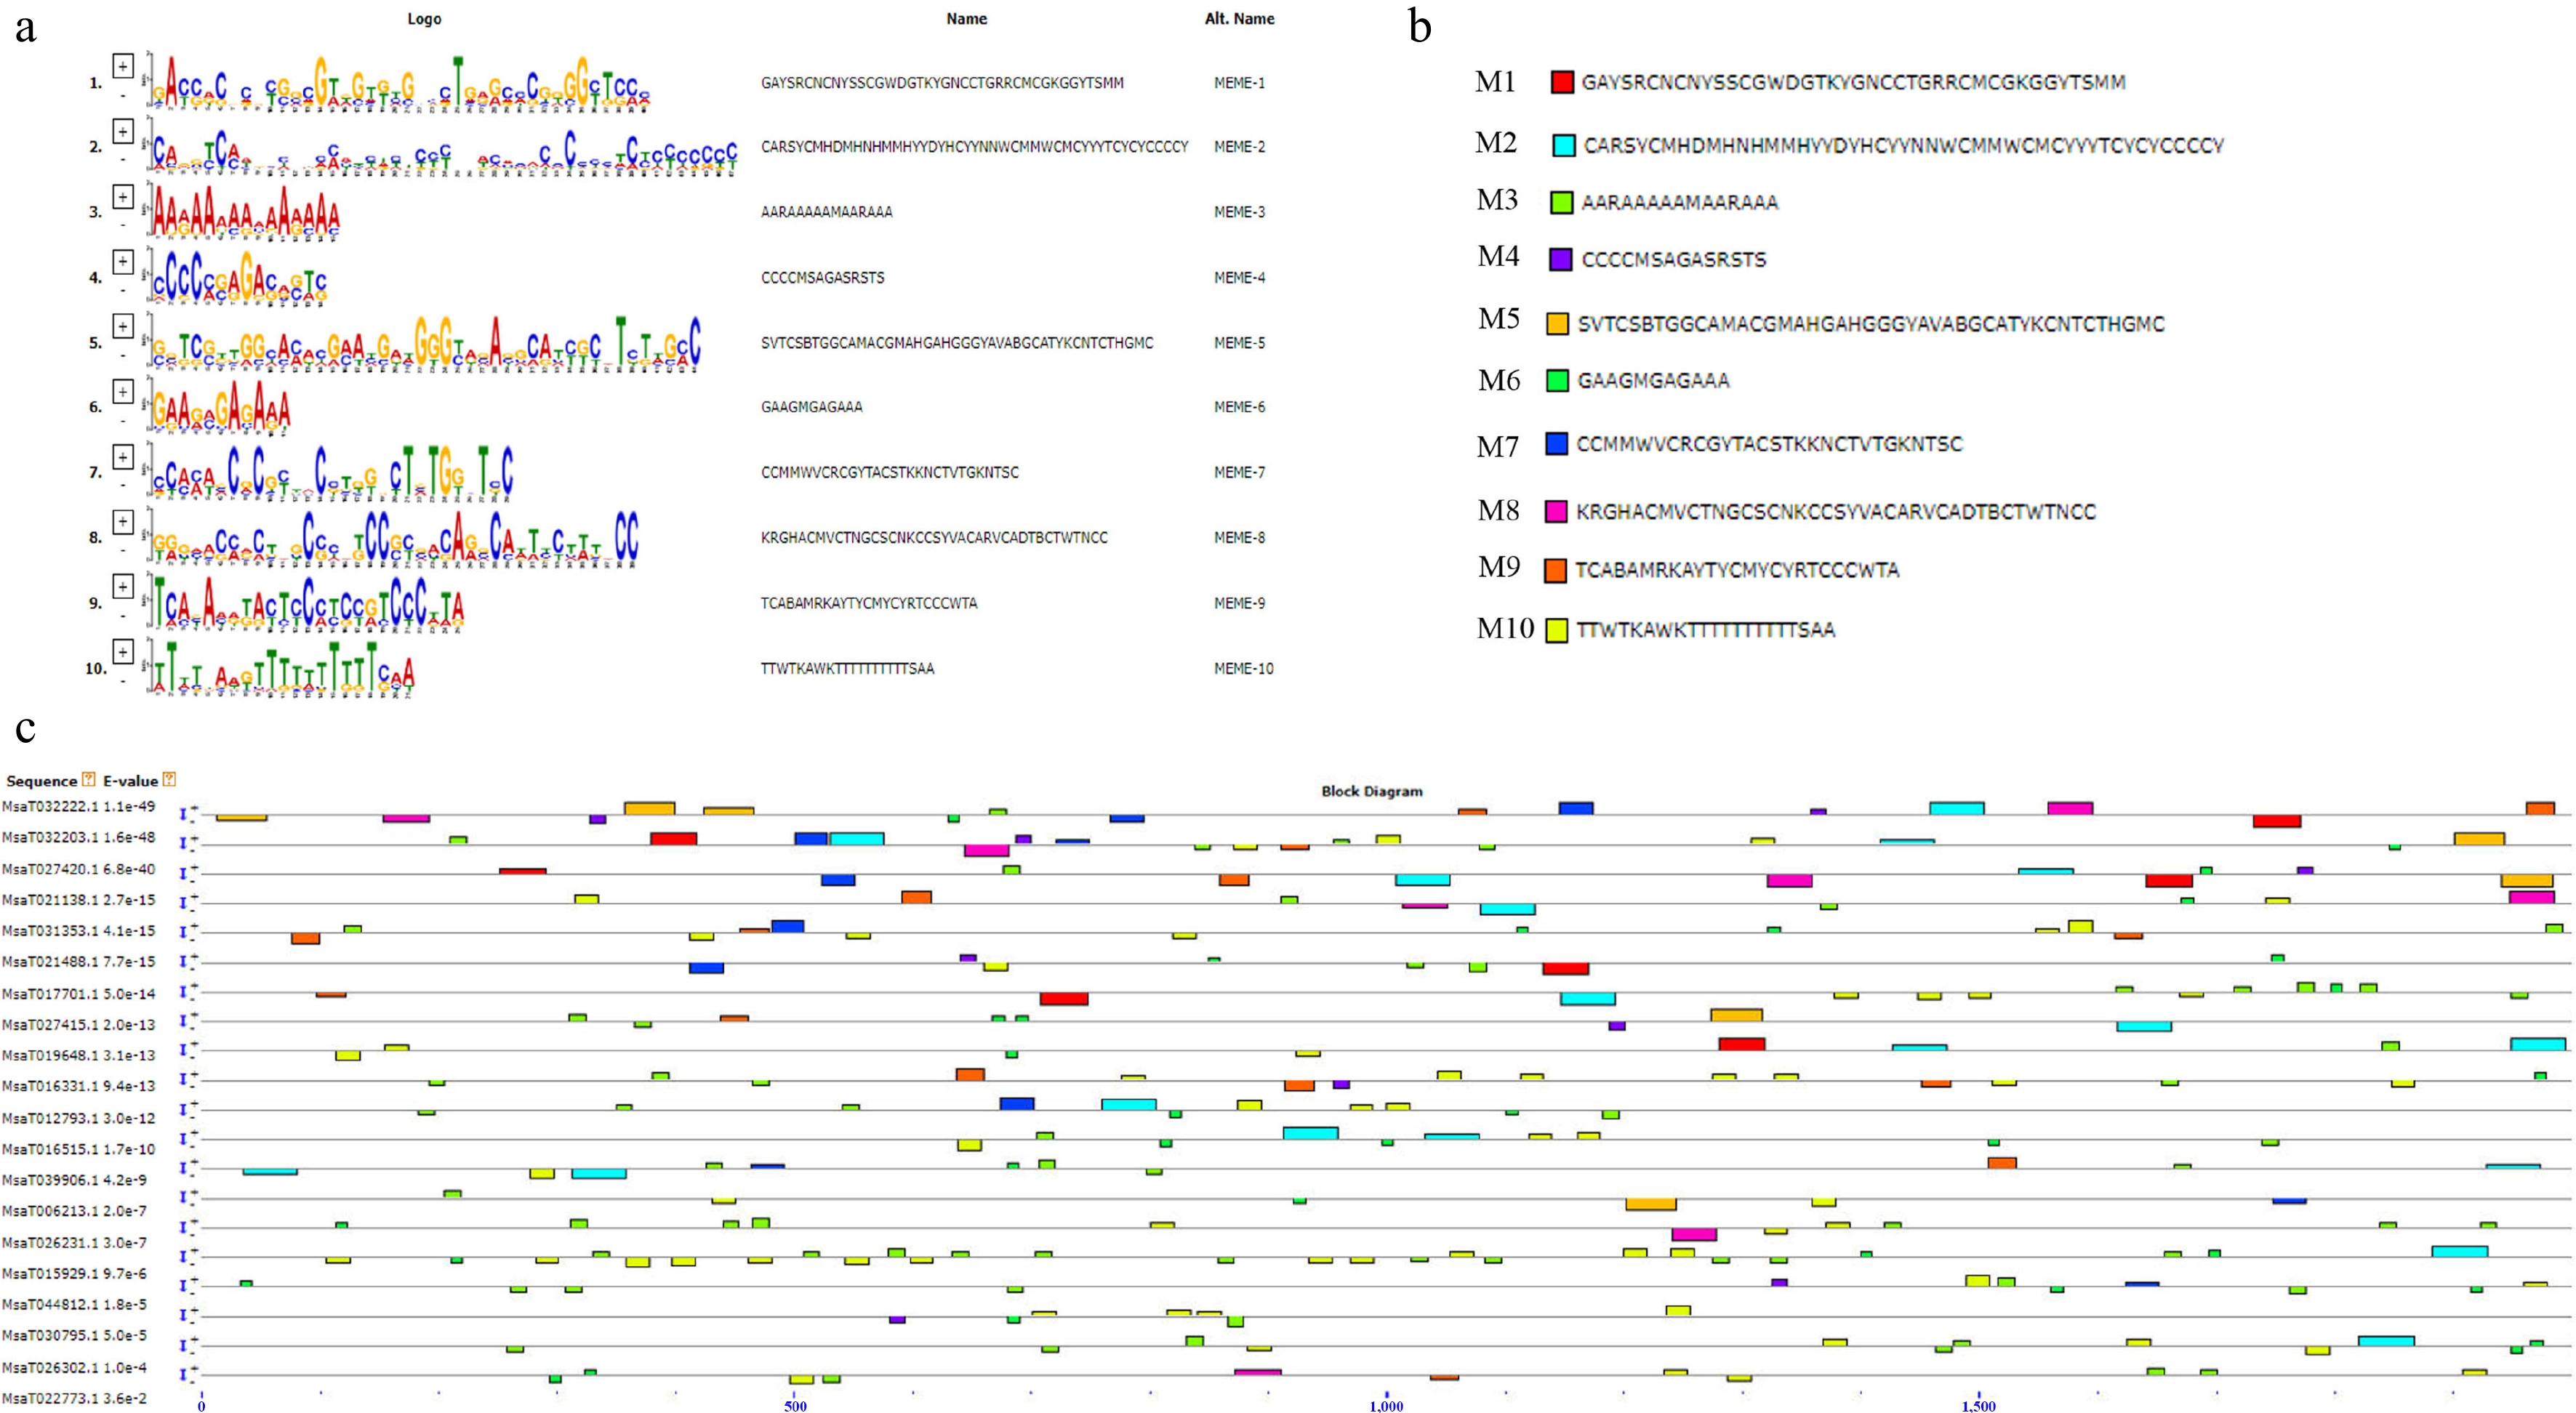
Figure 1.
Sequence logos and promoter distributions of ten candidate motifs in 20 high-expression genes (HEGs). (a) Sequence logos for the ten candidate motifs. (b) Color key for motif identities. (c) Promoter-localized motif occurrences across the 20 HEGs.
-
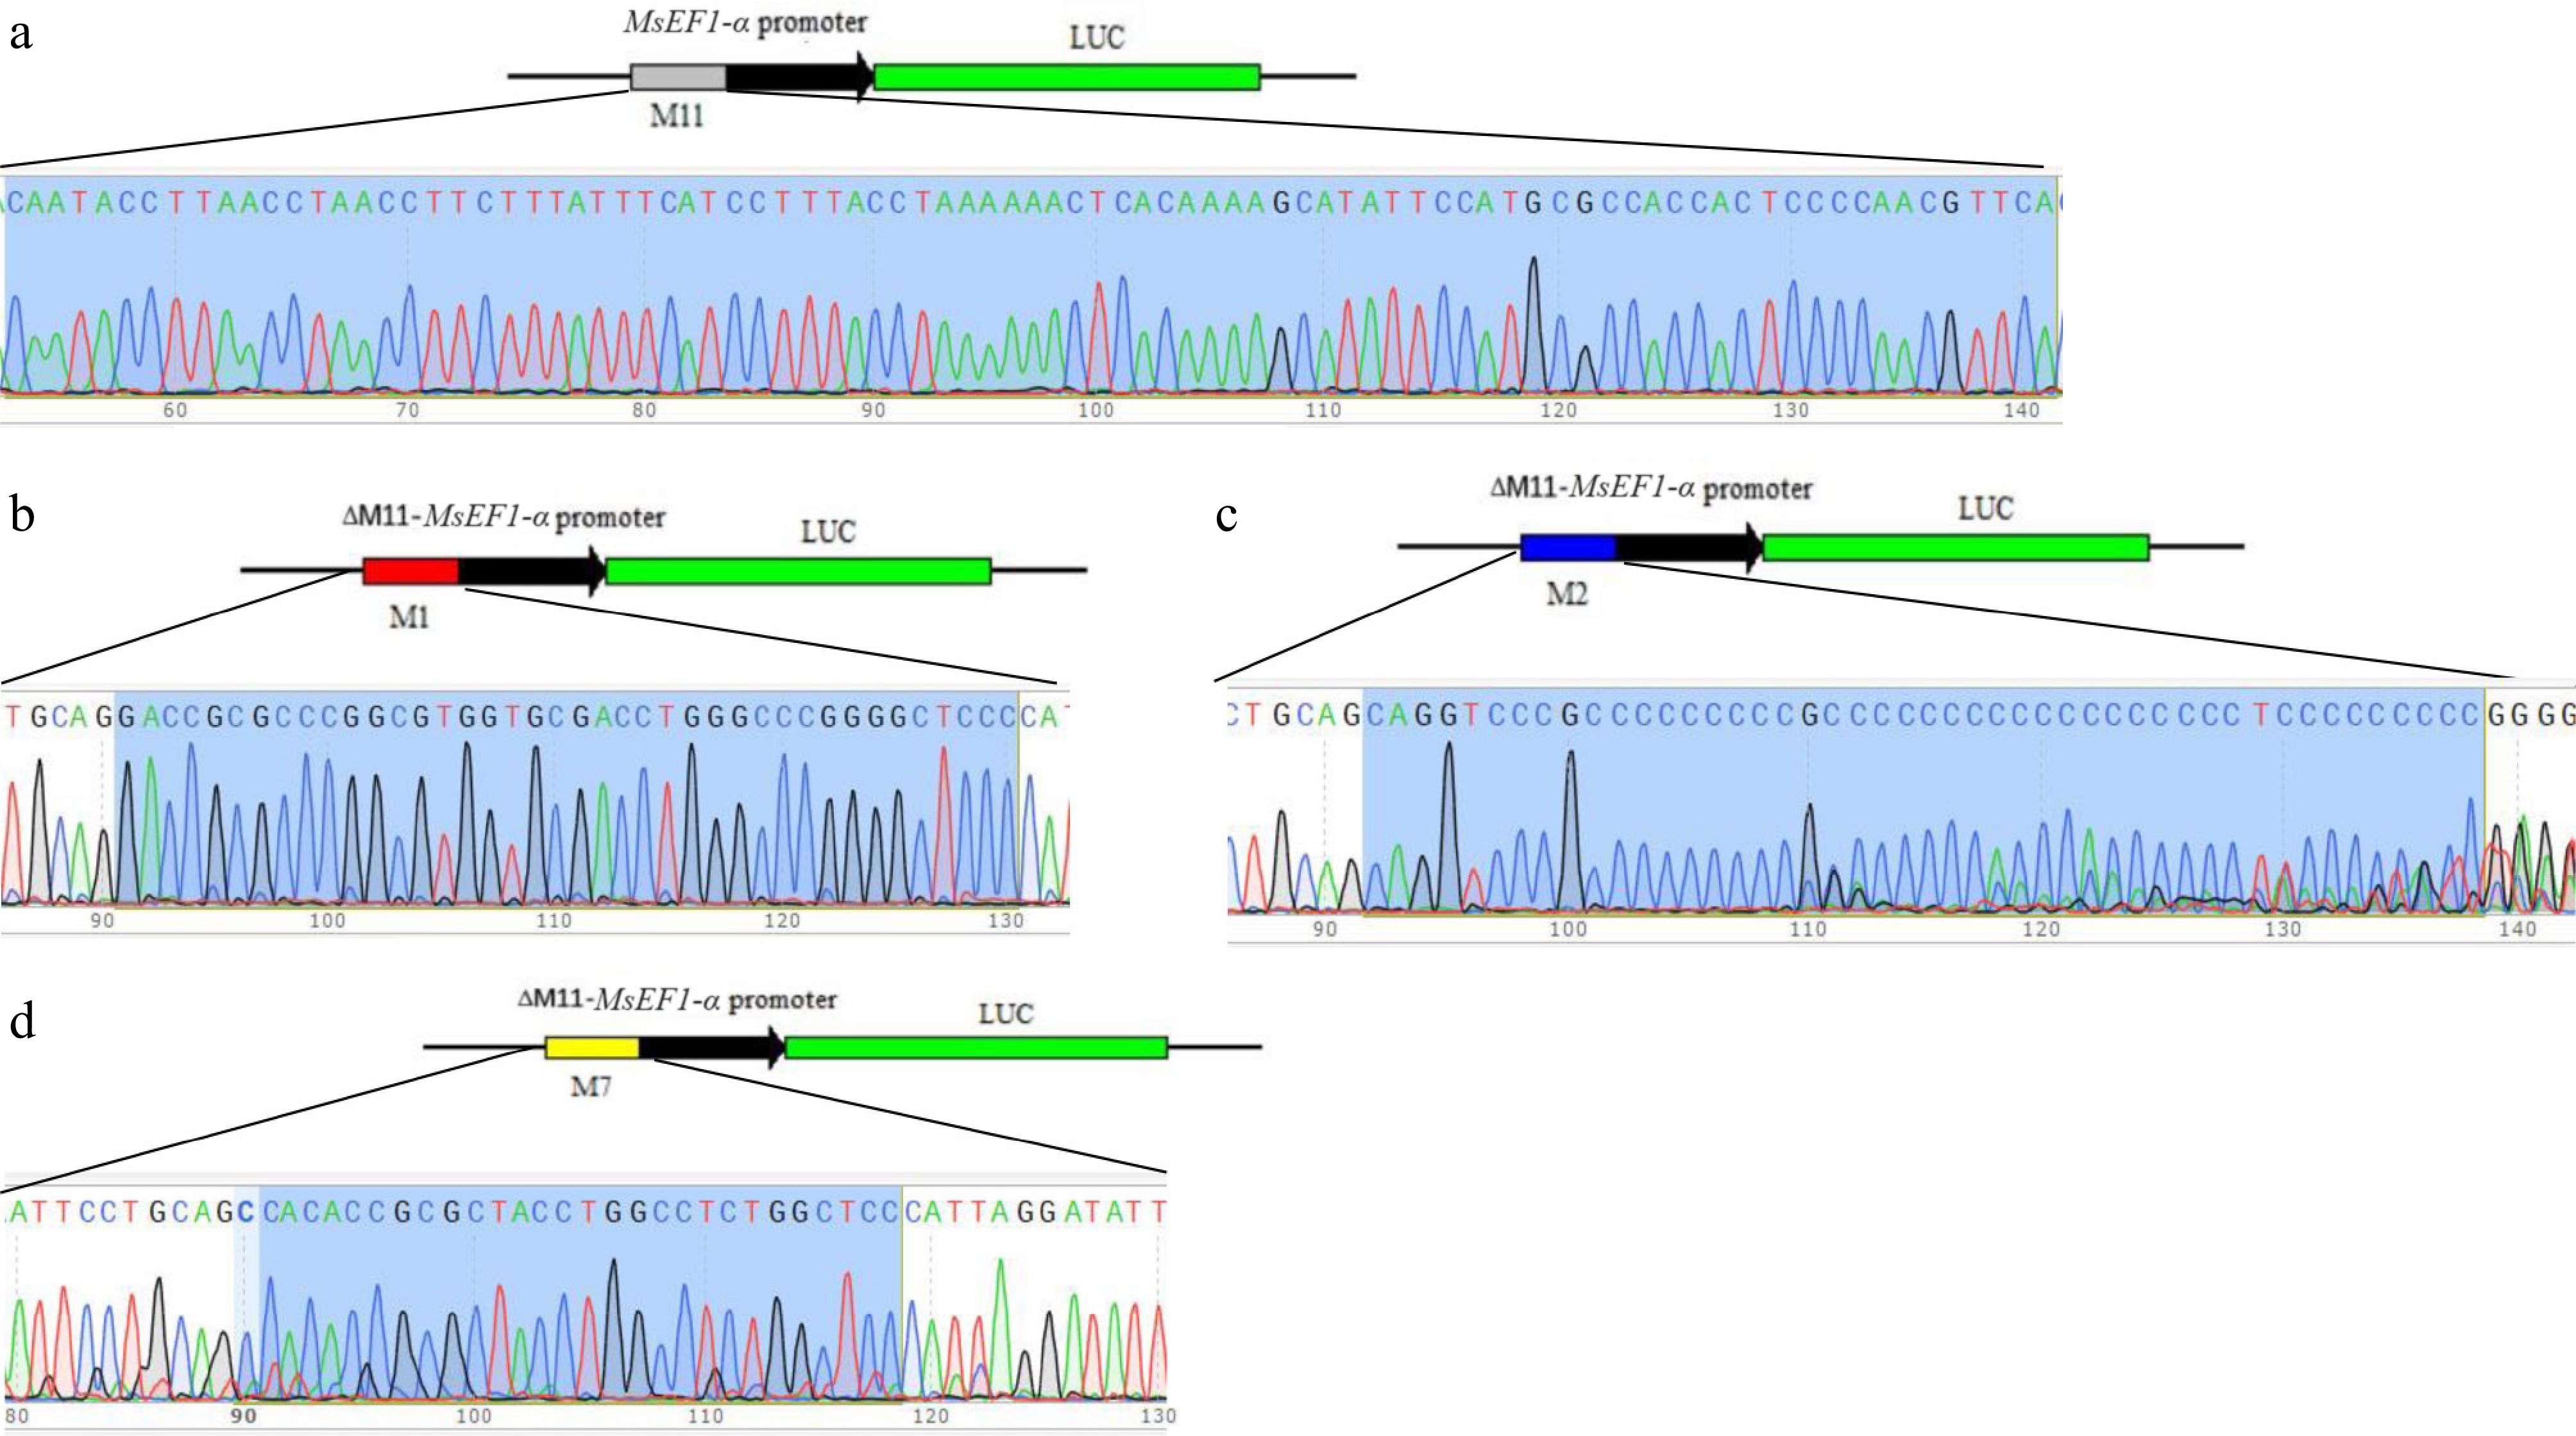
Figure 2.
Sanger sequencing validation of candidate motifs in the recombinant MsEF1-α promoter-LUC plasmid. (a) M11 motif (gray box) in MsEF1-αPro::LUC. (b) M1 motif (red box) in M1-ΔM11-MsEF1-αPro::LUC. (c) M2 motif (blue box) in M2-ΔM11-MsEF1-αPro::LUC. (d) M7 motif (yellow box) in M7-ΔM11-MsEF1-αPro::LUC.
-
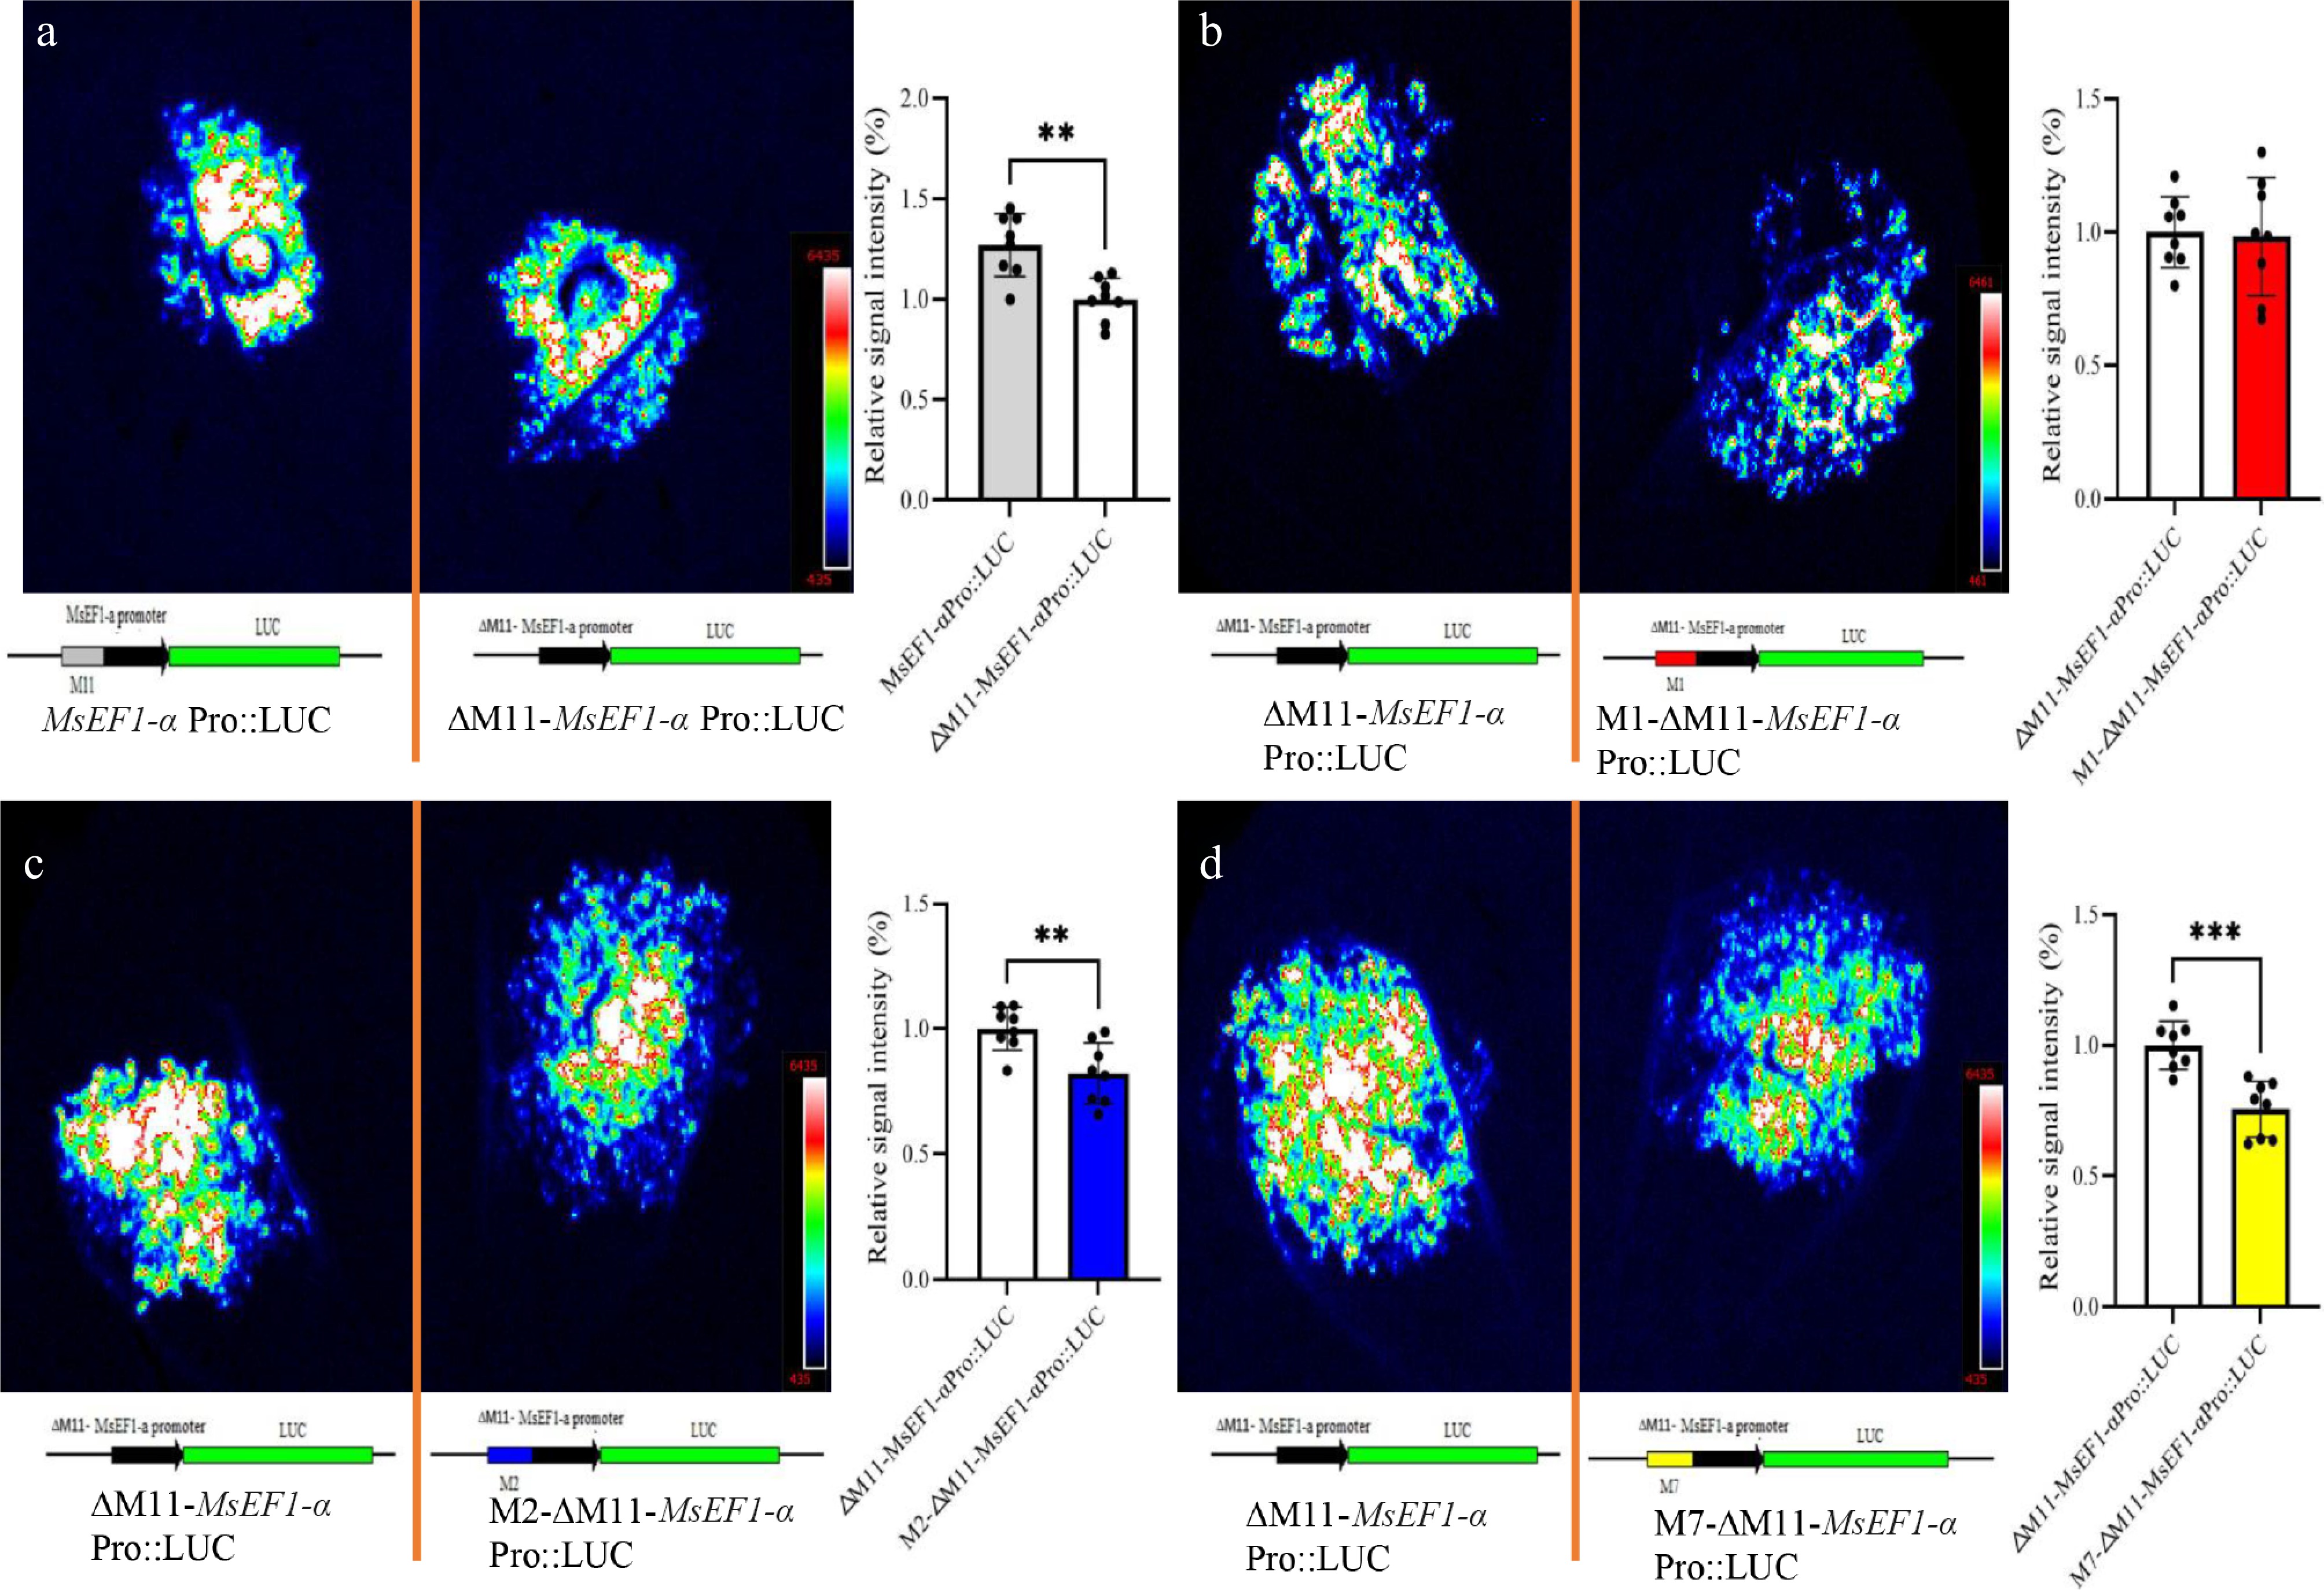
Figure 3.
LUC activity in N. benthamiana leaves expressing MsEF1-α promoter motif variants. (a) Wild-type M11 motif. (b) M1 motif in ΔM11 background. (c) M2 motif in ΔM11 background. (d) M7 motif in ΔM11 background. The MsEF1-α promoter with M11 deletion served as the control. Fluorescence intensity was quantified by selecting the eight brightest spots from N. benthamiana leaves and calculating their ratio to the mean fluorescence intensity of the control. Data represent mean ± SE (n = 8); ** p < 0.01, *** p < 0.001 (one-way ANOVA).
-
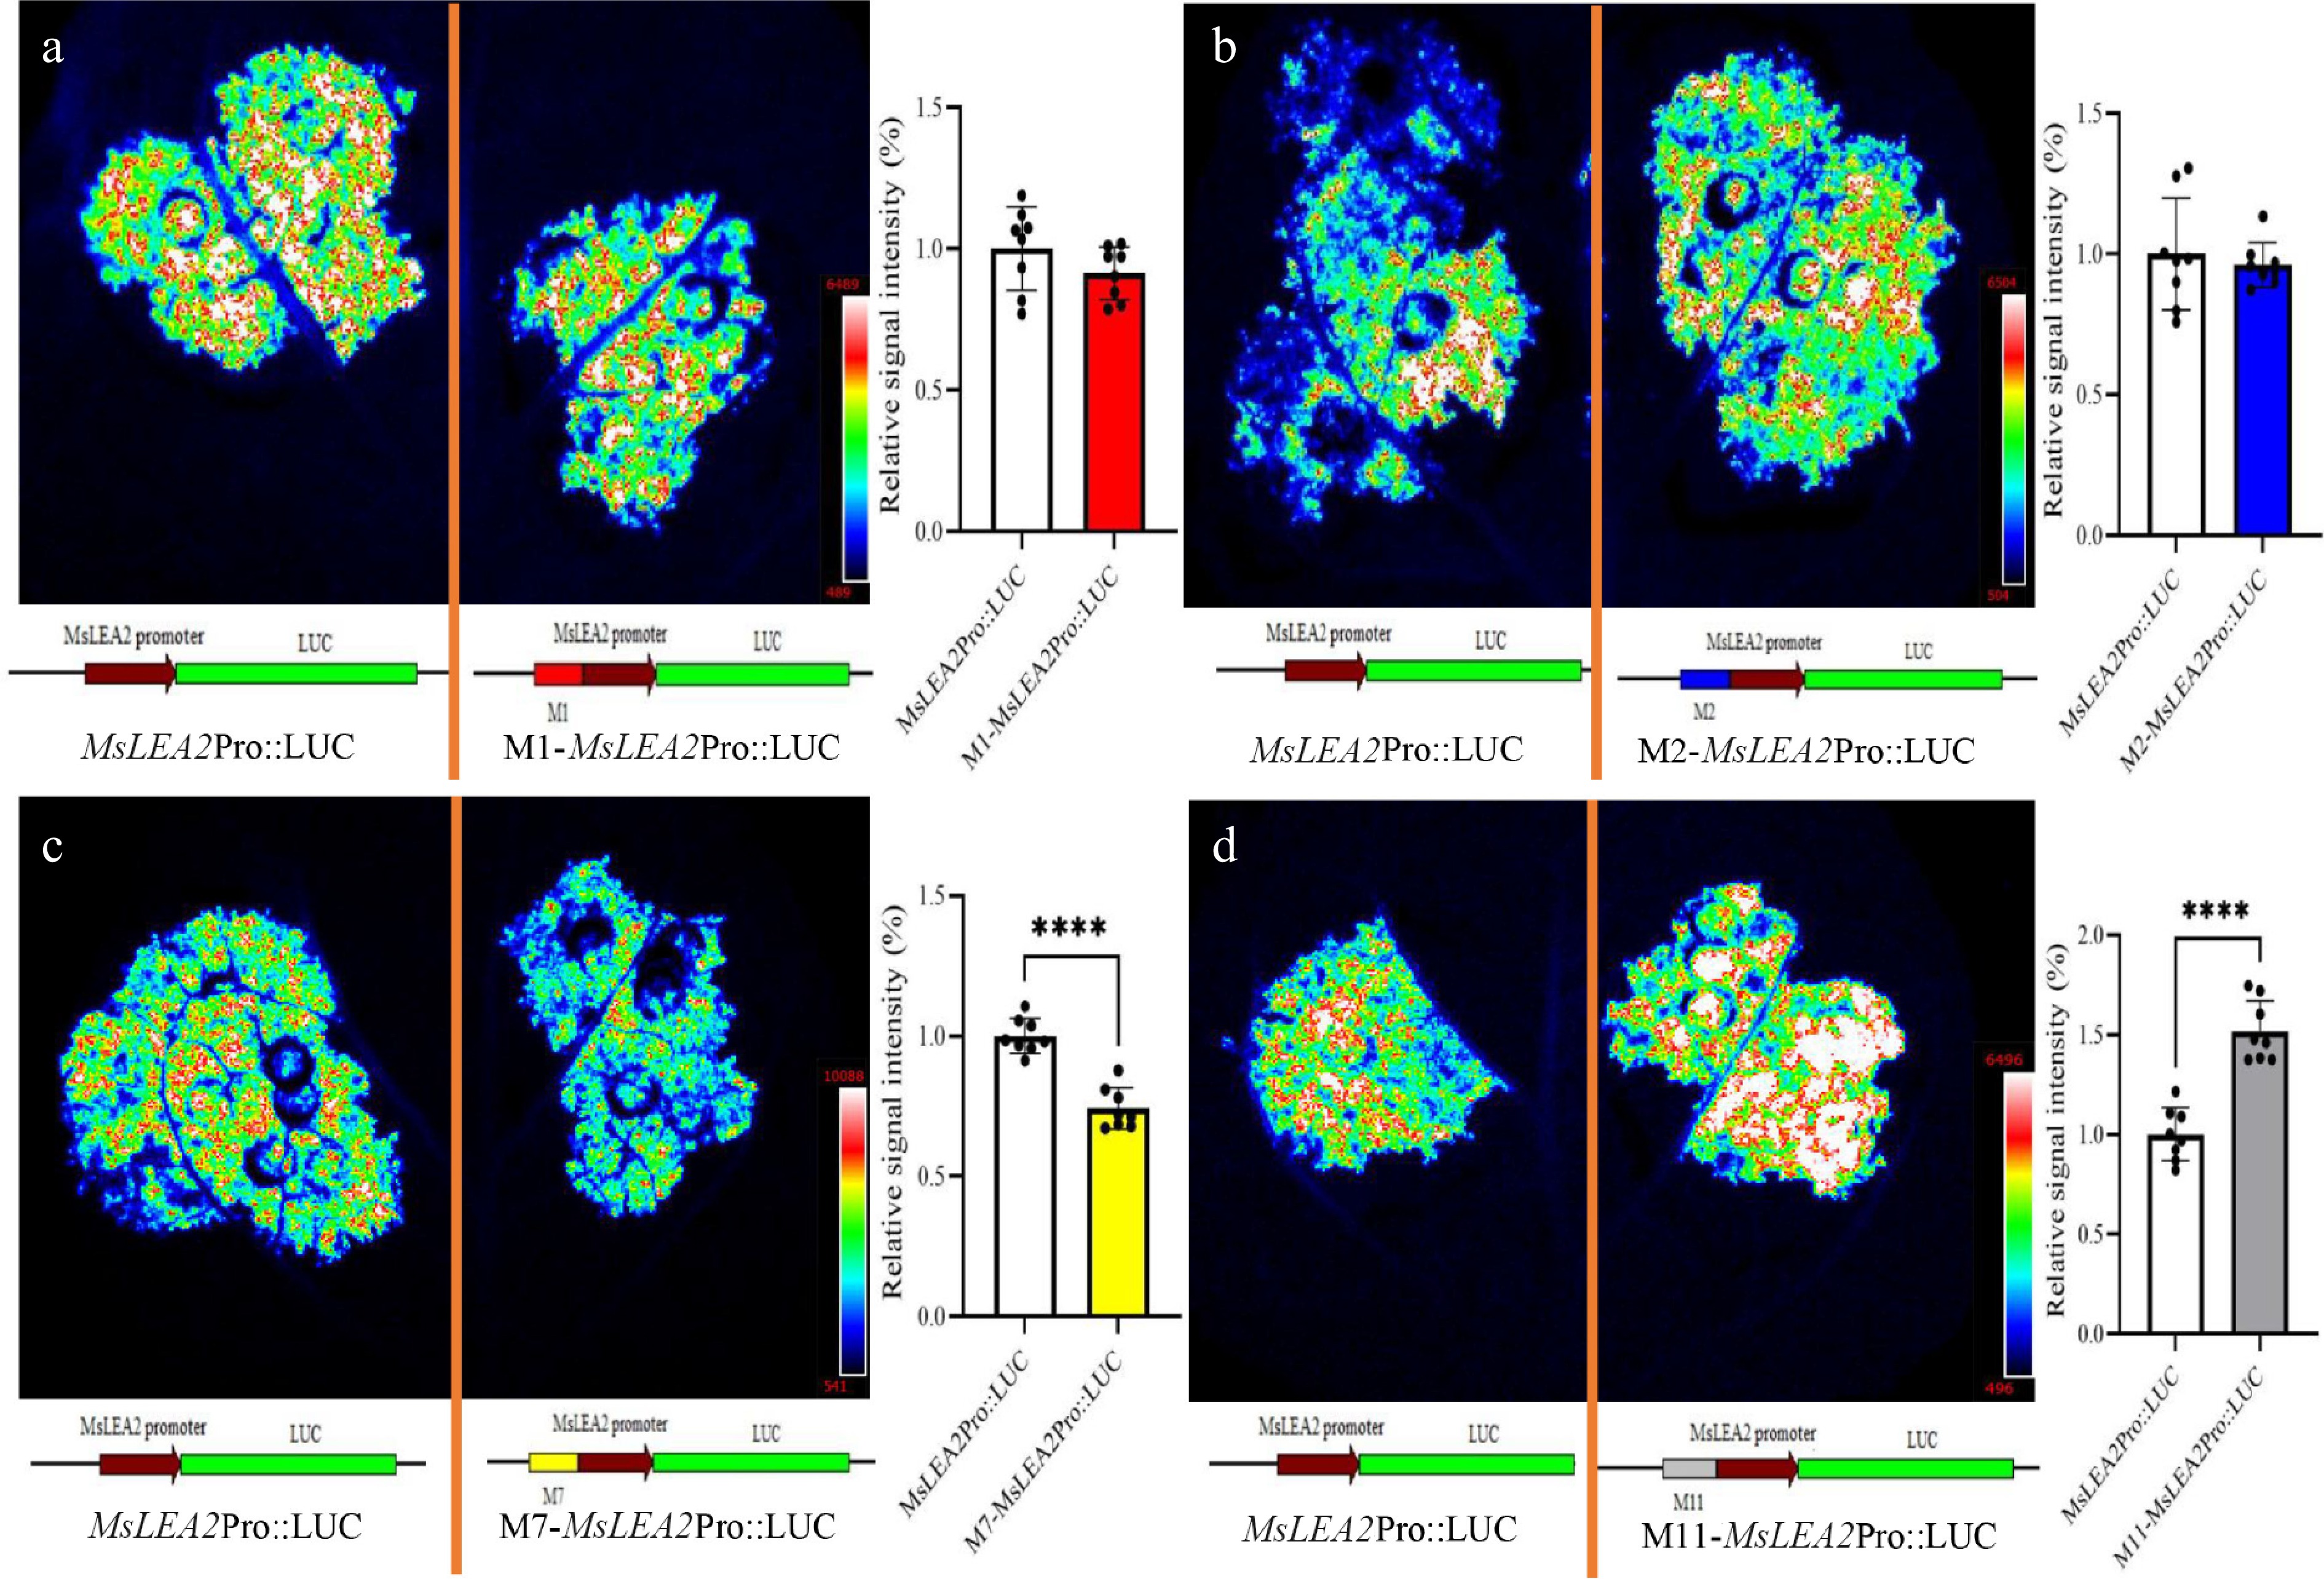
Figure 4.
LUC activity in N. benthamiana leaves expressing MsLEA2 promoter motif variants. (a) Construct with M1 motif. (b) Construct with M2 motif. (c) Construct with M7 motif. (d) Construct with M11 motif. The empty MsLEA2 promoter served as a control. Fluorescence intensity quantification methods followed those described in Fig. 3. Data are presented as mean ± SE (n = 8); **** p < 0.0001 (one-way ANOVA).
-
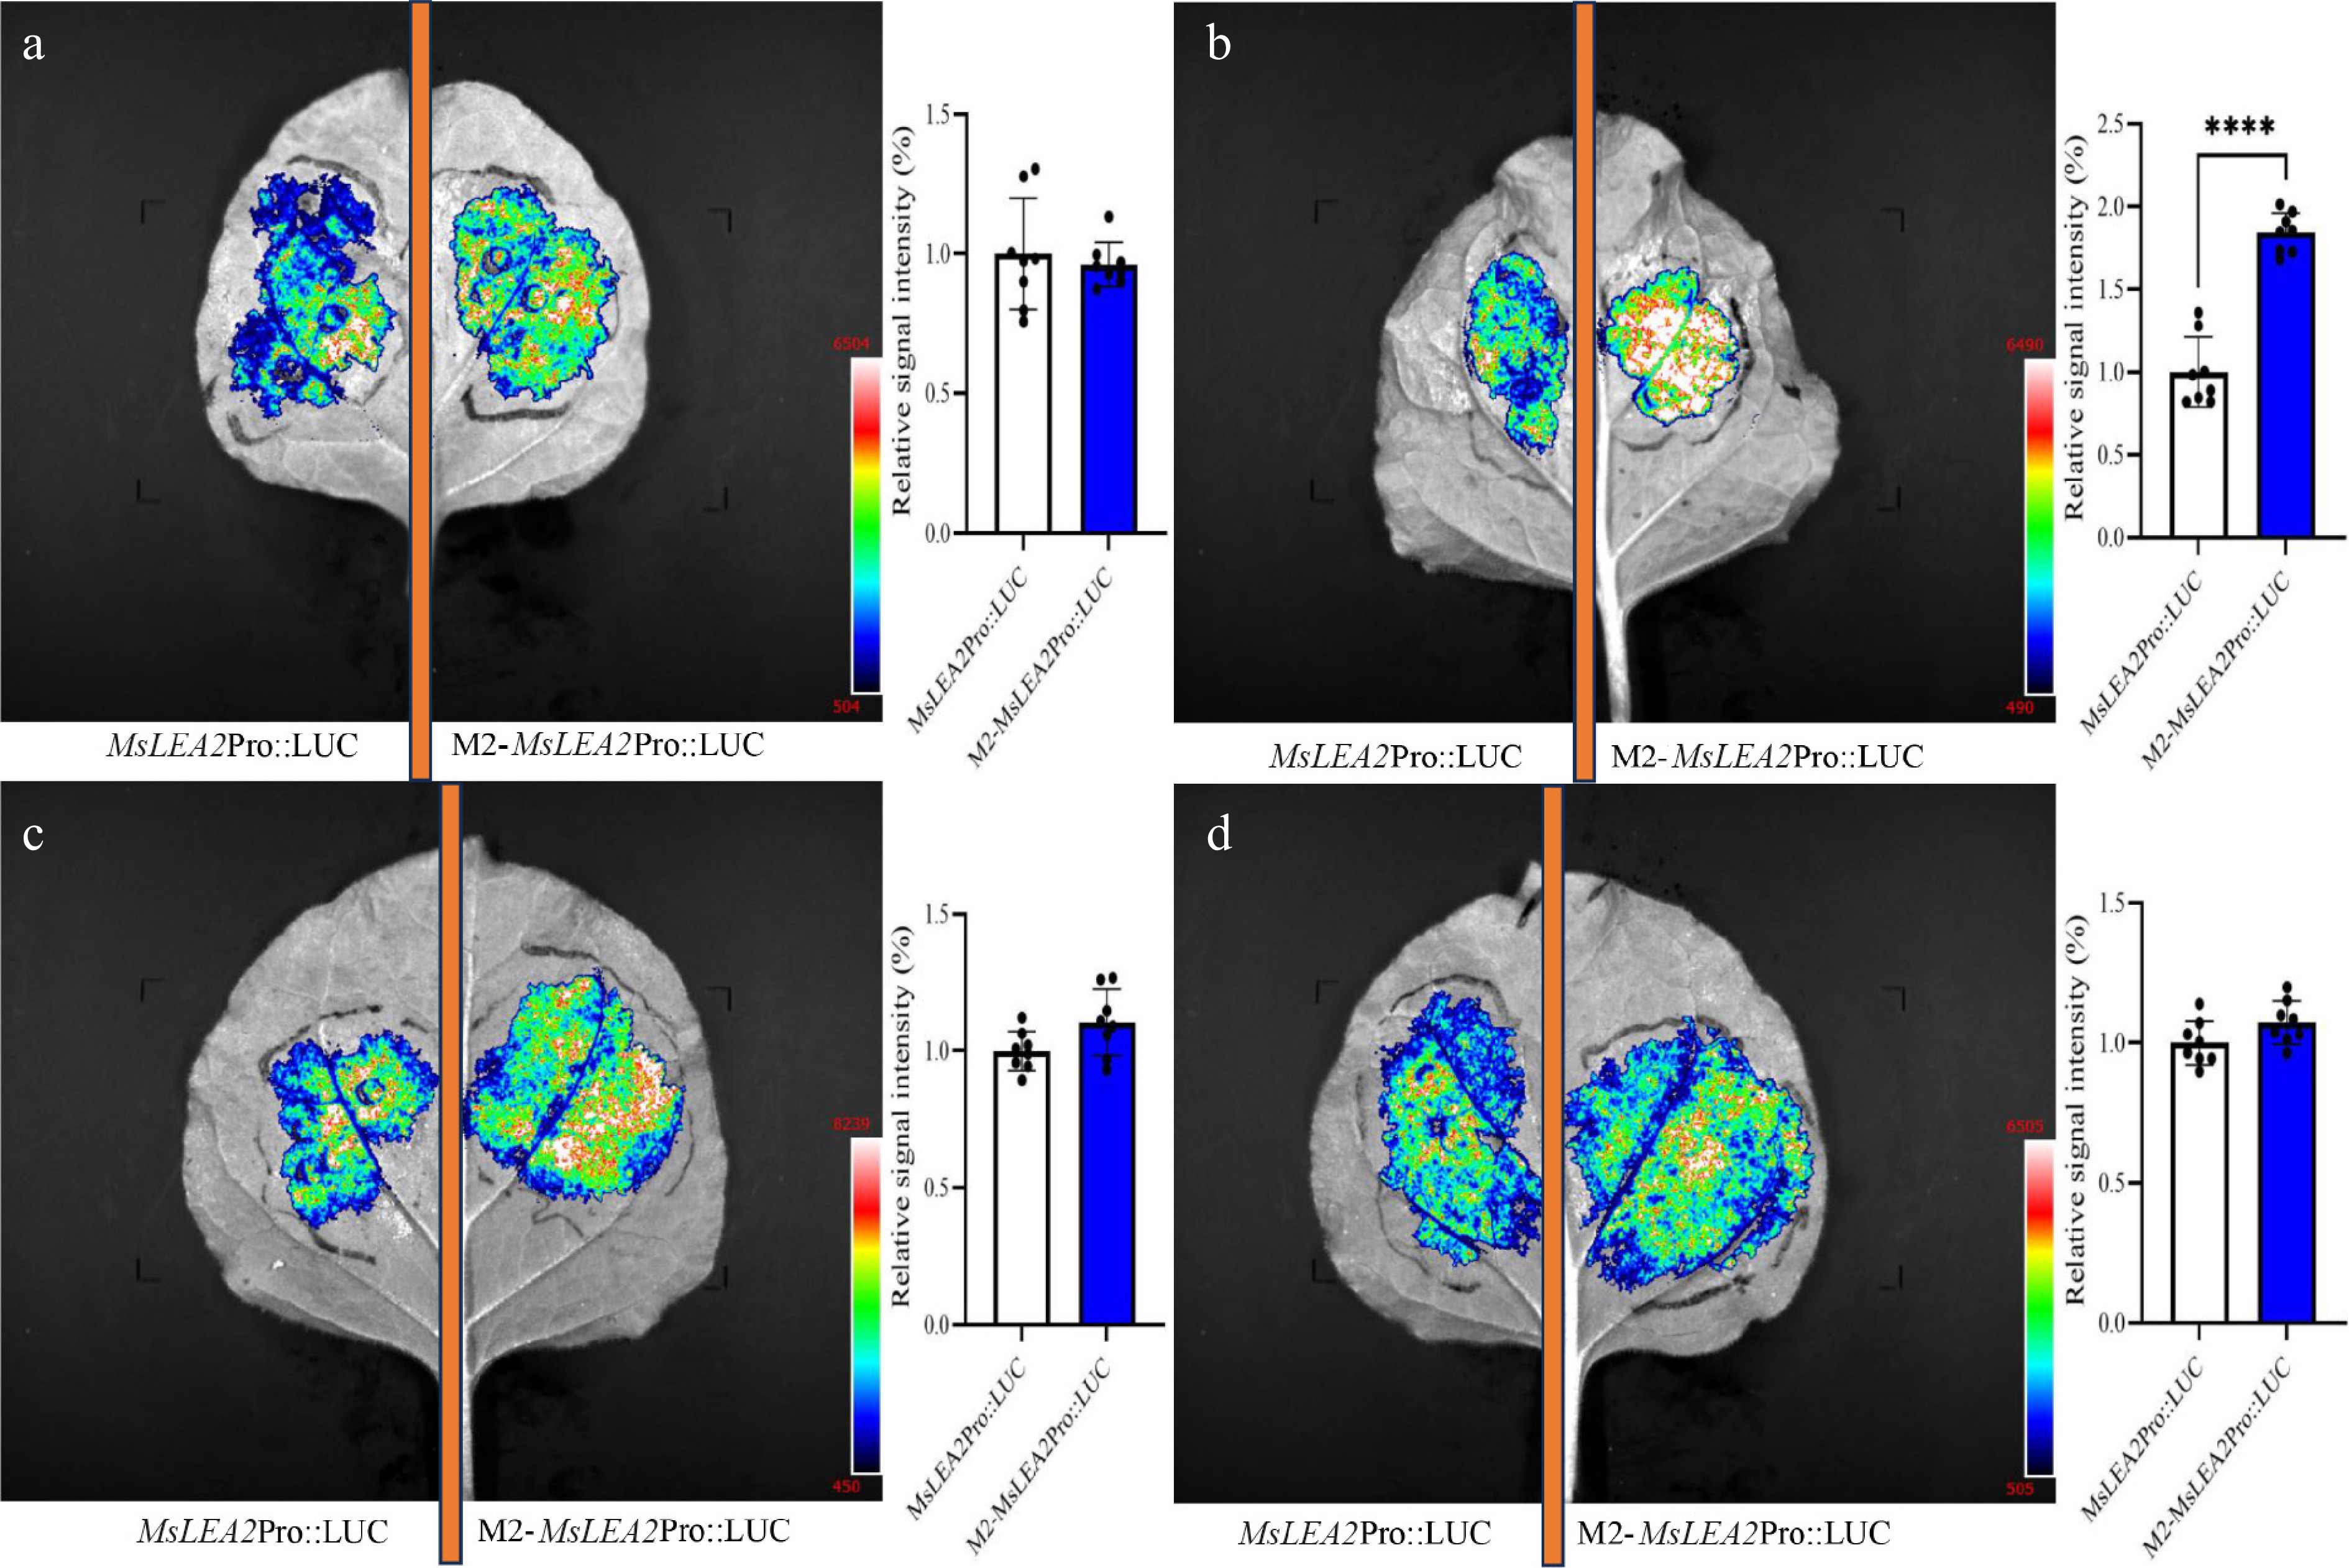
Figure 5.
LUC activity in N. benthamiana leaves after infiltration with M2-MsLEA2Pro::LUC. Representative images from four independent biological replicates (a)–(d) illustrate variable enhancement by motif M2. The empty MsLEA2 promoter served as a control. Fluorescence intensity quantification methods followed those described in Fig. 3. Data are presented as mean ± SE (n = 8); **** p < 0.0001 (one-way ANOVA).
-
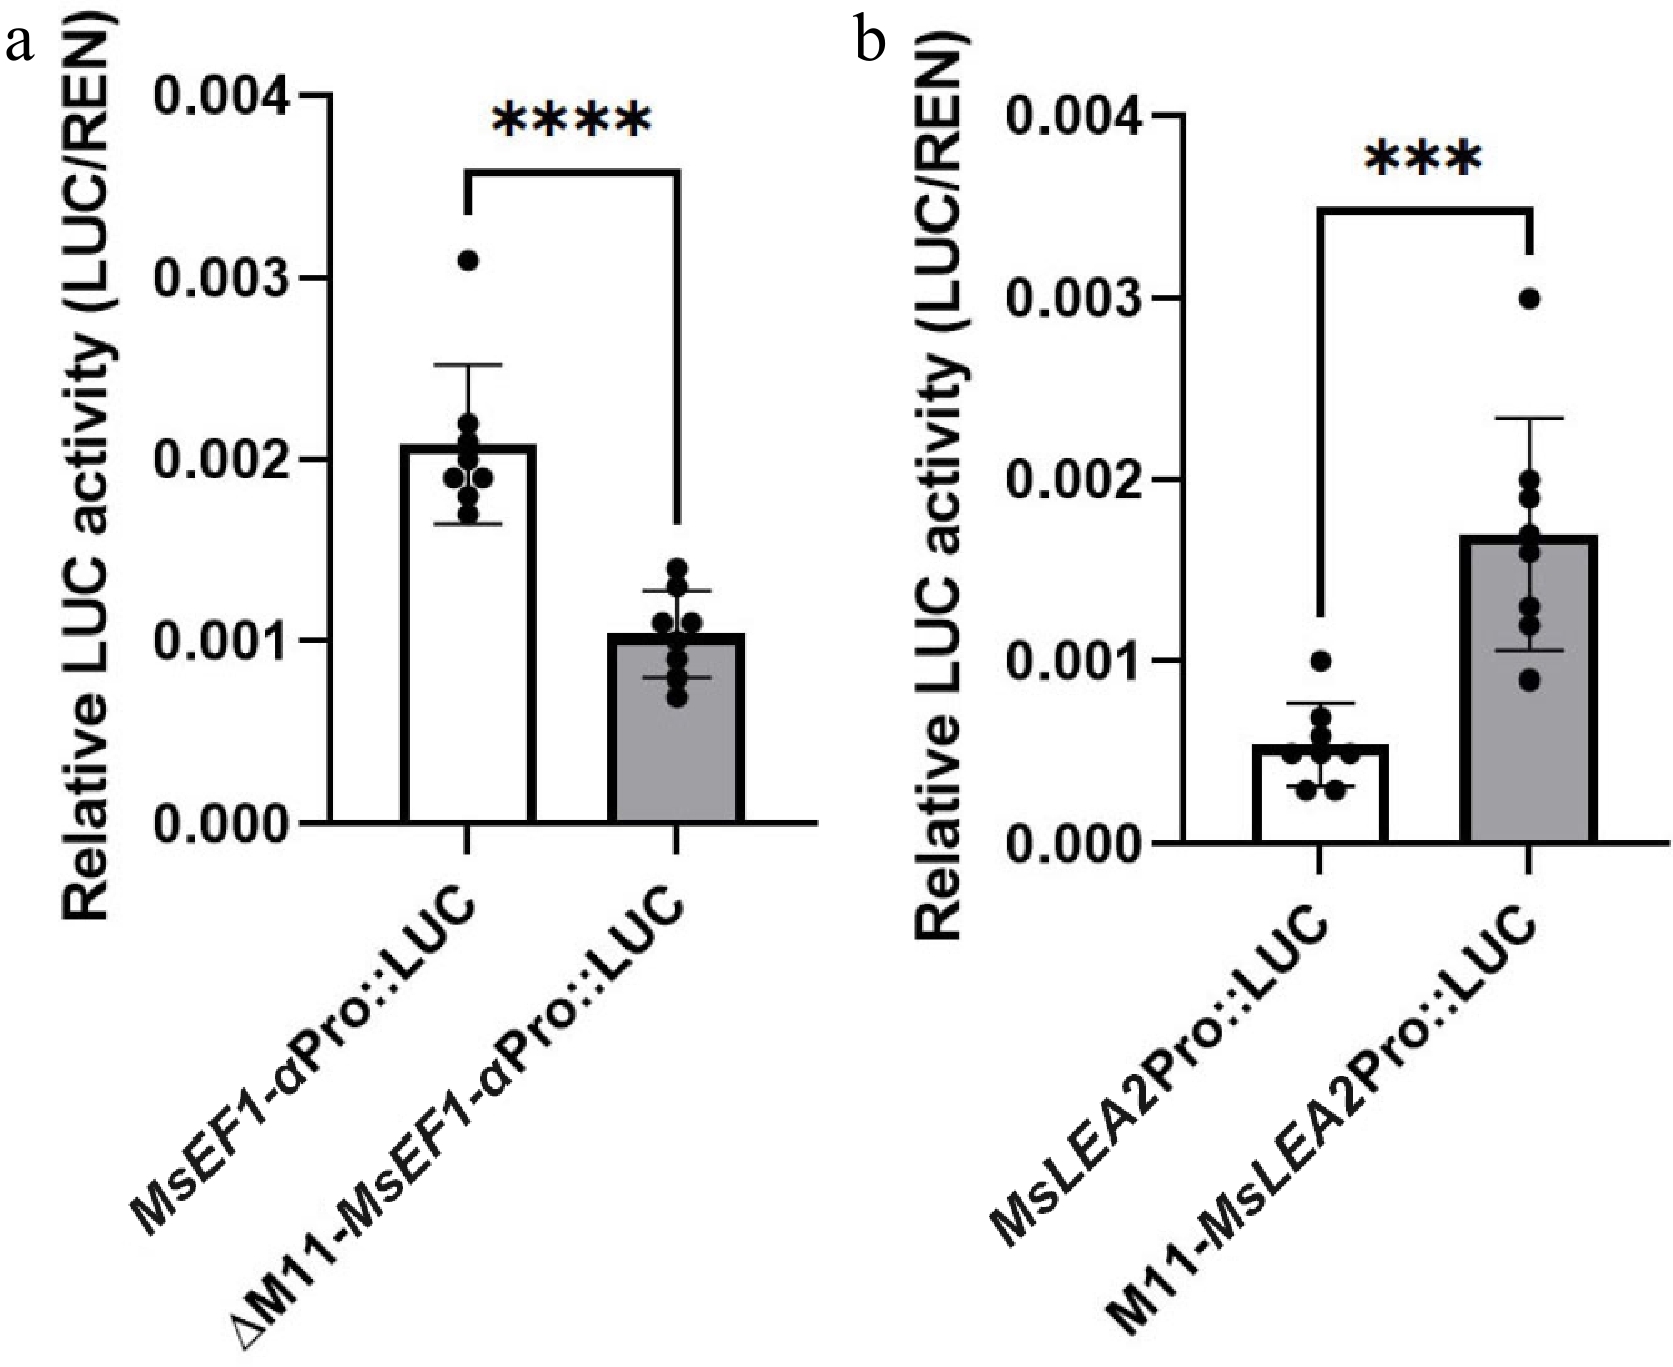
Figure 6.
Normalized luciferase activity (LUC/REN) of M11-containing promoter variants in N. benthamiana. (a) MsEF1-α promoter with (+M11) vs. without (ΔM11) the motif. (b) MsLEA2 promoter with (+M11) vs. empty promoter control. Data are mean ± SE (n = 8); *** p < 0.001, **** p < 0.0001 by one-way ANOVA.
-
Primer pair name Primers sequences (5’-3’) EFM1-LUCln-F TTGATATCGAATTCCTGCAGGACCGCGCCCGGCGTGGTGCGACCTGGGCCCGGGGCTCCCCATTAGGATATTTTCGGAA EF-LUCln-R GCTCTAGAACTAGTGGATCCGTTGTCTTAAAACTGCGAT EFM2-LUCln-F TTGATATCGAATTCCTGCAGCAGGTCCCGCCCCCCCCCGCCCCCCCACCCACCCCCCTCCCCCCCCCCATTAGGATATTTTCGGAA EF-LUCln-R GCTCTAGAACTAGTGGATCCGTTGTCTTAAAACTGCGAT EFM7-LUCln-F TTGATATCGAATTCCTGCAGCCACACCGCGCTACCTGGCCTCTGGCTCCCATTAGGATATTTTCGG EF-LUCln-R GCTCTAGAACTAGTGGATCCGTTGTCTTAAAACTGCGAT EFΔM11-LUCln-F TTGATATCGAATTCCTGCAGCATTAGGATATTTTCGGAA EF-LUCln-R GCTCTAGAACTAGTGGATCCGTTGTCTTAAAACTGCGAT LEA2M1-LUCln-F TTGATATCGAATTCCTGCAGGACCGCGCCCGGCGTGGTGCGACCTGGGCCCGGGGCTCCCGAGTTTAATTGCATATTCA LEA2-LUCln-R GCTCTAGAACTAGTGGATCCGATTTATAGTGAATAACAC LEA2M2-LUCln-F TTGATATCGAATTCCTGCAGCAGGTCCCGCCCCCCCCCGCCCCCCCACCCACCCCCCTCCCCCCCCCGAGTTTAATTGCATATTCA LEA2-LUCln-R GCTCTAGAACTAGTGGATCCGATTTATAGTGAATAACAC LEA2M7-LUCln-F TTGATATCGAATTCCTGCAGCCACACCGCGCTACCTGGCCTCTGGCTCCGAGTTTAATTGCATATTCA LEA2-LUCln-R GCTCTAGAACTAGTGGATCCGATTTATAGTGAATAACAC LEA2M11-LUCln-F1 TTGATATCGAATTCCTGCAGCAATACCTTAACCTAACCTTCTTTATTTCATCCTTTACCTAA LEA2M11-LUCln-F2 TATTTCATCCTTTACCTAAAAAACTCACAAAAGCATATTCCATG LEA2M11-LUCln-F3 ACAAAAGCATATTCCATGCGCCACCACTCCCCAACGTTCAGAGTTTAATTGCATATTCA LEA2-LUCln-R GCTCTAGAACTAGTGGATCCGATTTATAGTGAATAACAC Table 1.
Primers used for vector construction.
-
Motif ID Alt ID Width Frequency Best possible match 1 GAYSRCNCNYSSCGWDGTKYGNCCTGRRCMCGKGGYTSMM MEME-1 40 0.35 GACCGCGCCCGGCGTGGTGCGACCTGGGCCCGGGGCTCCC 2 CARSYCMHDMHNHMMHYYDYHCYYNNWCMMWCMCYYYTCYCYCCCCY MEME-2 47 0.90 CAGGTCCCGCCCCCCCCCGCCCCCCCACCCACCCCCCTCCCCCCCCC 3 AARAAAAAMAARAAA MEME-3 15 3.25 AAGAAAAACAAGAAA 4 CCCCMSAGASRSTS MEME-4 14 0.45 CCCCCGAGACGCTC 5 SVTCSBTGGCAMACGMAHGAHGGGYAVABGCATYKCNTCTHGMC MEME-5 44 0.35 GCTCGGTGGCACACGCACGAAGGGCACACGCATCGCATCTAGCC 6 GAAGMGAGAAA MEME-6 11 1.60 GAAGCGAGAAA 7 CCMMWVCRCGYTACSTKKNCTVTGKNTSC MEME-7 29 0.55 CCACACCGCGCTACCTGGCCTCTGGCTCC 8 KRGHACMVCTNGCSCNKCCSYVACARVCADTBCTWTNCC MEME-8 39 0.40 GGGCACCGCTAGCCCAGCCGCCACAGCCAATCCTTTACC 9 TCABAMRKAYTYCMYCYRTCCCWTA MEME-9 25 0.70 TCACACGTACTCCCTCCGTCCCTTA 10 TTWTKAWKTTTTTTTTTTSAA MEME-10 21 3.15 TTTTGAAGTTTTTTTTTTCAA 11 MEME-11 89 no CAATACCTTAACCTAACCTTCTTTATTTCATCCTTTACCTAAAAAACTCACAAAAGCATATTCCATGCGCCACCACTCCCCAACGTTCA ALT ID, alternative identifier; Frequency, occurrence frequency (no. per promoter).Frequency was calculated as the total number of motif detections across the 20 highest-expressed gene promoters divided by 20. Table 2.
The 11 candidate enhancer motifs founded in alfalfa highest-expressed genes’ pormoters.
Figures
(6)
Tables
(2)