-
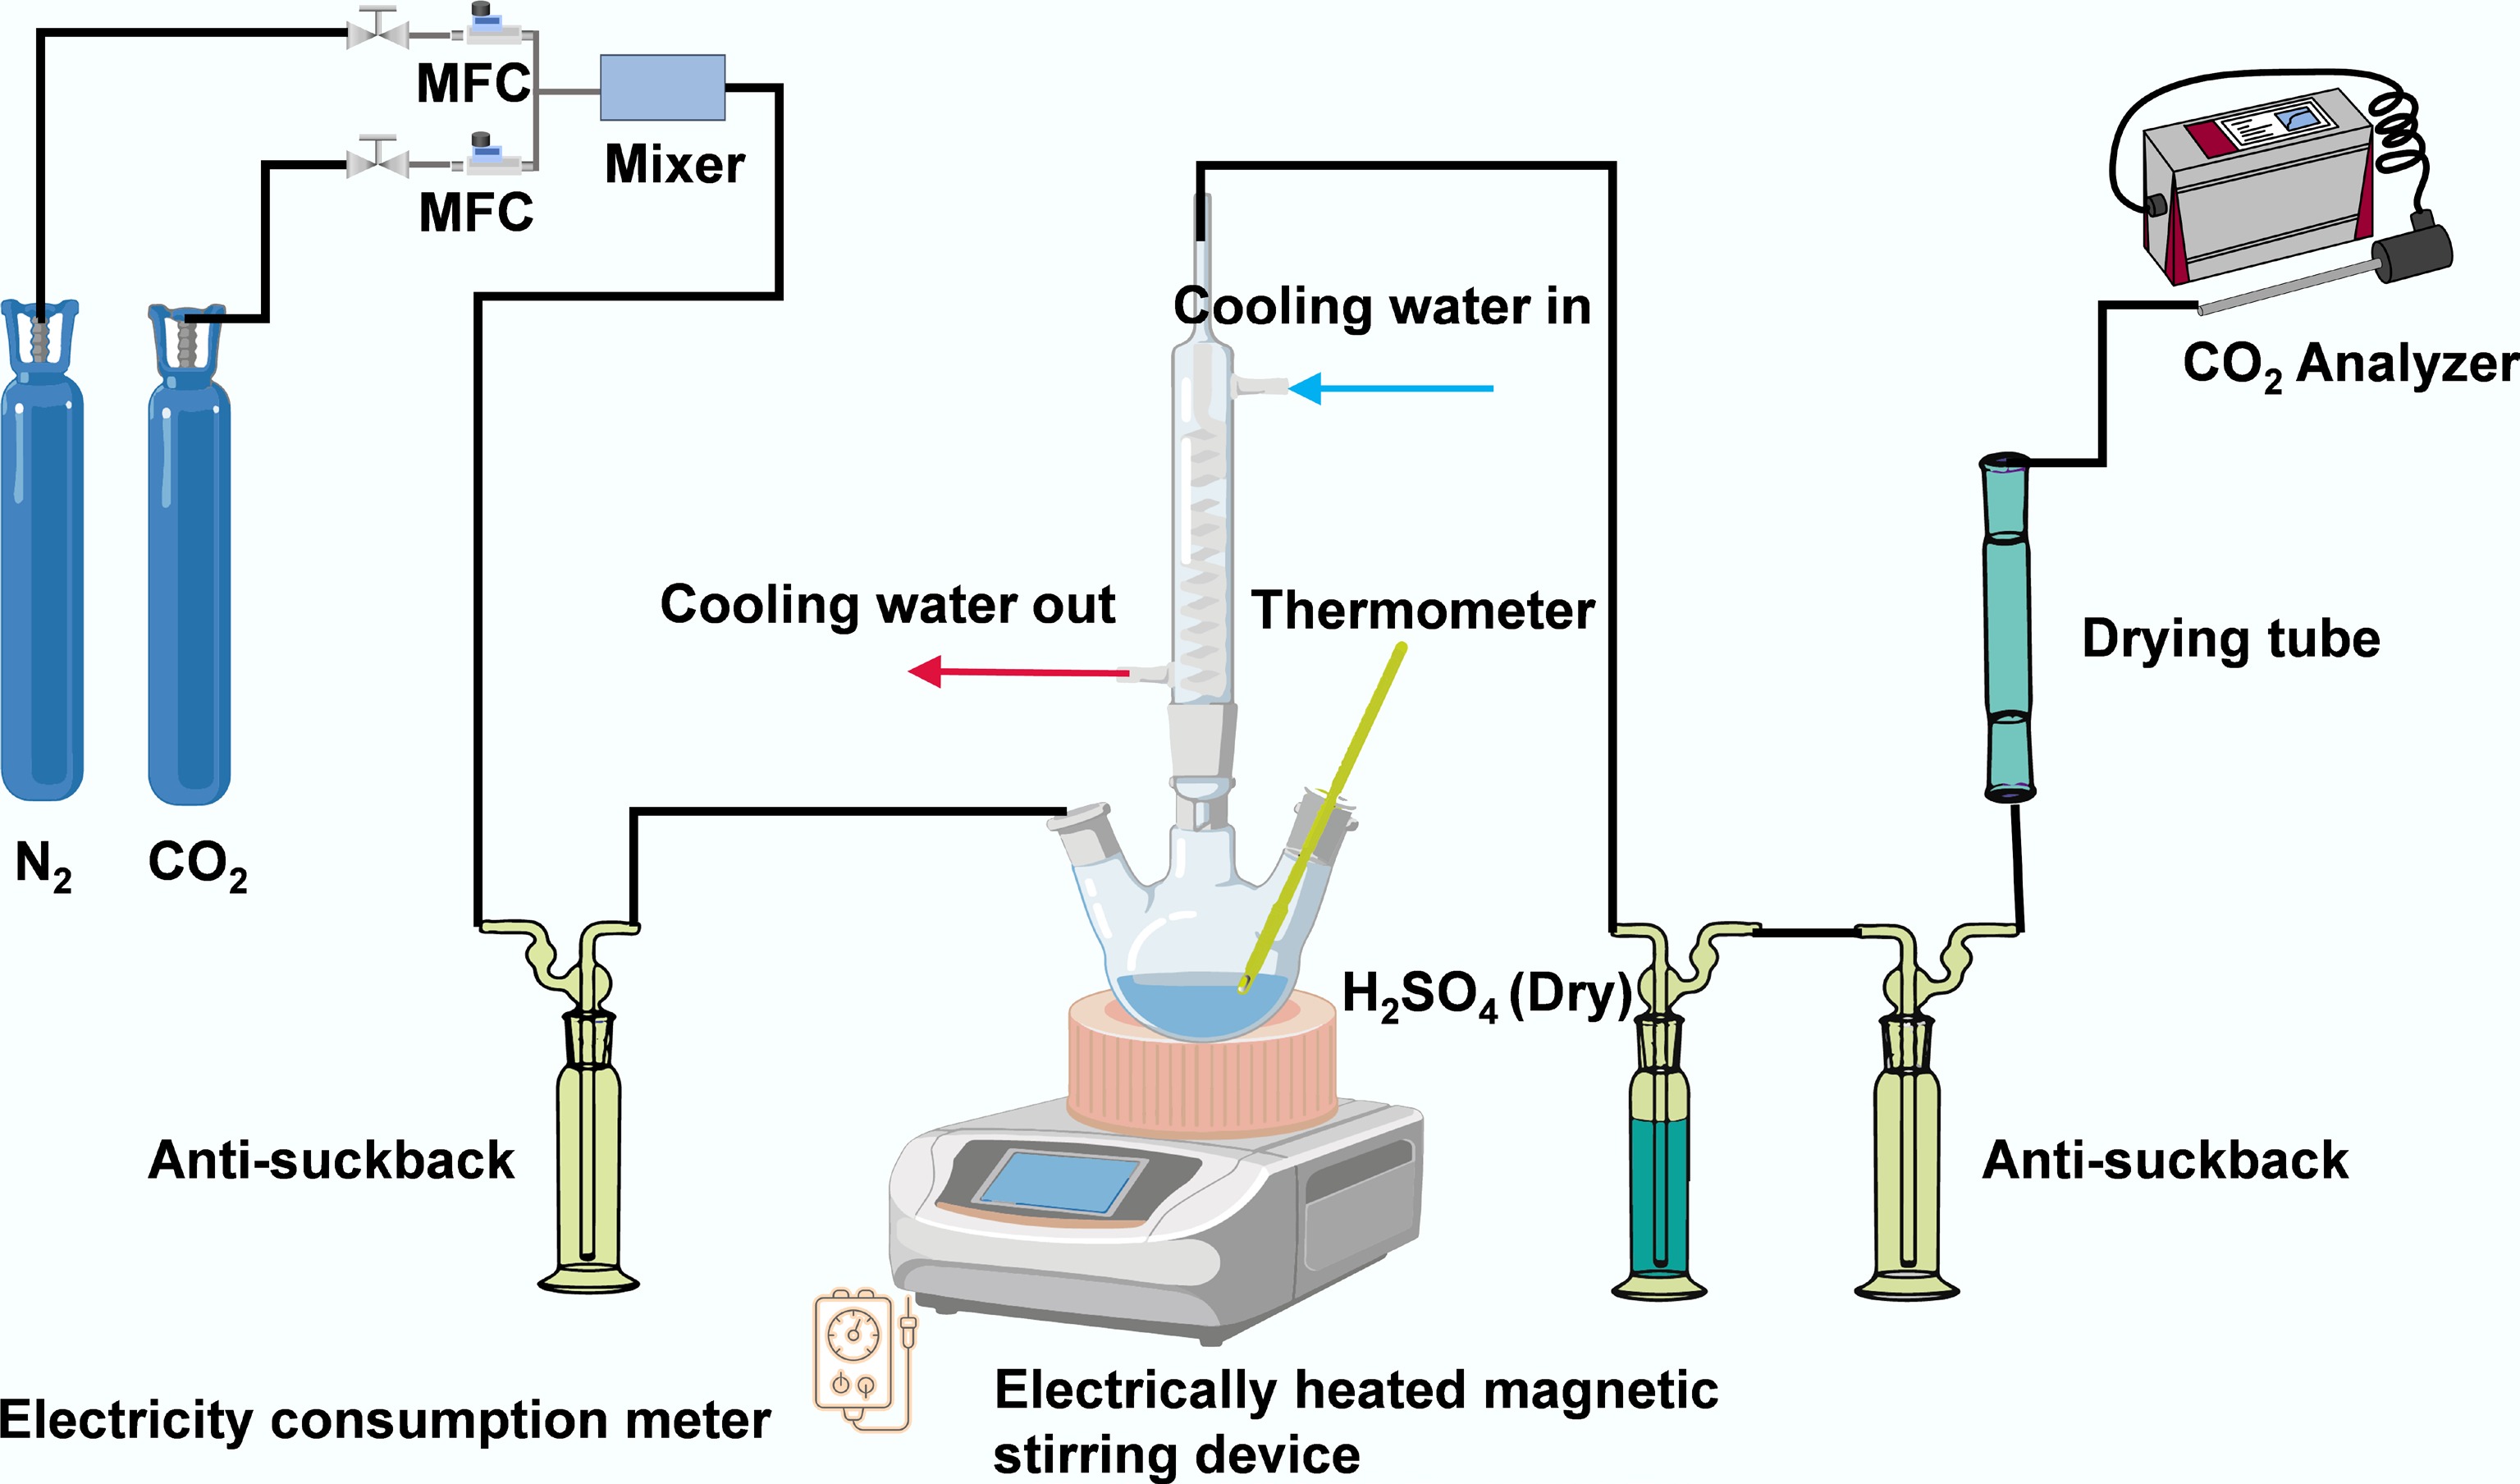
Figure 1.
Schematic diagram of the CO2 desorption experimental setup.
-
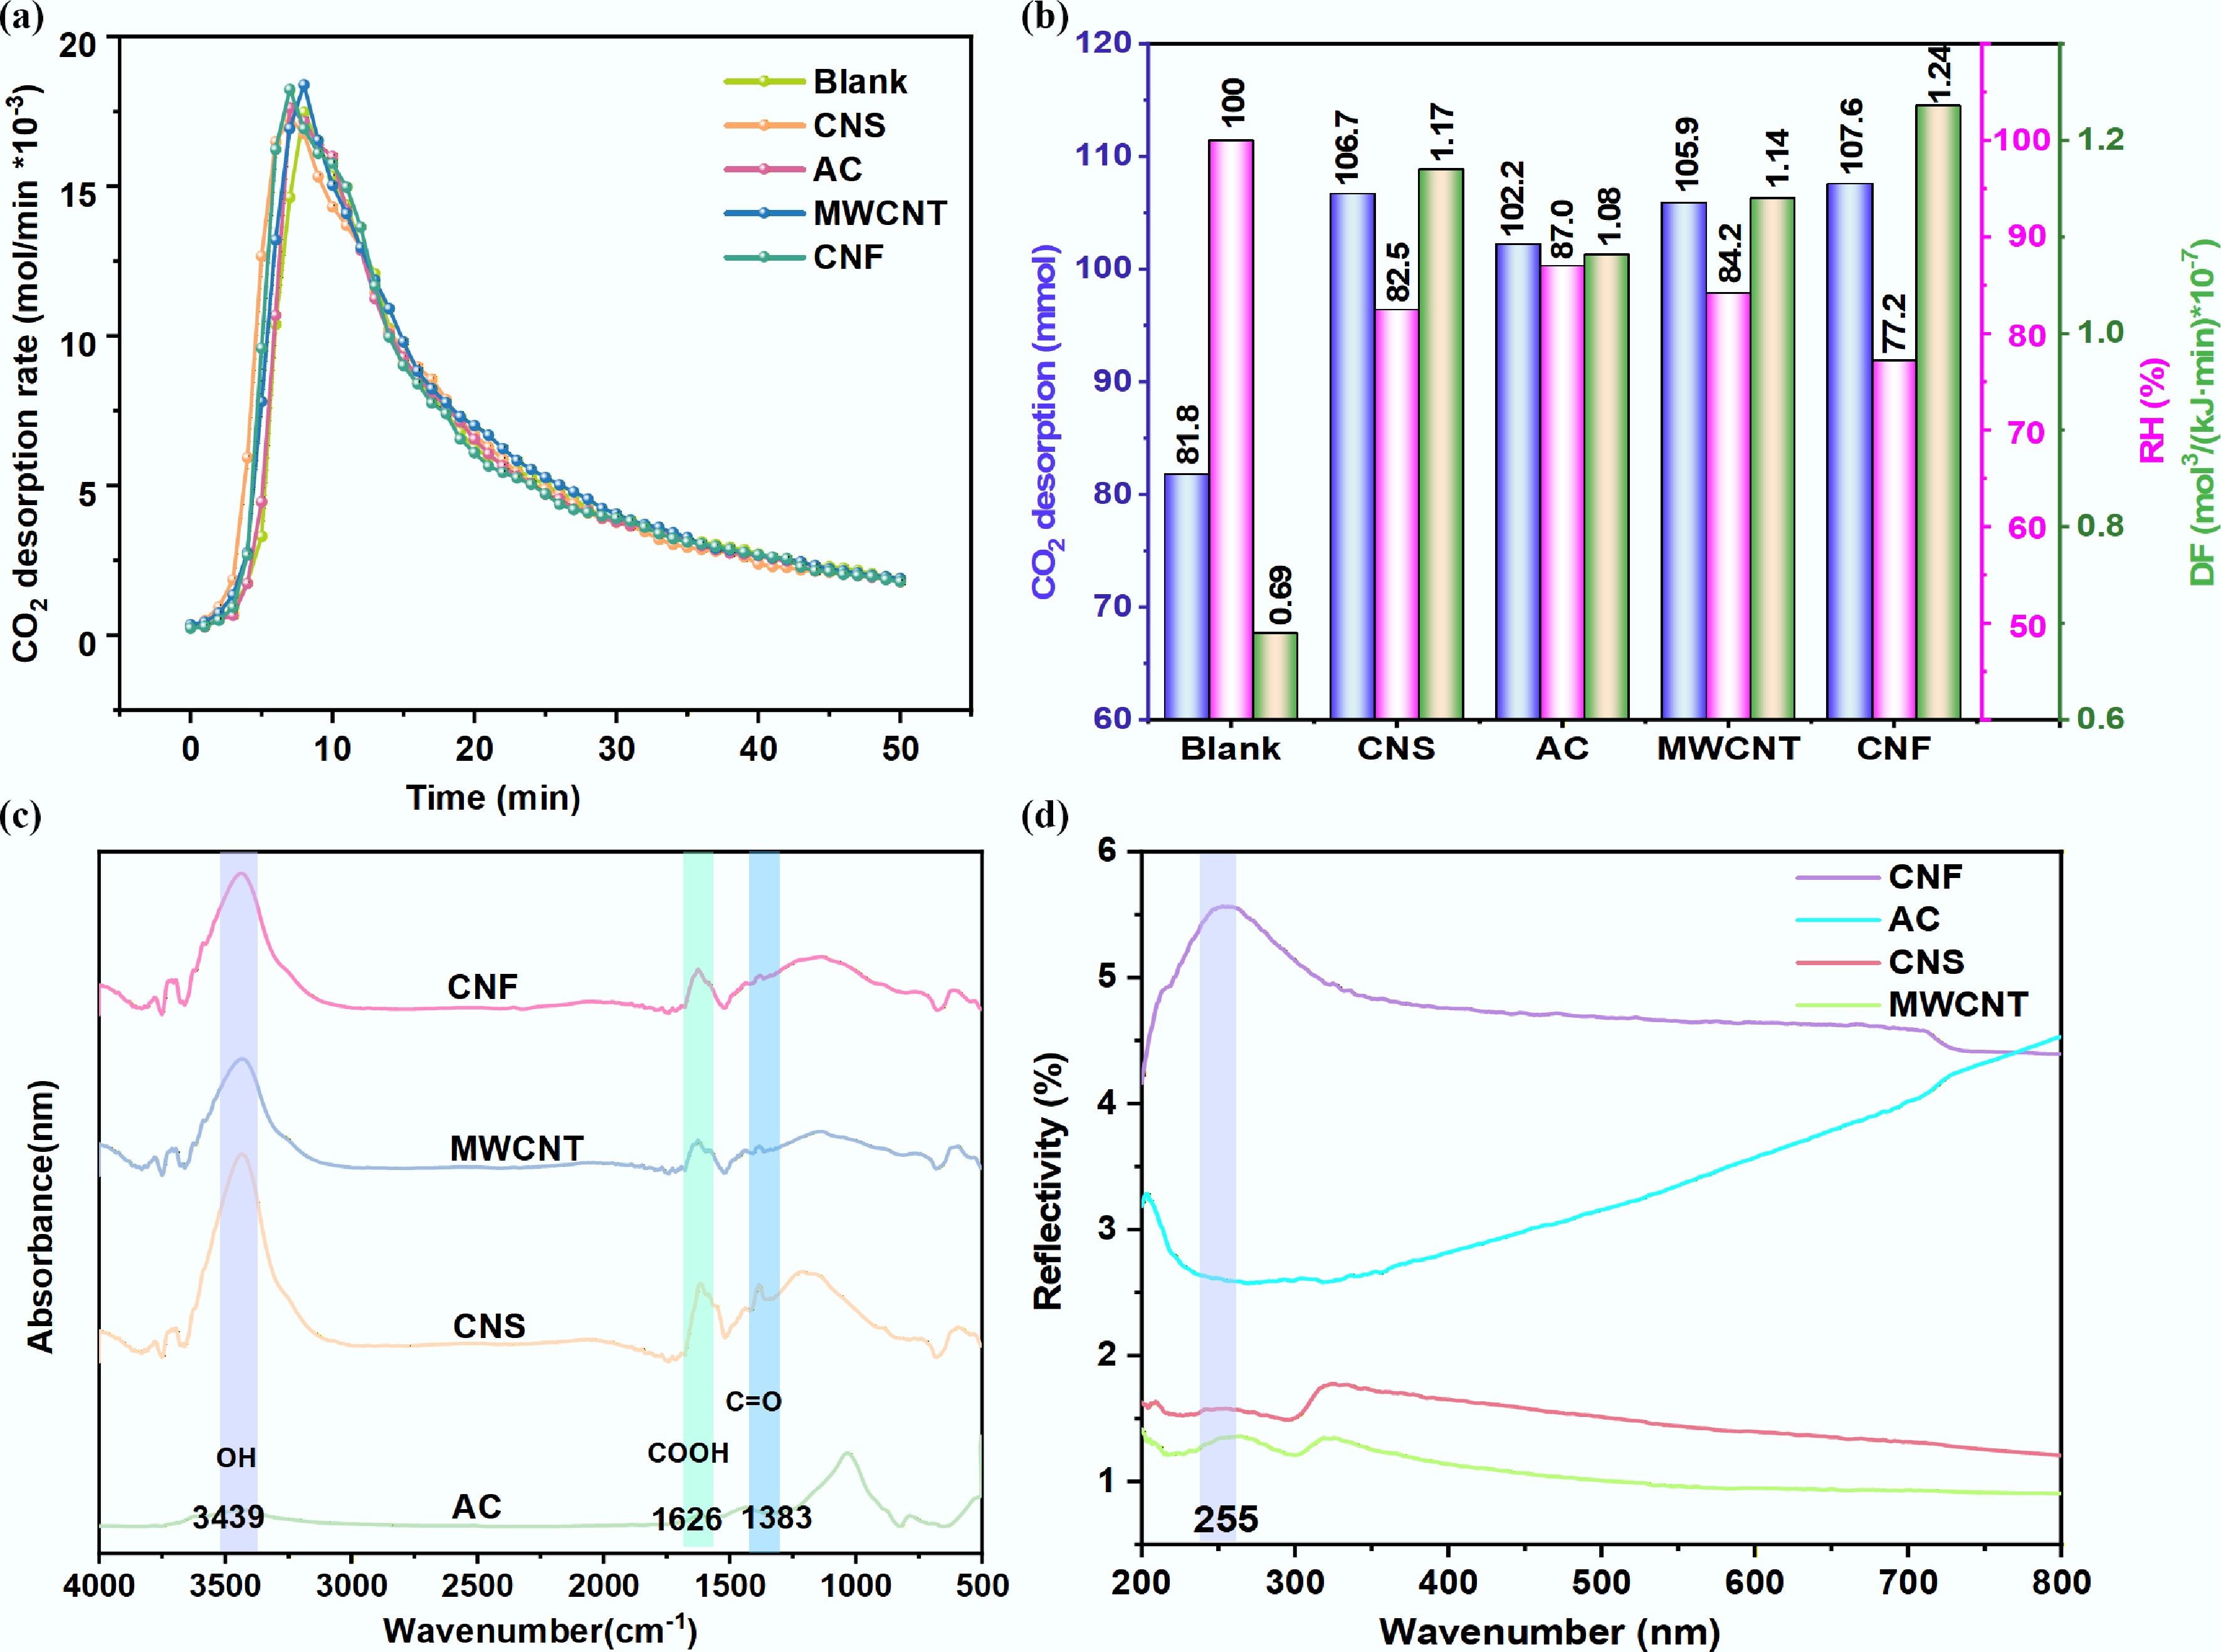
Figure 2.
Catalytic performance and characterization of different carbon materials in CO2-rich MEA solution. (a) CO2 desorption rate. (b) Cumulative desorption amount, RH, and DF after 50 min. (c) FT-IR spectra. (d) UV-vis.
-
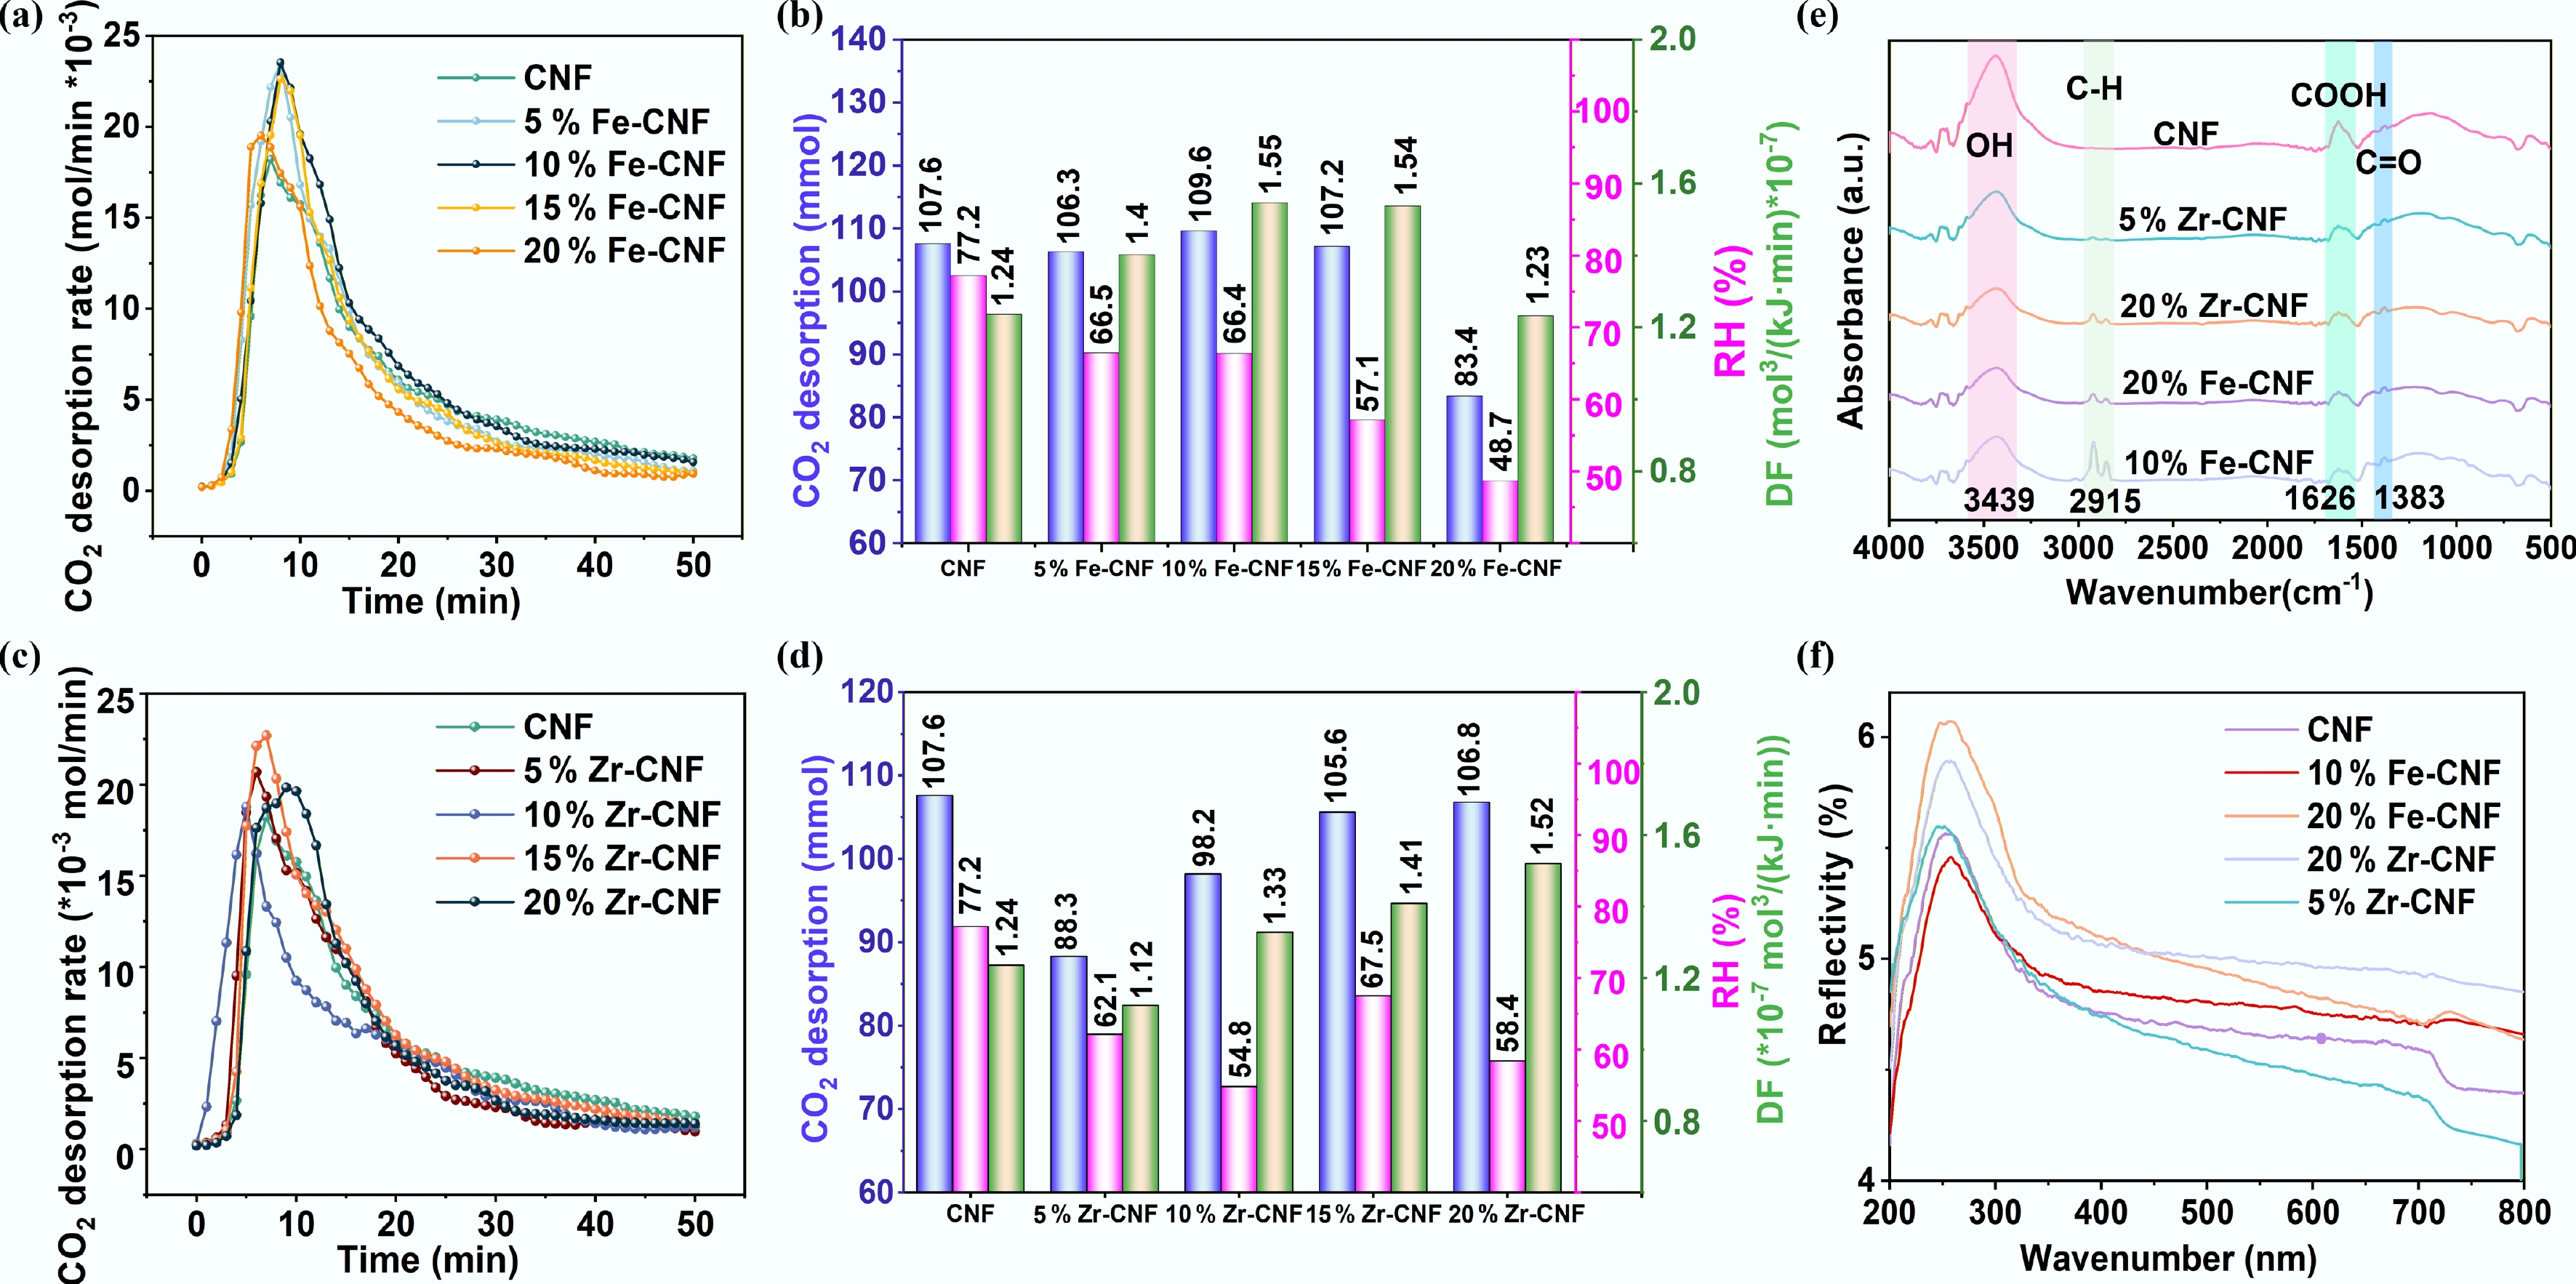
Figure 3.
Catalytic desorption performance of CO2-rich MEA solution with Fe- and Zr-modified CNF. (a), (c) Desorption rate of Fe/Zr-CNF. (b), (d) Desorption amount, RH, and DF of Fe/Zr-CNF. Characterization of catalytic desorption of CO2-rich MEA solution with Fe- and Zr-modified CNF. (e) FT-IR. (f) UV-vis.
-
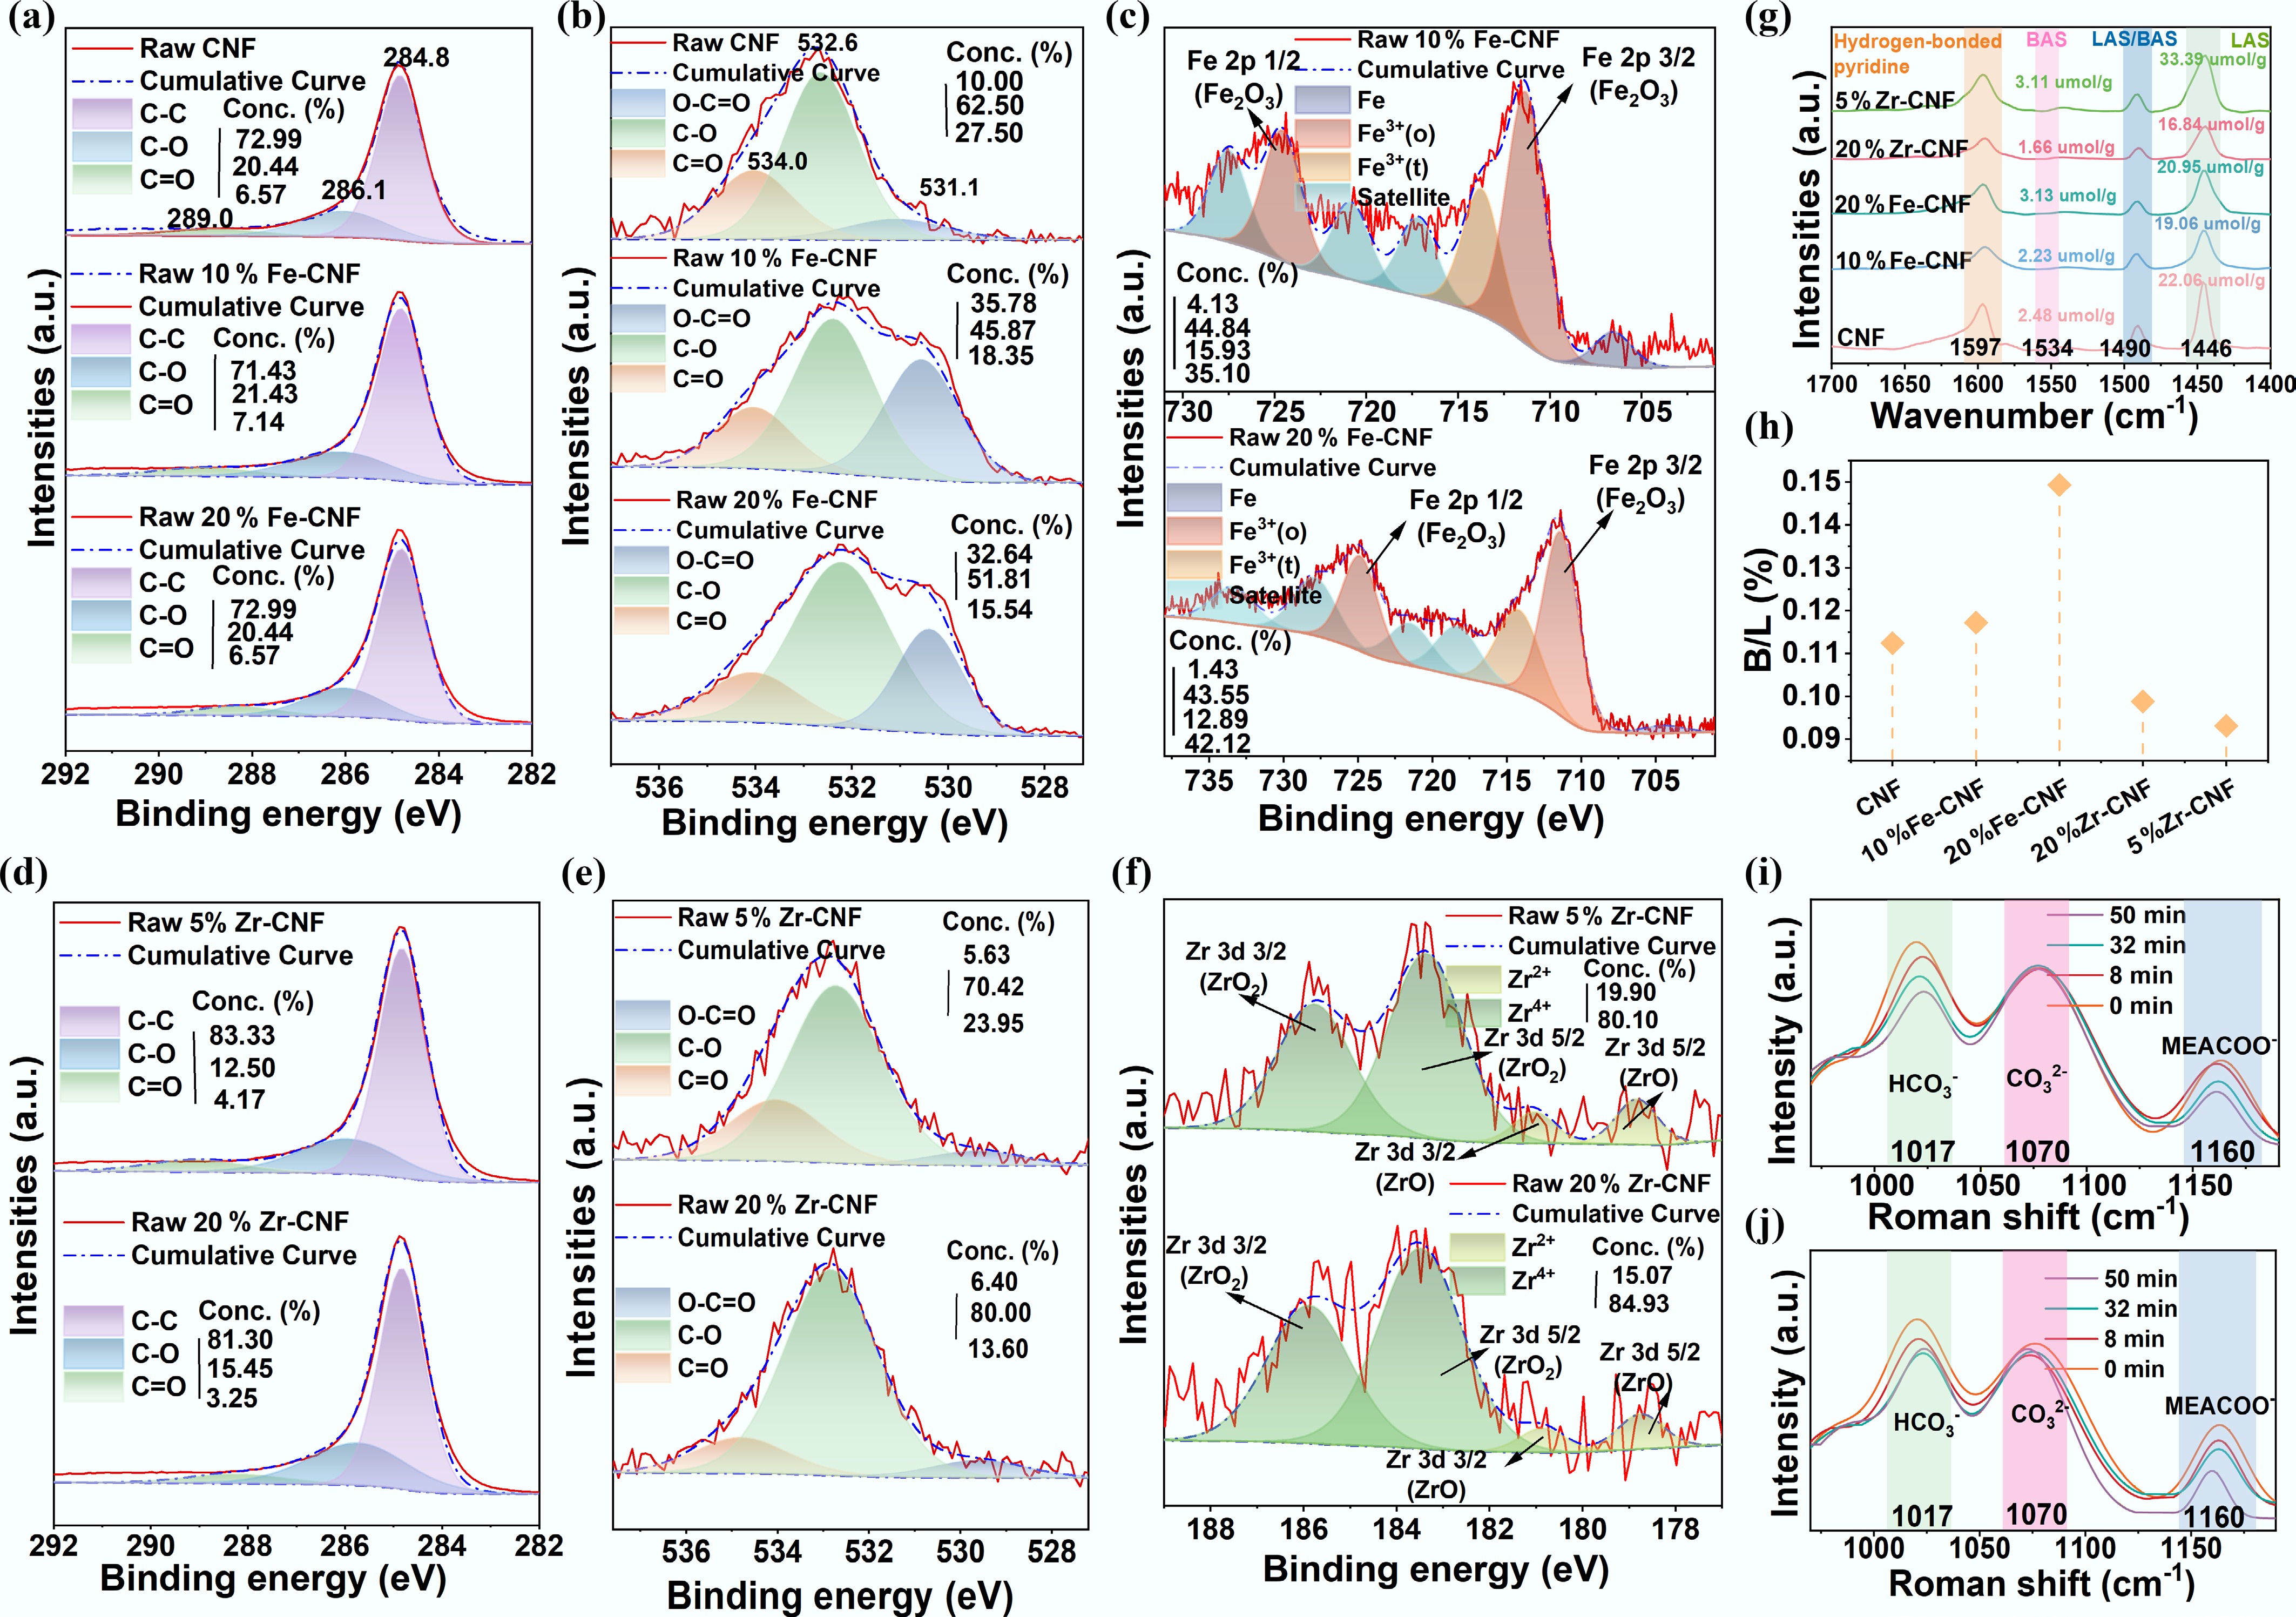
Figure 4.
XPS and Py-IR characterization of the catalysts, and in situ Raman monitoring of the desorption process. (a)–(c) XPS spectra of C 1s, O 1s, and Fe 2p for CNF, 10% Fe-CNF, and 20% Fe-CNF. (d)–(f) XPS spectra of C 1s, O 1s, and Zr 3d for 5% Zr-CNF and 20% Zr-CNF. (g) Py-IR spectra. (h) Brønsted (B)/Lewis (L) acid sites ratios. In situ Raman spectra of the CO2-rich MEA solution during desorption (i) without a catalyst, and (j) with 10% Fe-CNF.
-
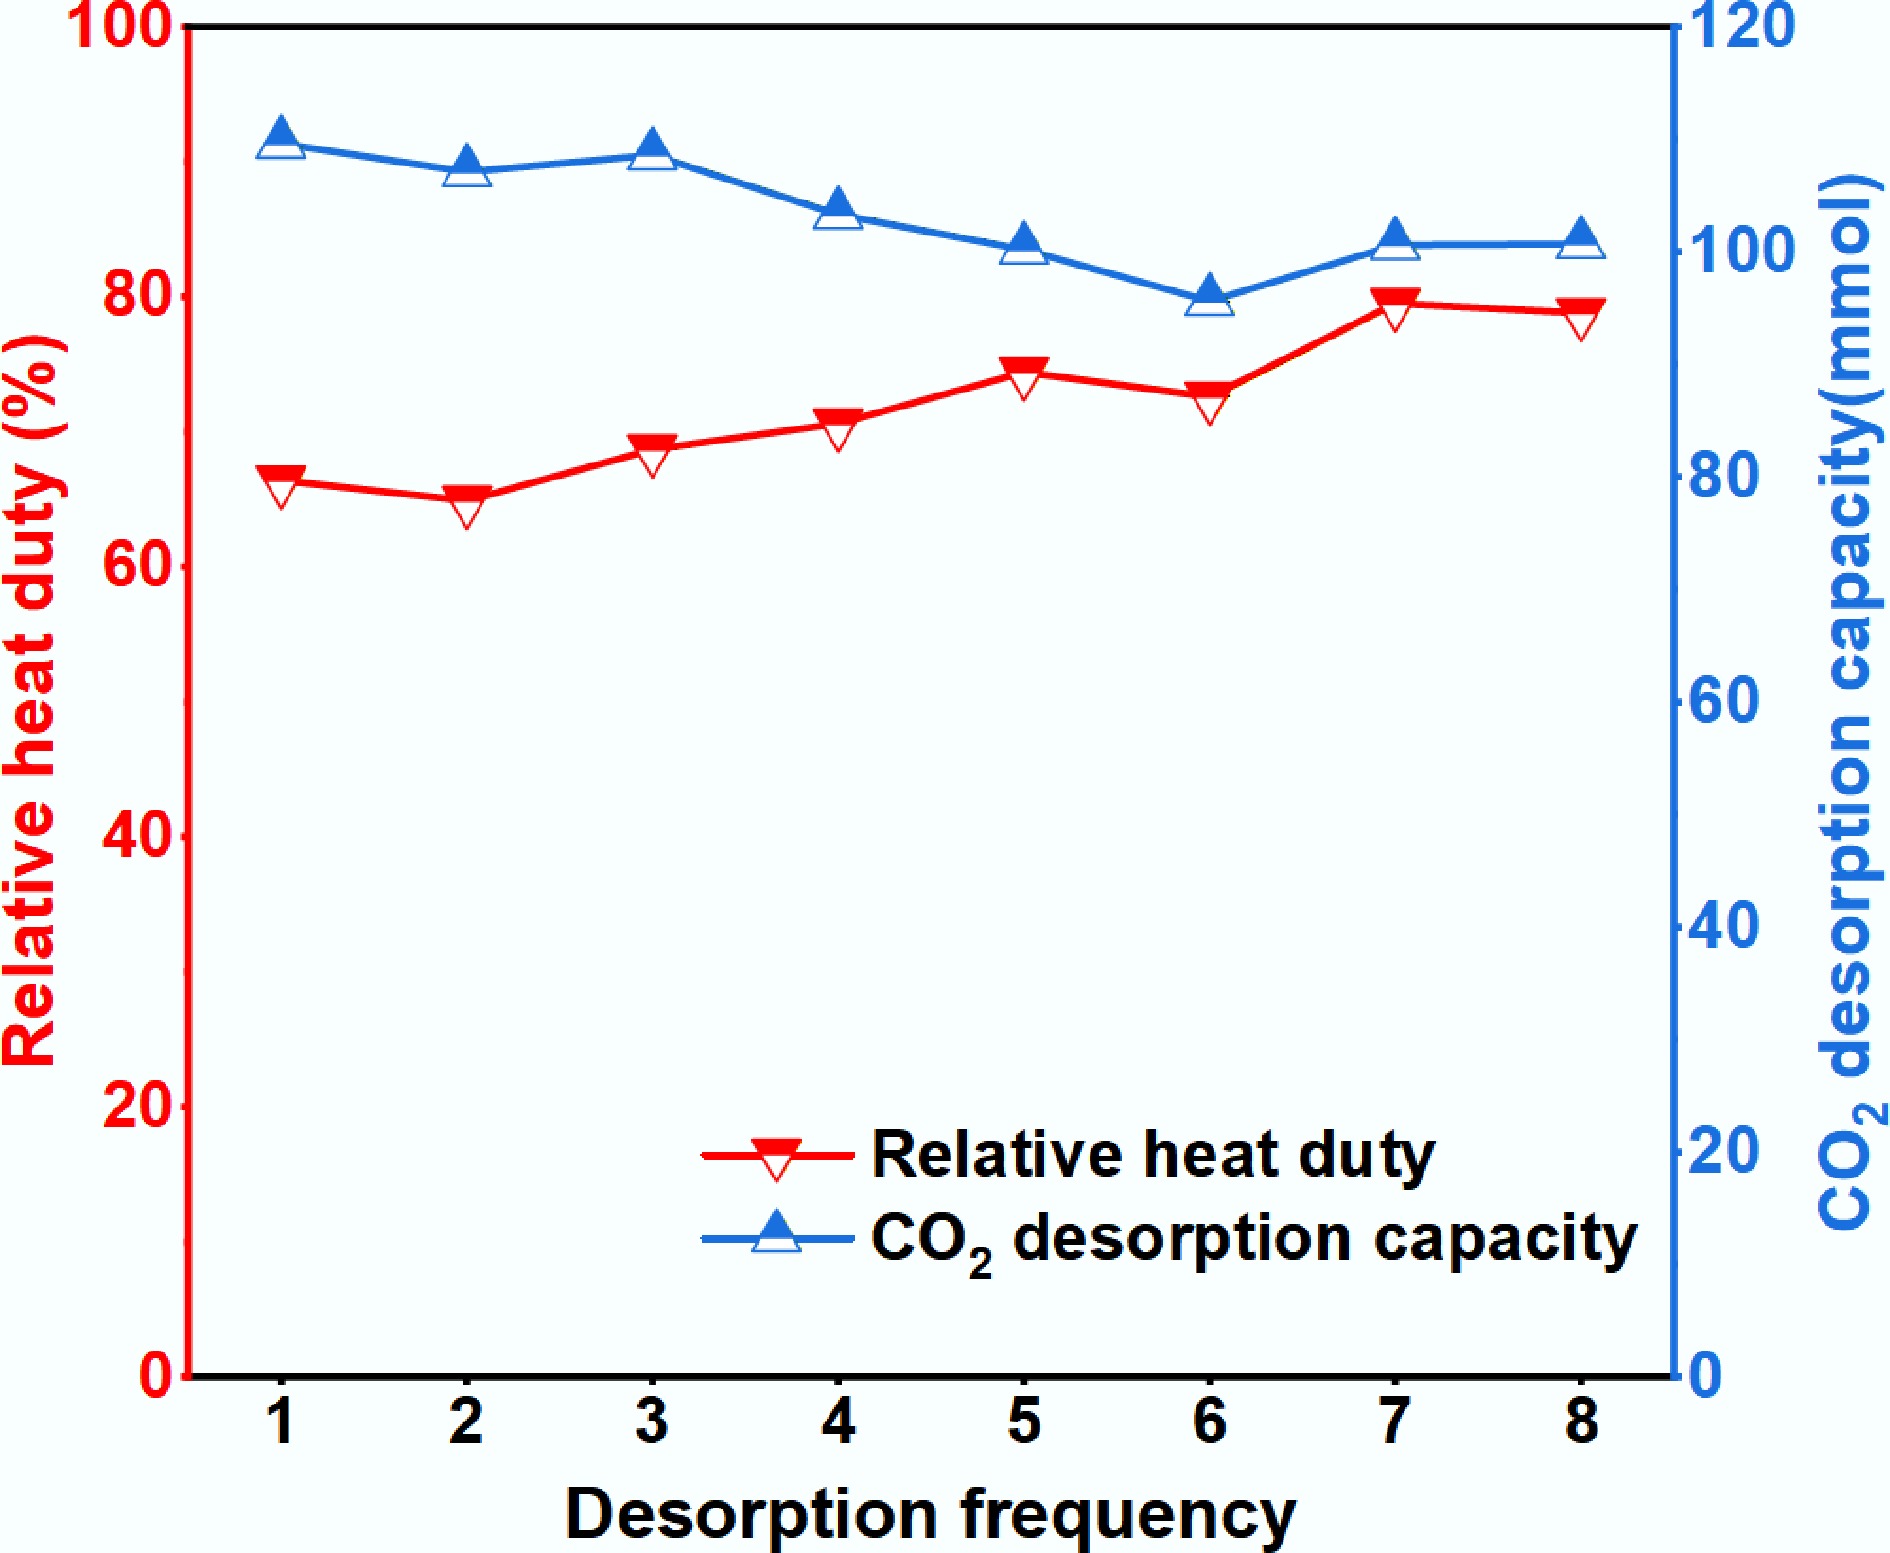
Figure 5.
Cyclic stability evaluation of the 10% Fe-CNF catalyst over eight adsorption-desorption cycles.
-
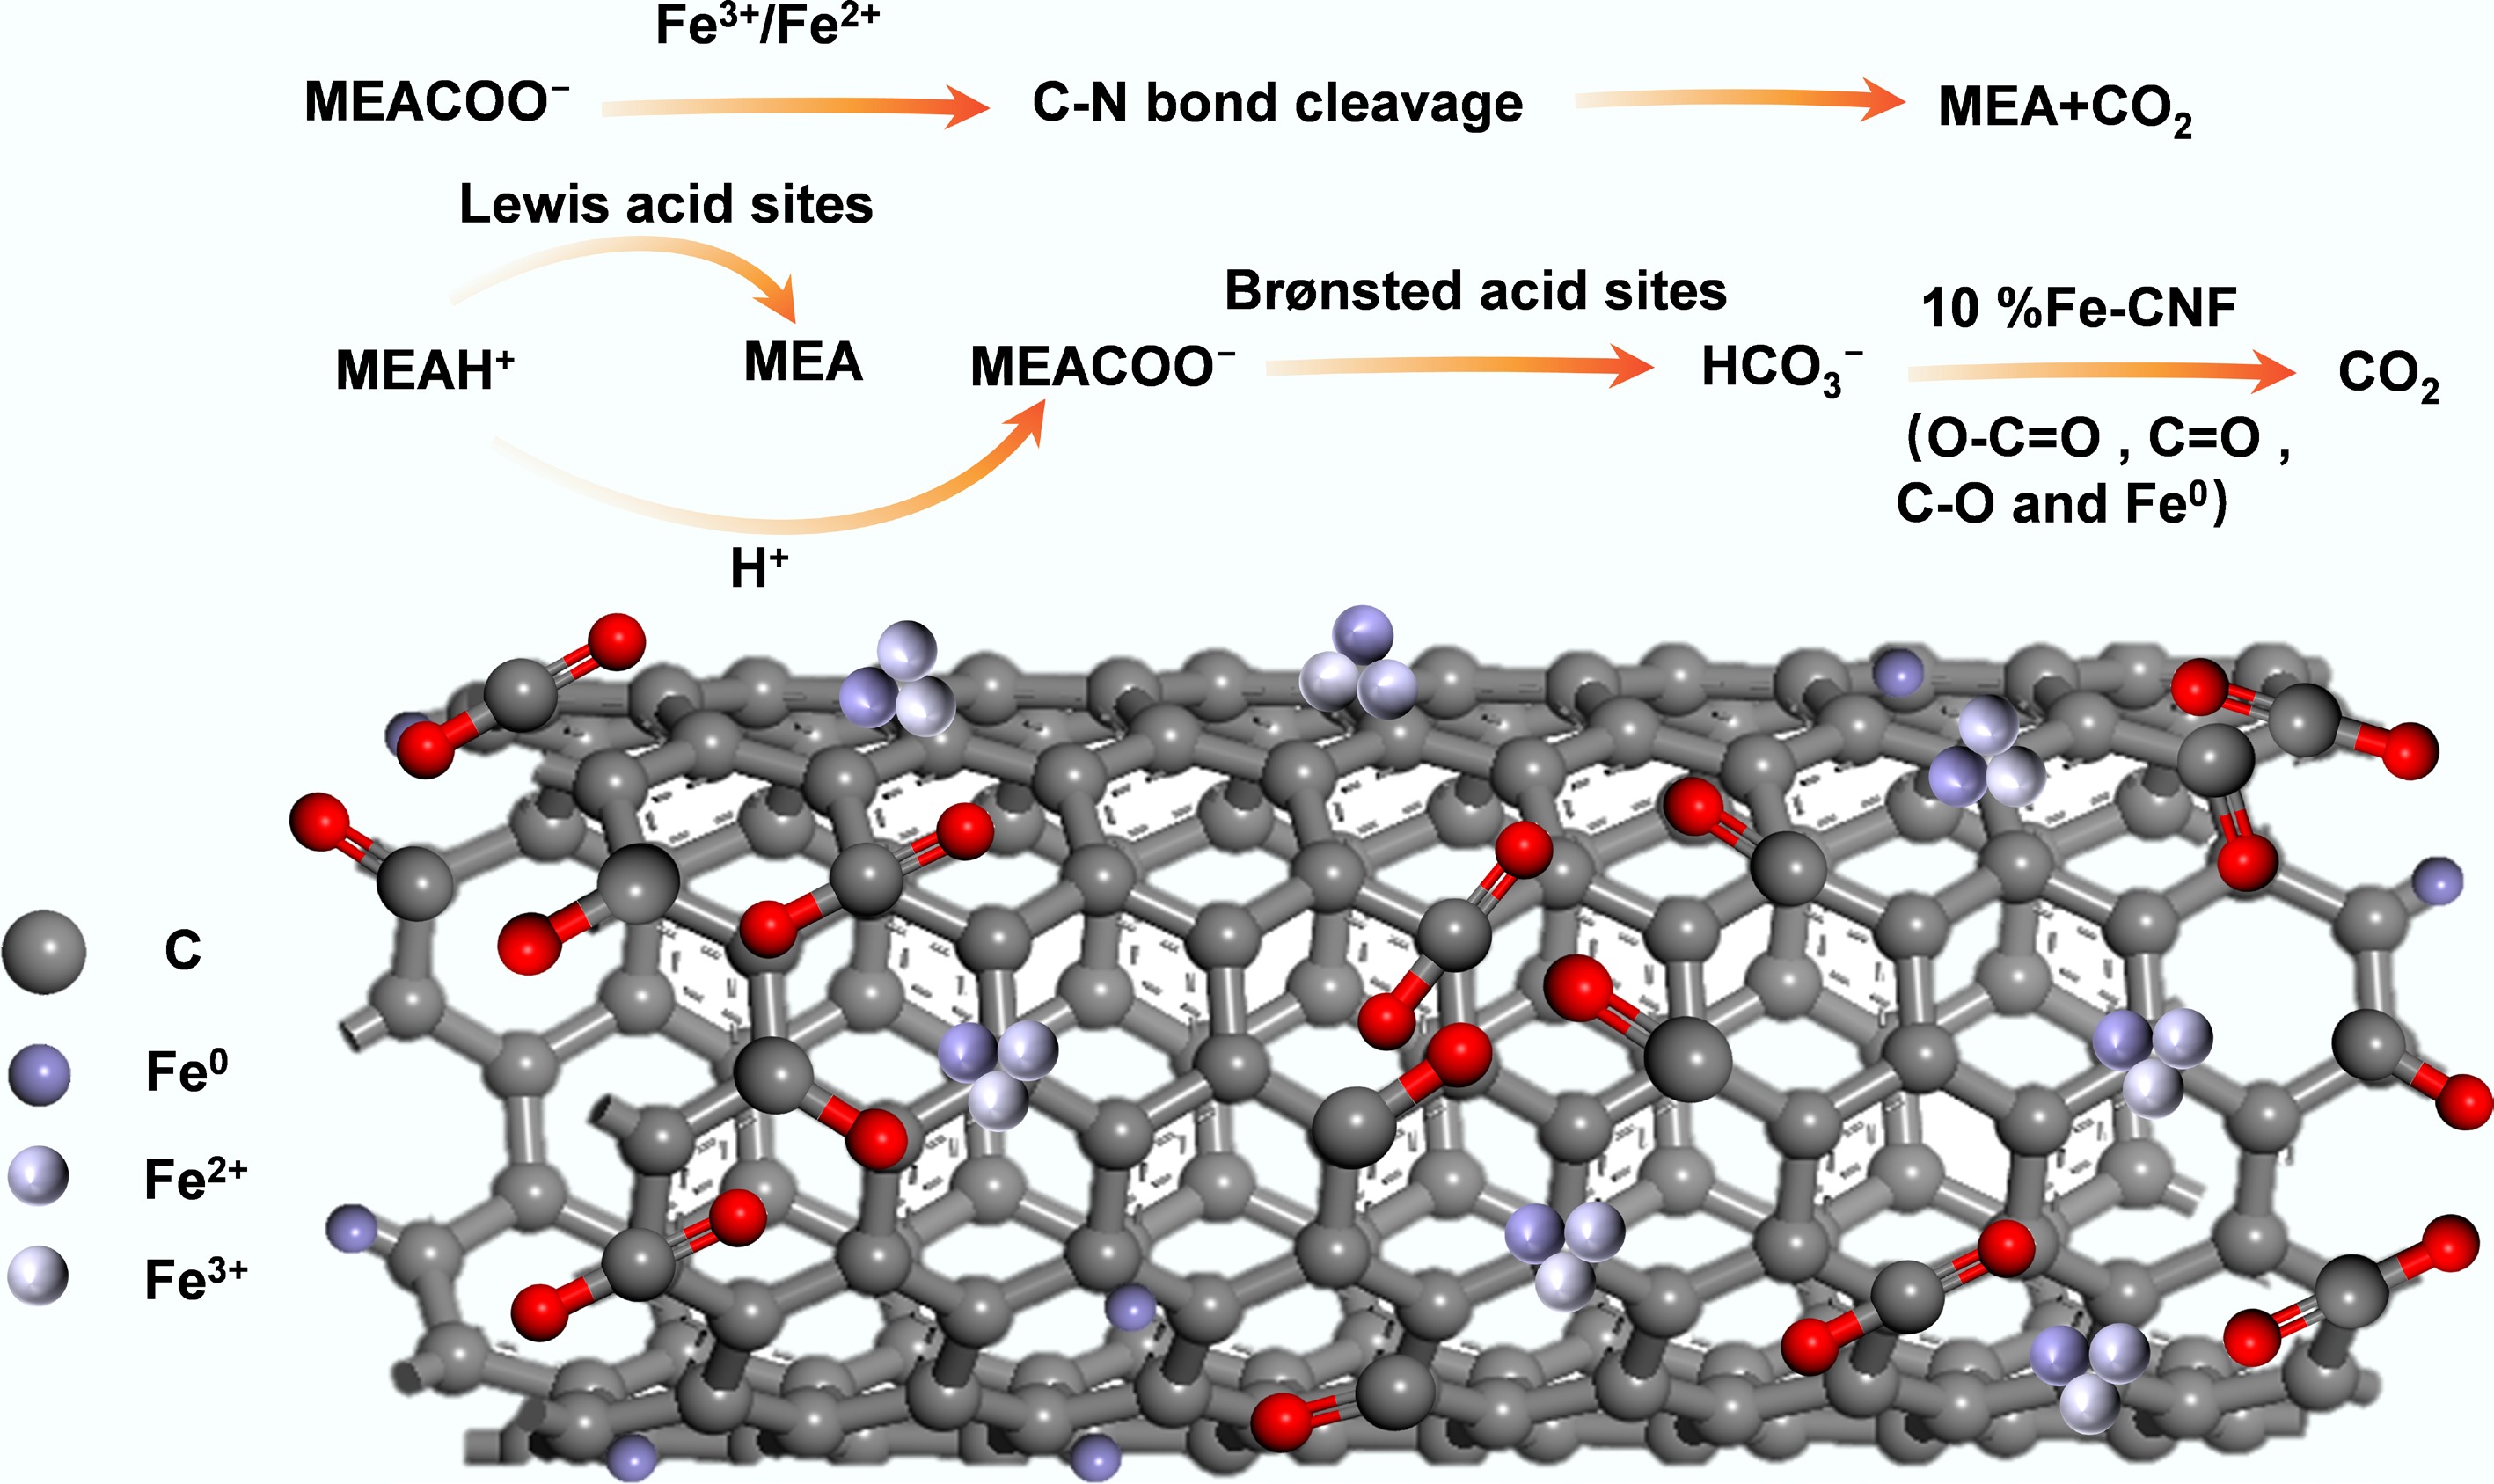
Figure 6.
Catalytic mechanism of 10% Fe-CNF for CO2 desorption from MEA solution.
-
Carbon material BET surface
area (m2/g)Total pore volume (cm3/g) Micropore volume (cm3/g) CNS 716.77 0.872 0.228 AC 32.11 0.059 0.005 MWCNT 238.63 1.342 0.028 CNF 19.74 0.027 0.006 10% Fe-CNF 27.79 0.059 0.004 20% Fe-CNF 28.89 0.058 0.004 5% Zr-CNF 22.64 0.049 0.003 20% Zr-CNF 24.91 0.054 0.004 Table 1.
Structural parameters of the carbon materials
Figures
(6)
Tables
(1)