-
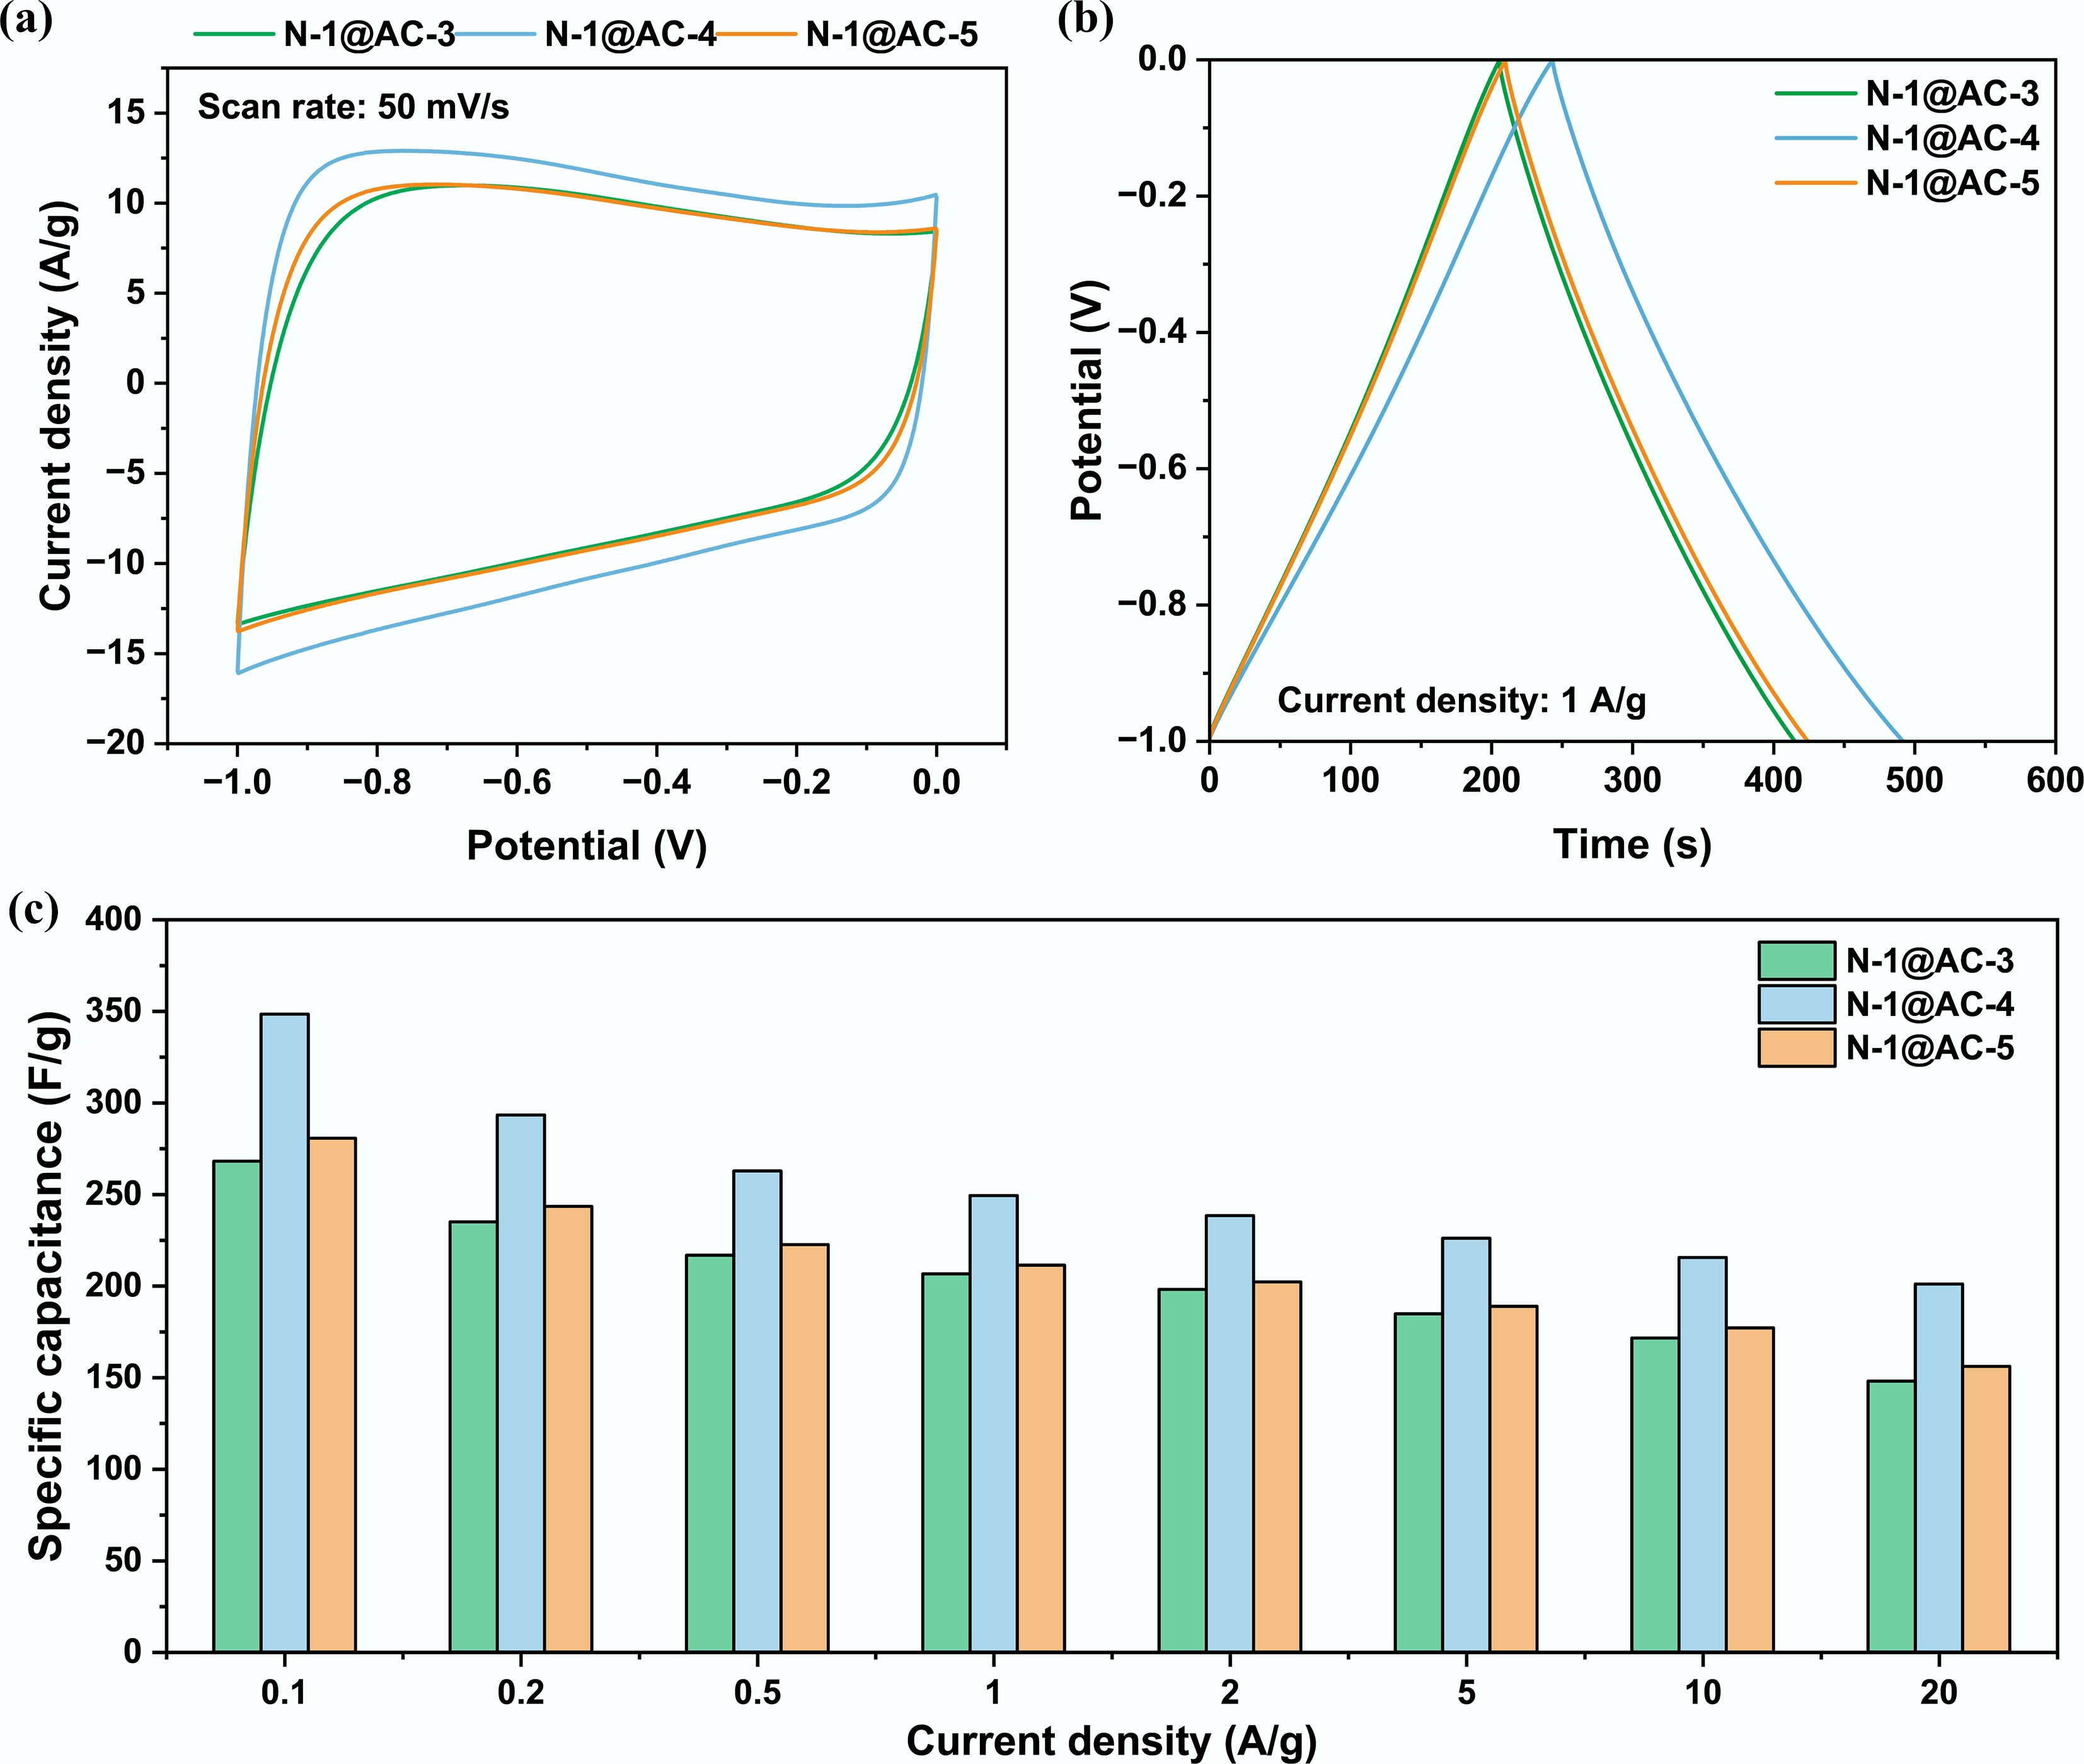
Figure 1.
Effect of activator to carbon precursor ratio on electrochemical performance in a three-electrode system: (a) Cyclic voltammogram curves at a scan rate of 50 mV s−1; (b) Galvanostatic charge and discharge curves at a current density of 1 A g−1; and (c) Specific capacitance at different current densities.
-
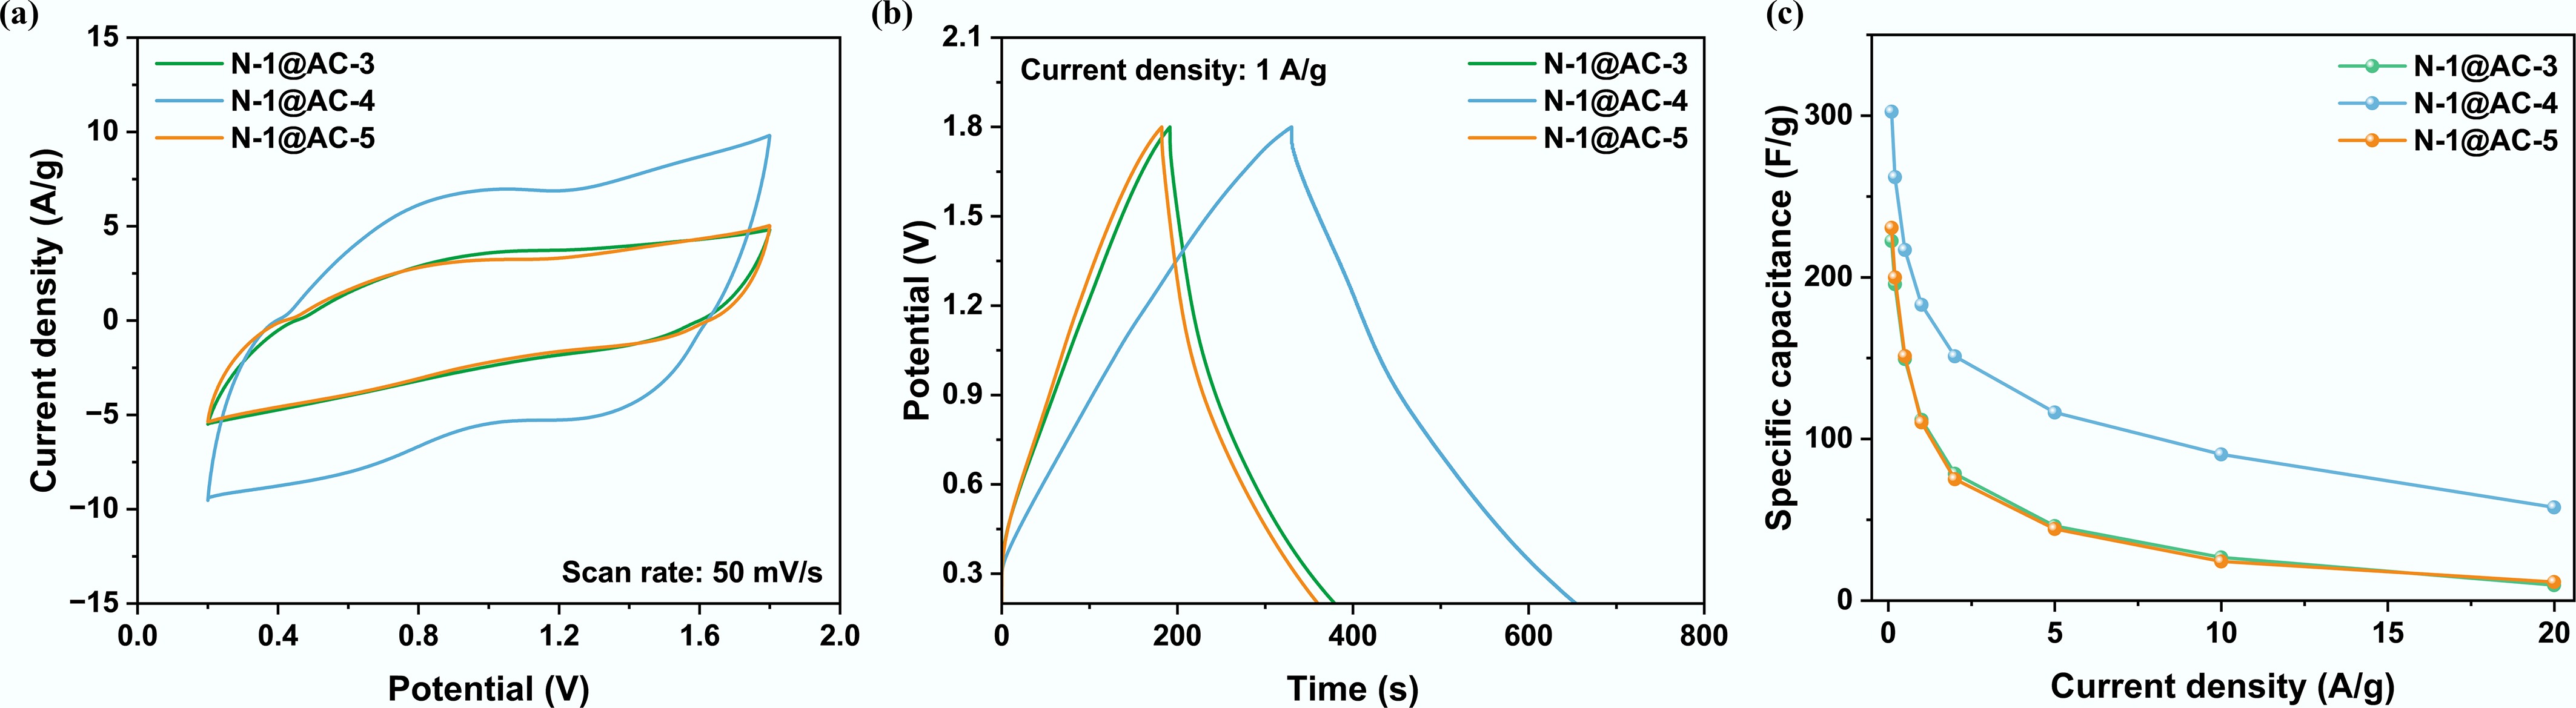
Figure 2.
Effect of activator to carbon precursor ratio on electrochemical performance in ZIHCs: (a) Cyclic voltammogram curves at a scan rate of 50 mV s−1; (b) Galvanostatic charge and discharge curves at a current density of 1 A g−1; and (c) Specific capacitance at different current densities.
-
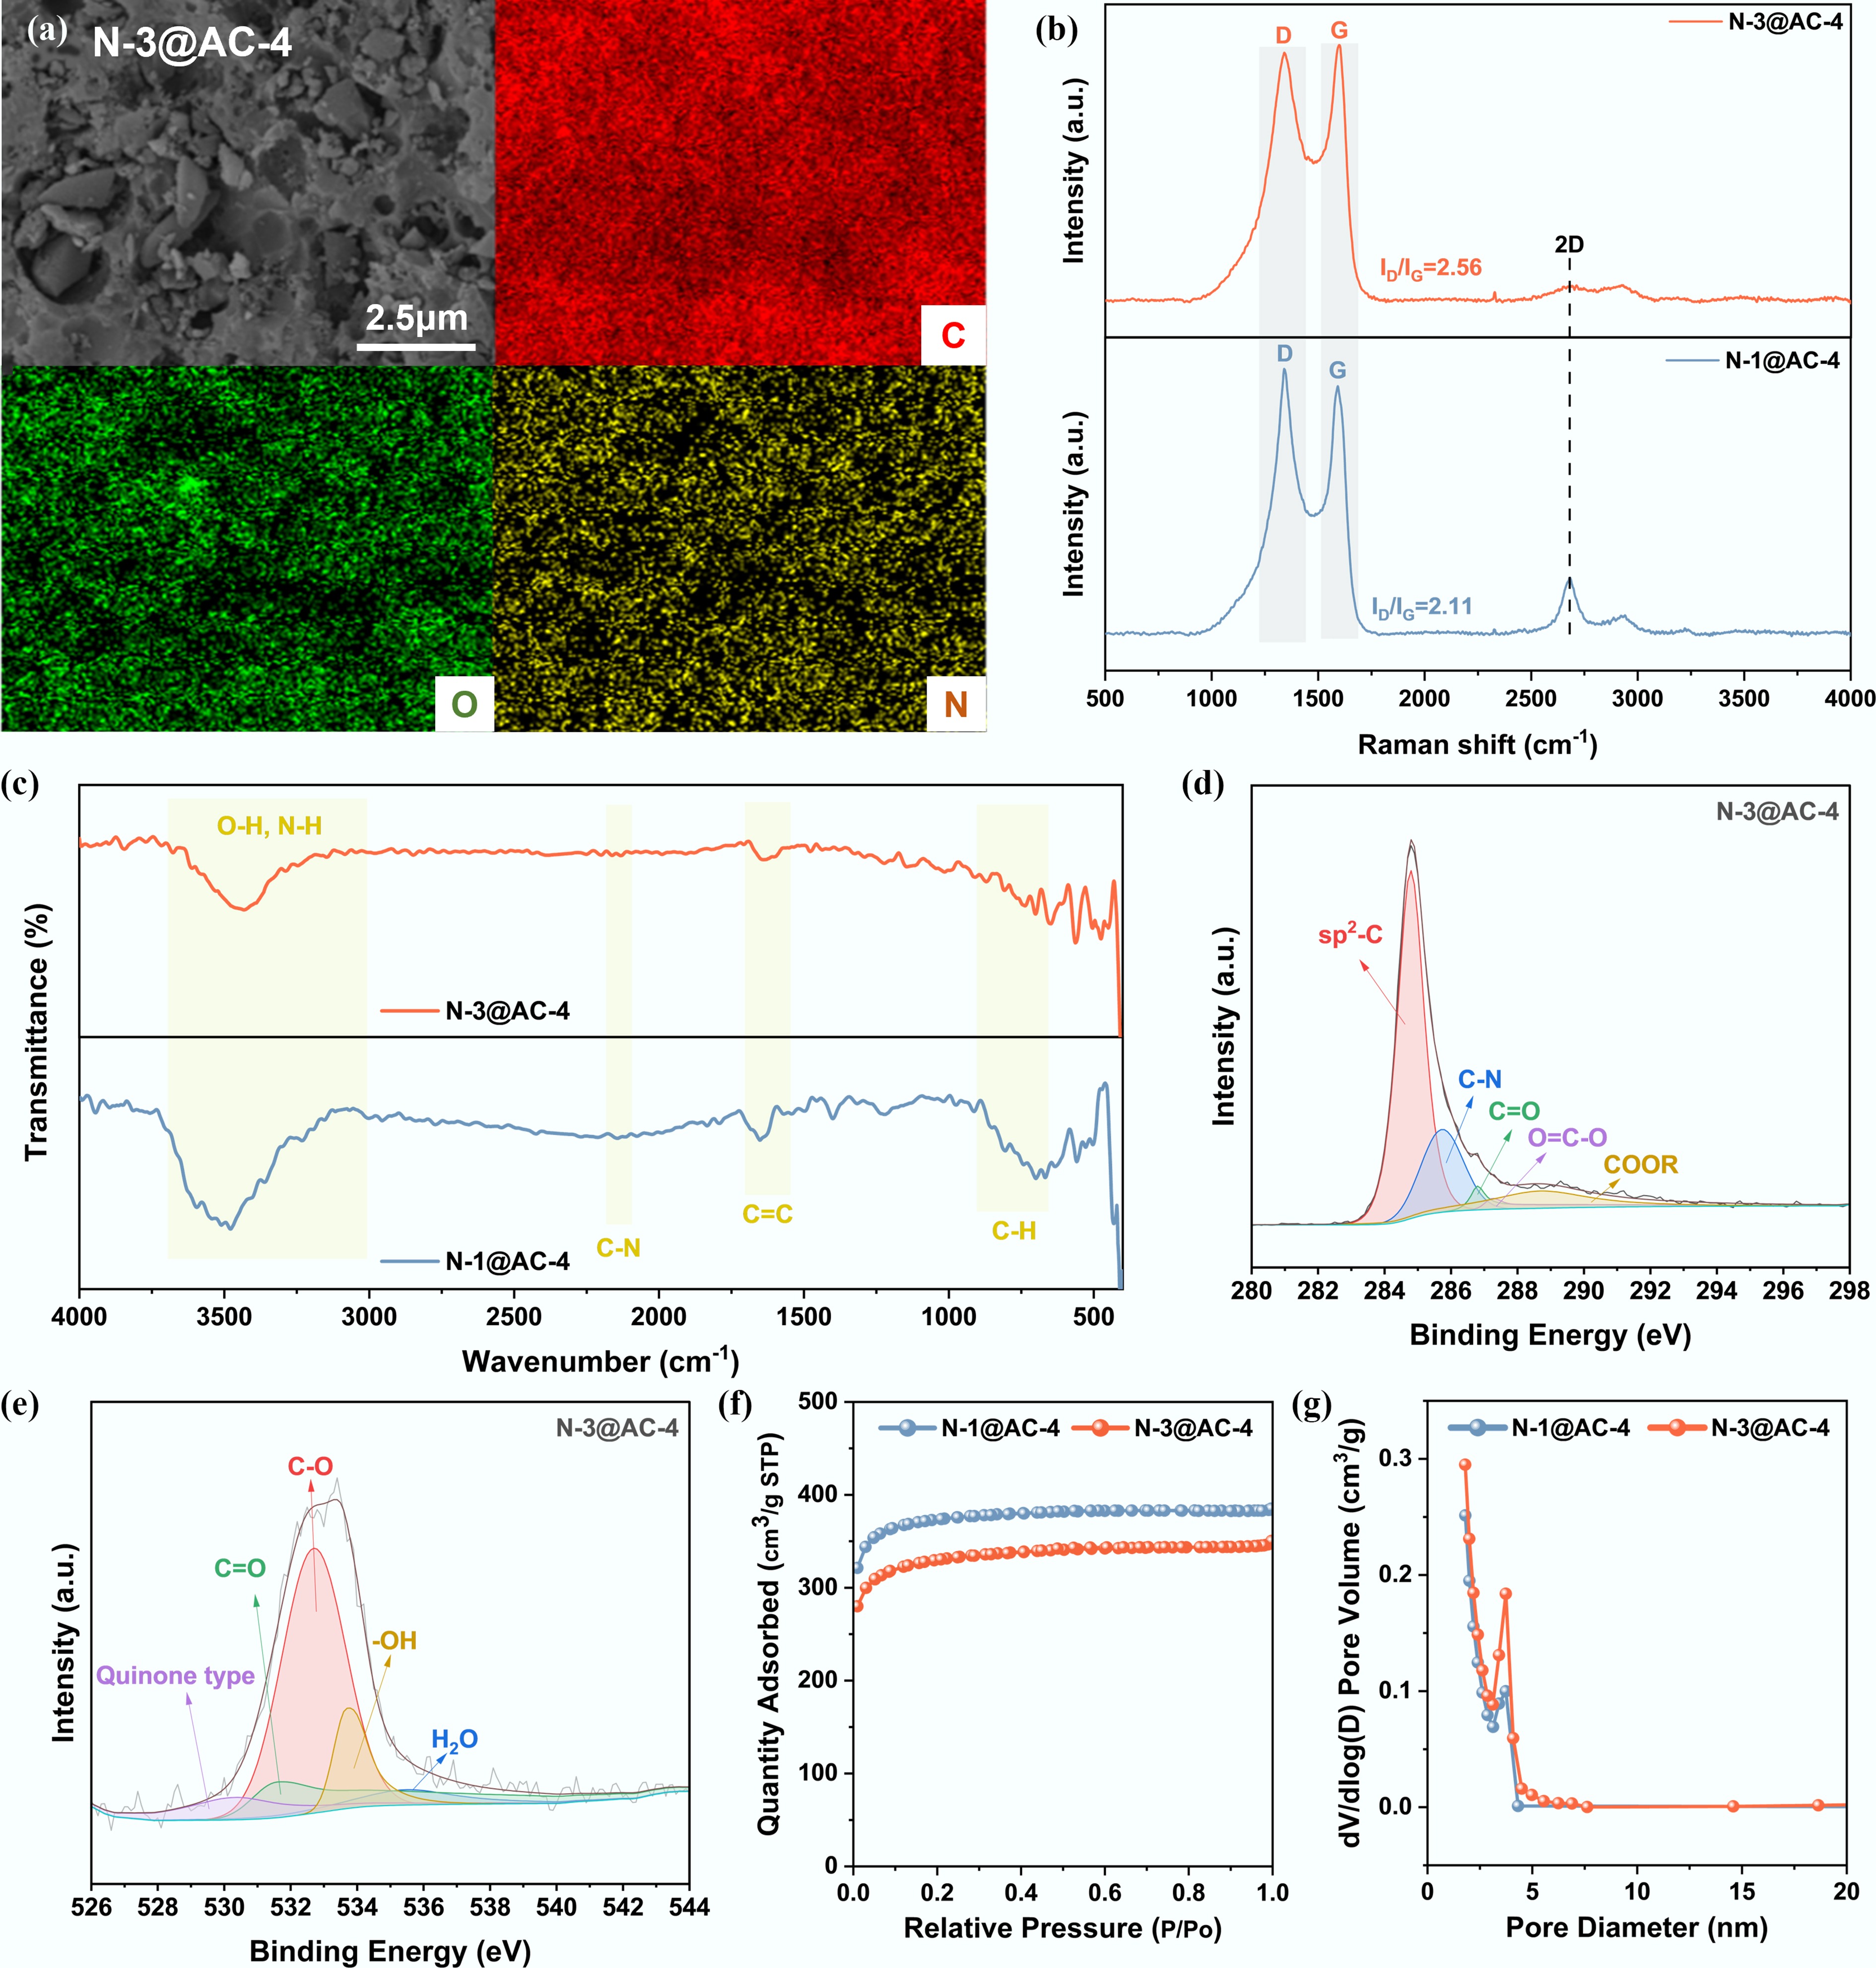
Figure 3.
Physicochemical characteristics of NHPCs: (a) SEM images and EDS elemental maps of N-3@AC-4; (b) Raman spectra; (c) FTIR spectra; (d), (e) High-resolution XPS C 1s and O 1s spectra of N-3@AC-4; (f) N2 sorption-desorption isotherms; and (g) Pore size distribution.
-
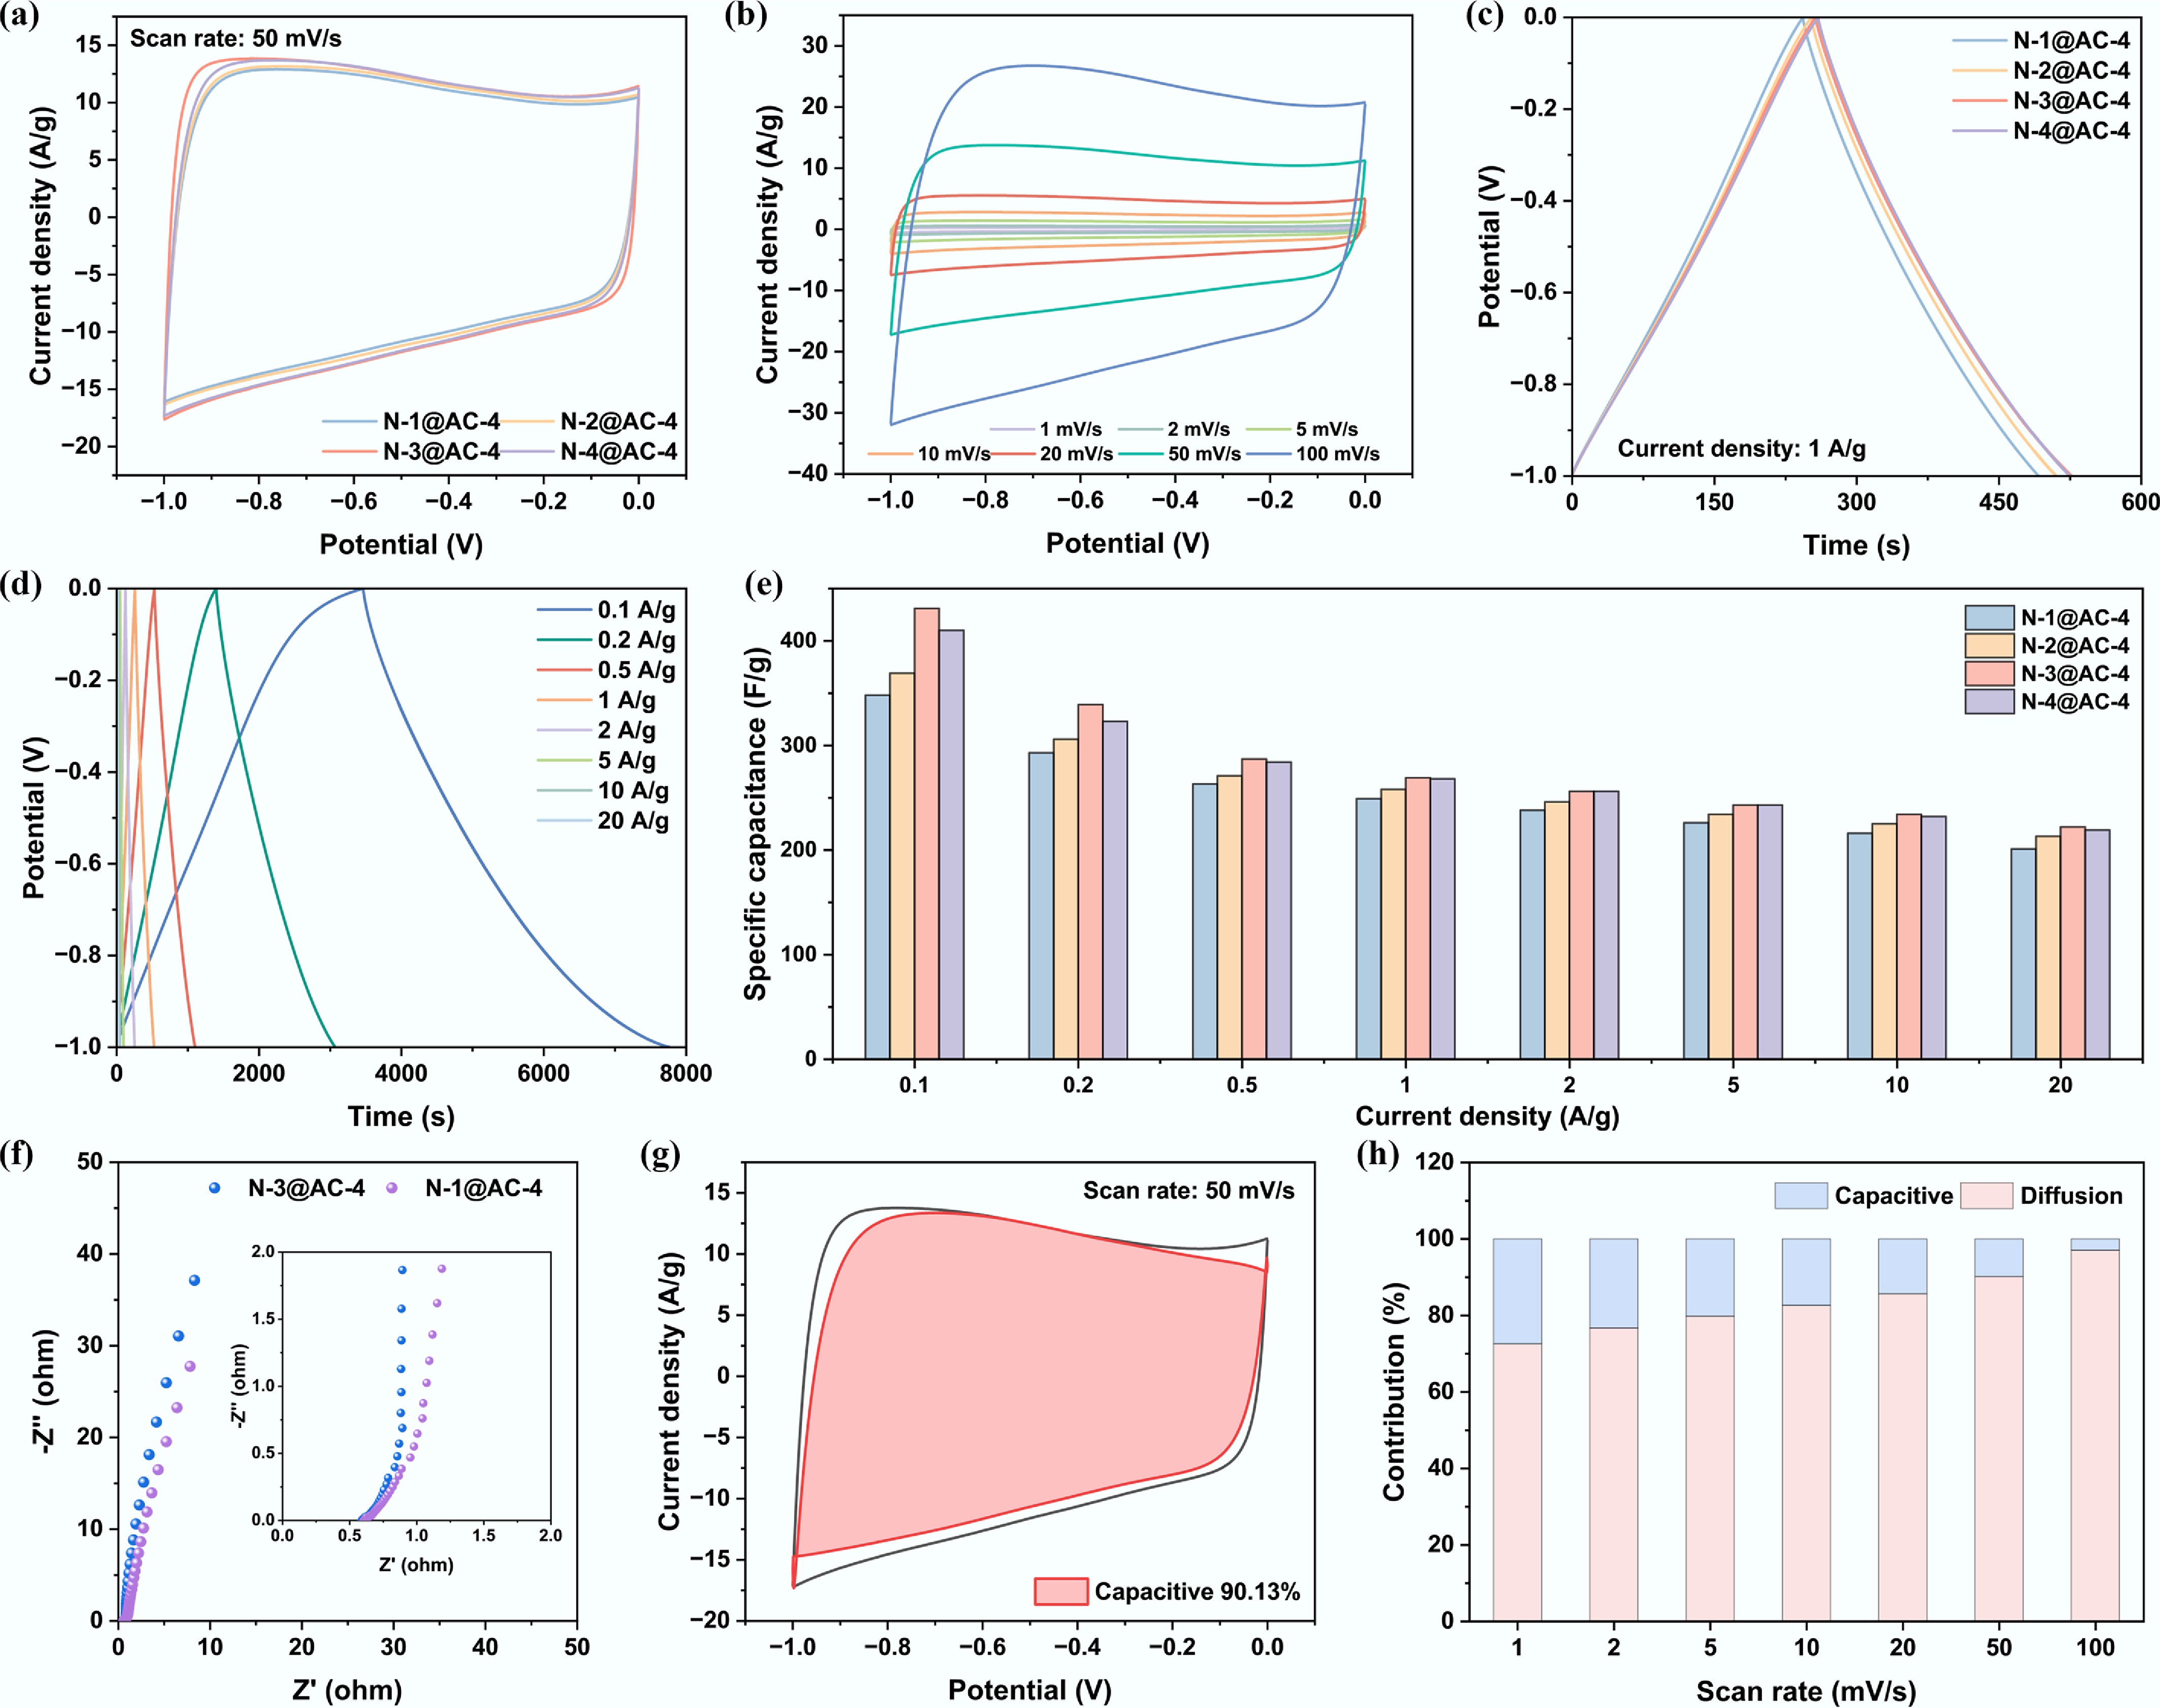
Figure 4.
Influence of PU to lignin ratio on electrochemical performance in a three-electrode system: (a) Cyclic voltammogram curves at a scan rate of 50 mV s−1; (b) Cyclic voltammogram curves of N-3@AC-4 at different scan rates; (c) Galvanostatic charge and discharge curves at a current density of 1 A g−1; (d) Galvanostatic charge and discharge curves of N-3@AC-4 at different current densities; (e) Specific capacitance at different current densities; (f) Nyquist plots of N-1@AC-4 and N-3@AC-4; (g) Capacitive contribution of N-3@AC-4 at 10 mV s−1; and (h) Diffusion-capacitive contribution ratio of N-3@AC-4.
-
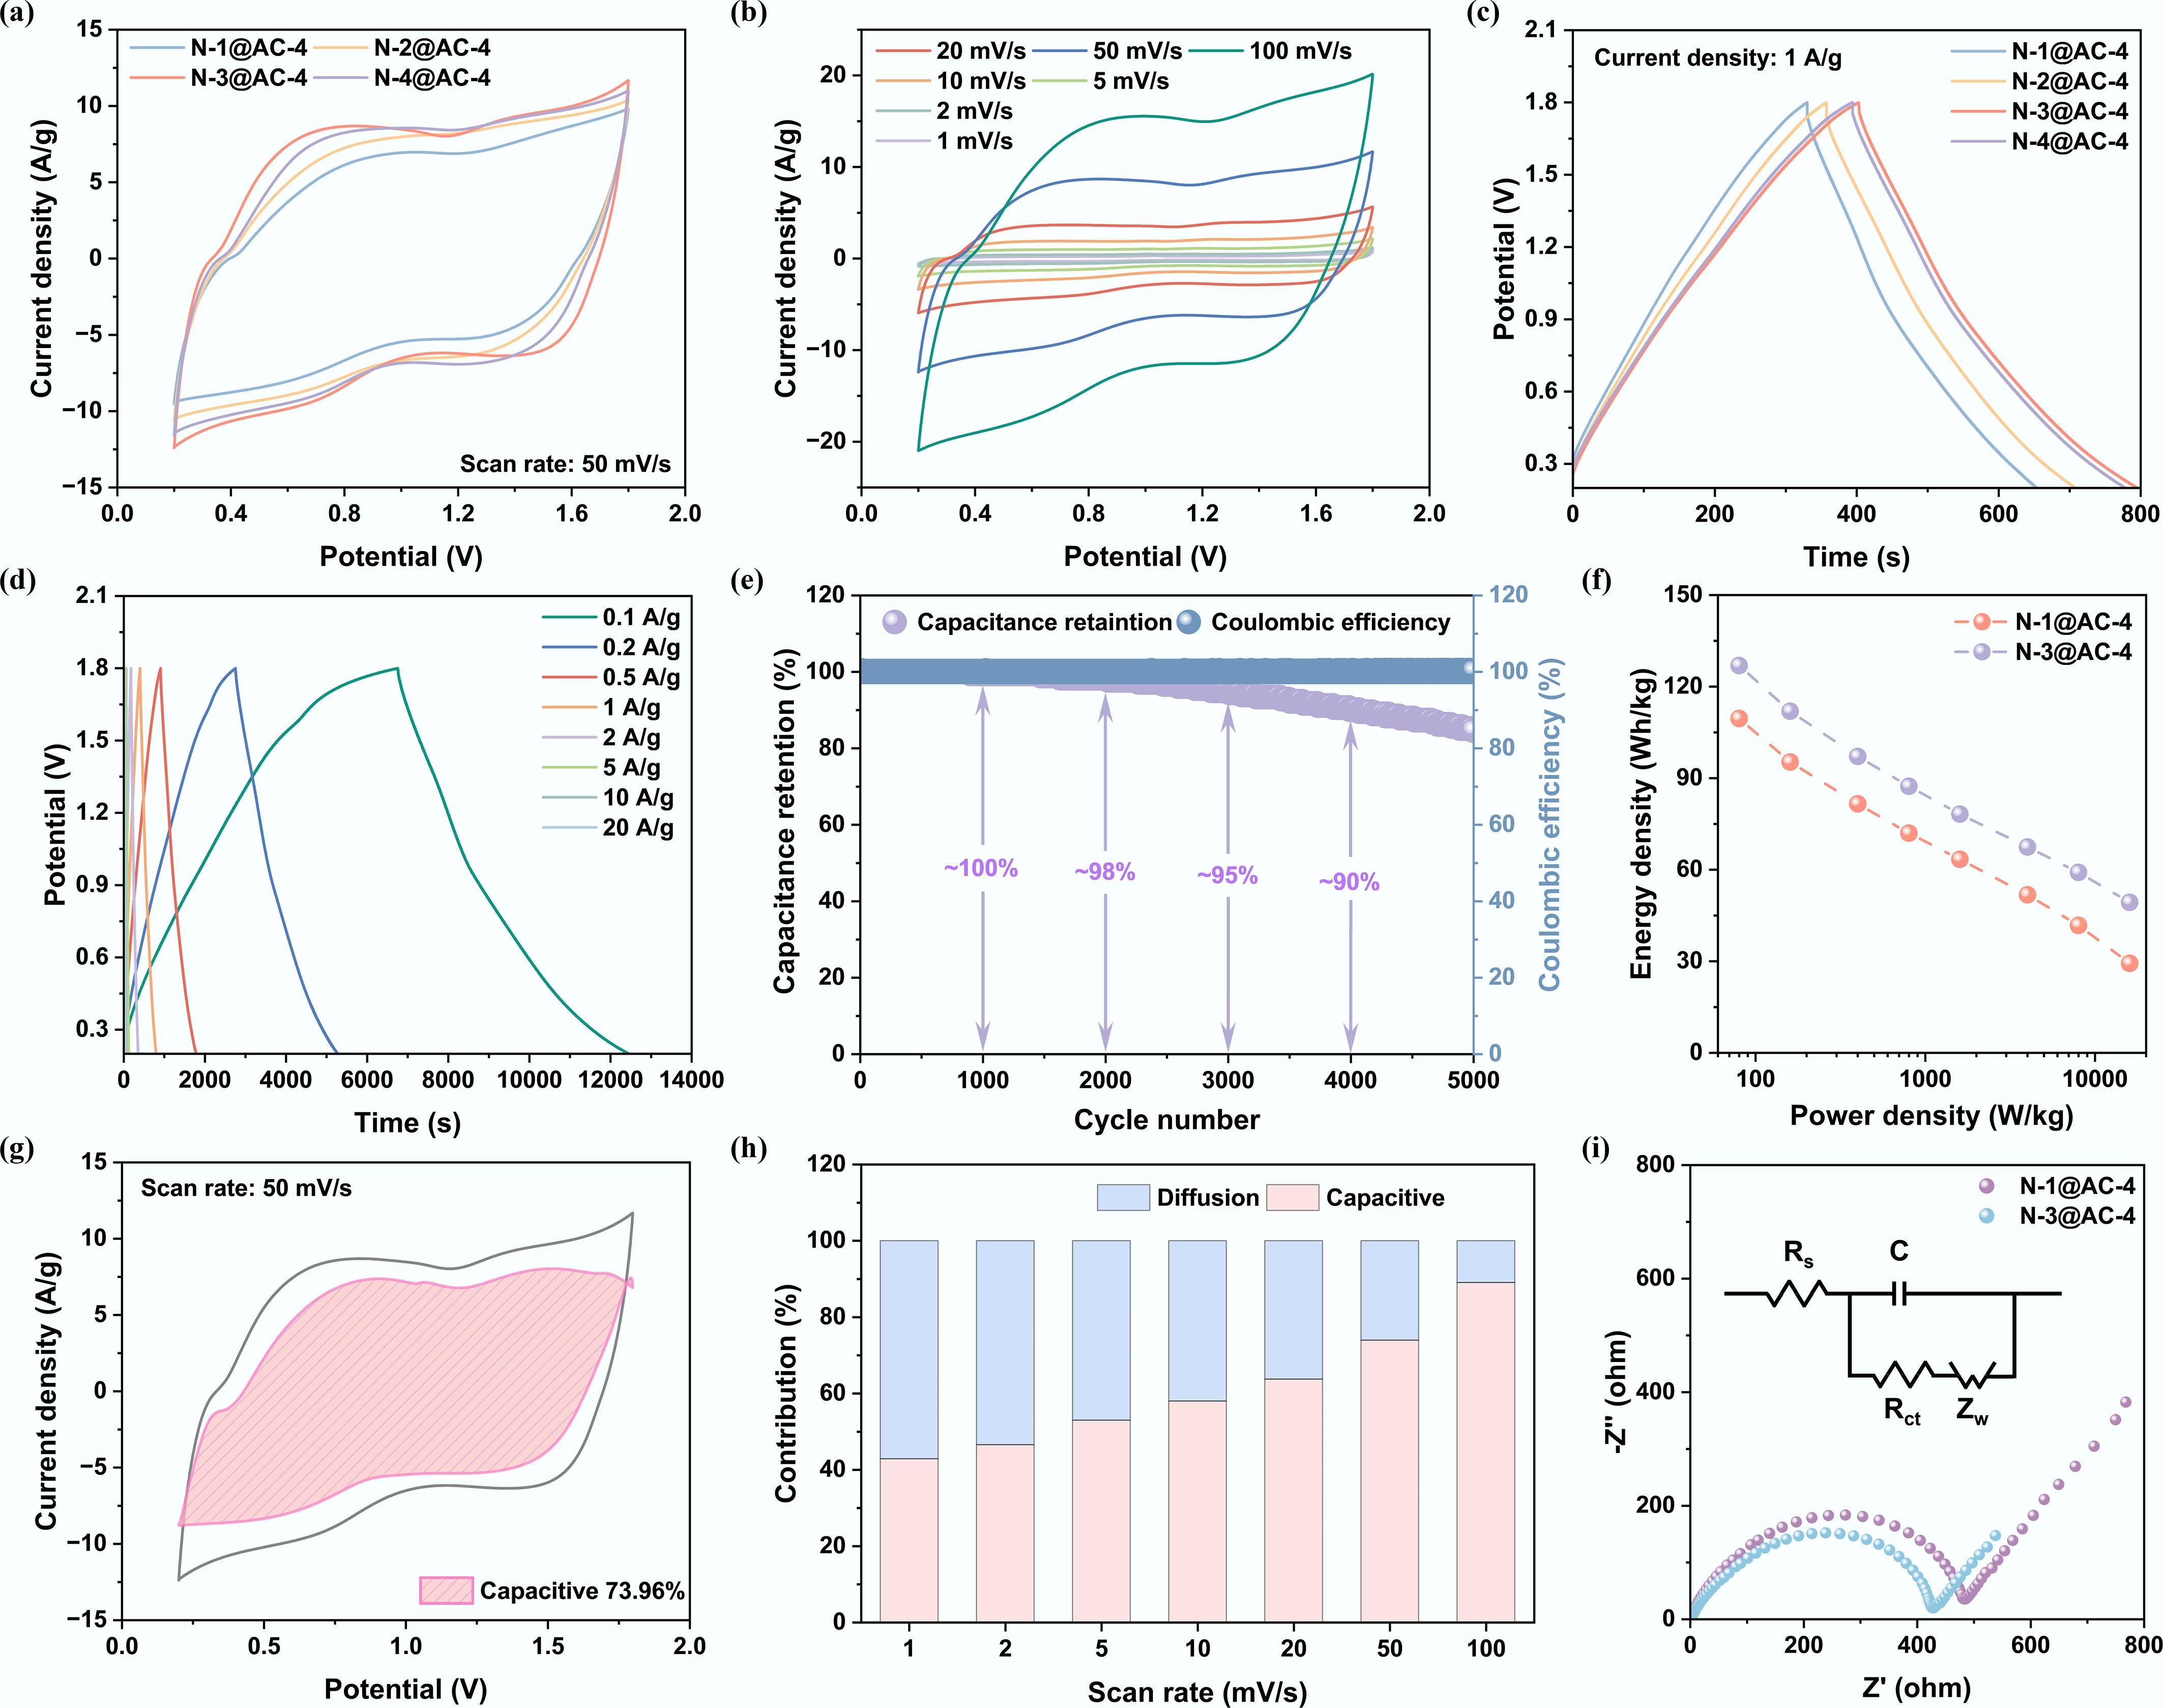
Figure 5.
Influence of PU to lignin ratio on electrochemical performance in ZIHCs: (a) Cyclic voltammogram curves at a scan rate of 50 mV s−1; (b) Cyclic voltammogram curves of N-3@AC-4 at different scan rates; (c) Galvanostatic charge and discharge curves at a current density of 1 A g−1; (d) Galvanostatic charge and discharge curves of N-3@AC-4 at different current densities; (e) Cycling performance of N-3@AC-4; (f) Energy-power density; (g) Capacitive contribution at 50 mV s−1; (h) Diffusion-capacitive contribution ratio of N-3@AC-4; and (i) Nyquist plots of N-1@AC and N-3@AC-4.
-
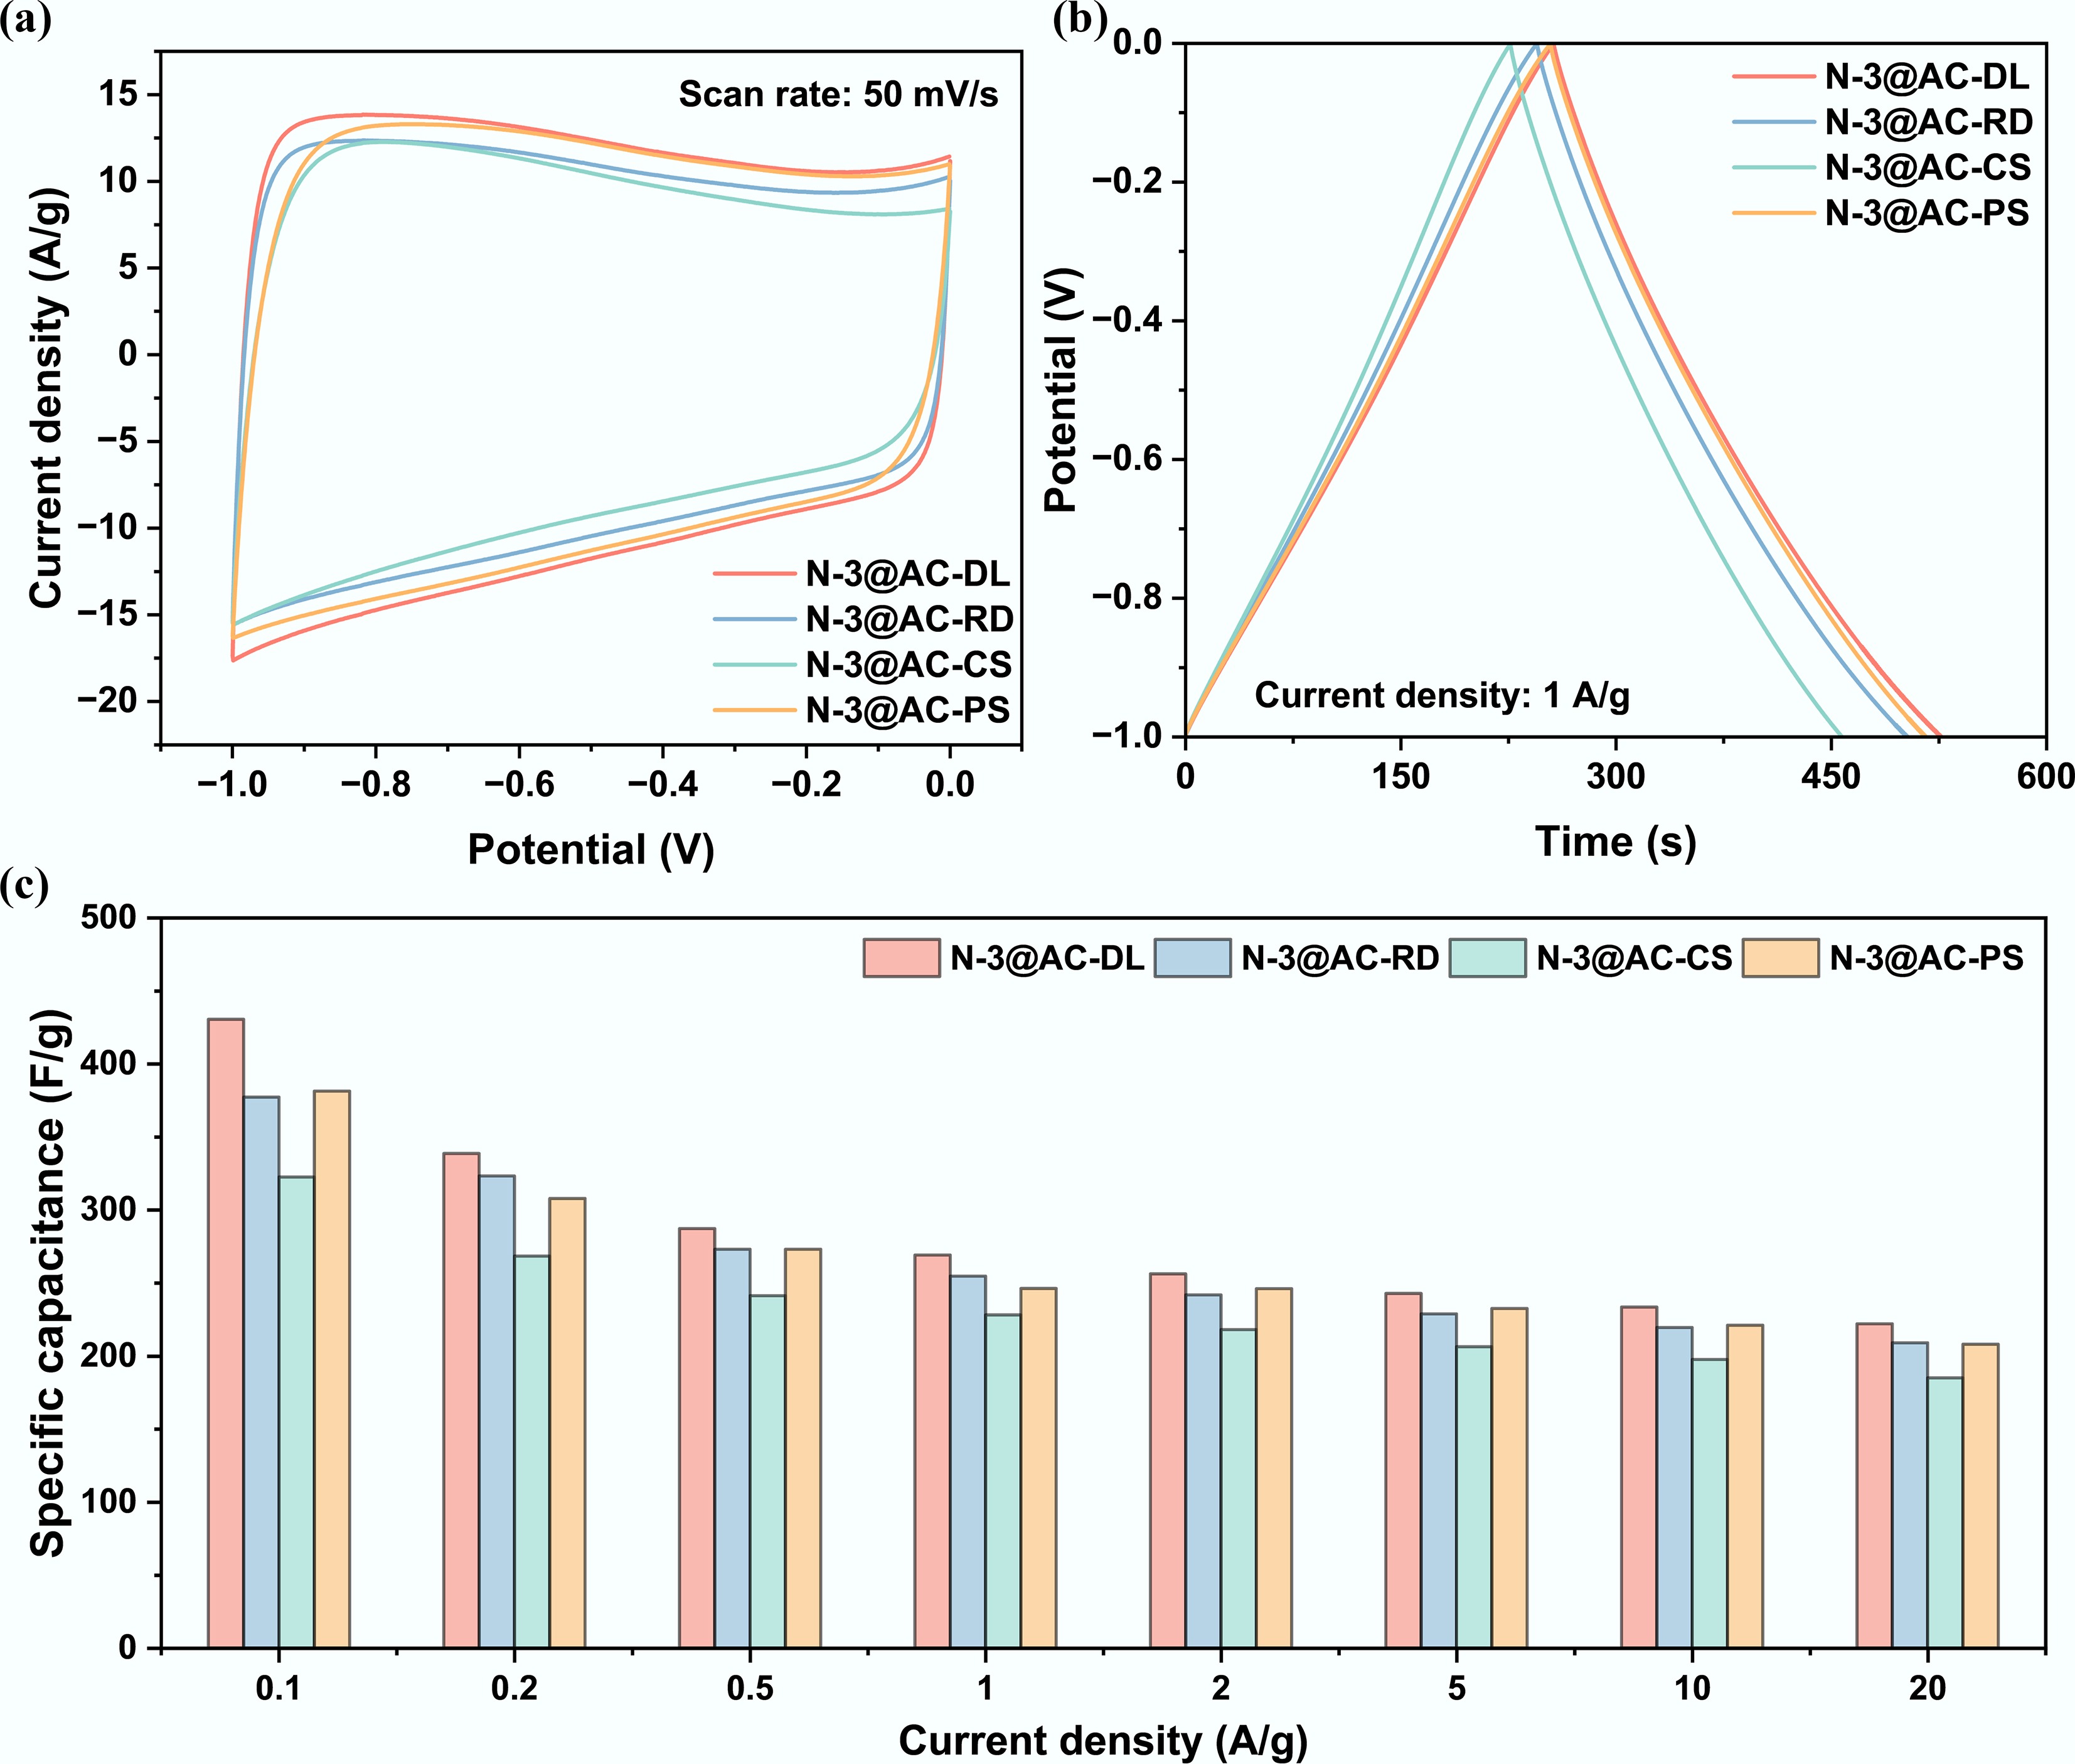
Figure 6.
Optimization of carbon precursor source of NHPCs in a three-electrode system: (a) Cyclic voltammogram curves at a scan rate of 50 mV s−1; (b) Galvanostatic charge and discharge curves at a current density of 1 A g−1; and (c) Specific capacitance at different current densities.
-
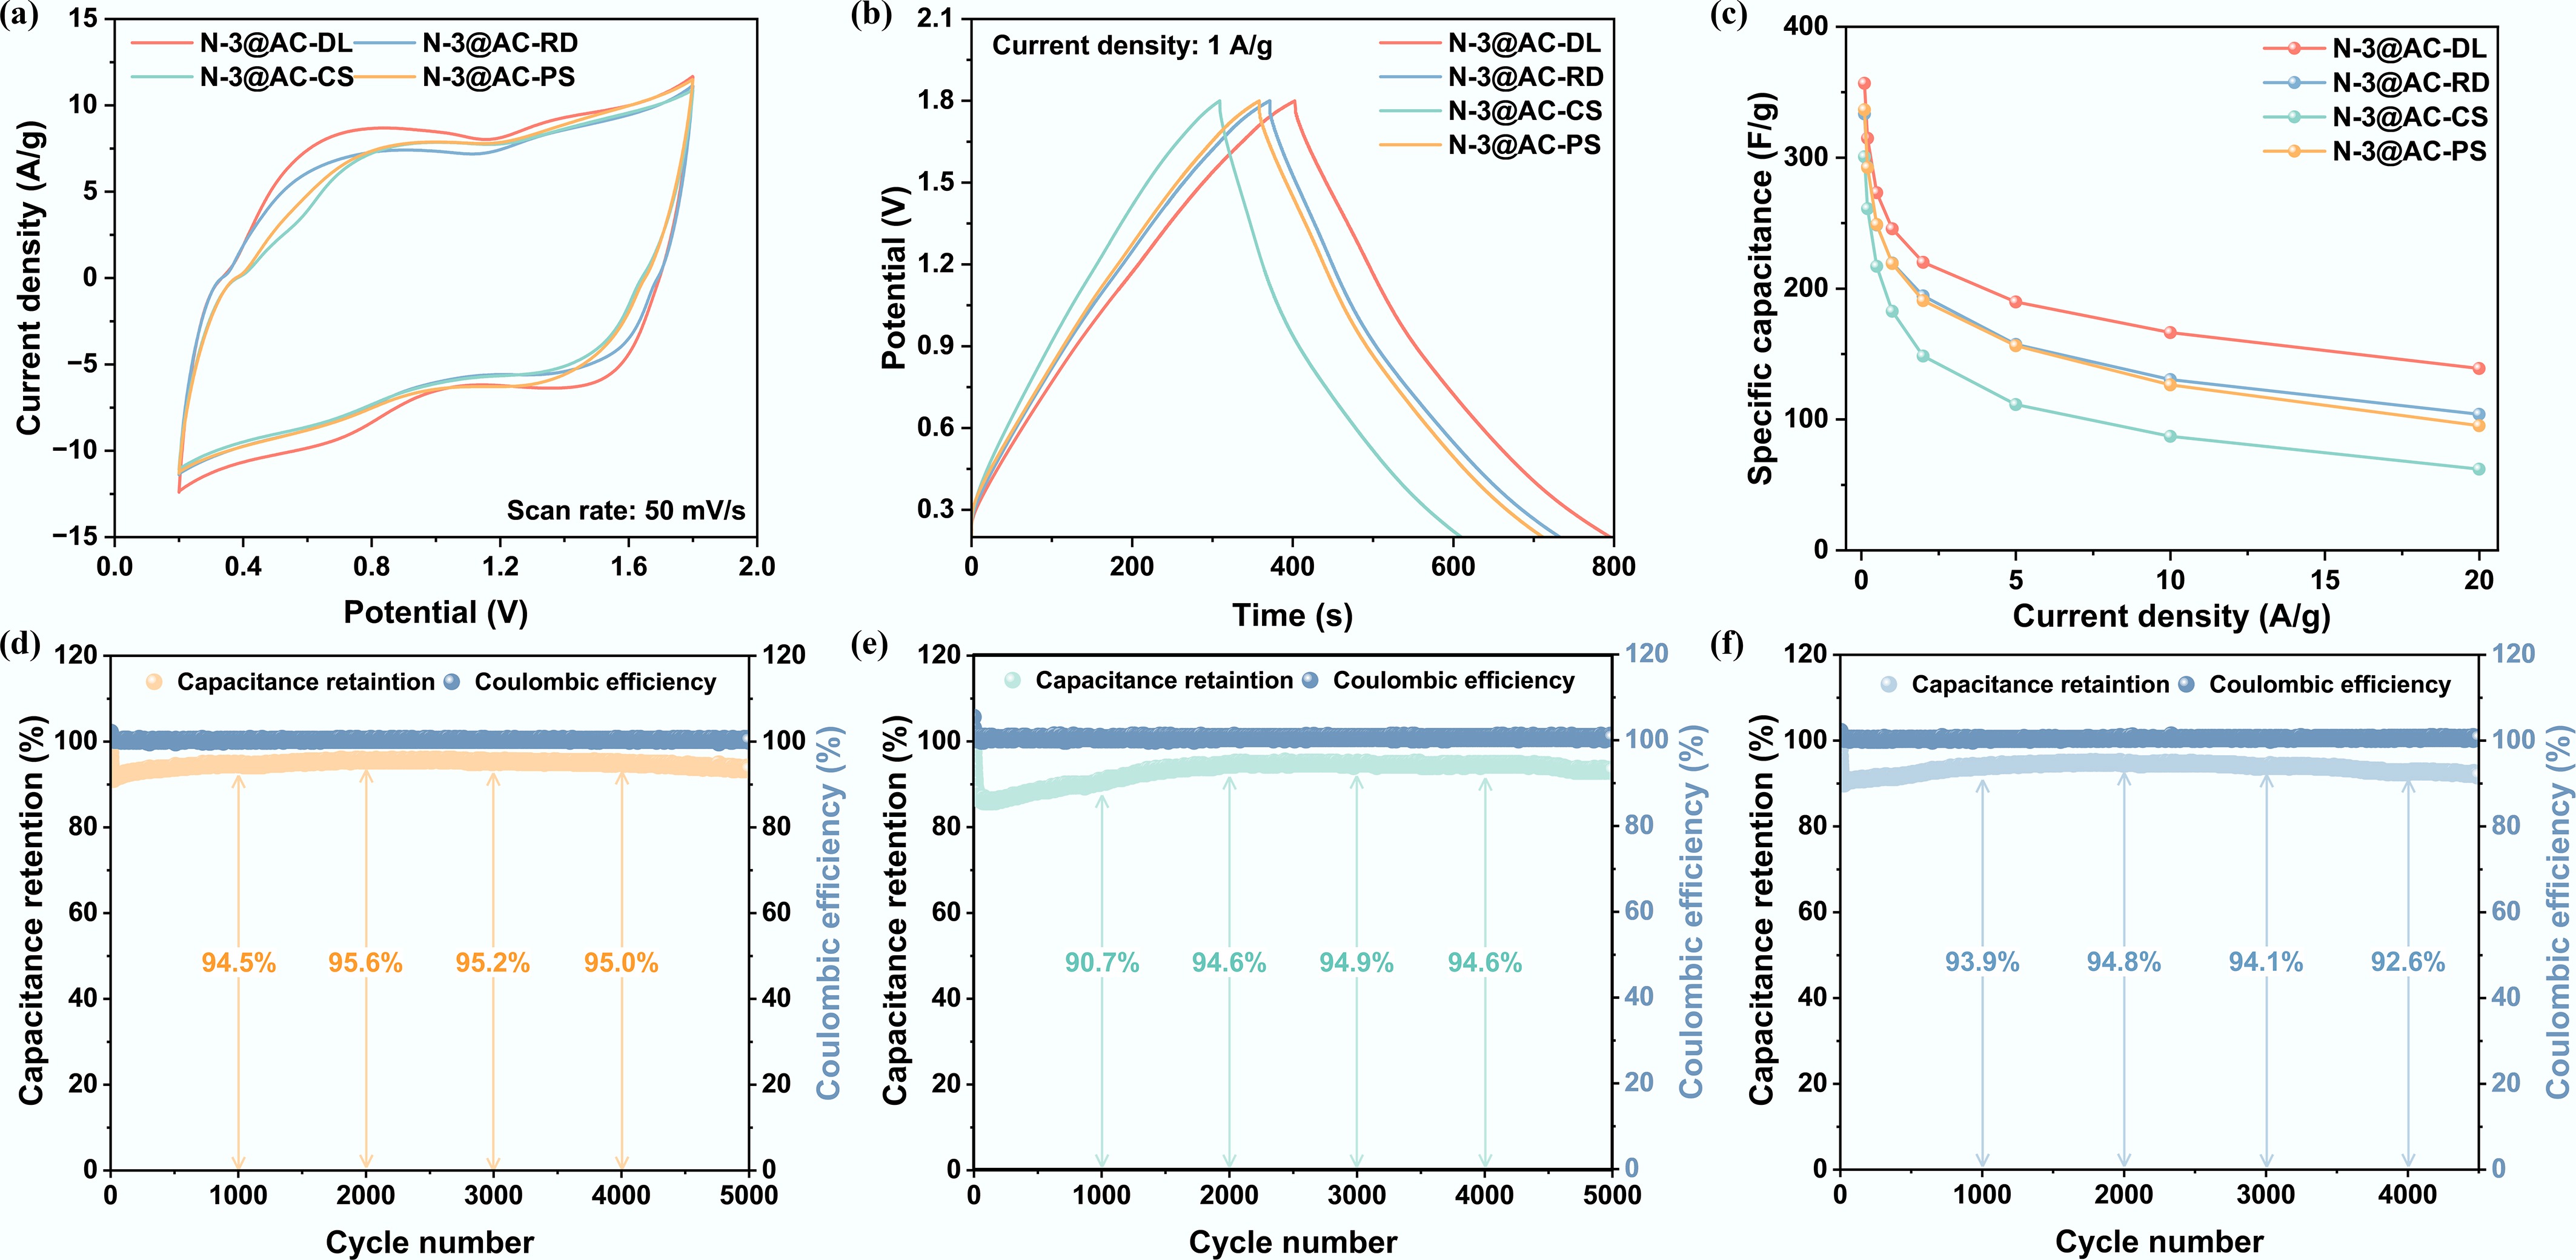
Figure 7.
Optimization of carbon precursor source of NHPCs in ZIHCs: (a) Cyclic voltammogram curves at a scan rate of 50 mV s−1; (b) Galvanostatic charge and discharge curves at a current density of 1 A g−1; (c) Specific capacitance at different current densities; and (d)–(f) Cyclic stability of N-3@AC-PS, N-3@AC-CS, and N-3@AC-RD.
-
Materials SBETa (m2 g−1) Smicb (m2 g−1) Smesc (m2 g−1) Vtotald (cm3 g−1) Vmicb (cm3 g−1) Vmesc (cm3 g−1) Davge (nm) N-1@AC-4 1,271 1,108 163 0.596 0.505 0.091 1.88 N-3@AC-4 1,133 935 198 0.542 0.423 0.119 1.91 a SBET is BET specific surface area; b Smic is microporous surface area and Vmic is microporous pore volume are calculated by t-plot method; c Smes is mesoporous surface area determined by the t-plot method external surface area (Smes = SBET – Smic) and Vmes is mesoporous pore volume (Vmes = Vtotal – Vmic); d Vtotal is total volume acquired at P/P0 = 0.99; e Davg is average pore diameter calculated by 4Vtotal/SBET. Table 1.
Textural characteristics of NHPCs
-
Sample Current density (A g−1) 0.1 0.2 0.5 1 2 5 10 20 N-1@AC-4 302.5 262.0 216.9 182.9 151.1 116.3 90.3 57.5 N-2@AC-4 320.3 287.5 247.3 218.1 192.9 167.2 142.8 110.6 N-3@AC-4 356.9 314.8 273.1 245.6 220.0 189.7 166.3 138.8 N-4@AC-4 351.9 310.6 267.7 239.4 214.2 183.6 159.7 129.4 Table 2.
Specific capacitance (F g−1) of NHPCs in ZIHCs
-
Material Feedstock Nitrogen precursor Specific capacitance Energy density Ref. NSLHPC Enzymatic hydrolysis lignin Potassium thiocyanide 295 F g−1@0.2 A g−1 104.9 Wh kg−1@160.6 W kg−1 [55] L-NS-CNS Sodium lignosulfonate NH4Cl and thiourea 233.4 F g−1@0.1 A g−1 33.8 Wh kg−1@9.9 W kg−1 [56] NLPC1000 Enzymatic hydrolysis lignin NH3 179 F g−1@0.1 A g−1 72.8 Wh kg−1@86.4 W kg−1 [57] LNPC800 Sodium lignosulfonate Melamine 266 F g−1@0.05 A g−1 − [58] NOPC-KOH-700 Alkali lignin Melamine 311 F g−1@0.1 A g−1 111 Wh kg−1@52 W kg−1 [28] NPC-5 Cationic polyacrylamide − 115.44 mAh g−1@0.1 A g−1 85.3 Wh kg−1@106.67 W kg−1 [59] CP-HPC Chitosan-PET − 354.2 F g−1@0.5 A g−1 120.36 Wh kg−1@389 W kg−1 [49] N-3@AC-4 Dealkalized lignin Polyurethane 356.9 F g−1@0.1 A g−1 126.89 Wh kg−1@80 W kg−1 This work Table 3.
Comparison of capacitive performance between the representative studies and this work
Figures
(7)
Tables
(3)