-
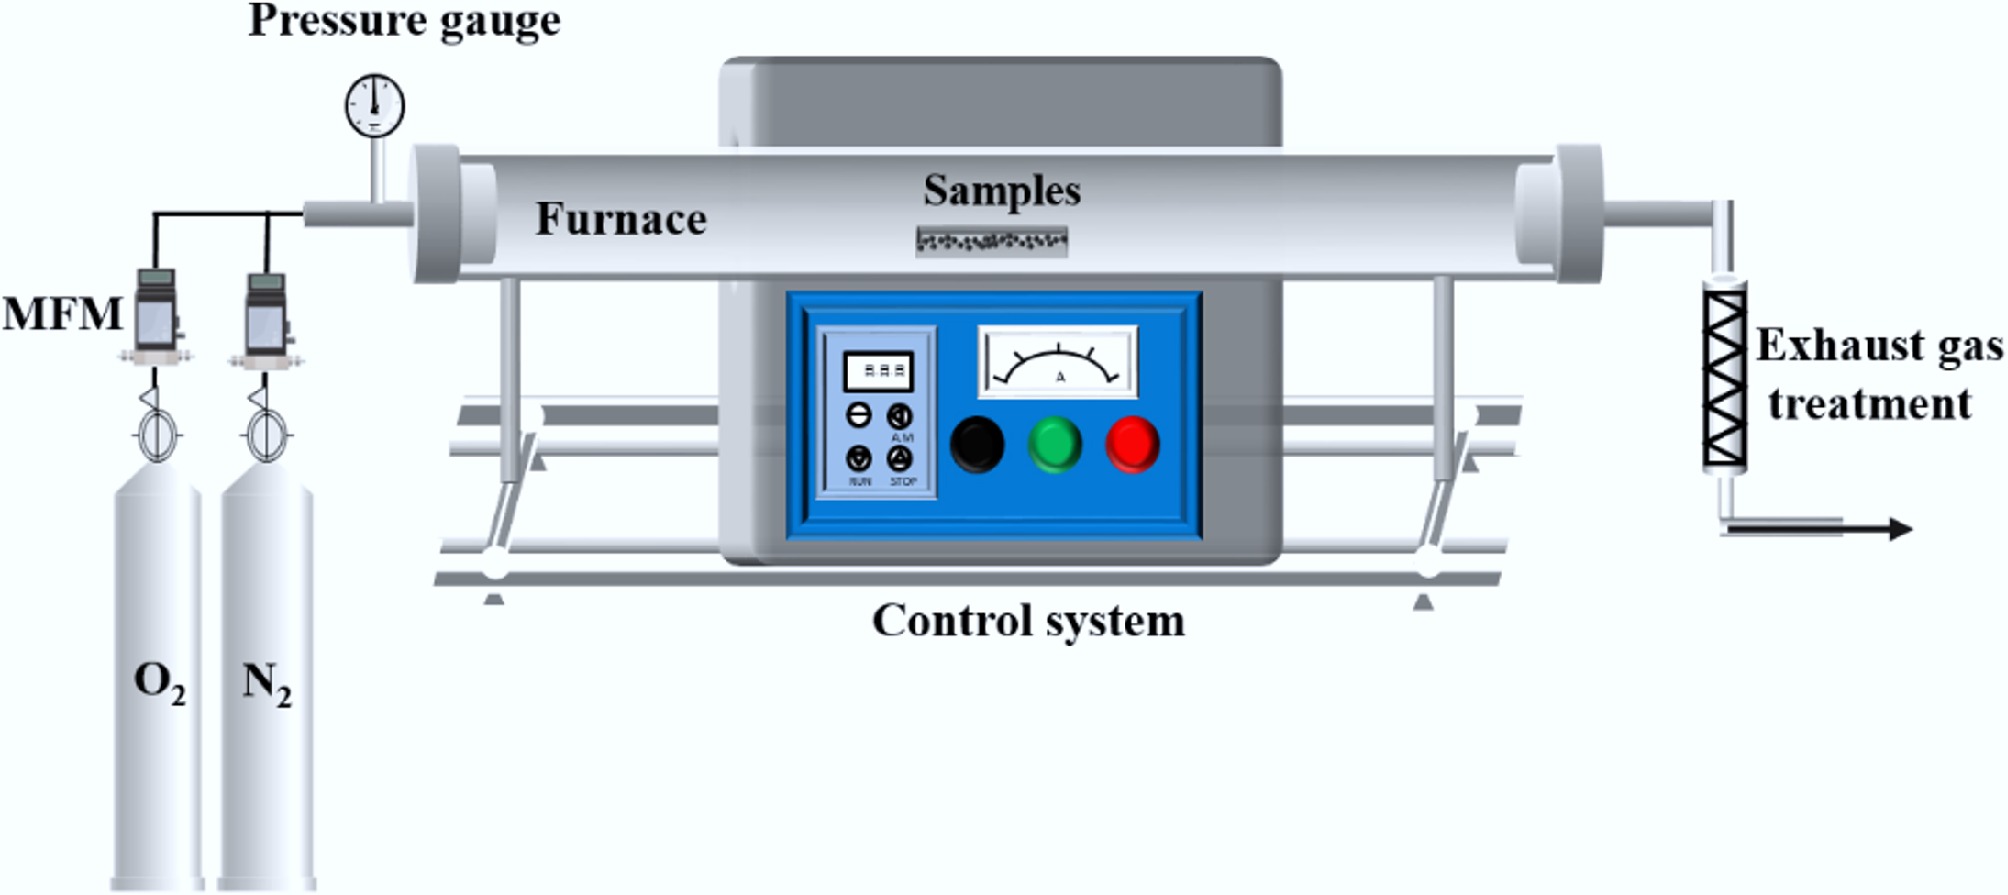
Figure 1.
Tube furnace combustion system.
-
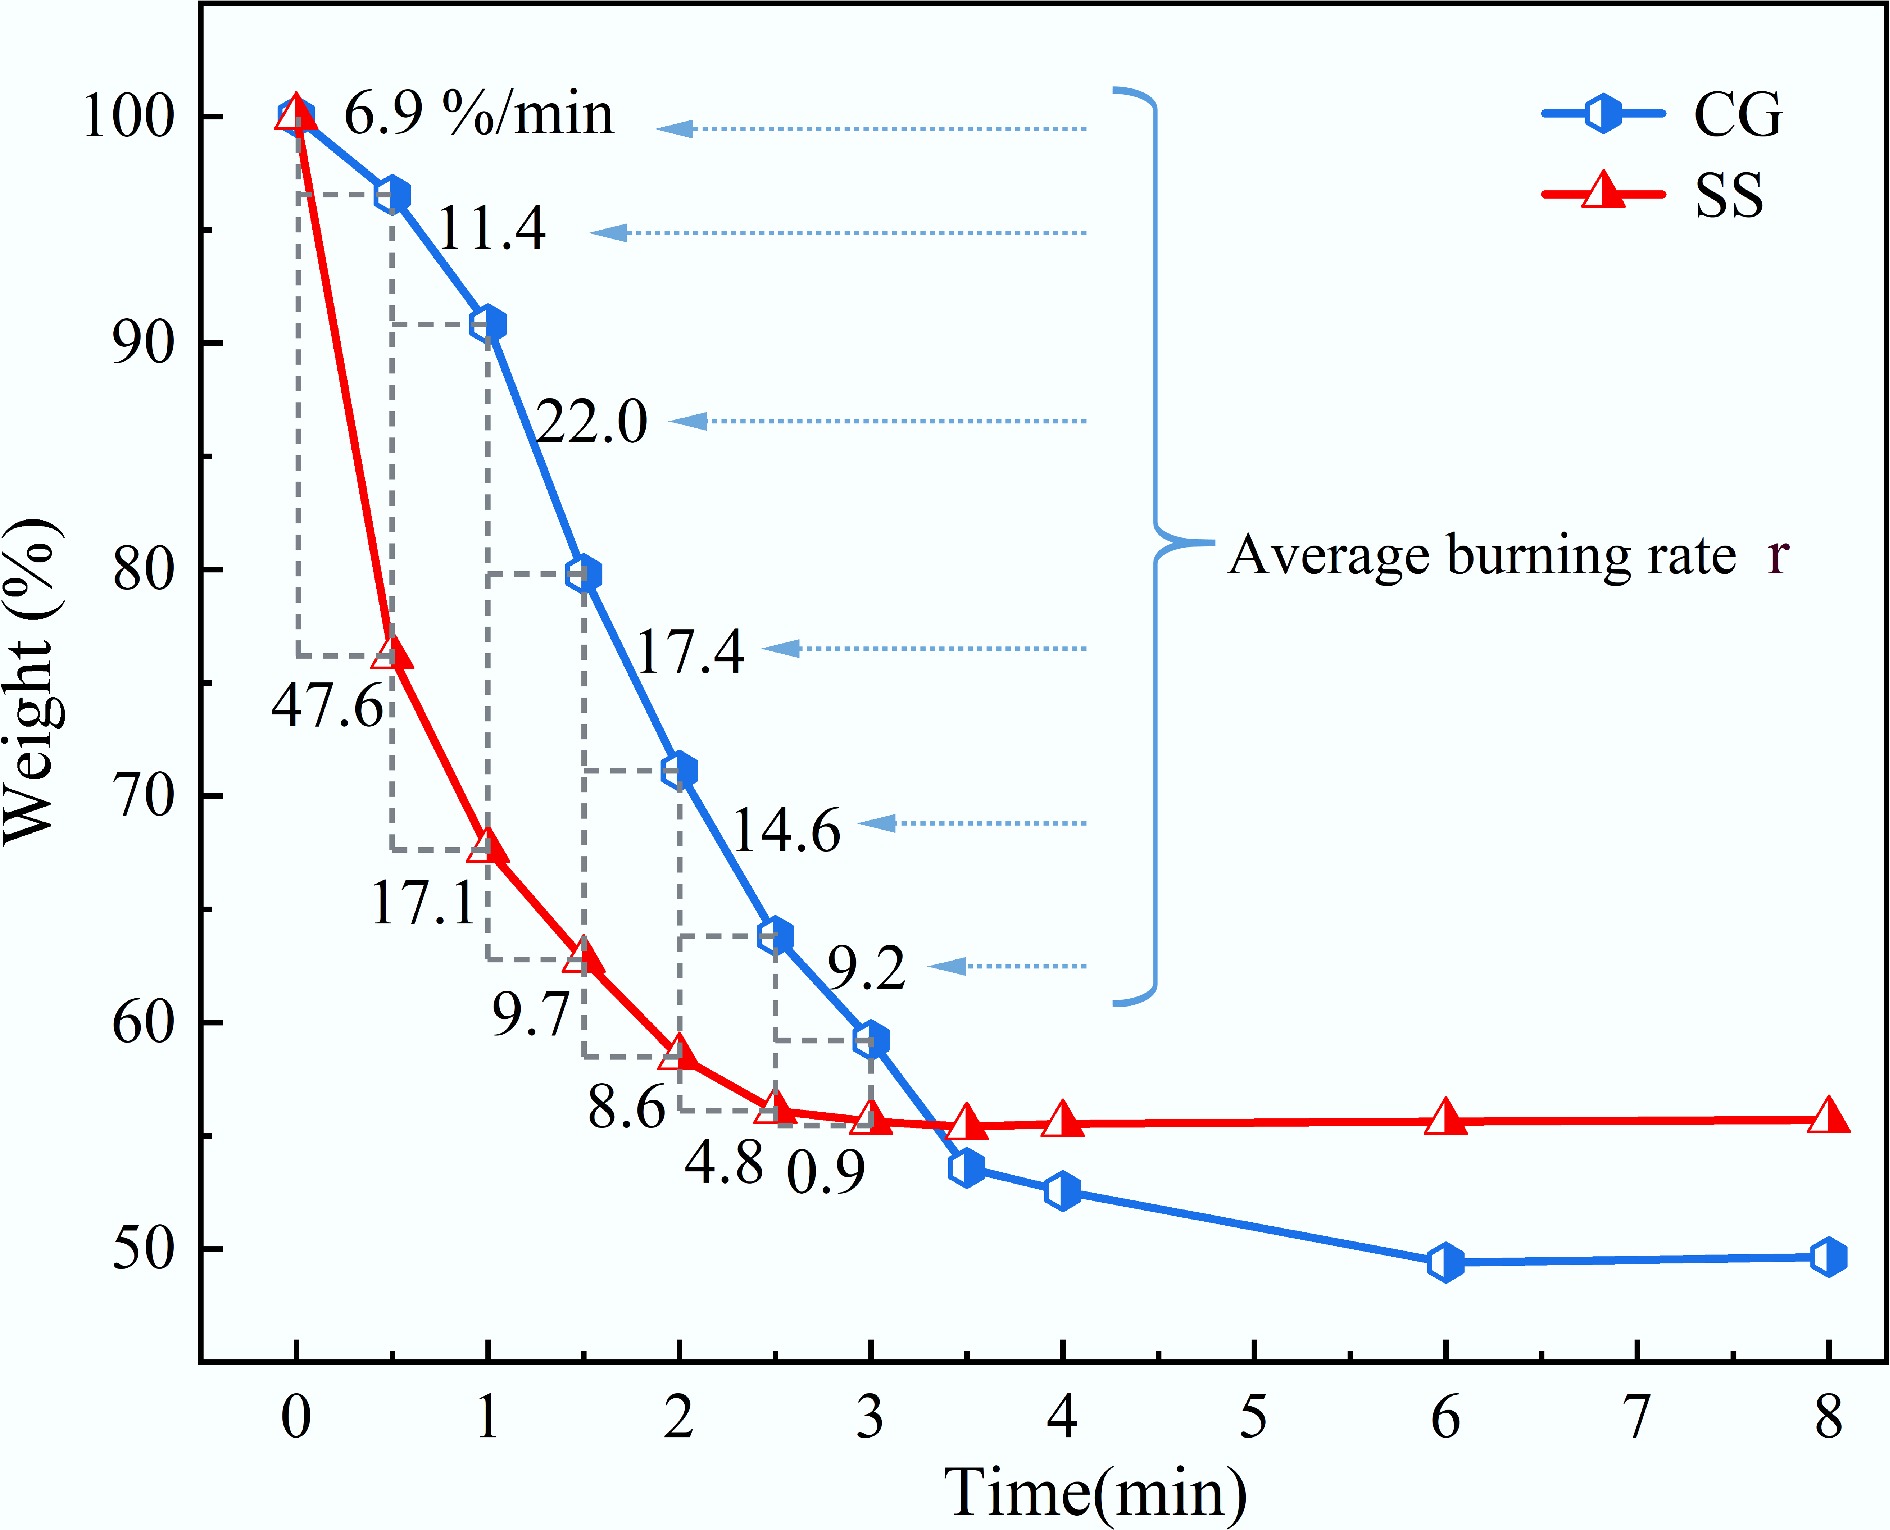
Figure 2.
Isothermal weight loss curves of CG and SS at 850 °C.
-
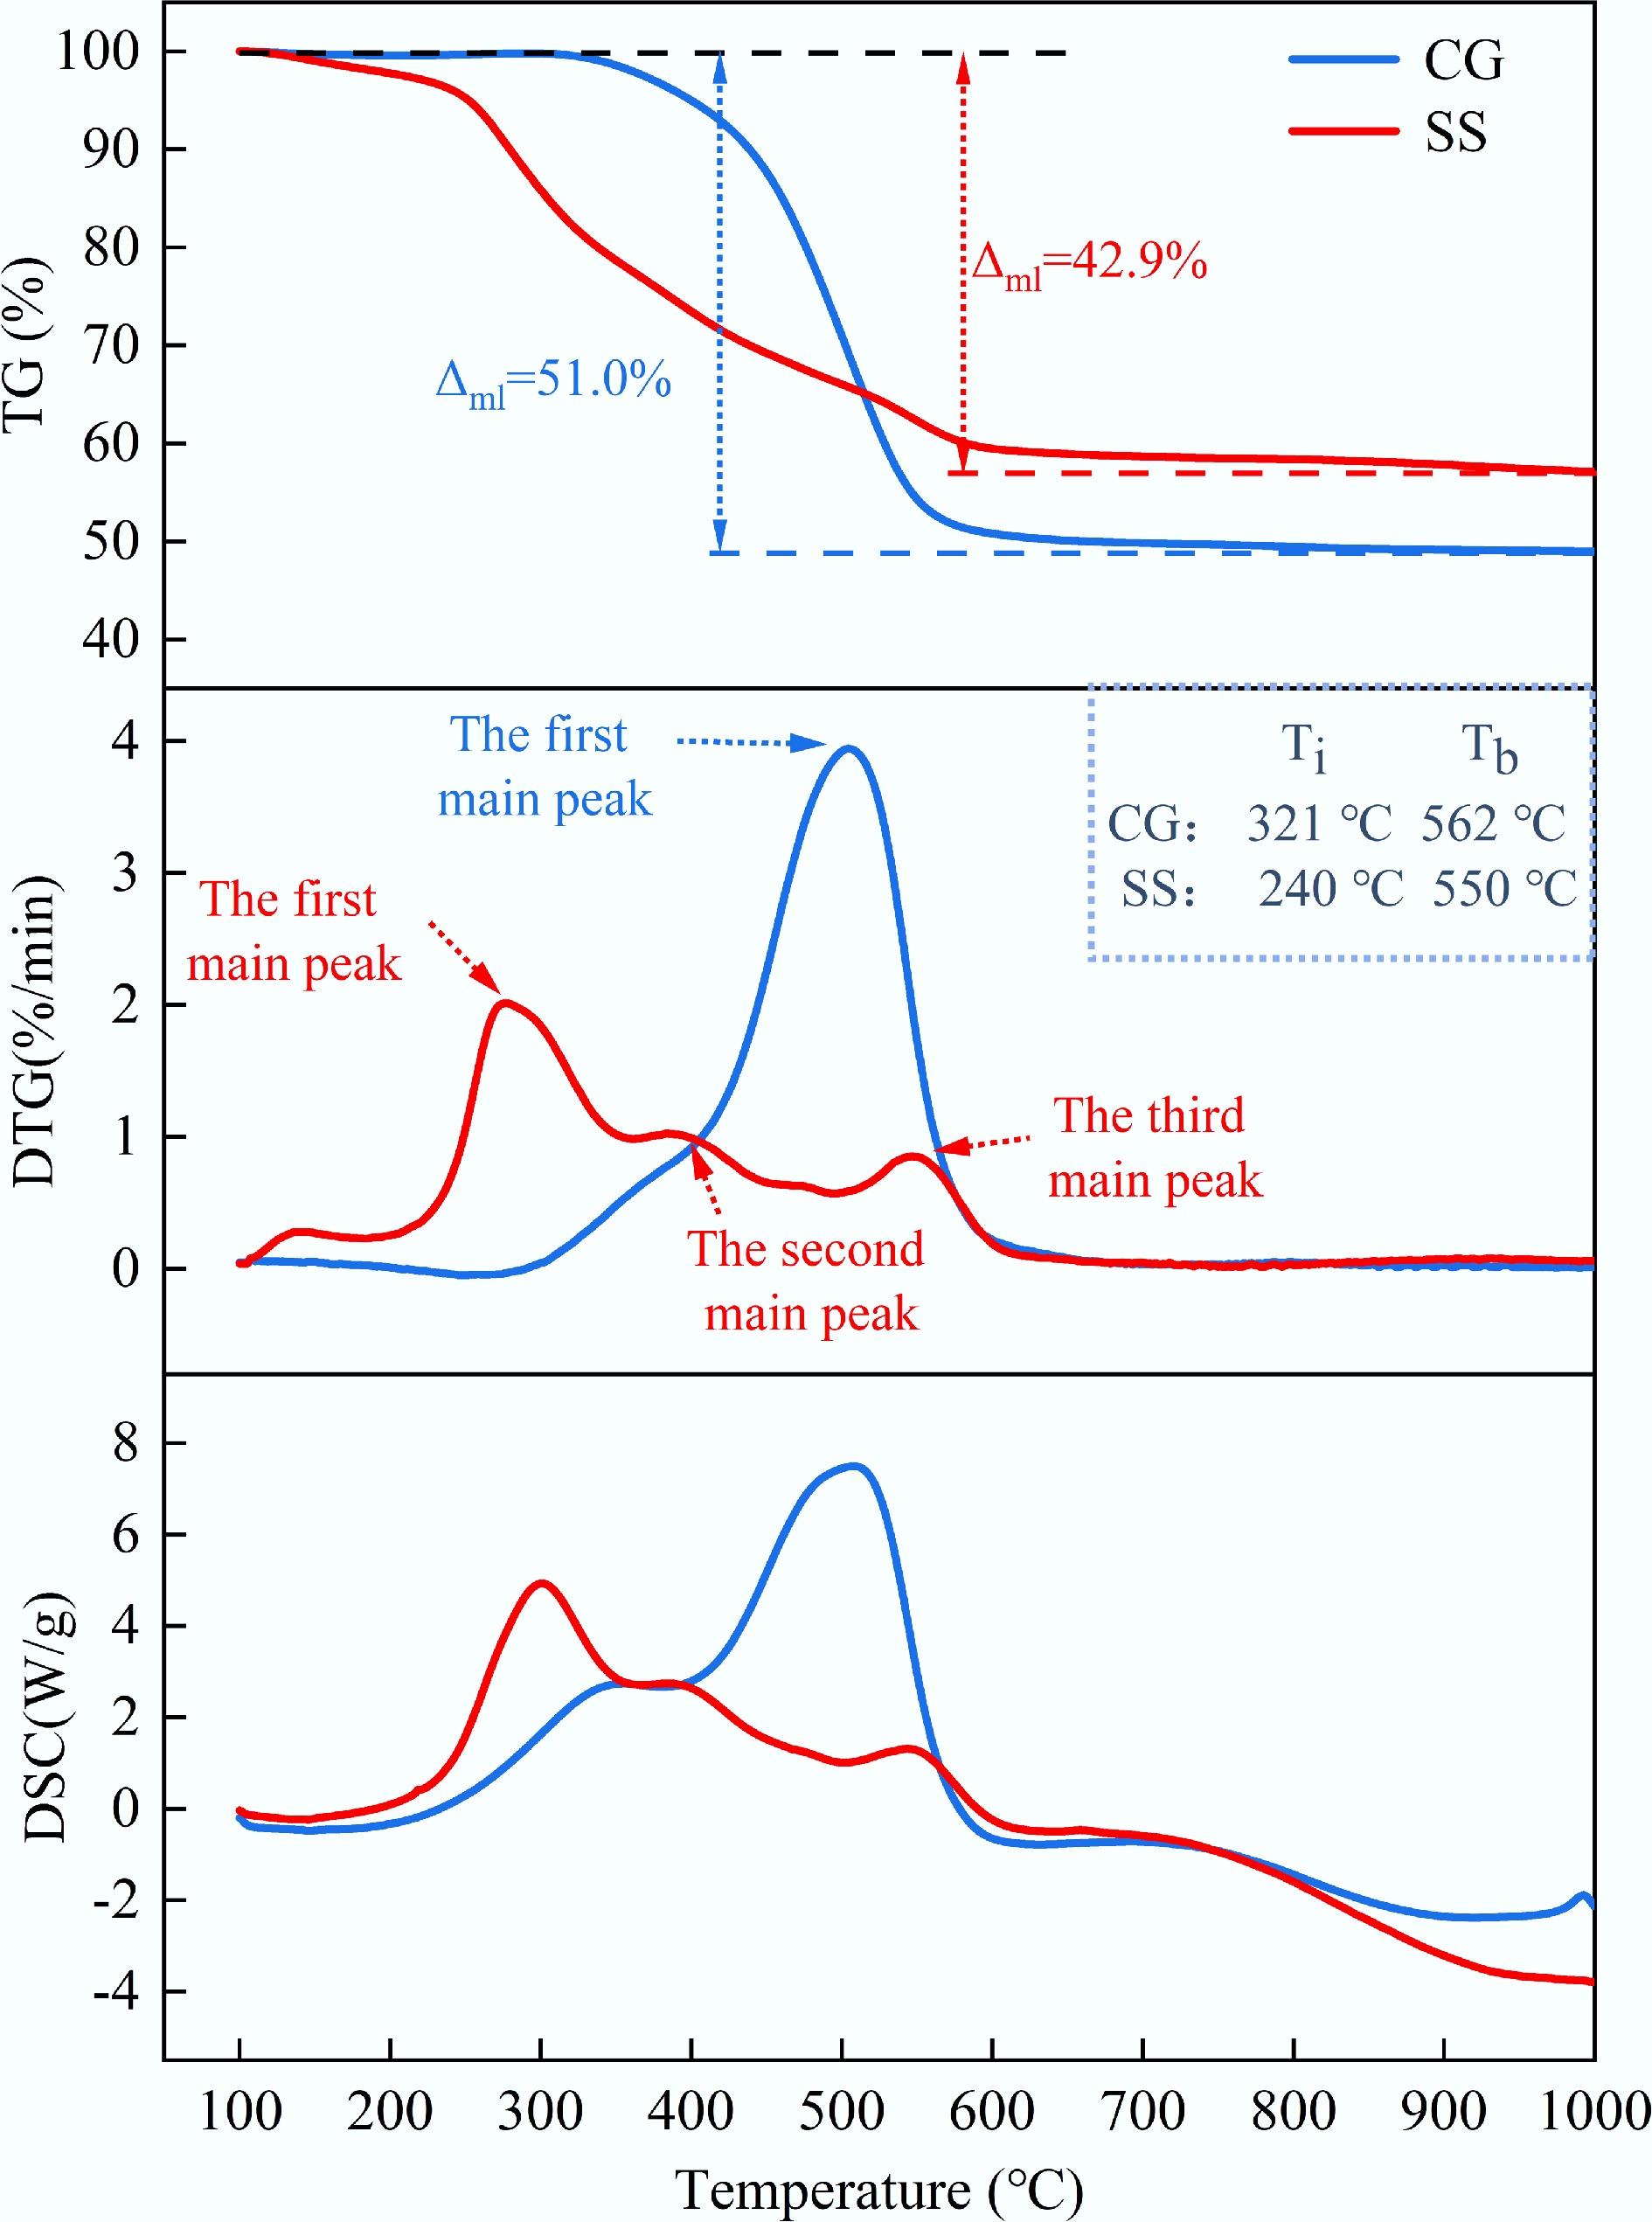
Figure 3.
TG, DTG, and DSC curves of CG and SS (21%O2/79%N2 atmosphere).
-
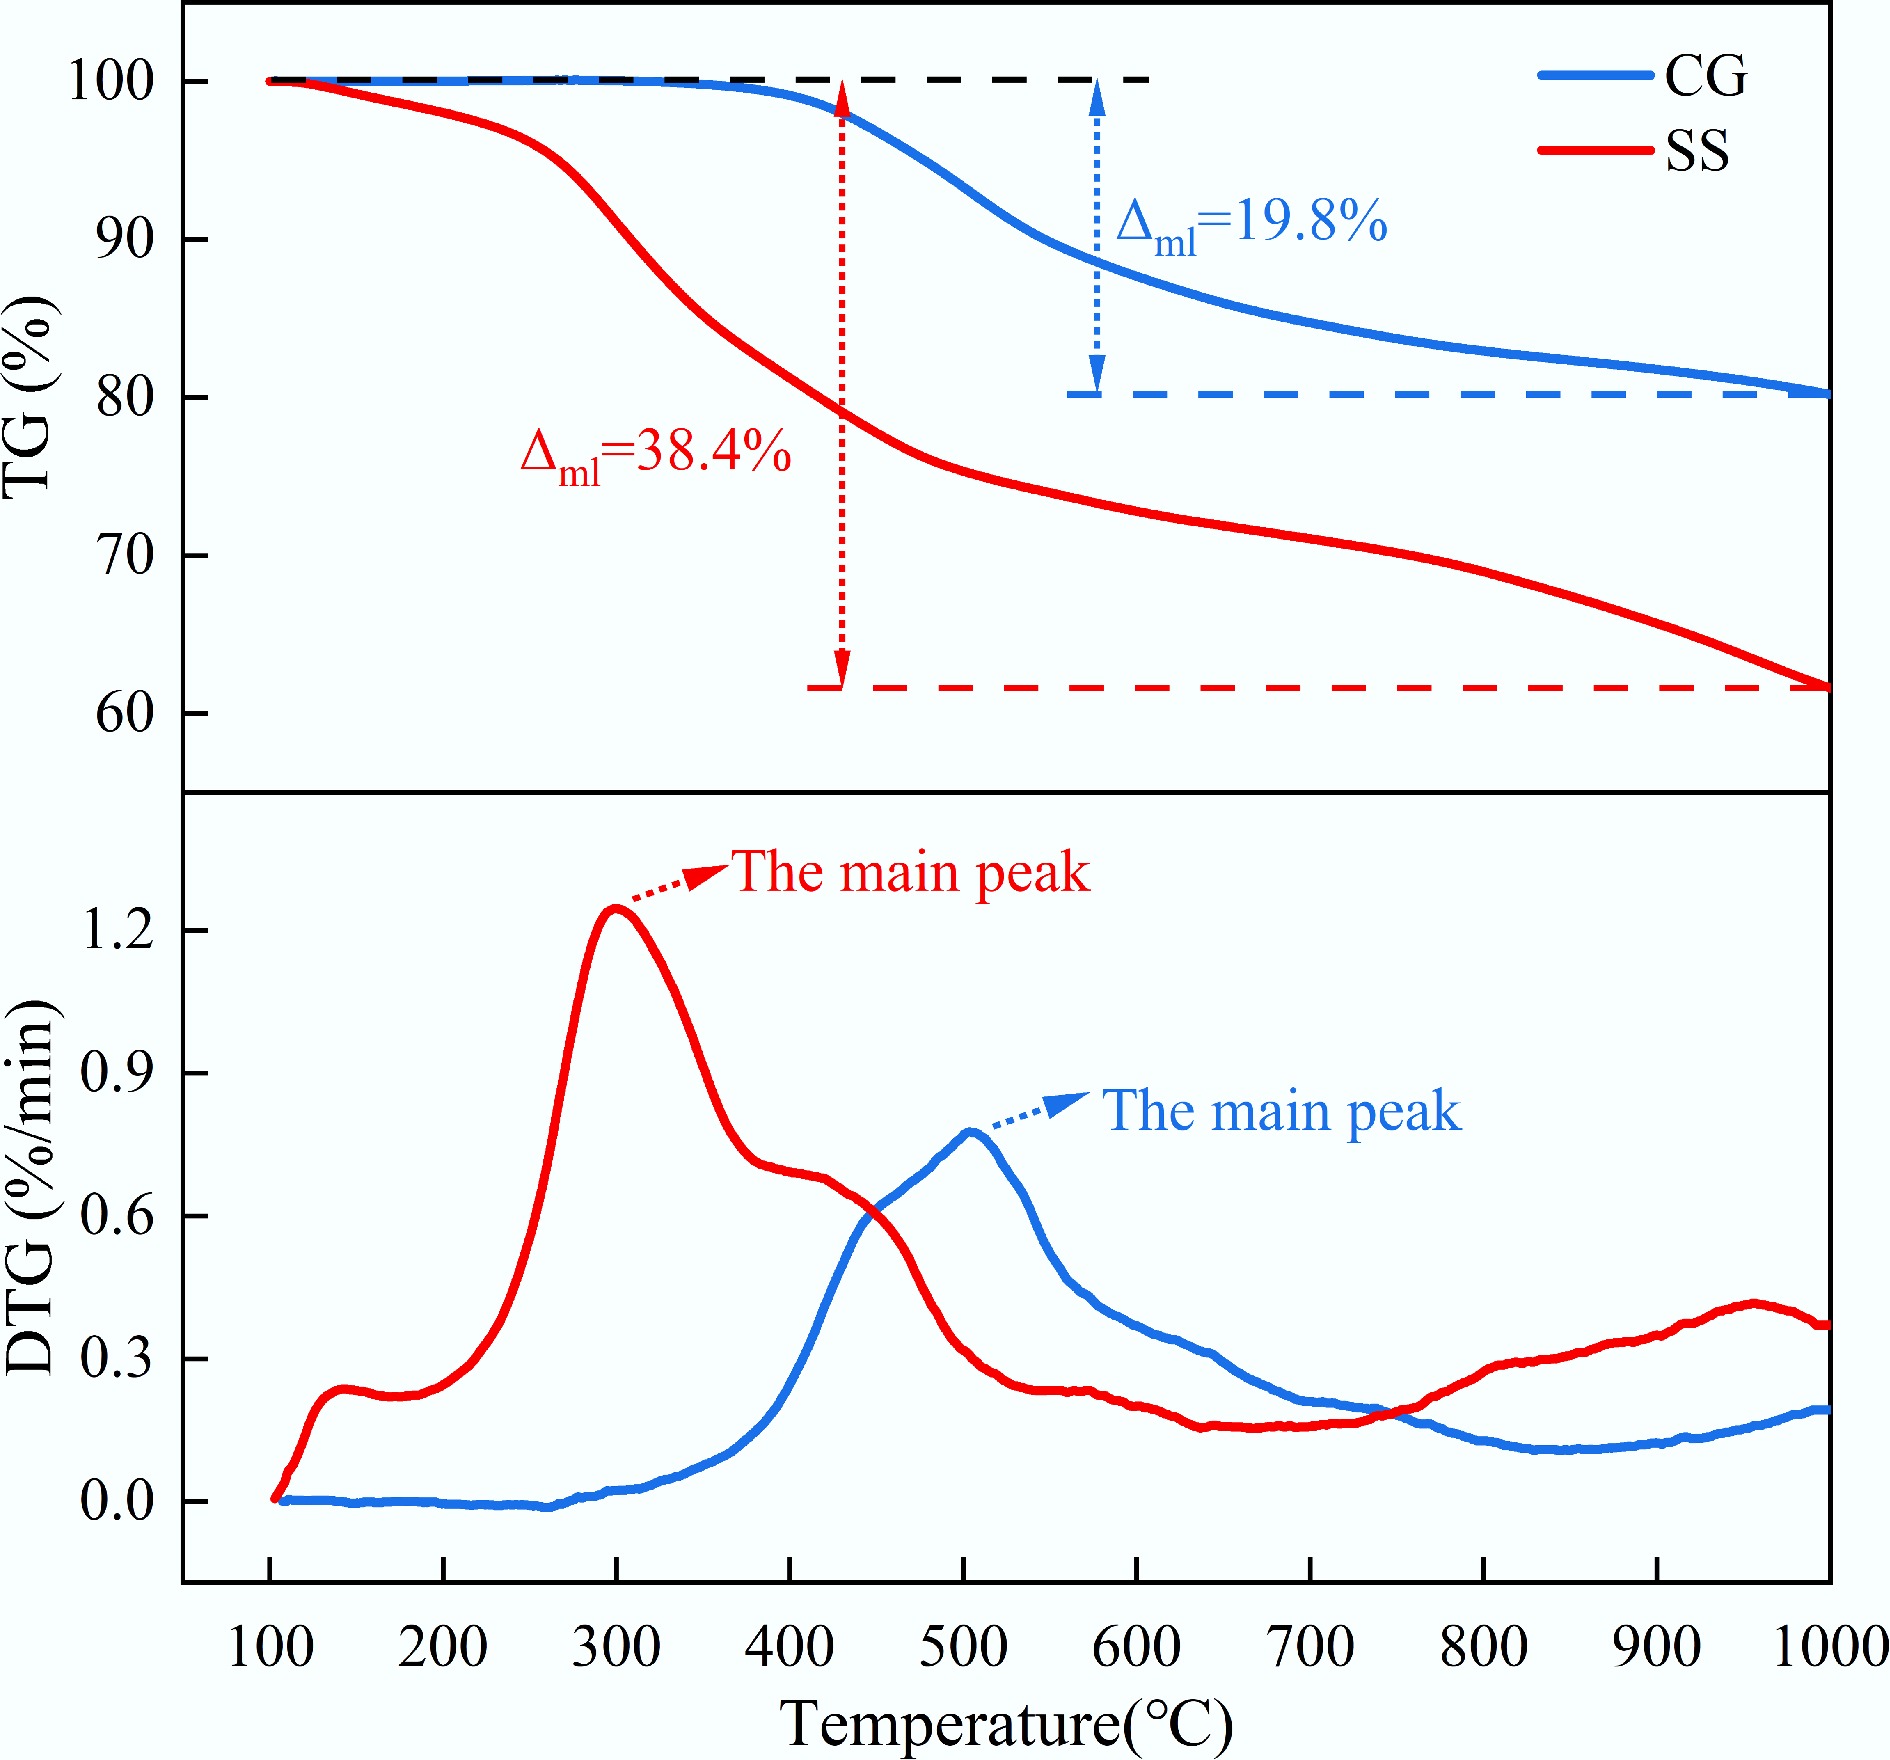
Figure 4.
TG and DTG curves of CG and SS (nitrogen atmosphere).
-
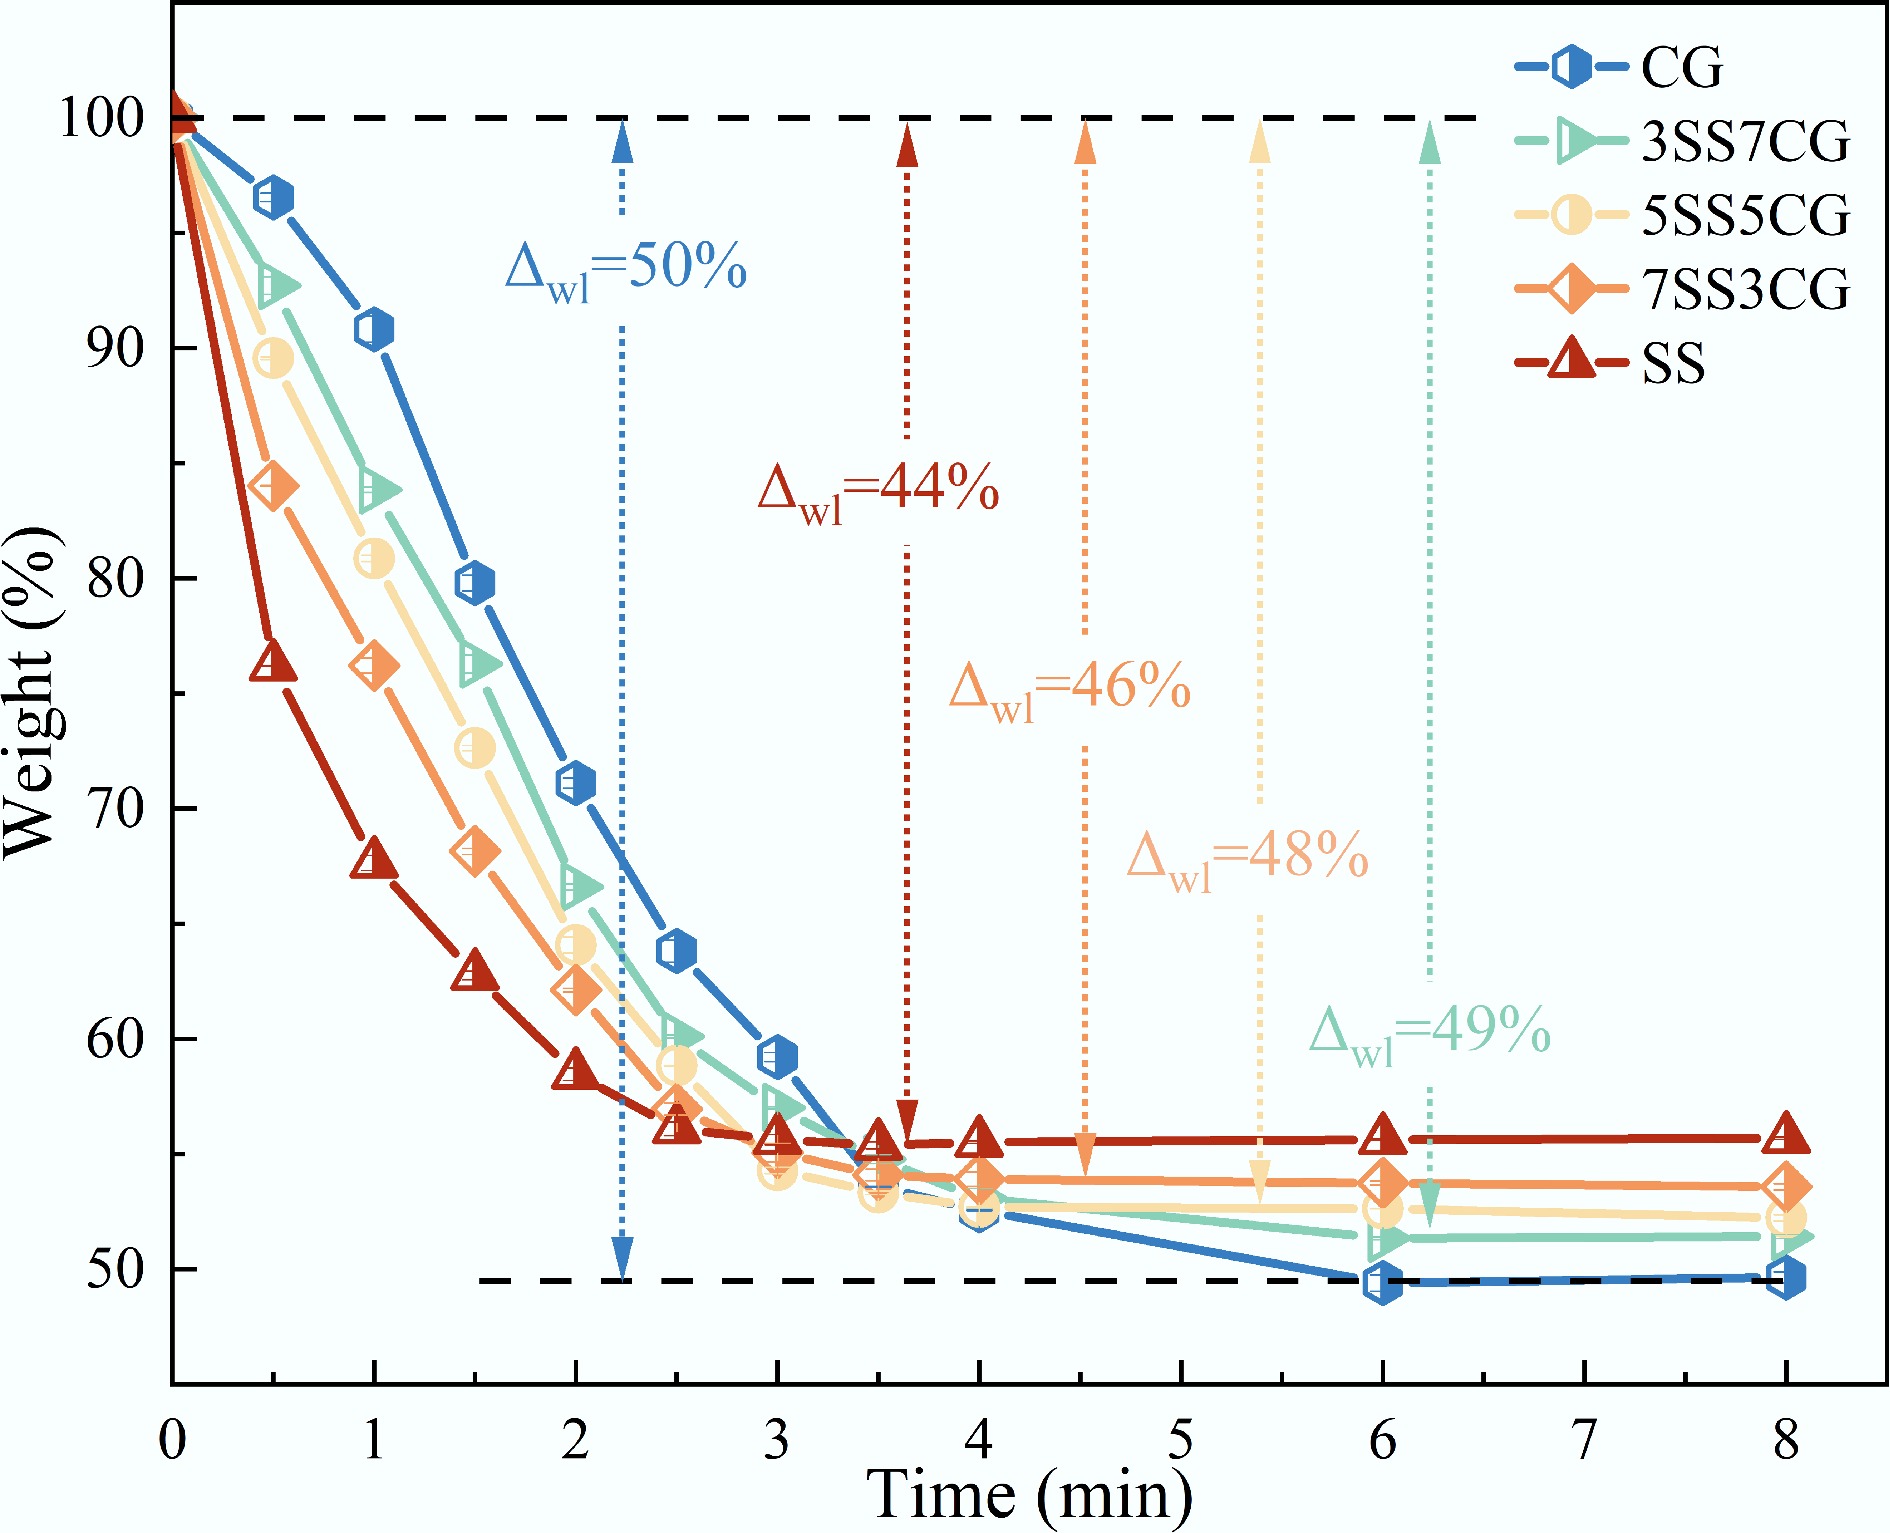
Figure 5.
Isothermal weight loss curves of CG and SS.
-
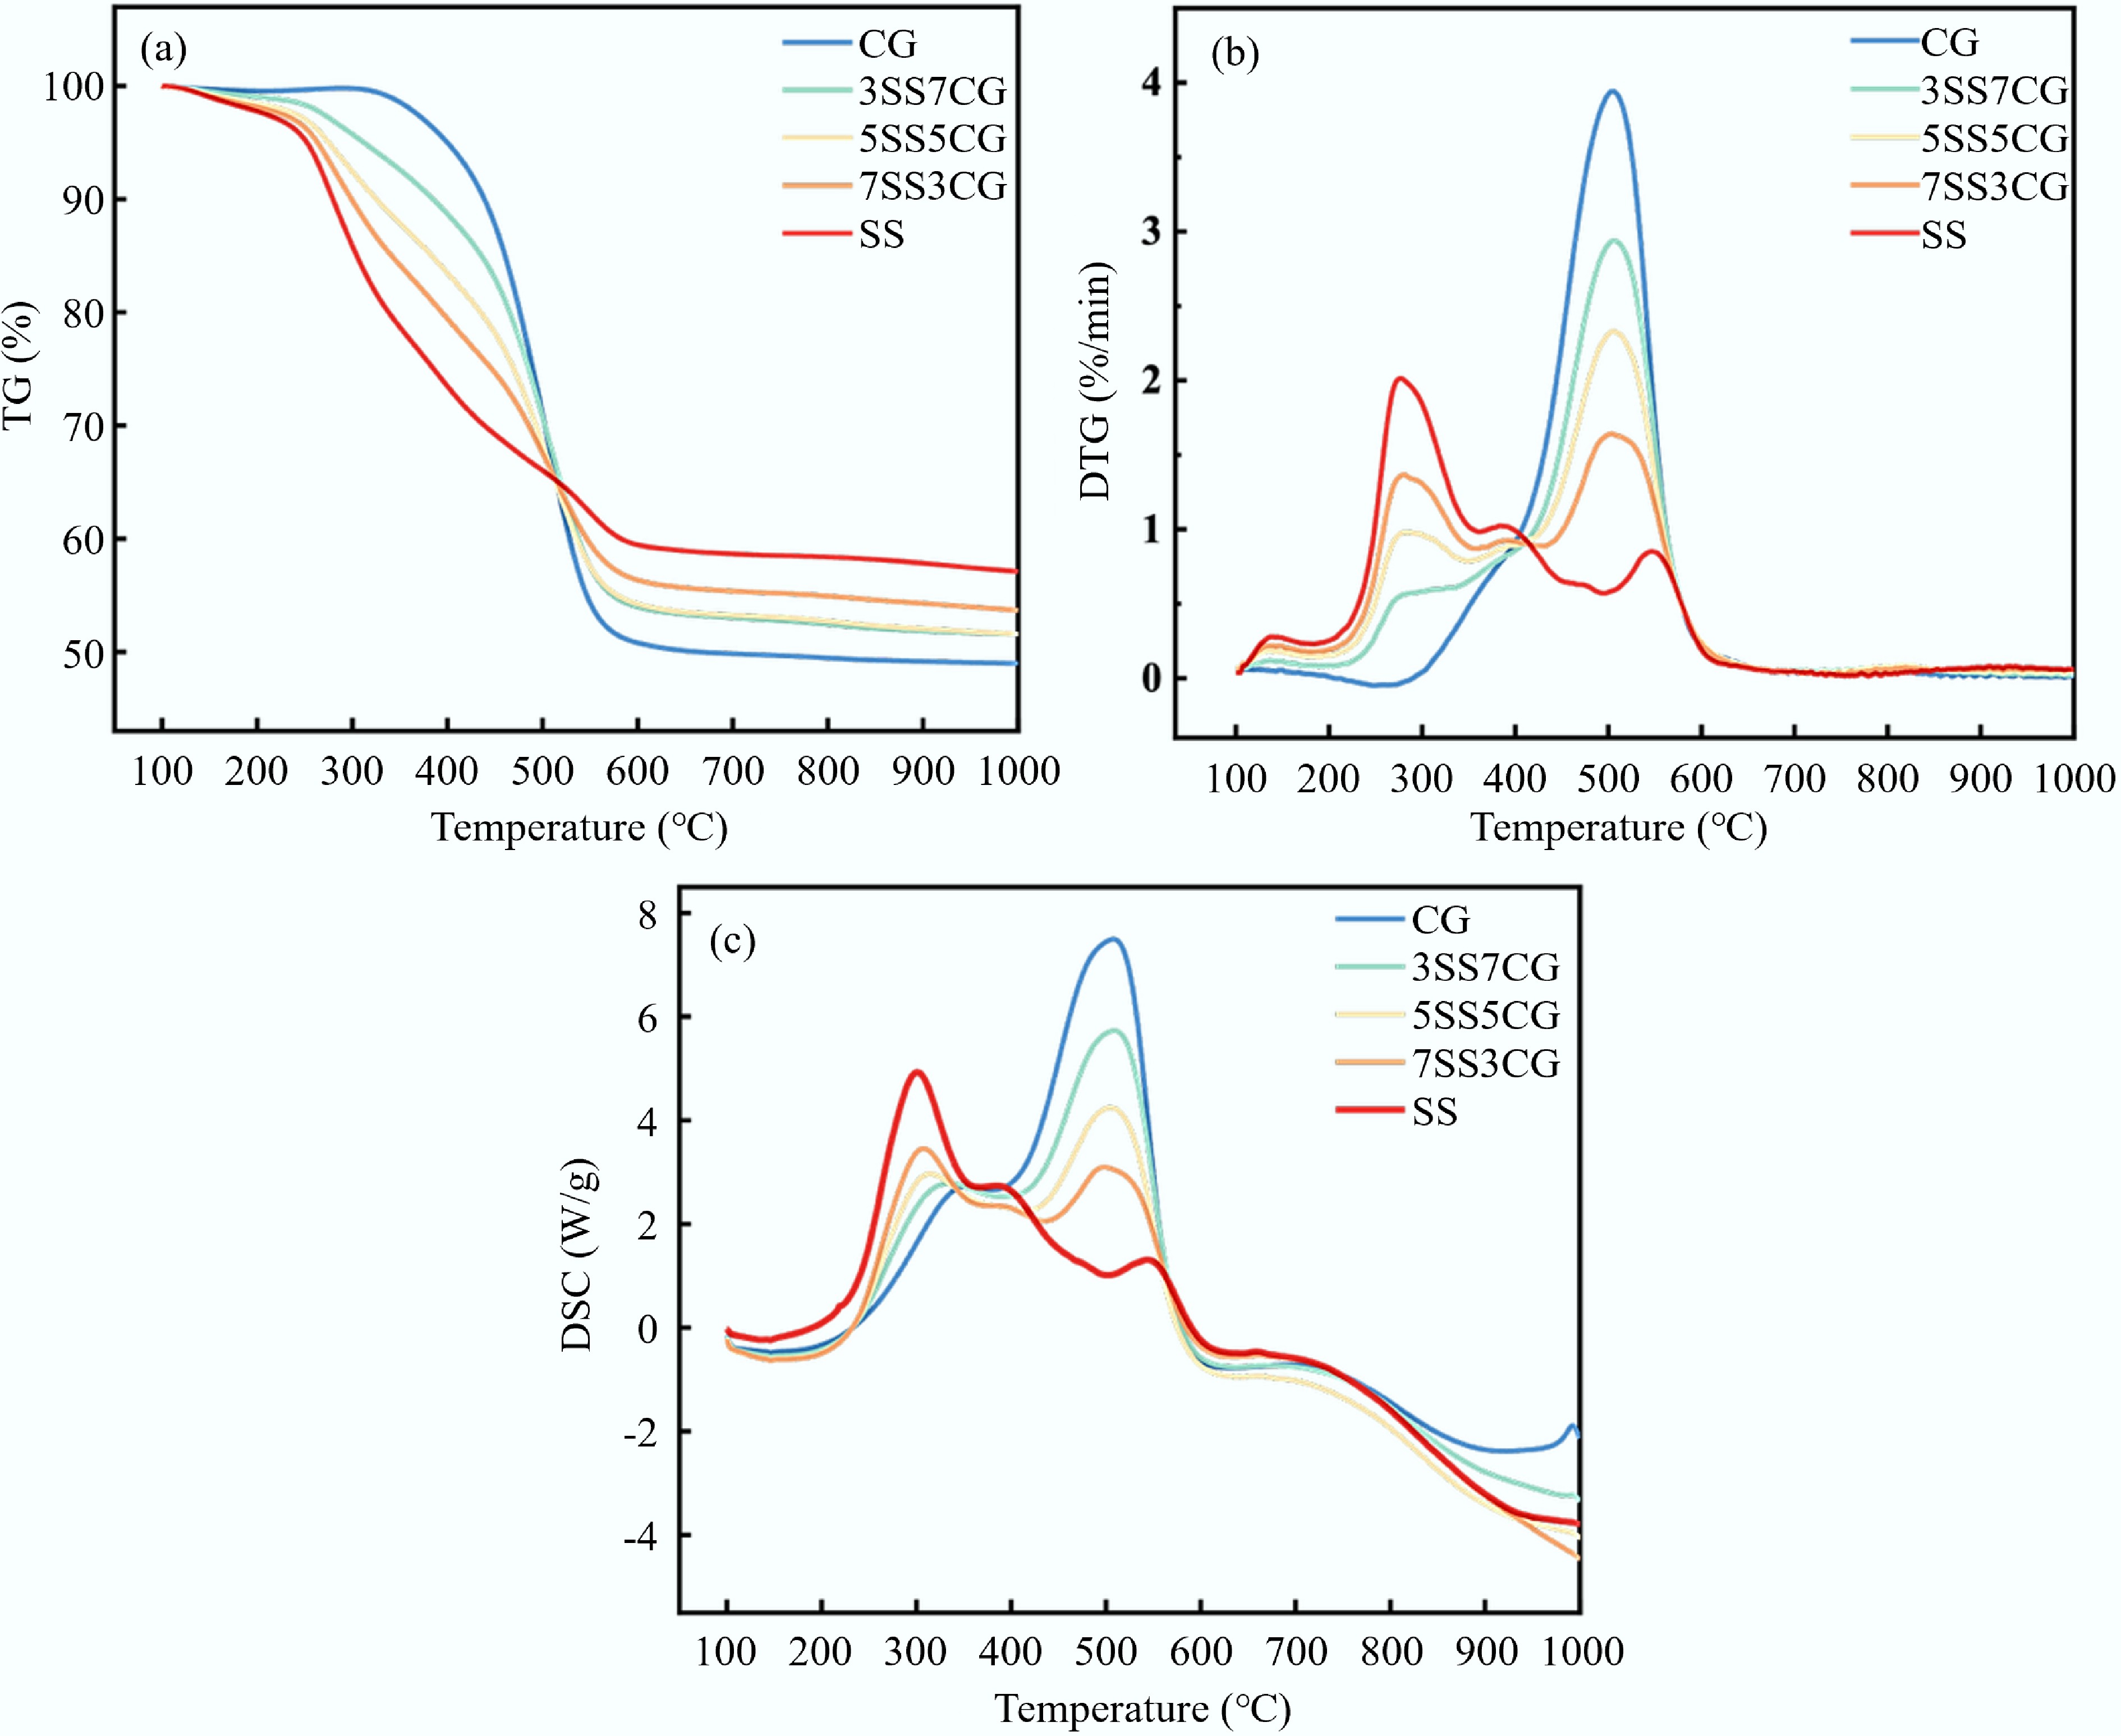
Figure 6.
(a) TG, (b) DTG, and (c) DSC curves of CG, SS, and their blends.
-
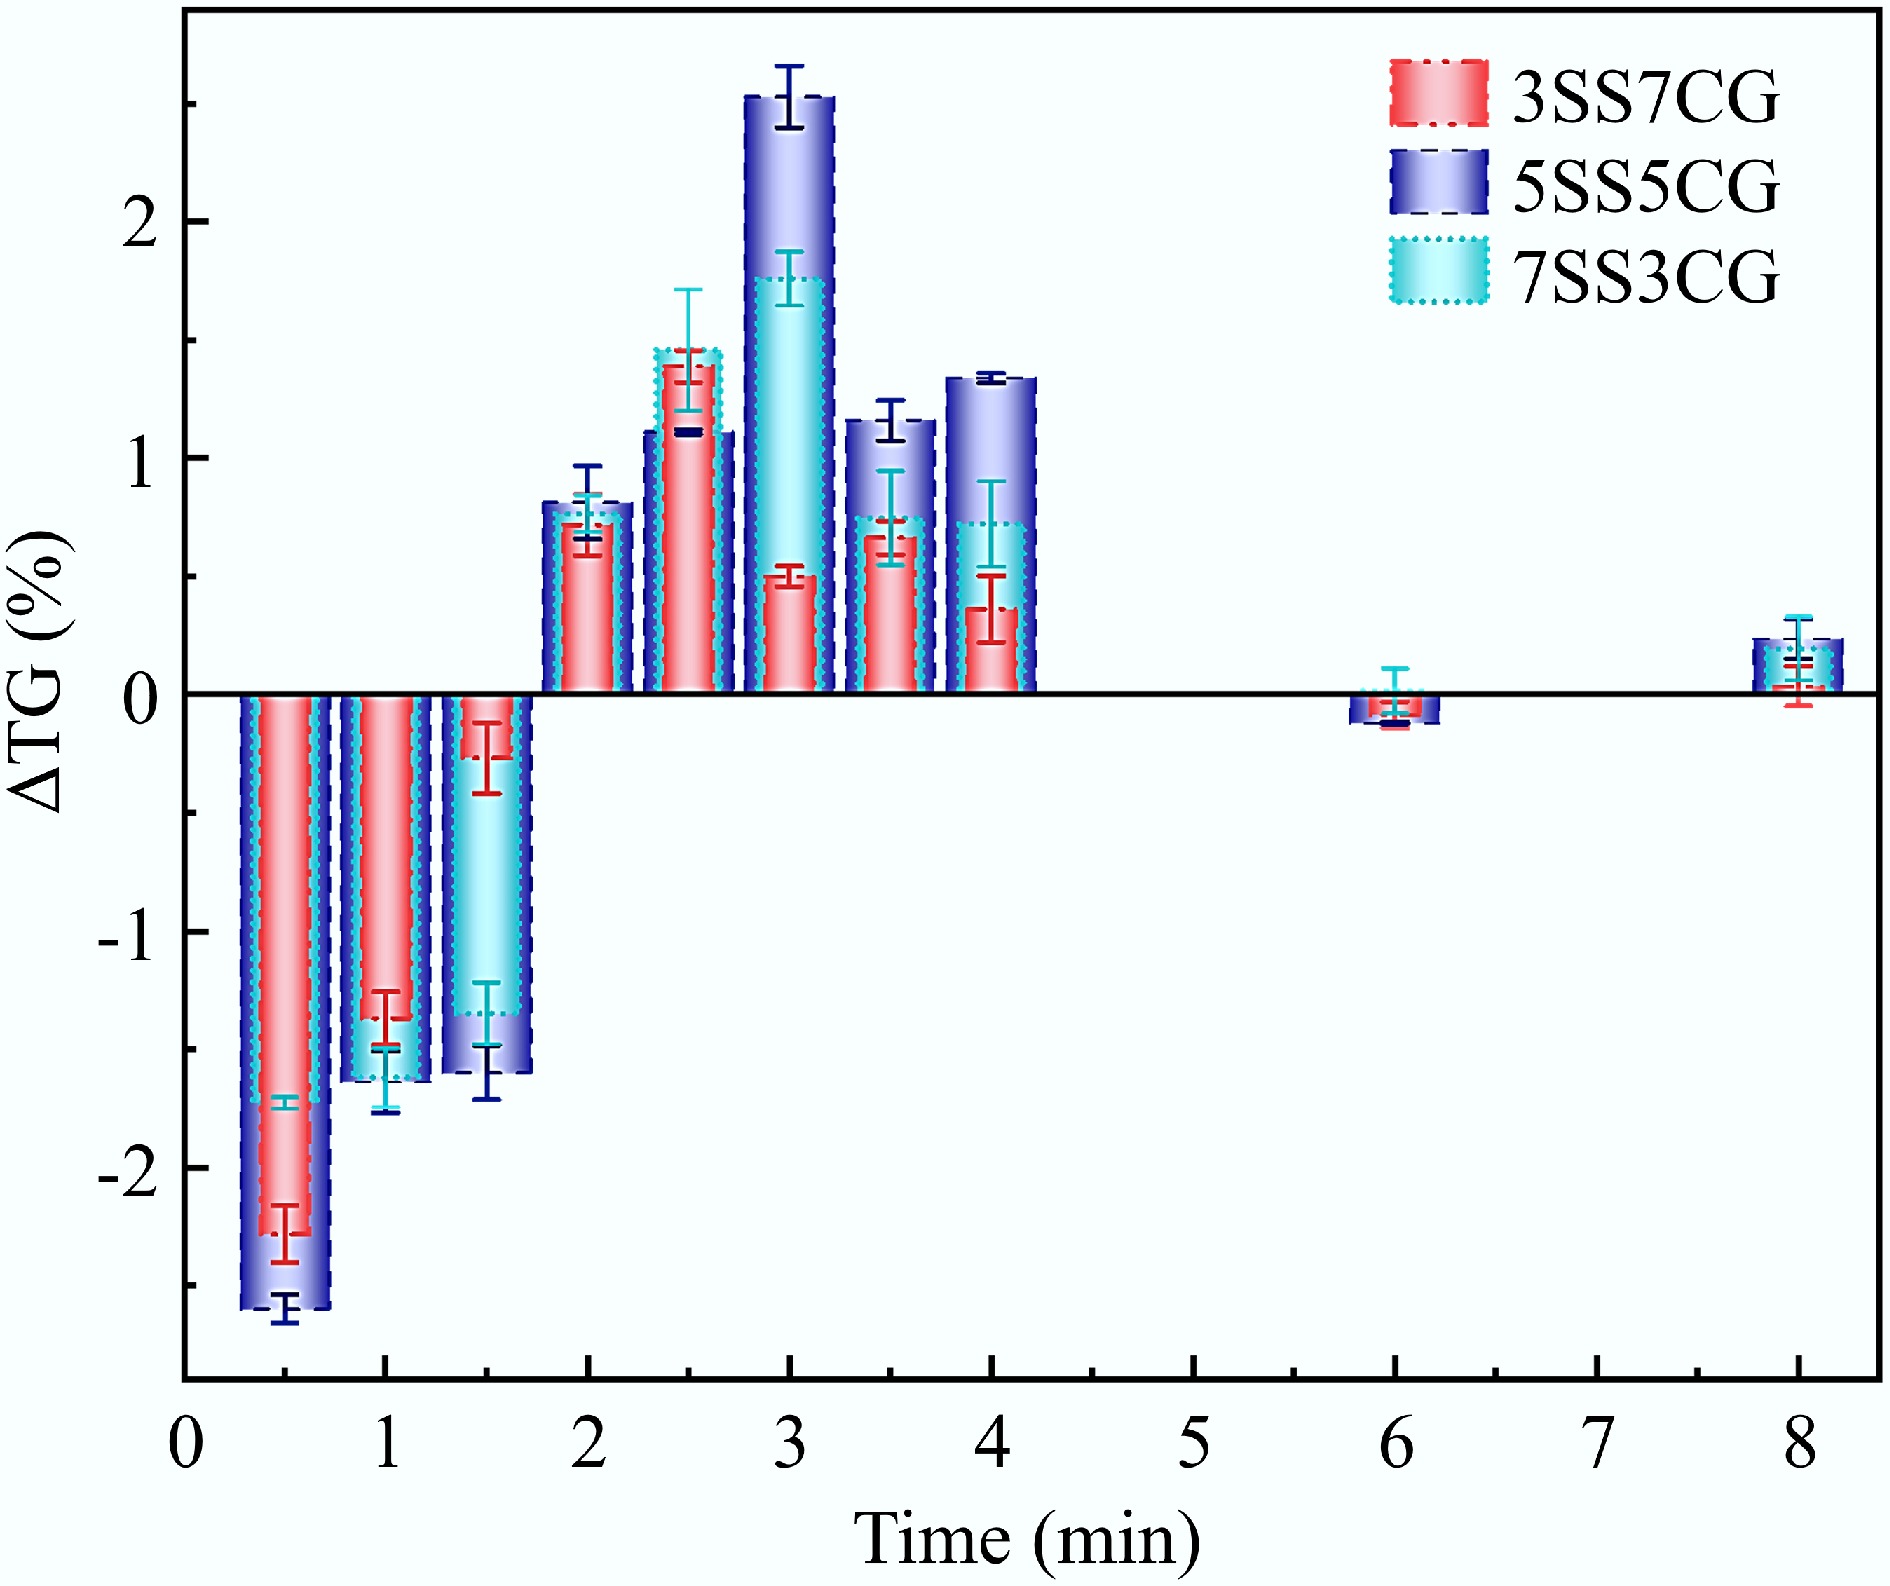
Figure 7.
The interaction between CG and SS in isothermal co-combustion at 850 °C.
-
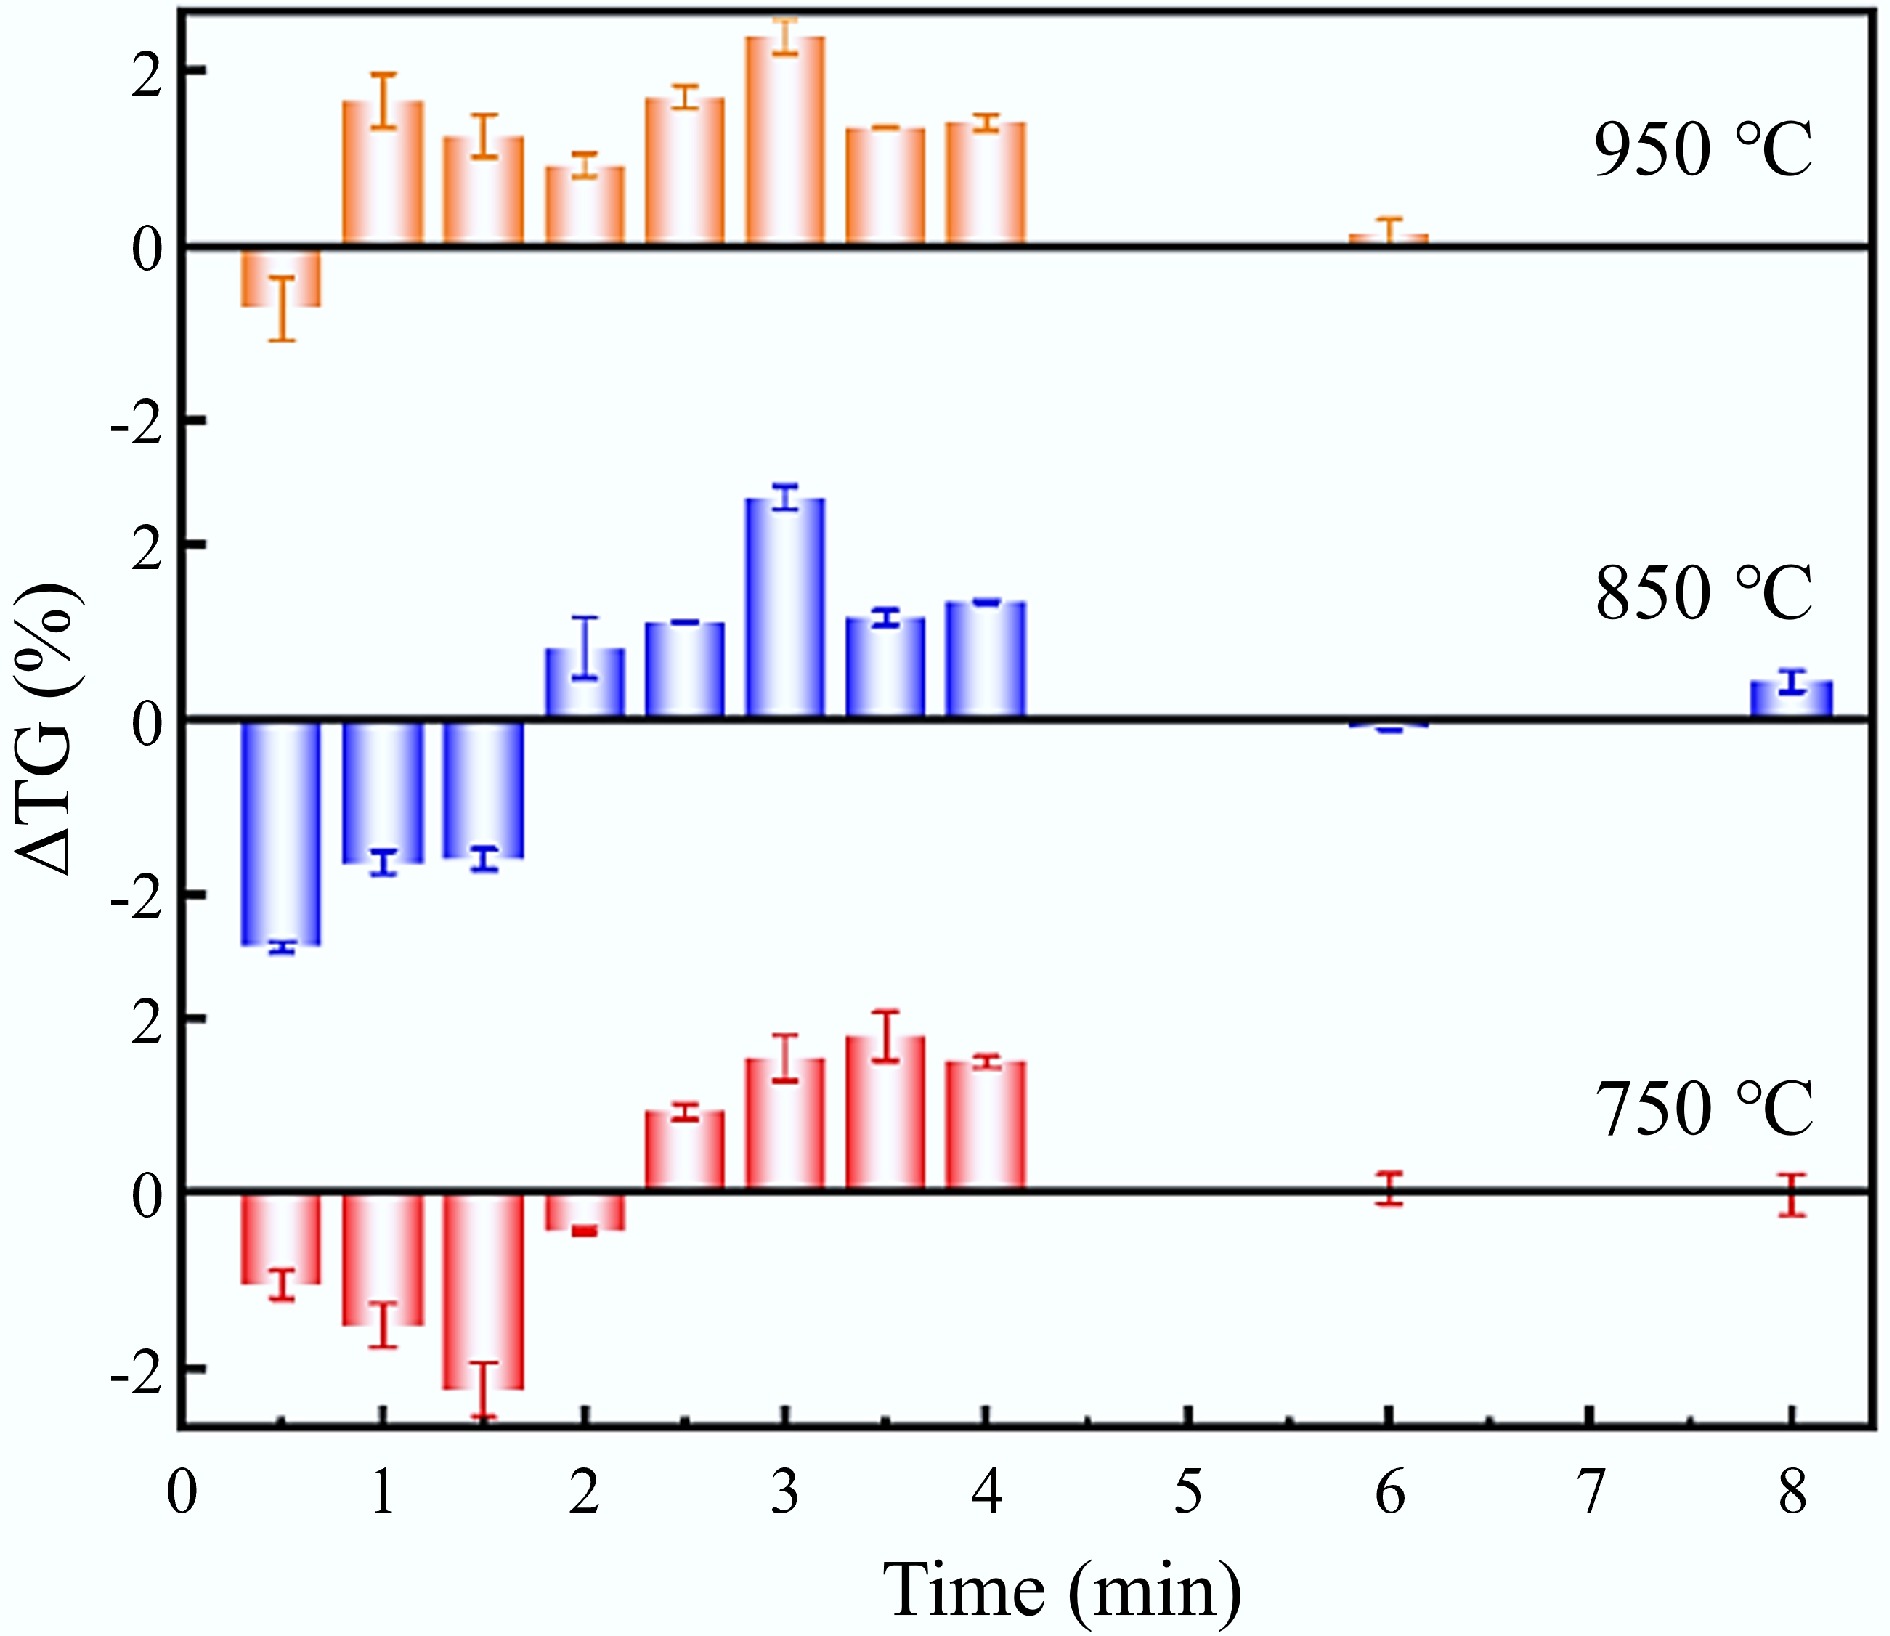
Figure 8.
The interaction of the 5SS5CG combustion process at different temperatures.
-
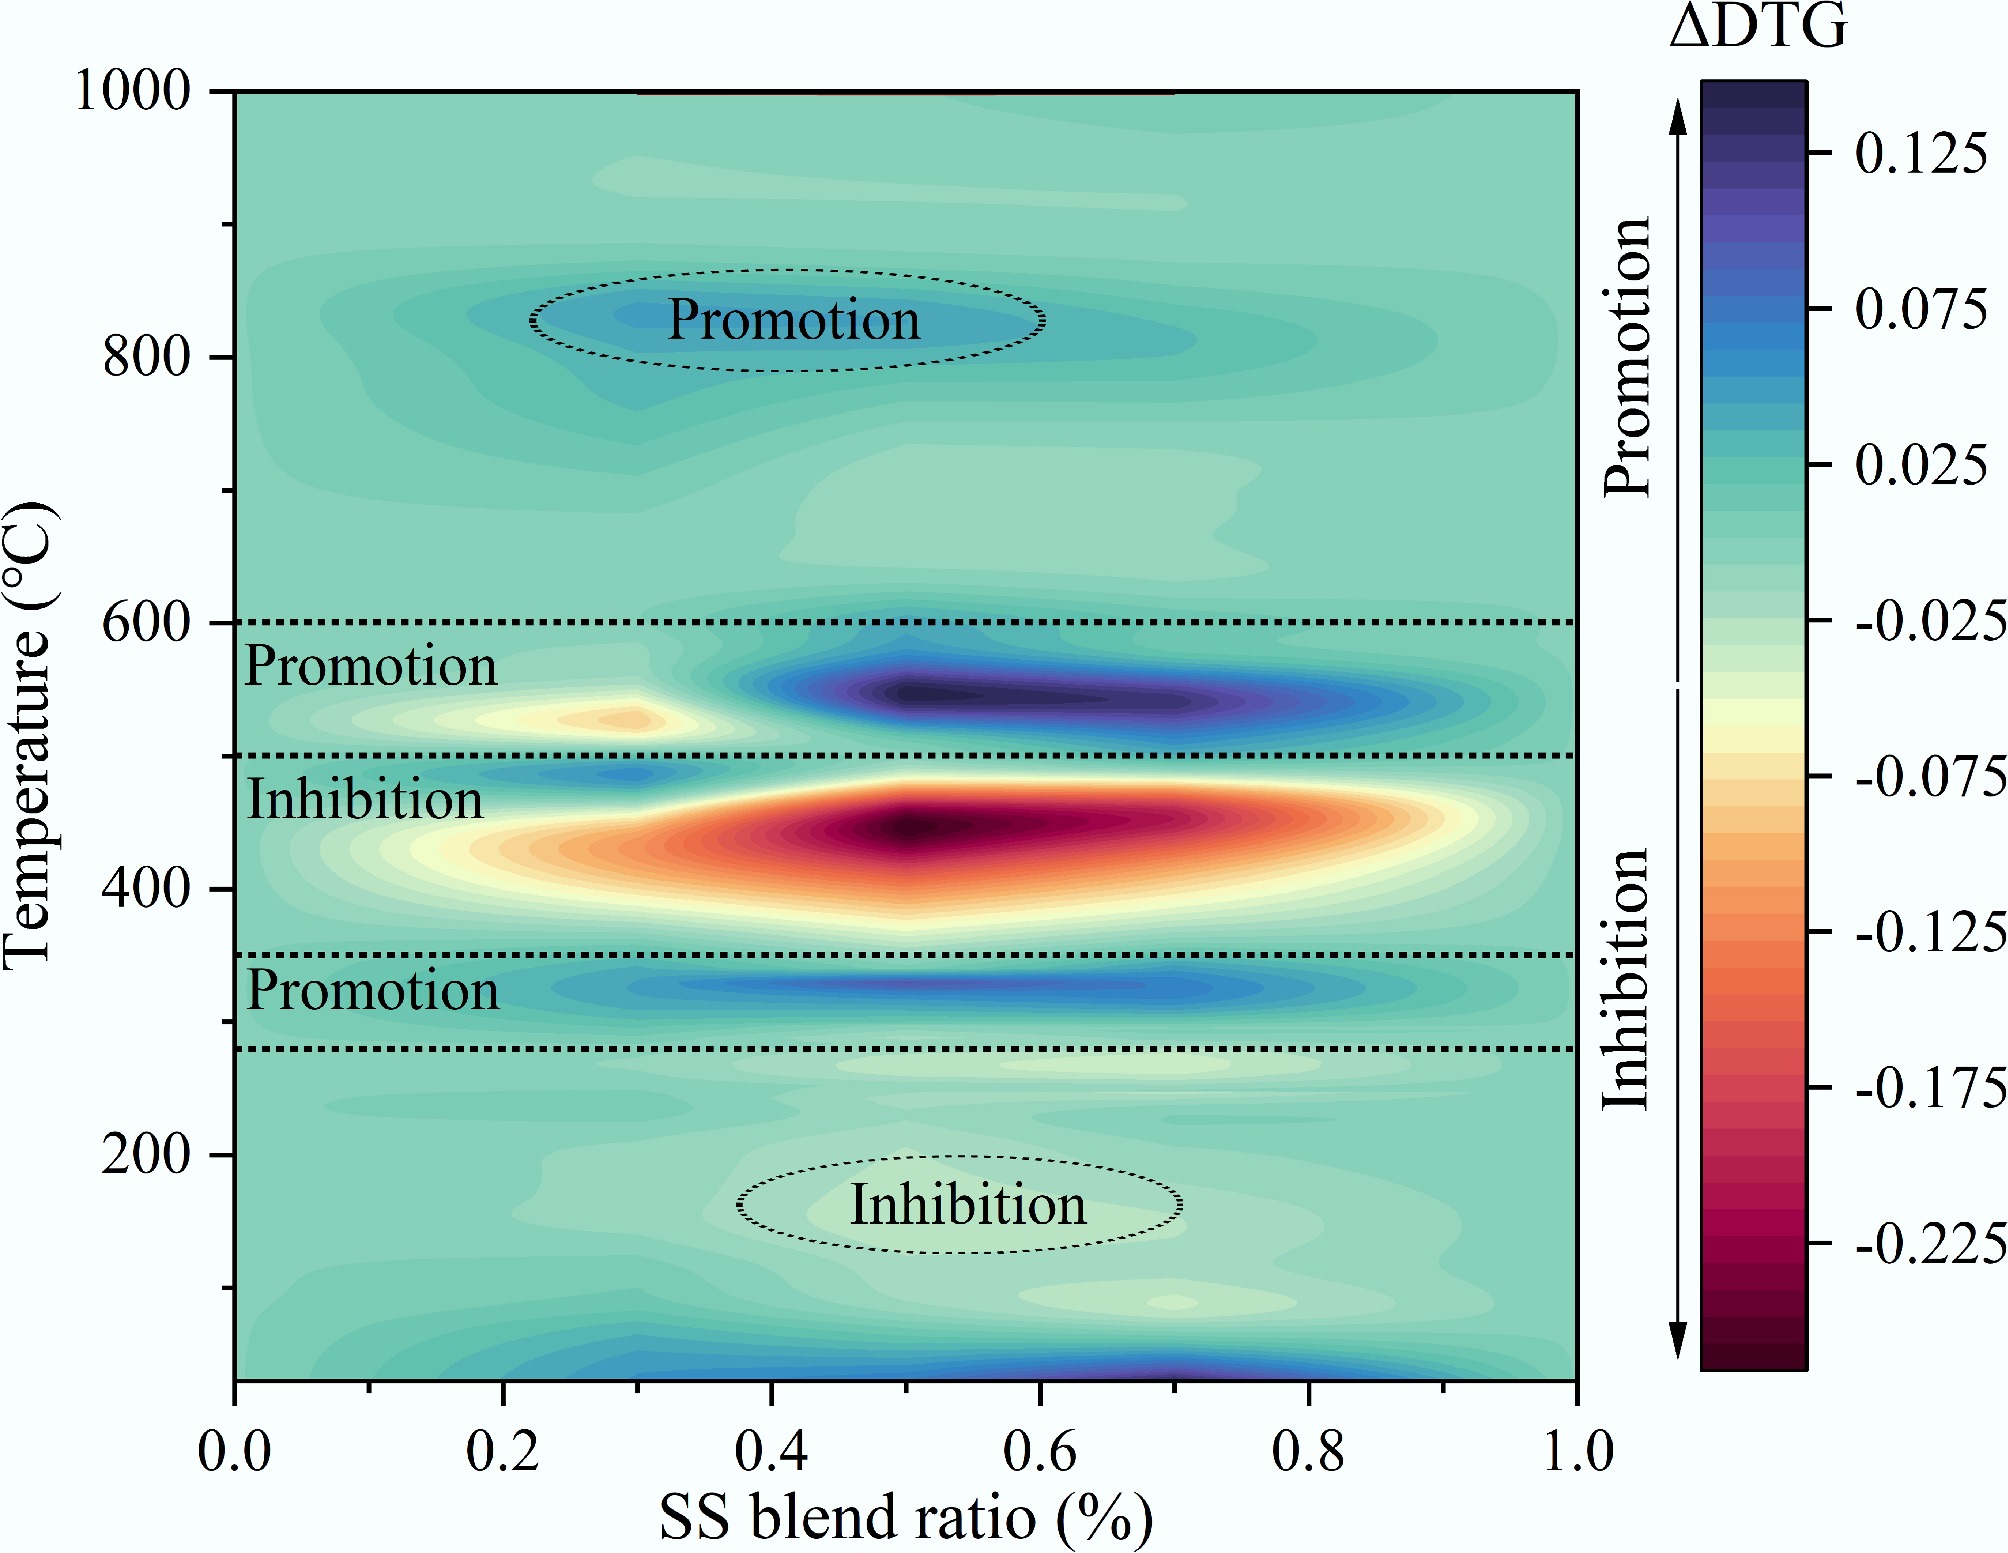
Figure 9.
The interaction between CG and SS in non-isothermal co-combustion.
-
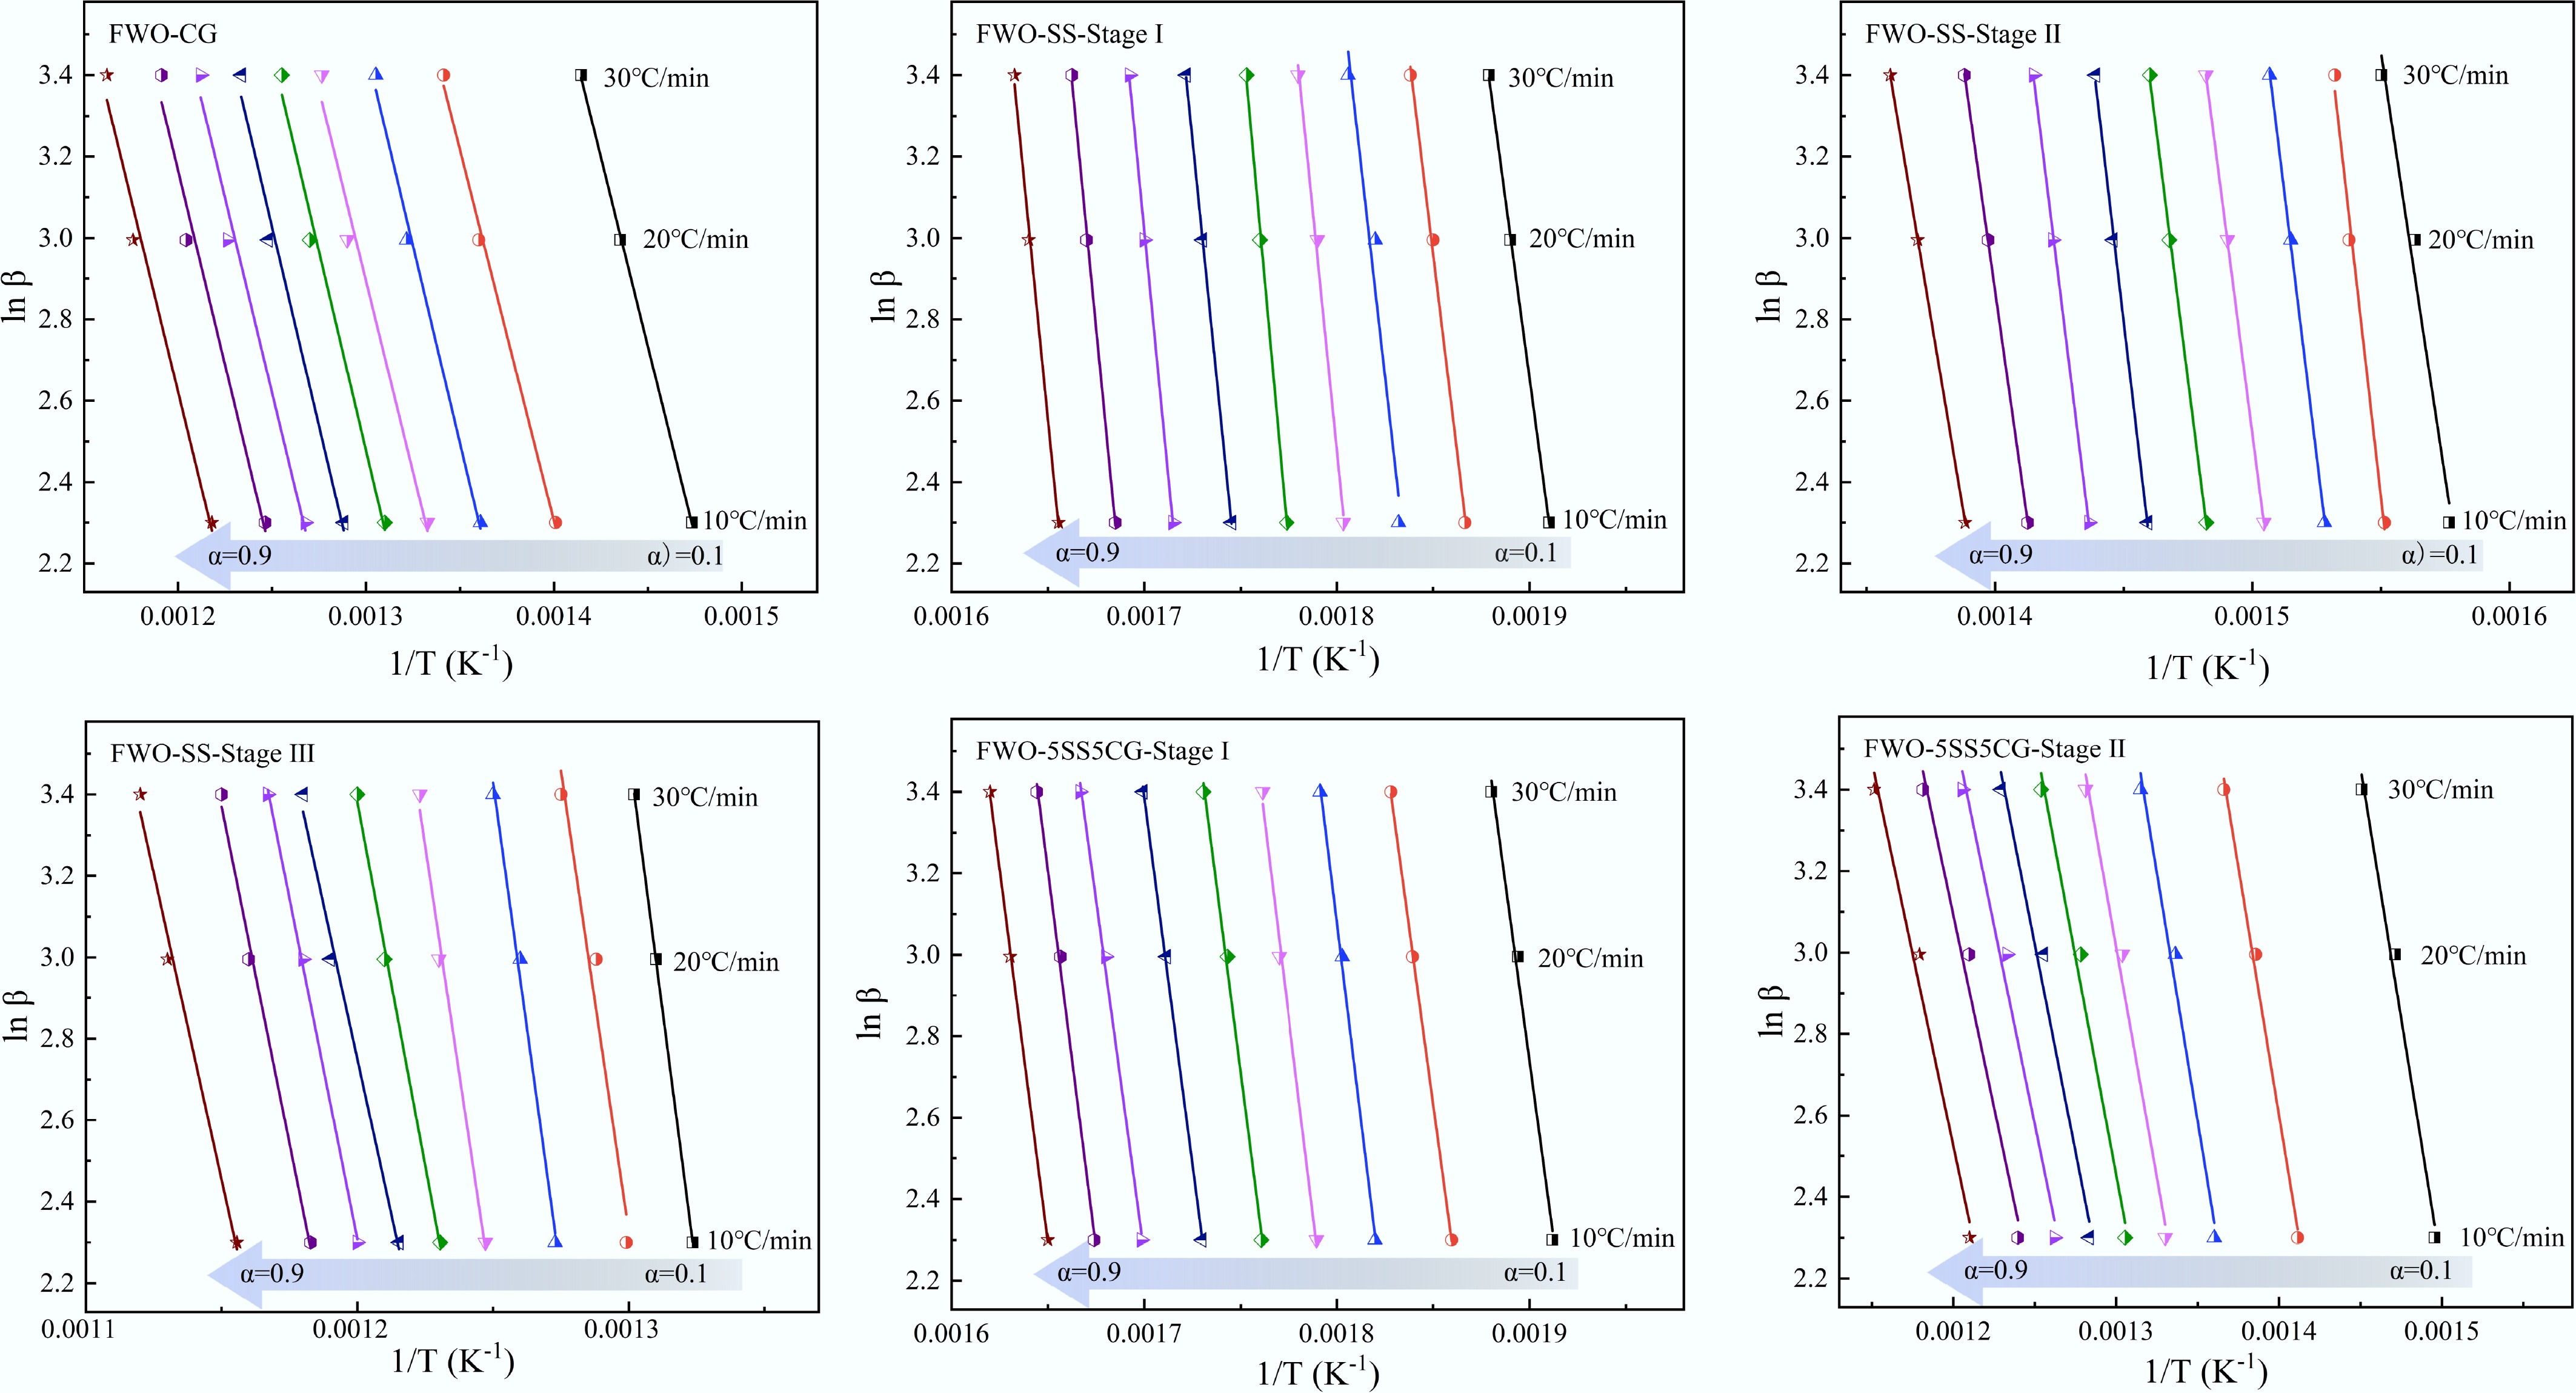
Figure 10.
Kinetic fitting results based on the FWO method.
-
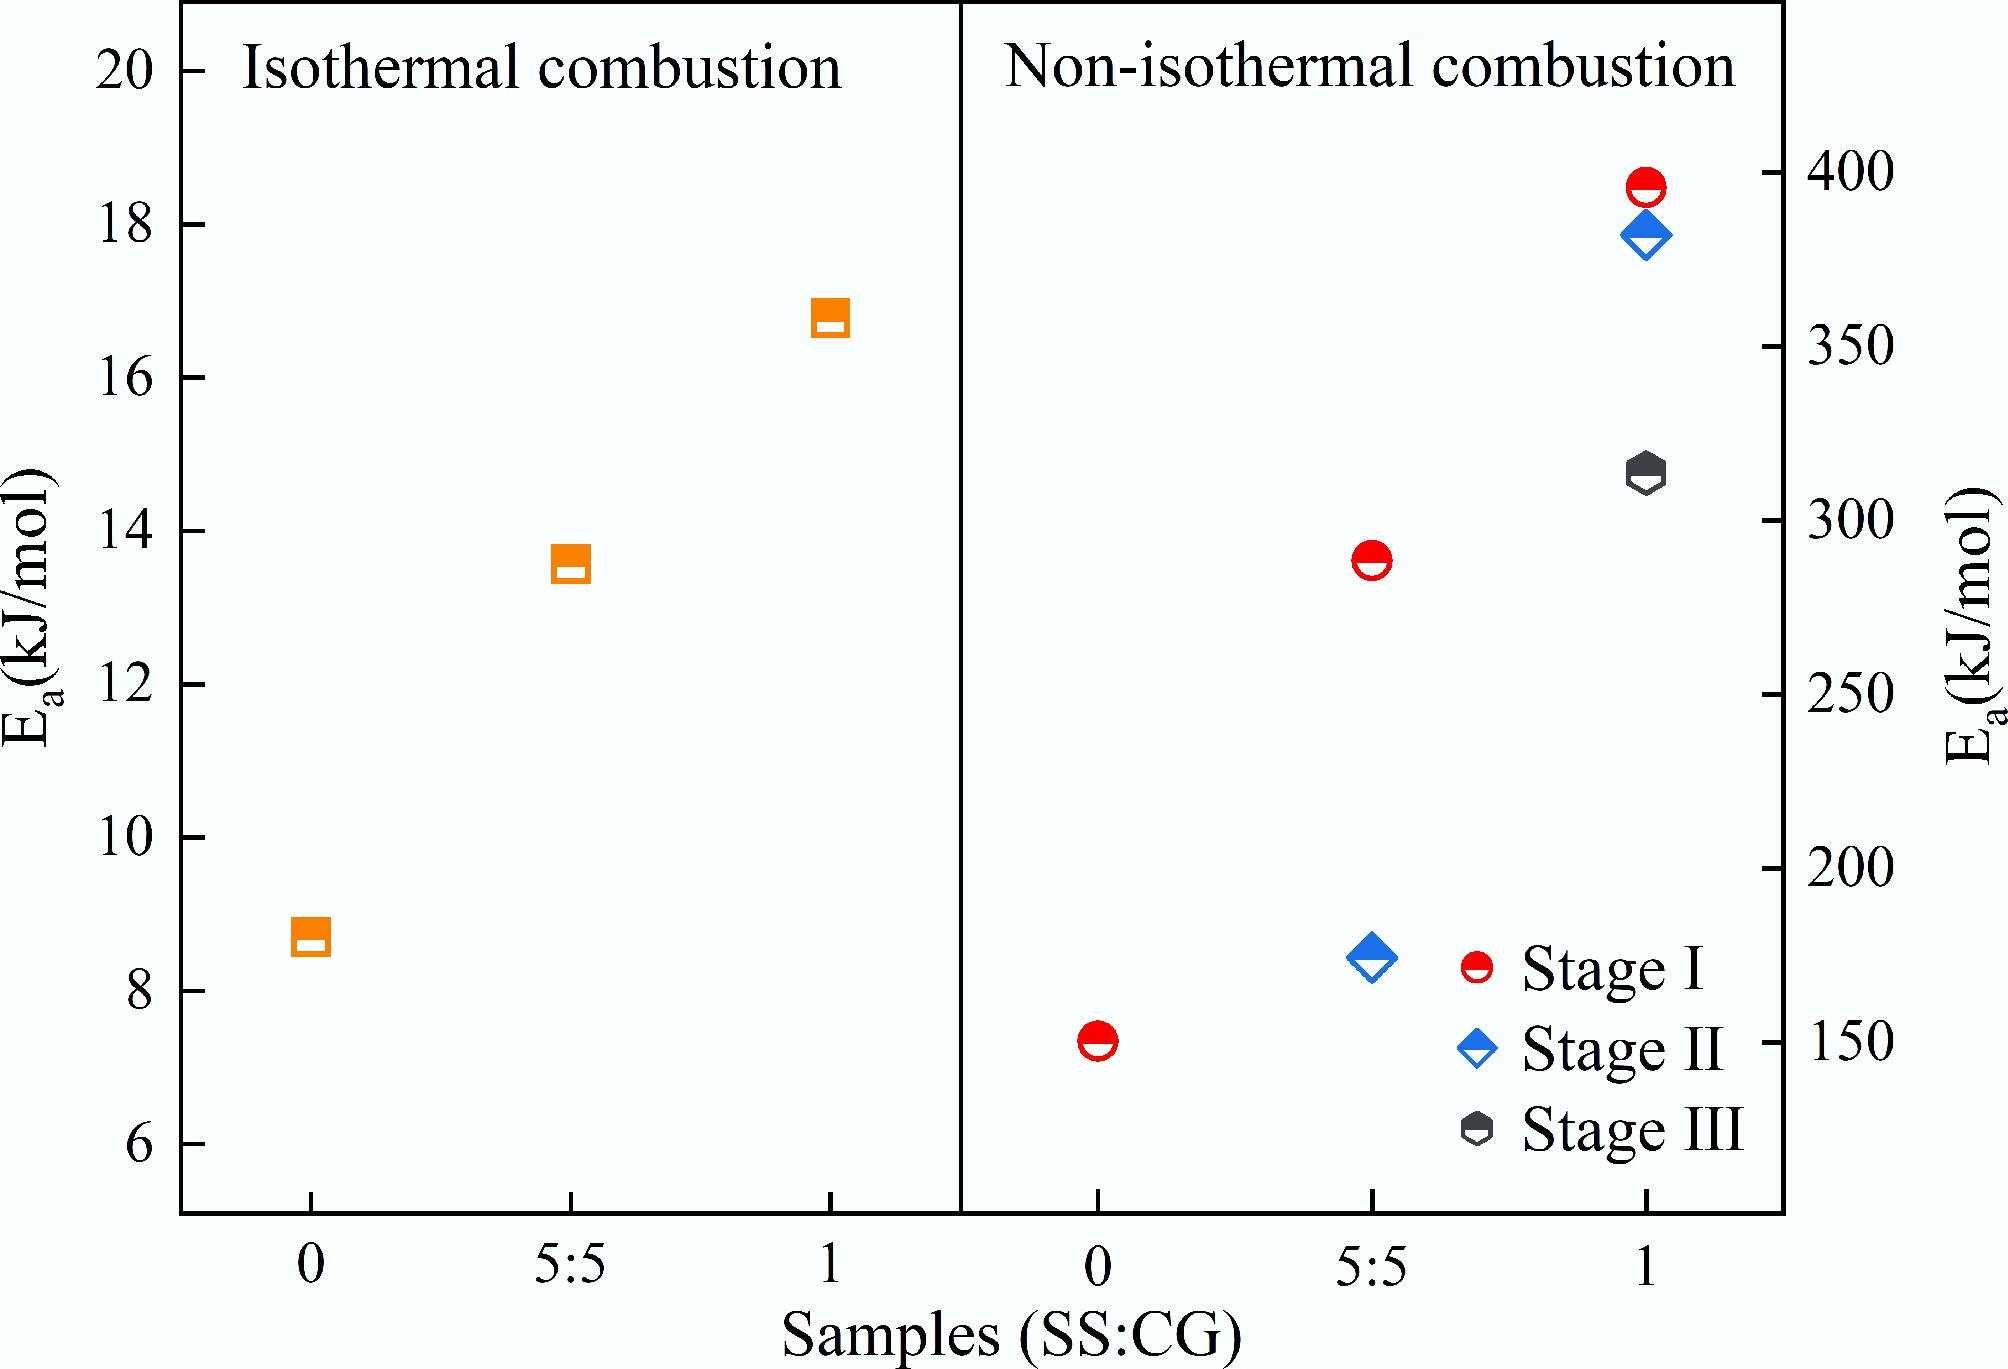
Figure 11.
The reaction activation energy of CG and SS in different heating processes.
-
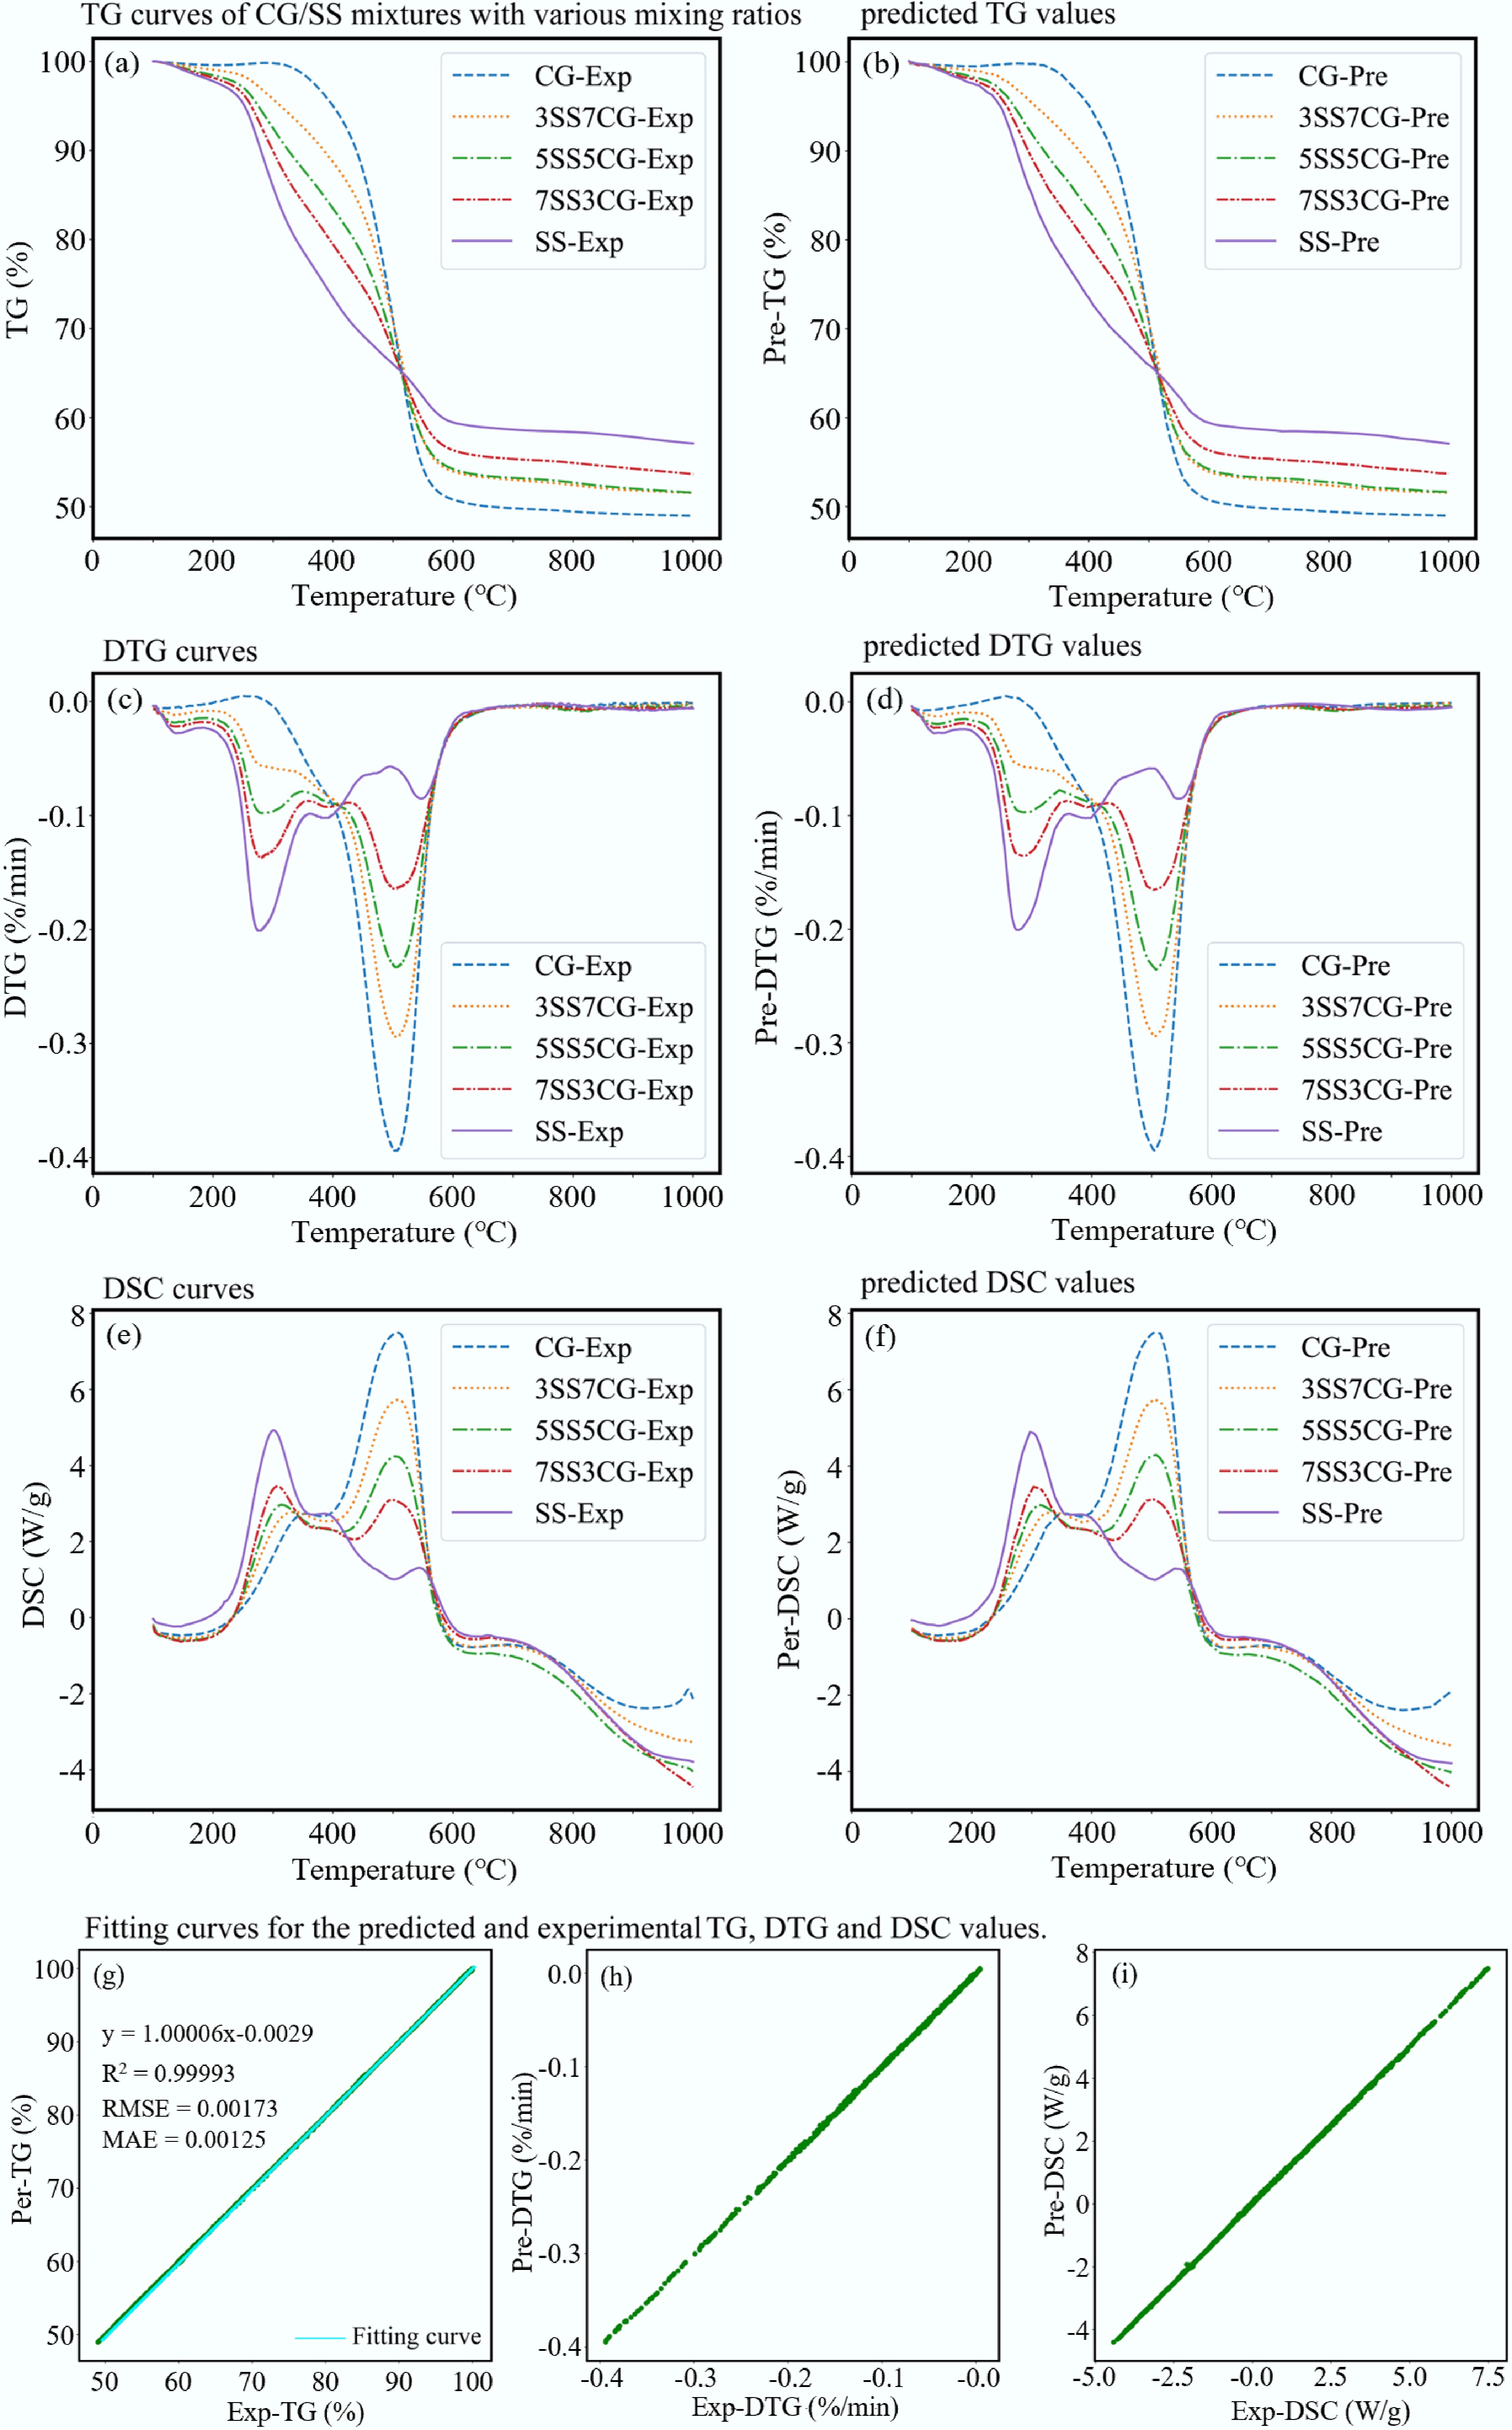
Figure 12.
Prediction of co-combustion under non-isothermal conditions. (a) TG curves of CG/SS mixtures with various mixing ratios. (b) Predicted TG values. (c) DTG curves. (d) Predicted DTG values. (e) DSC curves. (f) Predicted DSC values. (g)−(i) Fitting curves for the predicted and experimental TG, DTG, and DSC values.
-
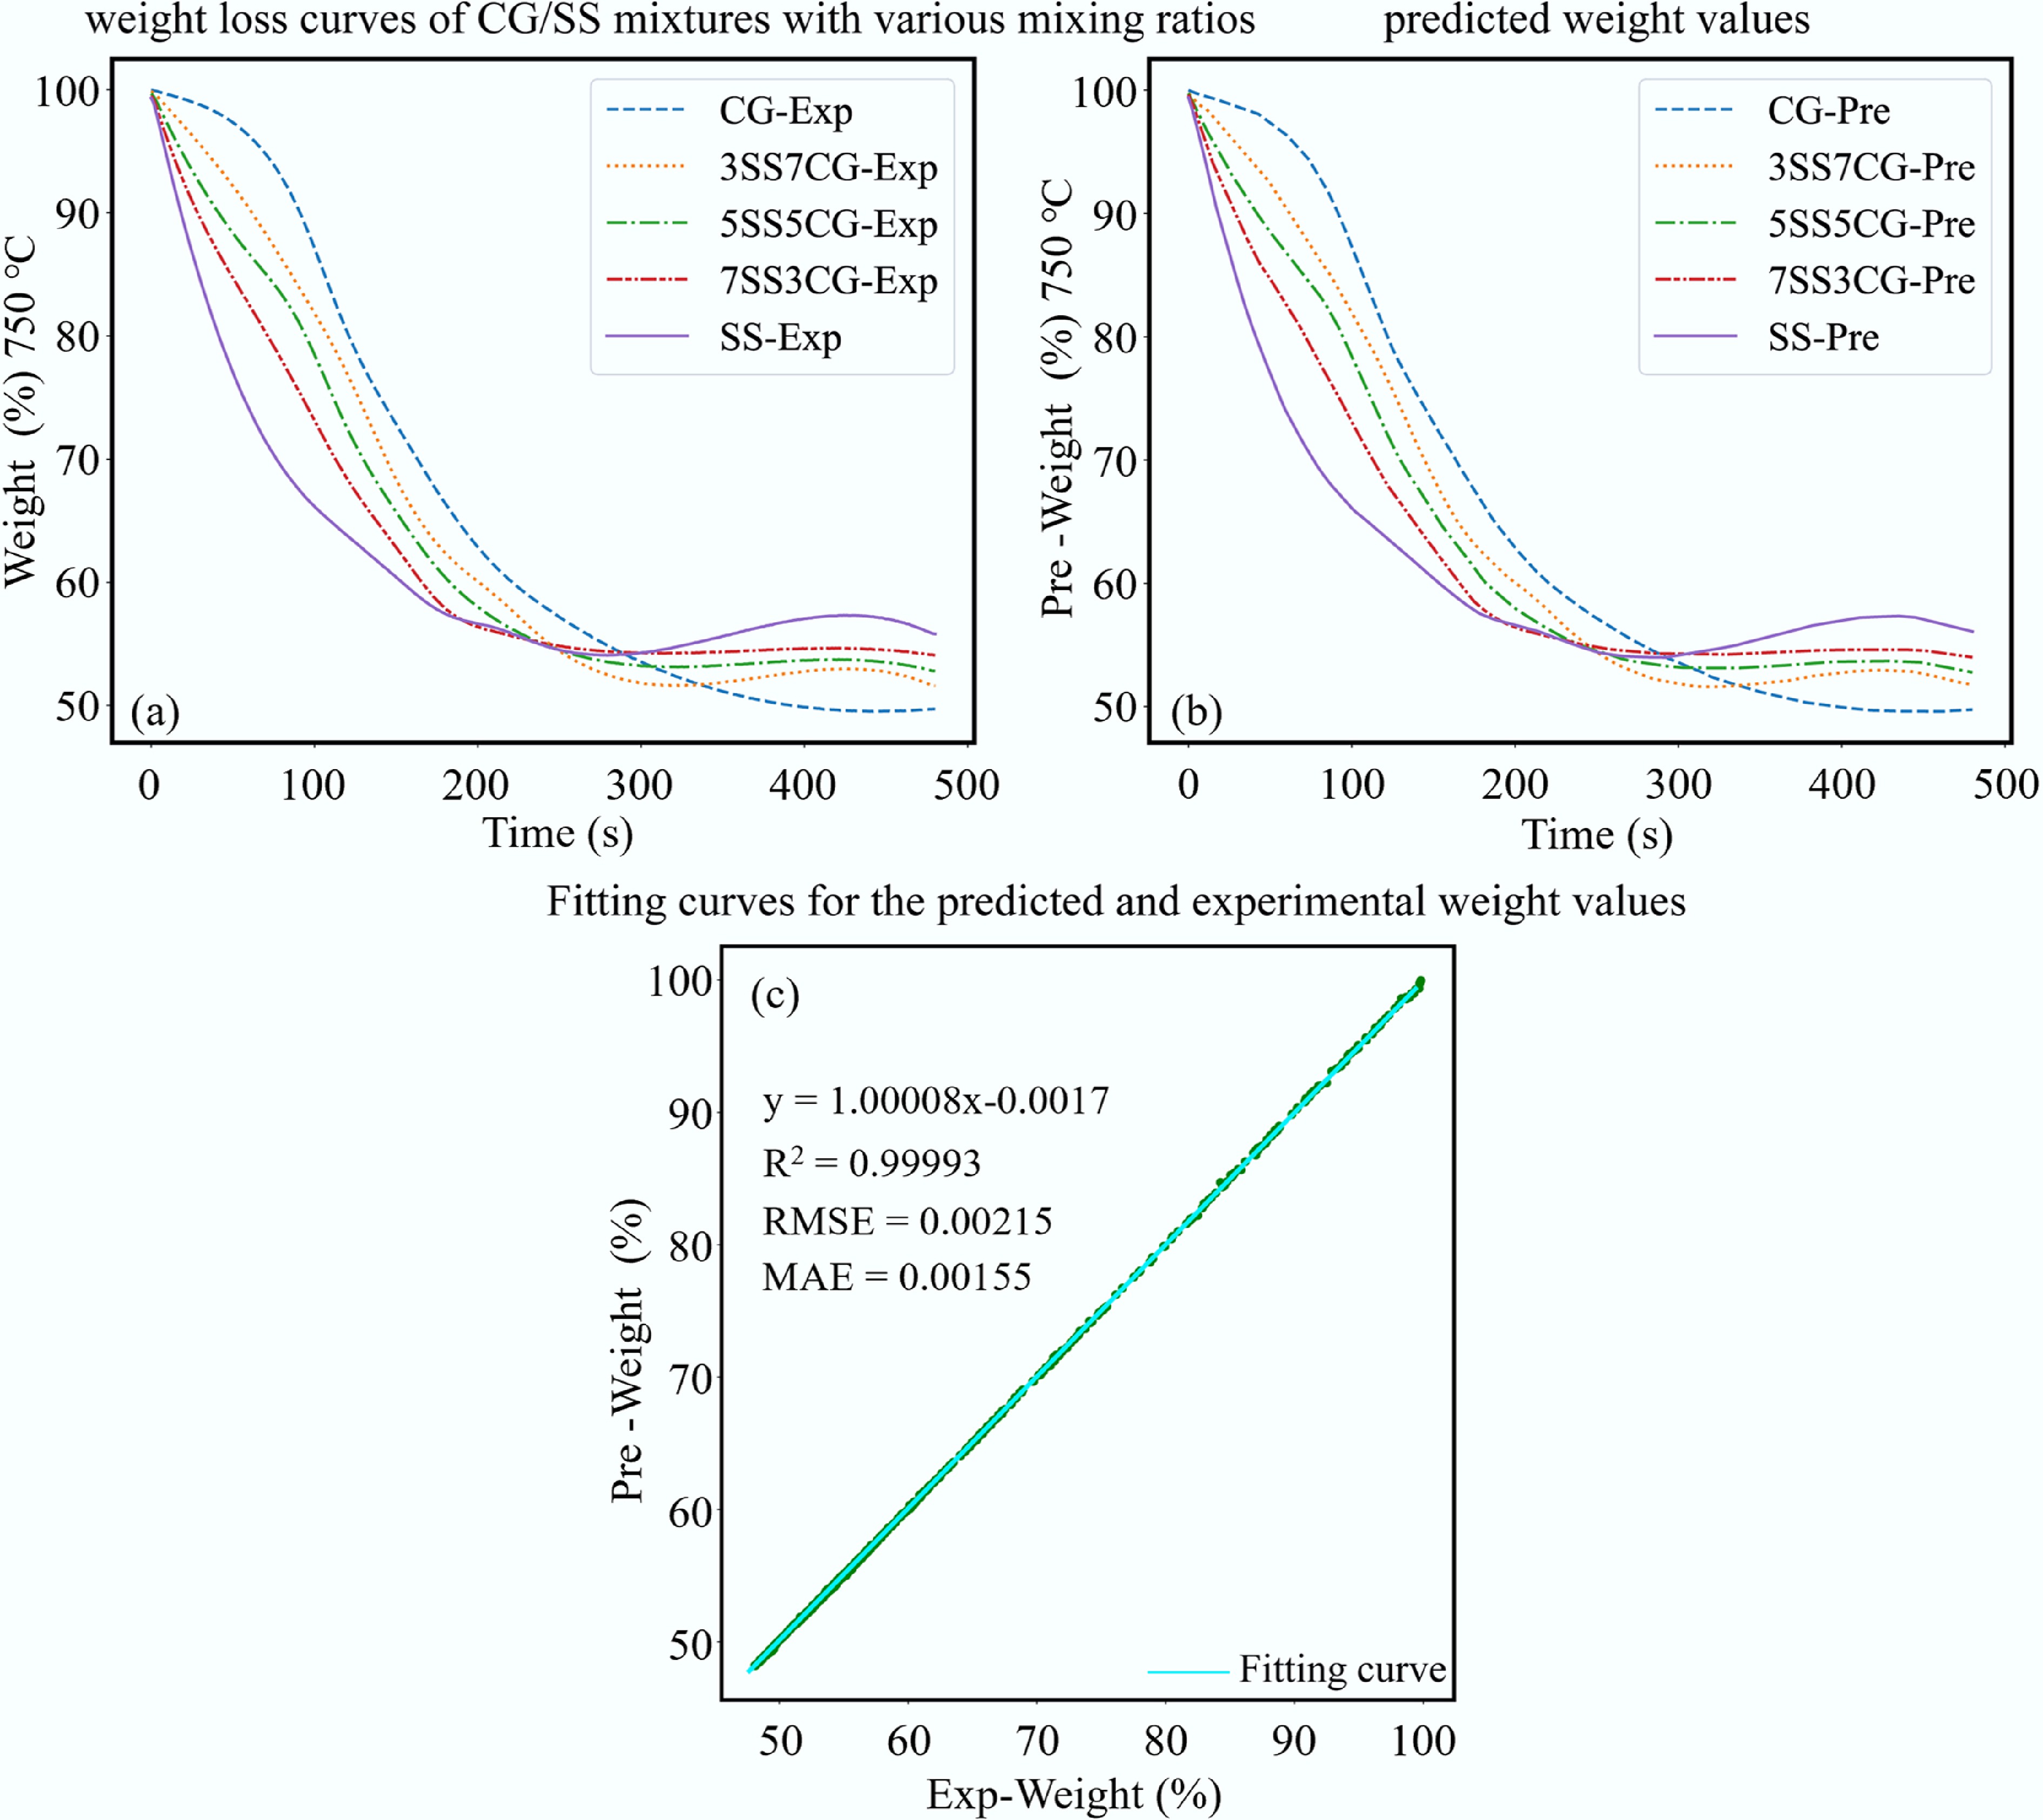
Figure 13.
Prediction of co-combustion under isothermal conditions. (a) Weight loss curves of CG/SS mixtures with various mixing ratios. (b) Predicted weight values. (c) Fitting curves for the predicted and experimental weight values.
-
Sample Proximate analysis (wt%) Ultimate analysis (wt%) LHV (MJ/kg) Ash composition (wt%) Mad Ad Vd FCd Cd Hd Obd Nd Sd Q SiO2 Al2O3 Fe2O3 MgO CaO P2O5 K2O SO3 TiO2 Na2O CG 1.00 50.40 19.83 29.77 33.70 2.88 9.71 0.67 2.64 14.17 46.4 46.2 2.8 0.3 0.5 0.7 0.5 0.5 1.8 0.1 SS 4.00 56.25 35.00 8.75 21.65 3.36 12.37 2.68 3.69 9.29 29.5 16.5 22.1 2.3 8.4 13.6 2.2 1.8 0.7 1.2 Abbreviations: ad: air dry basis; d: dry basis; M: moisture; A: ash yield; V: volatile matter; FC: fixed carbon; LHV: lower heating value; b: by difference. Table 1.
Proximate, ultimate analysis, and ash chemistry of CG and SS samples
-
Samples r0–0.5 (%/min) r0.5–1.0 (%/min) r1.0–1.5 (%/min) r1.5–2.0 (%/min) r2.0–2.5 (%/min) r2.5–3.0 (%/min) CG 6.9 11.4 22.0 17.4 14.6 9.2 3SS7CG 14.6 17.7 15.1 19.4 13.0 6.2 5SS5CG 20.9 17.4 16.5 17.1 10.5 9.1 7SS3CG 32.0 15.6 16.1 12.1 10.3 3.8 SS 47.6 17.1 9.7 8.6 4.8 0.9 Bold values represent the maximum isothermal mean burning rate among all time intervals. Table 2.
Isothermal mean burning rate of CG, SS and their blends
-
Sample Ti (°C) Tp1 (°C) Tp2 (°C) Tp3 (°C) Tb (°C) DTGmax (%/min) DTGmean (%/min) S (%2/[min2·°C3]) CG 321.33 502.33 — — 562.00 3.944 0.558 3.781E–08 3SS7CG 292.00 273.17 506.17 — 558.83 2.937 0.521 3.211E–08 5SS5CG 253.83 277.83 507.17 — 556.17 2.329 0.512 3.328E–08 7SS3CG 243.33 284.17 510.16 — 552.00 1.638 0.488 2.446E–08 SS 240.00 282.33 388.33 548.17 549.50 2.013 0.459 2.919E–08 Table 3.
Combustion behavior parameters of CG, SS and their blends (β = 10 °C/min)
-
Mechanism name Code g(α) 2D diffusion model D2 (1 – (1 – α)1/2)1/2 3D diffusion model D3 1 – 2/3α – (1 – α)2/3 First-order reaction F1 –ln(1 – α) Second-order reaction F2 –1 + (1 – α)–1 Third-order reaction F3 [–1 + (1 – α)–1]/2 3D Limiting surface reaction between both phases R3 1 – (1 – α)1/3 Random nucleation and nuclei growth (n = 3) A4 3[1 – (1 – α)1/3] Random nucleation and nuclei growth (n = 1/3) A3 [–ln(1 – α)]1/3 Random nucleation and nuclei growth (n = 2) A2 [–ln(1 – α)]2 Random nucleation and nuclei growth (n = 3/2) A1 [–ln(1 – α)]3/2 Table 4.
Commonly used solid dynamics model functions
-
Samples T (°C) Functions R2 slope k of (lnk − 1/T) Ea (kJ/mol) CG 750 F1 0.9918 −1,046.3 8.7 850 0.9967 950 0.9980 3SS7CG 750 F1 0.9845 −1,676.9 13.94 850 0.9945 950 0.9988 5SS5CG 750 F1 0.9873 −1,632.1 13.57 850 0.9958 950 0.9990 7SS3CG 750 F1 0.9967 −1,761.4 14.64 850 0.9996 950 0.9977 SS 750 D3 0.9961 −2,016.7 16.77 850 0.9916 950 0.9881 Table 5.
The kinetic results of CG and SS isothermal co-combustion process
-
Conversion rates 1st stage (221–356 °C) 2nd stage (356–473 °C) 3rd stage (473–682 °C) Ea (kJ/mol) R2 Ea (kJ/mol) R2 Ea (kJ/mol) R2 0.1 368.3 0.9997 330.9 0.9782 404.6 0.9999 0.2 377.8 0.9969 440.0 0.9923 397.2 0.9199 0.3 409.1 0.9622 408.0 0.9994 382.0 0.9938 0.4 430.1 0.9956 386.2 0.9998 352.7 0.9926 0.5 422.4 0.9985 393.9 0.9991 282.4 0.9980 0.6 411.1 0.9998 424.6 0.9985 240.5 0.9913 0.7 383.5 0.9990 403.1 0.9994 264.4 0.9991 0.8 383.2 0.9987 354.0 0.9998 261.5 0.9952 0.9 375.9 0.9973 298.3 0.9999 238.2 0.9908 Average 395.7 382.1 313.7 Table 6.
Apparent activation energy of SS obtained based on the FWO method
-
Conversion rates 1st stage (284–658 °C) Ea (kJ/mol) R2 0.1 147.0 0.9997 0.2 144.1 0.9963 0.3 153.2 0.9934 0.4 148.3 0.9805 0.5 154.4 0.9888 0.6 154.6 0.9866 0.7 151.2 0.9858 0.8 151.0 0.9801 0.9 149.8 0.9830 Average 150.4 Table 7.
Apparent activation energy of CG obtained based on the FWO method
-
Conversion rates 1st stage (221–350 °C) 2nd stage (350–698 °C) Ea (kJ/mol) R2 Ea (kJ/mol) R2 0.1 275.9 0.9940 195.2 0.9889 0.2 275.6 0.9998 193.1 0.9946 0.3 306.7 0.9984 192.6 0.9859 0.4 304.3 0.9954 178.8 0.9885 0.5 290.7 0.9968 169.3 0.9860 0.6 285.2 0.9989 161.0 0.9837 0.7 274.7 0.9966 154.1 0.9816 0.8 293.8 0.9973 149.4 0.9818 0.9 289.4 0.9996 149.1 0.9848 Average 288.5 171.4 Table 8.
Apparent activation energy of 5SS5CG obtained based on the FWO method
-
Model Input Output Network topology MAE RMSE Train R2 Testing R2 Validation R2 ANN-1 Time
Temperature
mixture ratioWeight
loss3 × 16 × 16 × 16 × 1 0.00564 0.00746 0.99922 0.99917 0.99928 ANN-2 3 × 16 × 24 × 88 × 1 0.00192 0.00263 0.99991 0.99990 0.99991 ANN-3 3 × 40 × 40 × 24 × 1 0.00134 0.00184 0.99994 0.99995 0.99995 ANN-4 3 × 80 × 16 × 80 × 1 0.00148 0.00184 0.99995 0.99995 0.99995 ANN-5 3 × 80 × 40 × 24 × 1 0.00134 0.00180 0.99995 0.99995 0.99996 ANN-6 3 × 40 × 56 × 56 × 1 0.00146 0.00234 0.99992 0.99992 0.99994 ANN-7 3 × 40 × 64 × 24 × 1 0.00140 0.00194 0.99994 0.99994 0.99994 ANN-8 3 × 16 × 48 × 80 × 1 0.00133 0.00211 0.99994 0.99993 0.99995 ANN-9 3 × 24 × 56 × 32 × 1 0.00191 0.00257 0.99992 0.99990 0.99993 ANN-10 3 × 40 × 32 × 32 × 1 0.00121 0.00156 0.99996 0.99996 0.99996 Bold values represent the best performance. Table 9.
Comparison of the performance parameters of 10 ANN-I models
-
Model Input Output Network topology MAE RMSE Train R2 Testing R2 Validation R2 ANN-11 Temperature
mixture ratioTG
DTG2 × 16 × 16 × 16 × 3 0.00194 0.00265 0.99983 0.99984 0.99985 ANN-12 2 × 48 × 16 × 16 × 3 0.00199 0.00260 0.99986 0.99985 0.99987 ANN-13 DSC 2 × 96 × 16 × 16 × 3 0.00179 0.00242 0.99985 0.99985 0.99986 ANN-14 2 × 32 × 16 × 48 × 3 0.00180 0.00227 0.99989 0.99989 0.99989 ANN-15 2 × 48 × 80 × 48 × 3 0.00151 0.00187 0.99993 0.99993 0.99993 ANN-16 2 × 32 × 48 × 32 × 3 0.00125 0.00173 0.99993 0.99993 0.99994 ANN-17 2 × 48 × 64 × 32 × 3 0.00149 0.00200 0.99991 0.99990 0.99991 ANN-18 2 × 80 × 48 × 96 × 3 0.00153 0.00217 0.99990 0.99989 0.99990 ANN-19 2 × 16 × 80 × 32 × 3 0.00149 0.00207 0.99990 0.99990 0.99991 ANN-20 2 × 80 × 64 × 64 × 3 0.00142 0.00201 0.99991 0.99990 0.99991 Bold values represent the best performance. Table 10.
Comparison of the performance parameters of 10 ANN-II models
Figures
(13)
Tables
(10)