-
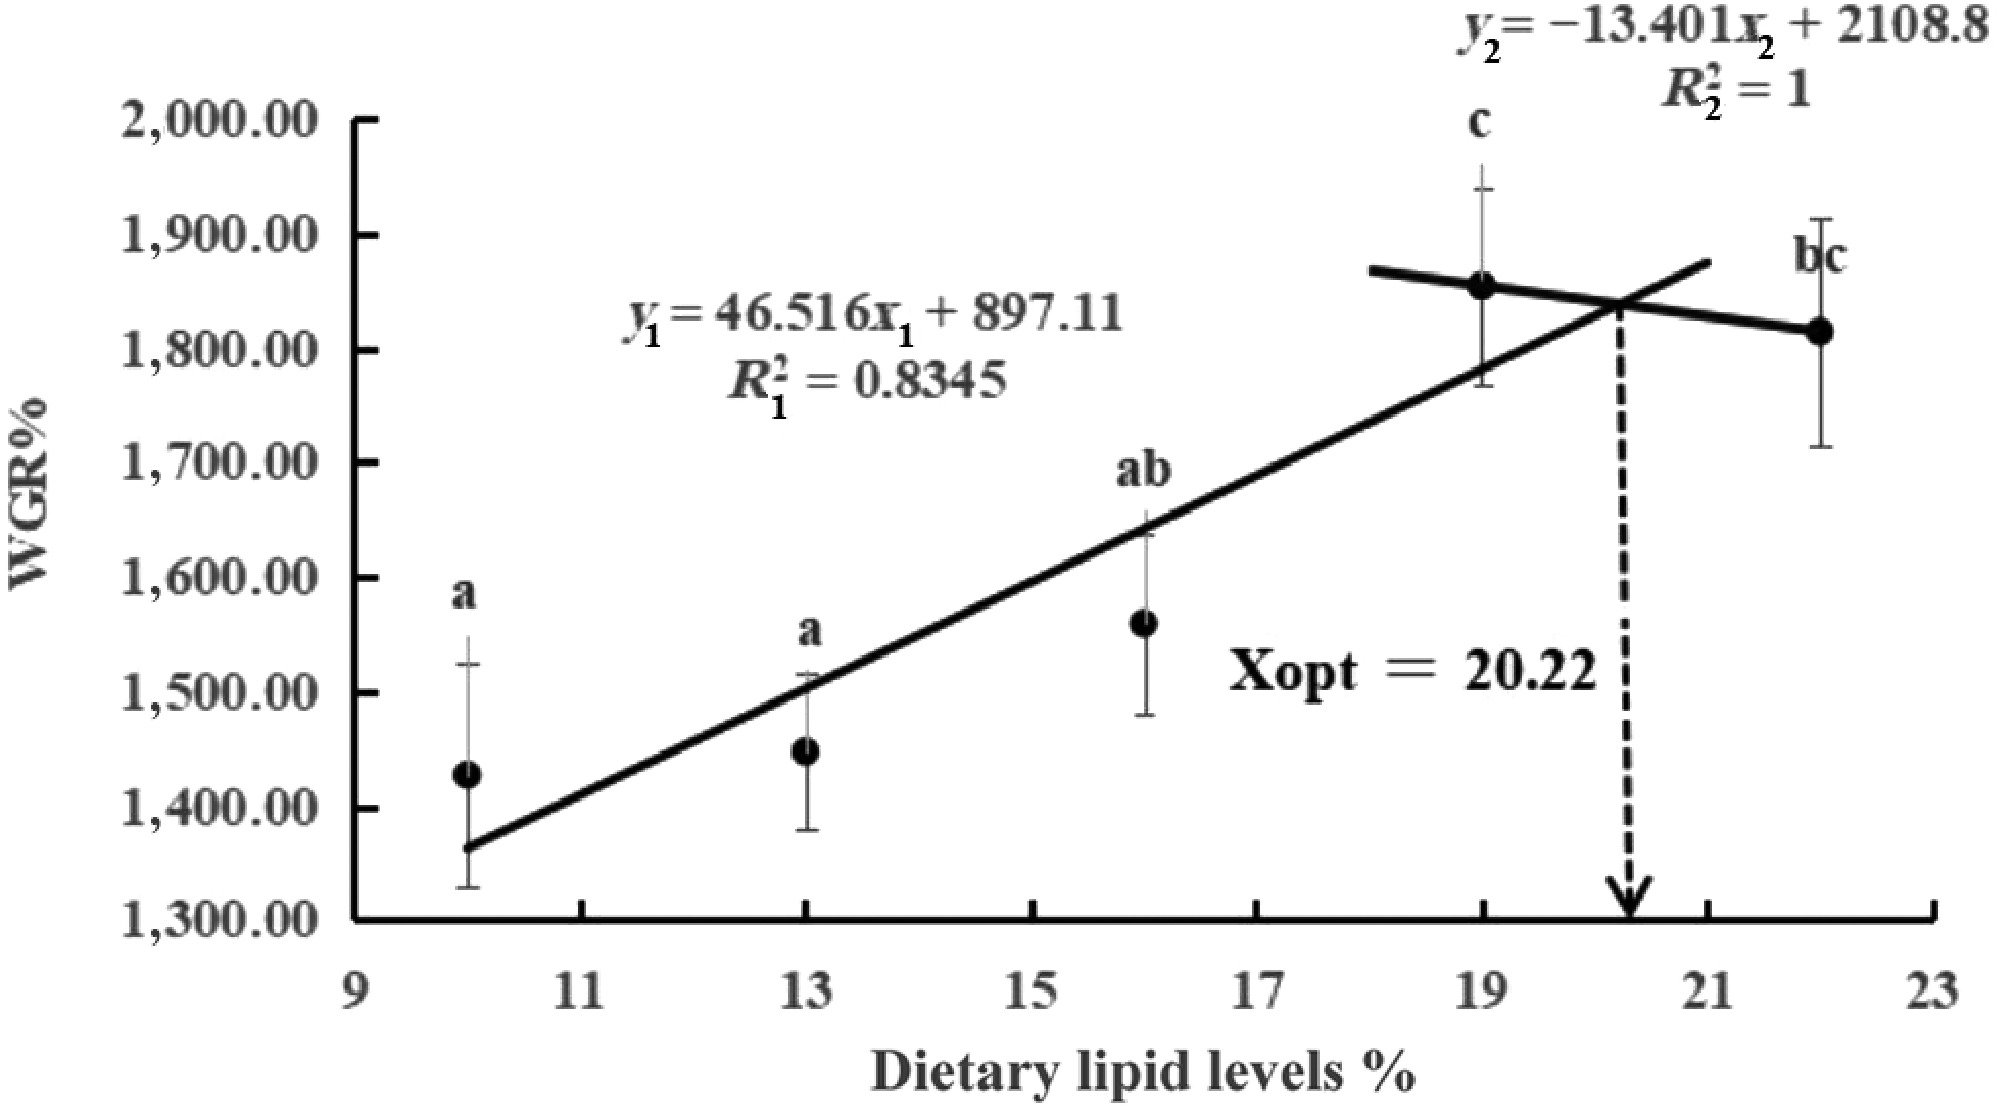
Figure 1.
Relationships between WGR (y) and dietary lipid level (x) for largemouth bass. The letters above the figure indicate significant differences among lipid levels (p < 0.05).
-
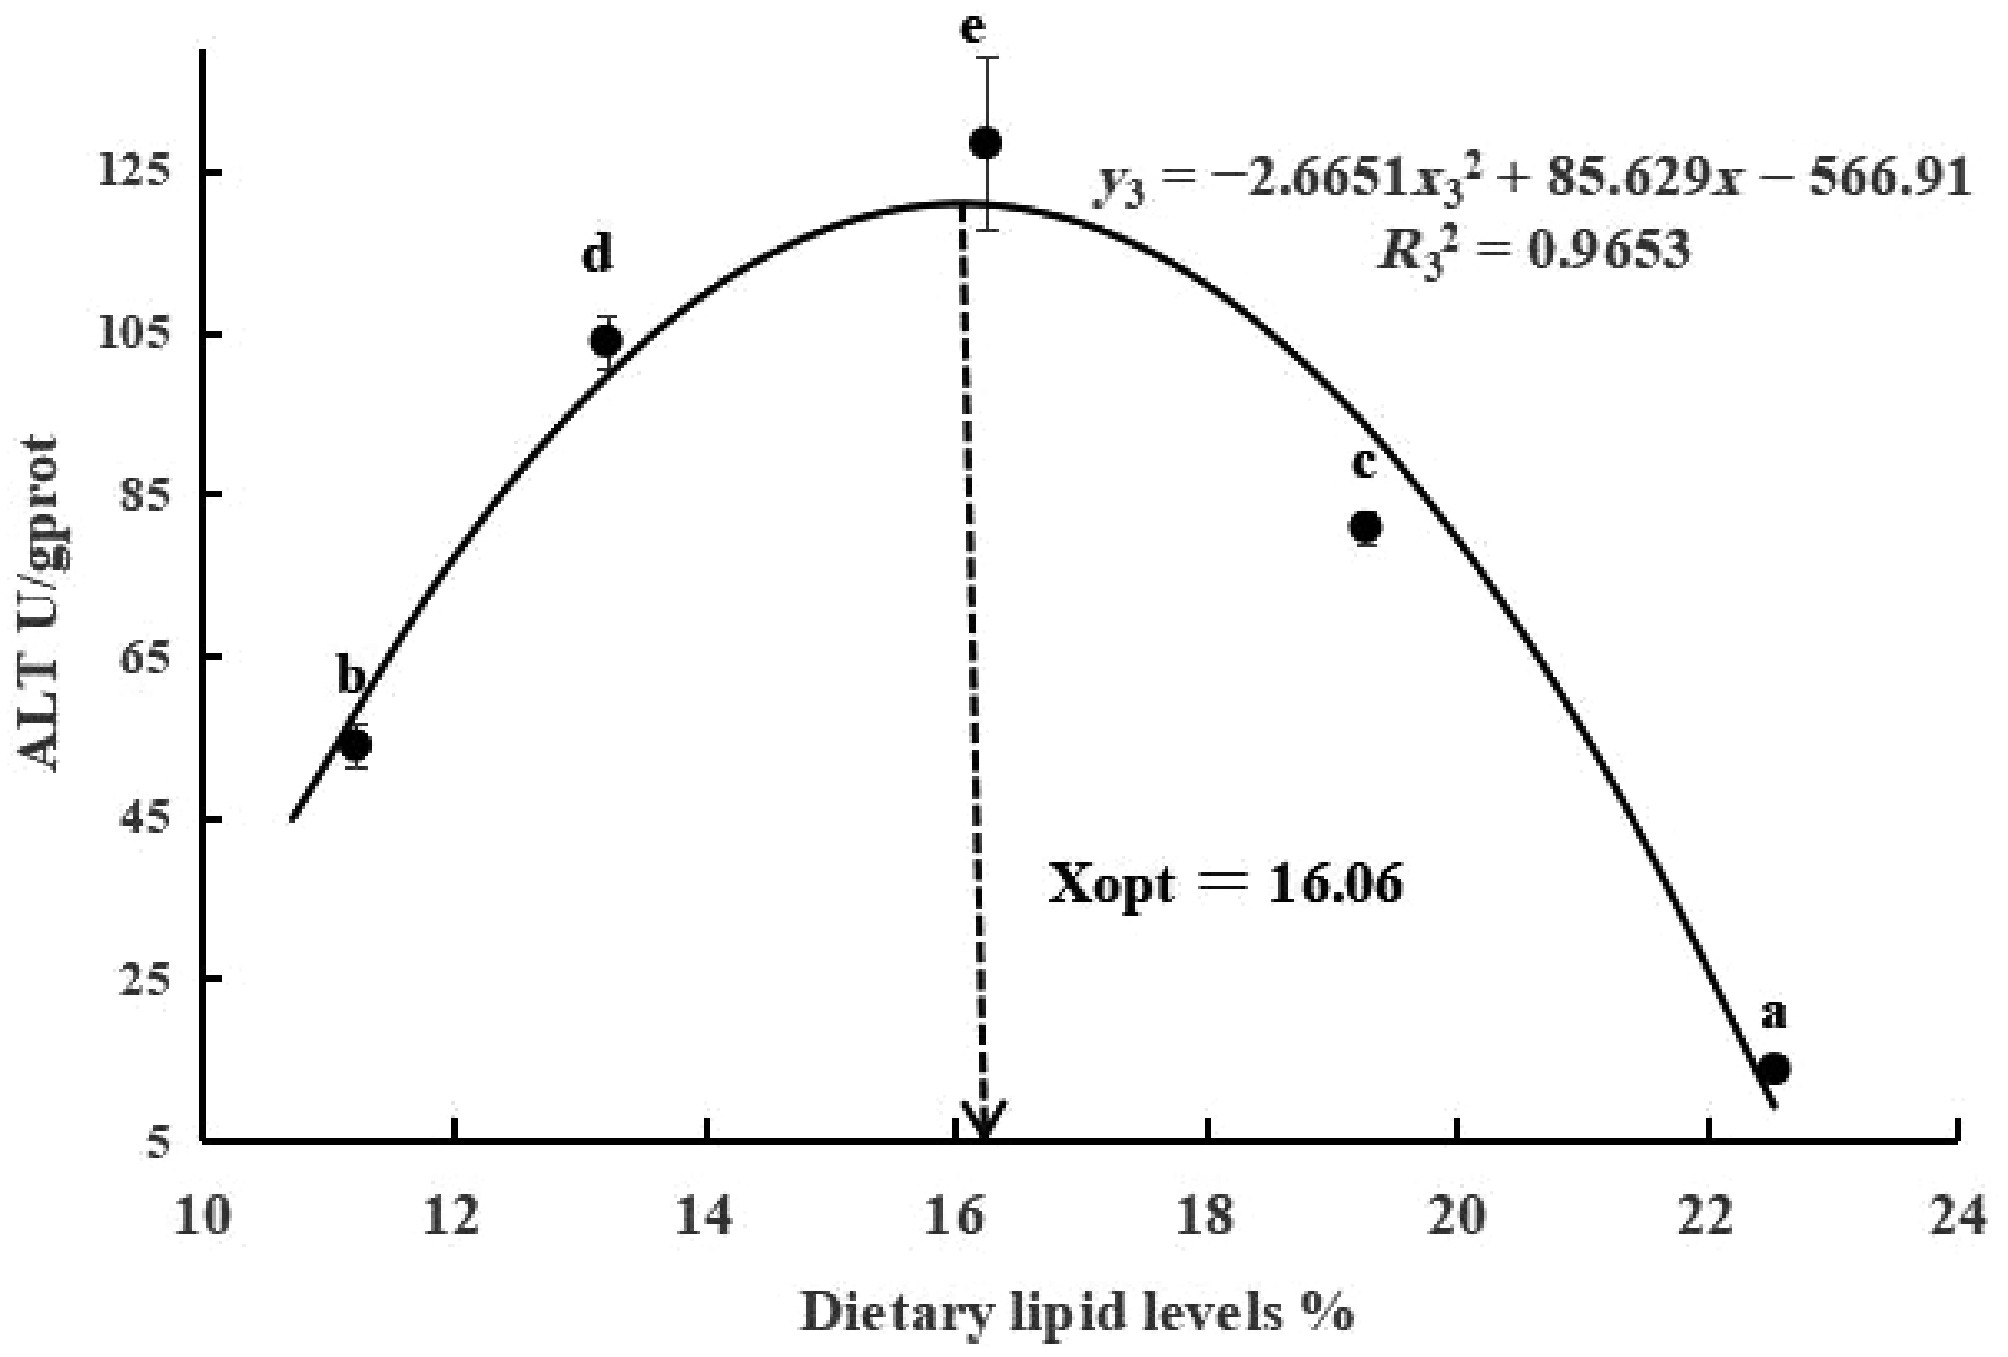
Figure 2.
Relationships between ALT (y) and dietary lipid levels (x) for largemouth bass. The letters above the figure indicate significant differences among lipid levels (p < 0.05).
-
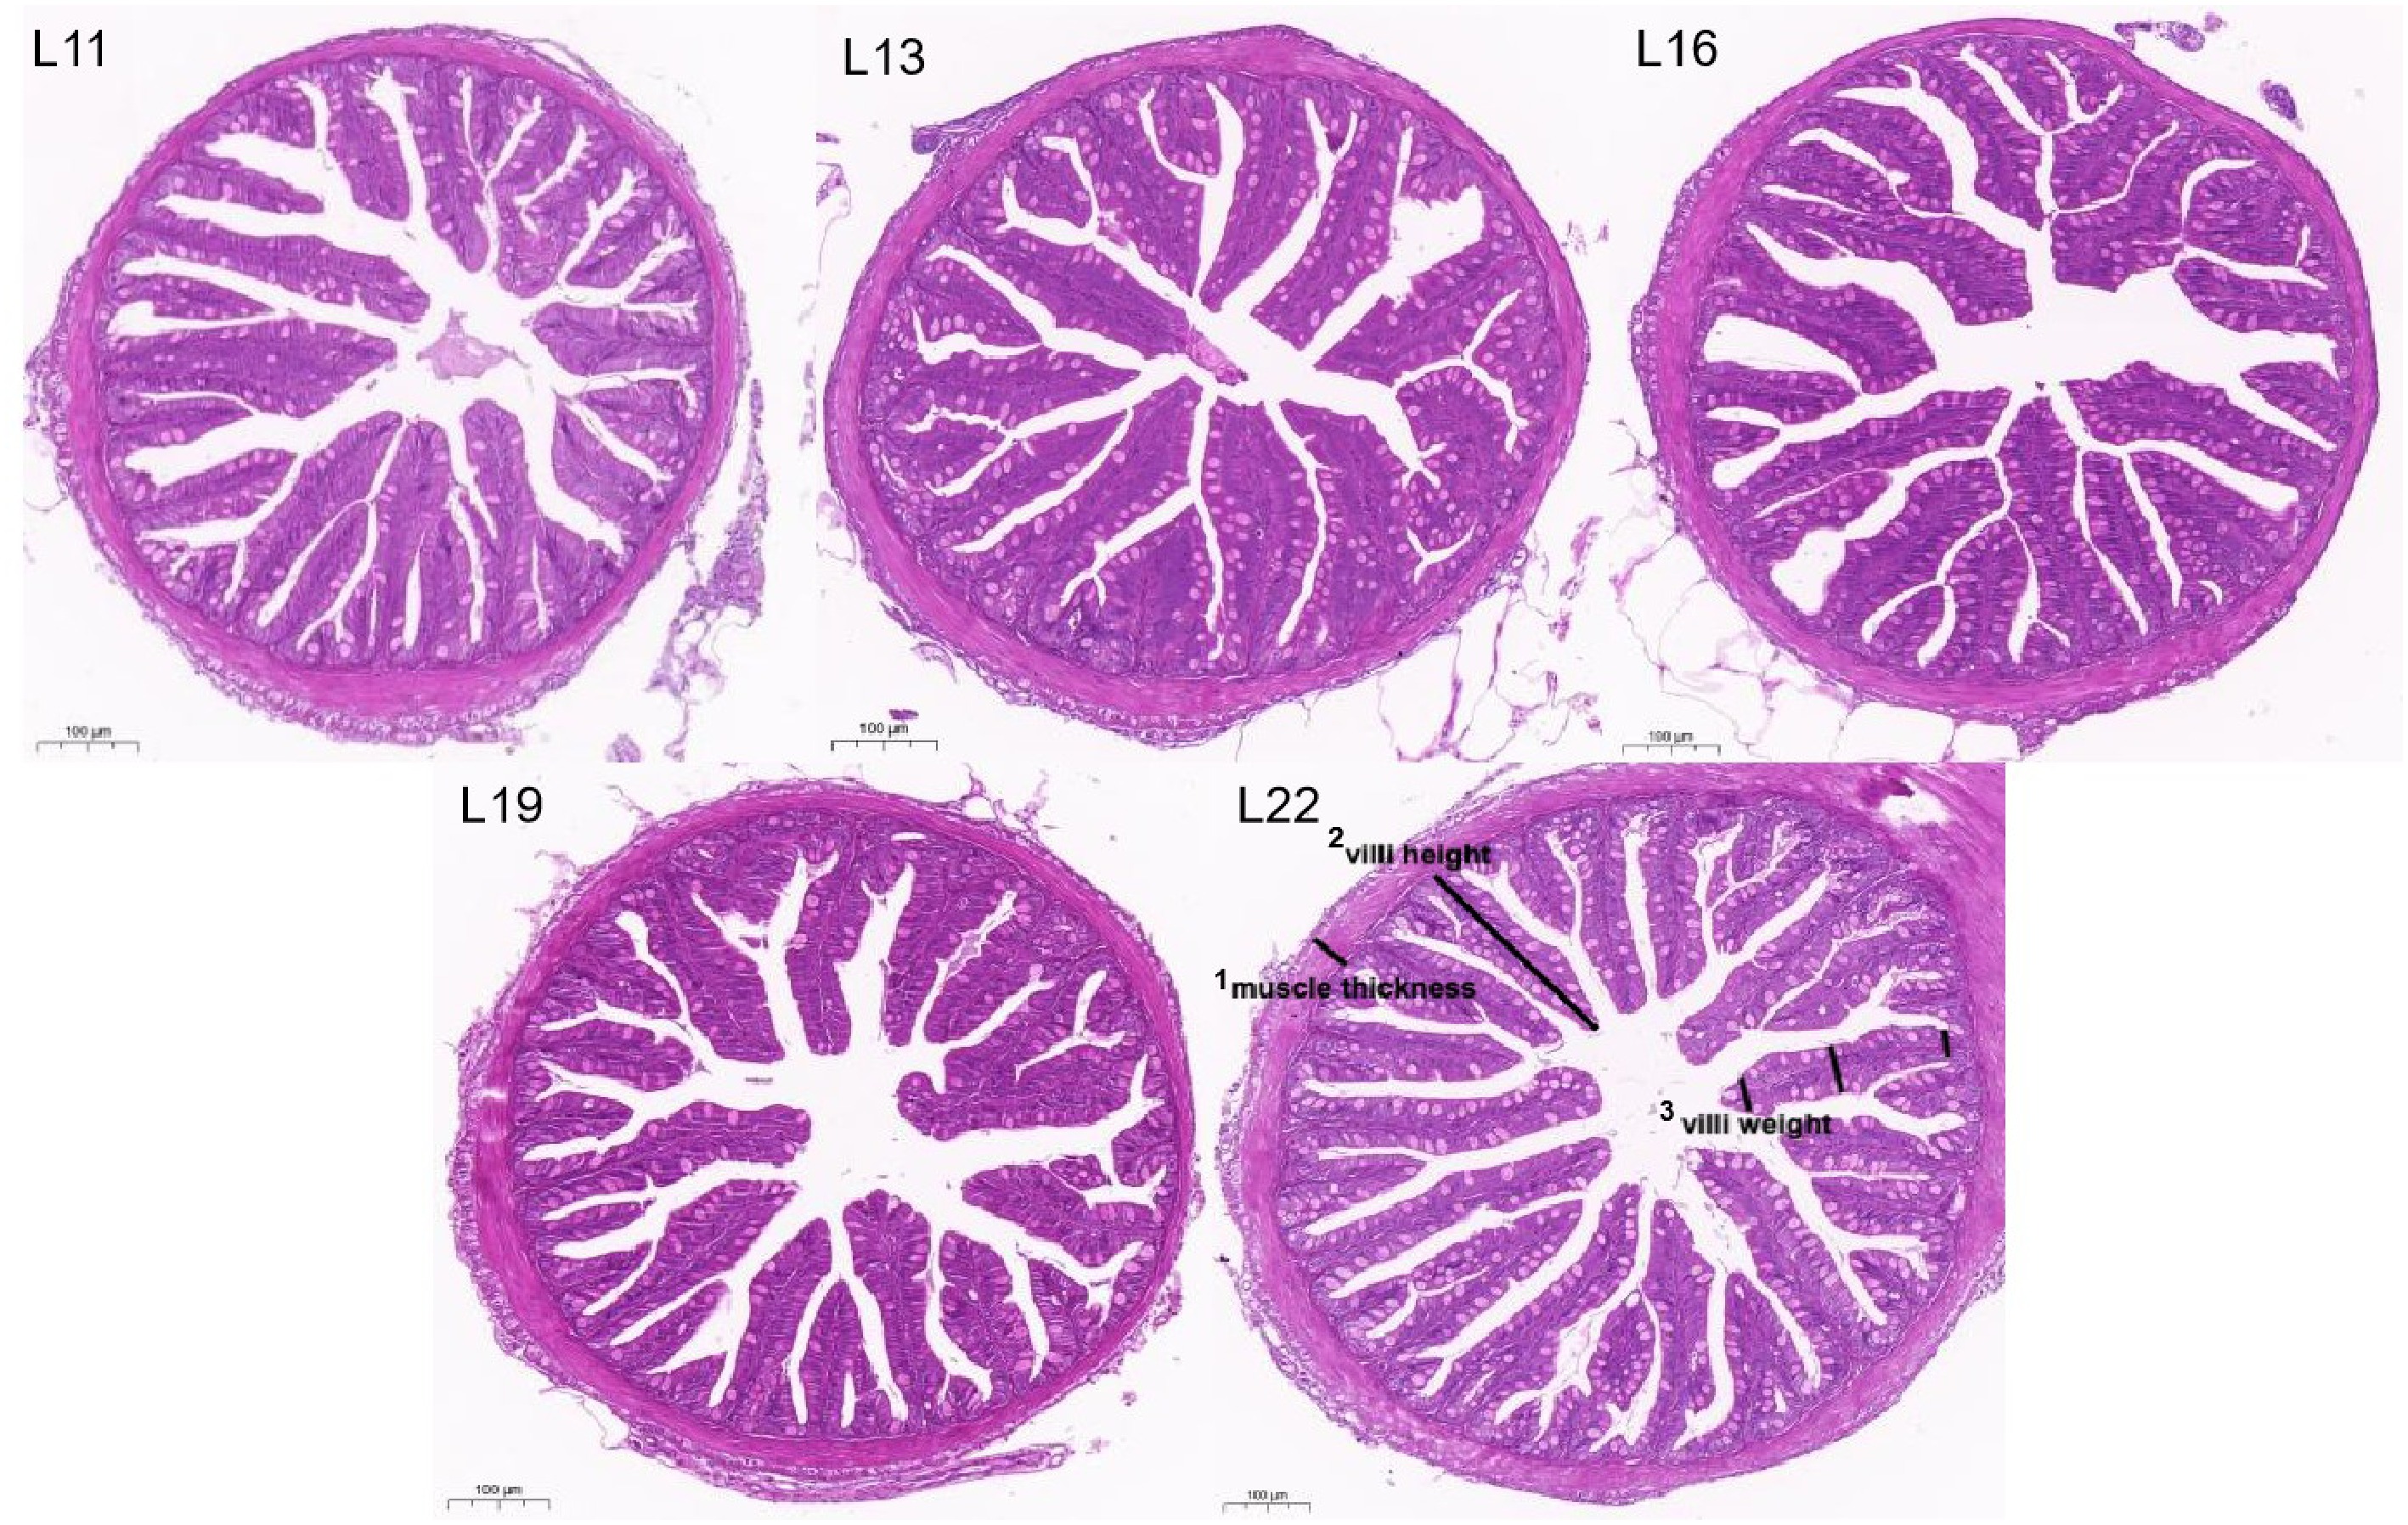
Figure 3.
Intestinal morphology and structure in largemouth bass from each group (H&E staining, 10× magnification). 1 Muscle thickness: The thickness of the annular and longitudinal muscles of the intestine, i.e., the vertical distance from the base of the submucosa to the serosal layer. 2 Villus height: vertical distance from the base to the tip of the intestinal villi. 3 Villus weight: the distance from the main villus of the intestine to its small branching structures.
-
Items Diet L11 Diet L13 Diet L16 Diet L19 Diet L22 Ingredients Fish meal 60.00 60.00 60.00 60.00 60.00 Antarctic krill powder 10.00 10.00 10.00 10.00 10.00 Plasma protein powder 5.00 5.50 6.00 6.50 7.00 Flour 15.75 12.25 8.75 5.25 1.75 Triple alginate 3.00 3.00 3.00 3.00 3.00 Fish oil : soybean oil = 2:1 0.00 3.00 6.00 9.00 12.00 Soya bean lecithin 3.00 3.00 3.00 3.00 3.00 Ca(H2PO4)2 2.00 2.00 2.00 2.00 2.00 Choline choride 50% 0.25 0.25 0.25 0.25 0.25 Vitamin C ester 0.30 0.30 0.30 0.30 0.30 Vitamin premix1 0.20 0.20 0.20 0.20 0.20 Mineral premix2 0.50 0.50 0.50 0.50 0.50 Total 100 100 100 100 100 Proximate composition Moisture, % 3.63 2.94 3.11 3.24 3.54 Ash, % 13.57 12.61 13.09 11.97 12.53 Crude protein, % 54.81 56.90 56.04 55.23 55.67 Ethere extract, % 11.22 13.22 16.25 19.28 22.45 Gross energy, kJ/g 19.77 20.26 20.62 20.79 20.97 1 One kilogram of vitamin premix provided 8,000 IU vitamin A, 4 mg vitamin B1, 3.6 mg vitamin B2, 40 mg vitamin B5, 4 mg vitamin B6, 0.02 mg vitamin B12, 3,000 IU vitamin D3, 20 IU vitamin E, 2 mg vitamin K3, 0.15 mg biotin, 1.0 mg folic acid, 11 mg D-calcium pantothenate, 10 mg nicotinic acid, and 100 mg antioxidants. 2 One kilogram of the mineral premix provided 13 mg FeSO4·H2O, 60 mg ZnSO4·H2O, 1,200 mg NaCl, 32 mg MnSO4·H2O, 7 mg CuSO4·H2O, and 8 mg KI. Table 1.
Composition and nutrient levels of experimental diets (dry matter [DM] basis).
-
Items Group L11 Group L13 Group L16 Group L19 Group L22 IBW, g 0.06 ± 0.01 0.06 ± 0.00 0.06 ± 0.00 0.06 ± 0.00 0.06 ± 0.00 FBW, g 0.92 ± 0.06a 0.93 ± 0.04a 0.99 ± 0.05a 1.17 ± 0.05b 1.15 ± 0.06b WGR, % 1,426.44 ± 97.66a 1,446.76 ± 68.01a 1,558.94 ± 78.33a 1,854.21 ± 86.22b 1,814.01 ± 100.37b SGR, %/d 9.06 ± 0.22a 9.12 ± 0.15a 9.35 ± 0.16a 9.90 ± 0.14b 9.82 ± 0.19b SR, % 68.75 ± 7.09 64.60 ± 8.22 71.60 ± 5.40 72.40 ± 5.78 76.40 ± 4.63 FCR 1.58 ± 0.01b 1.59 ± 0.13b 1.24 ± 0.09a 1.19 ± 0.02a 1.18 ± 0.04a VSI, % 7.78 ± 0.65 7.86 ± 0.39 8.41 ± 0.38 9.78 ± 0.40 9.11 ± 0.44 CF, % 2.25 ± 0.12b 2.04 ± 0.03a 2.06 ± 0.03a 2.01 ± 0.07a 2.09 ± 0.04a In the same row, values with different lowercase superscripts indicate a significant difference (p < 0.05). The same applies in Tables 3–6 as well. Table 2.
Effects of lipid levels on the growth performance and morphometric parameters of largemouth bass (growth performance, n = 4; morphometric parameters, n = 24).
-
Items Group L11 Group L13 Group L16 Group L19 Group L22 Moisture, % 81.61 ± 0.18d 79.45 ± 0.93bc 80.48 ± 0.37cd 78.15 ± 0.42ab 77.1 ± 0.94a Crude protein, % 13.05 ± 0.18 14.09 ± 0.68 13.05 ± 0.22 14.09 ± 0.24 14.32 ± 0.58 Crude lipid, % 1.99 ± 0.11a 2.95 ± 0.10b 3.39 ± 0.13c 4.50 ± 0.07d 5.32 ± 0.13e Ash, % 3.04 ± 0.06 3.29 ± 0.15 2.91 ± 0.04 3.11 ± 0.09 3.19 ± 0.17 PR, % 22.97 ± 0.42a 24.99 ± 1.30ab 23.42 ± 0.50a 25.53 ± 0.47ab 26.31 ± 1.18b LR % 17.81 ± 1.01a 22.8 ± 0.80bc 21.81 ± 0.91b 24.53 ± 0.32cd 25.19 ± 0.66d Table 3.
Effect of lipid level on body composition and nutrient retention of largemouth bass (n = 4).
-
Items Group L11 Group L13 Group L16 Group L19 Group L22 Digestive enzyme activity Trypsin, U/mg protein 2.36 ± 0.31 2.17 ± 0.41 2.02 ± 0.43 1.99 ± 0.29 1.86 ± 0.35 Lipase, U/mg protein 20.28 ± 2.18a 27.23 ± 4.24ab 27.41 ± 4.94ab 28.27 ± 15.69ab 34.68 ± 6.07b Amylase, U/mg protein 1.58 ± 0.18 1.59 ± 0.25 1.82 ± 0.22 1.79 ± 0.17 1.77 ± 0.15 Protein metabolic enzyme activity γ-GT, U/L 11.48 ± 2.29 12.22 ± 2.69 11.84 ± 2.22 10.49 ± 1.47 11.23 ± 2.19 Table 4.
Effects of lipid level on digestive enzymes and protein metabolic enzyme activity of largemouth bass.
-
Items Group L11 Group L13 Group L16 Group L19 Group L22 Physiological biochemistry ALT, U/g protein 53.92 ± 2.47b 103.92 ± 3.29d 128.43 ± 10.55e 80.94 ± 2.09c 13.82 ± 0.34a AST, U/g protein 115.2 ± 7.02d 75.08 ± 25.07c 58.54 ± 2.70b 47.13 ± 1.01b 28.64 ± 1.27a TG, mmol/g protein 0.74 ± 0.10a 1.01 ± 0.1b 1.29 ± 0.05c 0.76 ± 0.03a 1.16 ± 0.04bc GLU, mmol/g protein 0.72 ± 0.07a 1.04 ± 0.26ab 1.82 ± 0.09c 0.99 ± 0.04ab 1.52 ± 0.18bc Antioxidant indexes CAT, U/mg protein 11.07 ± 1.20 10.06 ± 0.68 9.81 ± 0.71 12.36 ± 0.95 11.54 ± 0.10 GSH-Px, U/mg protein 1.13 ± 0.20 1.17 ± 0.34 1.62 ± 0.42 1.35 ± 0.30 1.41 ± 0.18 T-SOD, U/mg protein 147.04 ± 6.13 148.36 ± 3.78 158.22 ± 9.01 164.77 ± 9.09 164.59 ± 7.12 POD, U/mg protein 1.15 ± 0.21 1.07 ± 0.07 1.26 ± 0.12 1.28 ± 0.10 1.18 ± 0.10 MDA, mmol/mg protein 2.63 ± 0.14a 2.88 ± 0.21ab 2.94 ± 0.32ab 3.36 ± 0.46ab 5.28 ± 1.82b Immune indexes AKP, U/mg protein 3.26 ± 0.37b 2.95 ± 0.26ab 2.62 ± 0.28ab 2.15 ± 0.19a 2.57 ± 0.29ab LZM, U/mg protein 53.94 ± 4.24 48.55 ± 3.63 52.72 ± 2.31 57.47 ± 3.33 56.17 ± 3.82 Table 5.
Effects of lipid levels on physiological biochemistry and immune antioxidant indexes of largemouth bass.
-
Items Group L11 Group L13 Group L16 Group L19 Group L22 Villus height, μm 233.69 ± 11.79 210.18 ± 12.89 229.85 ± 10.70 241.71 ± 9.89 246.19 ± 15.93 Villus weight, μm 59.61 ± 3.04a 67.88 ± 1.97b 76.87 ± 3.35c 61.89 ± 1.34a 61.36 ± 2.53a Muscle thickness, μm 26.08 ± 2.71 23.86 ± 1.36 23.89 ± 1.40 24.46 ± 2.44 25.99 ± 1.56 Goblet cells, number 231.75 ± 1.01 248.20 ± 0.91 248.00 ± 1.01 222.40 ± 0.91 287.00 ± 1.01 Table 6.
Effects of lipid levels on the intestinal structure of largemouth bass (n = 40).
Figures
(3)
Tables
(6)