-
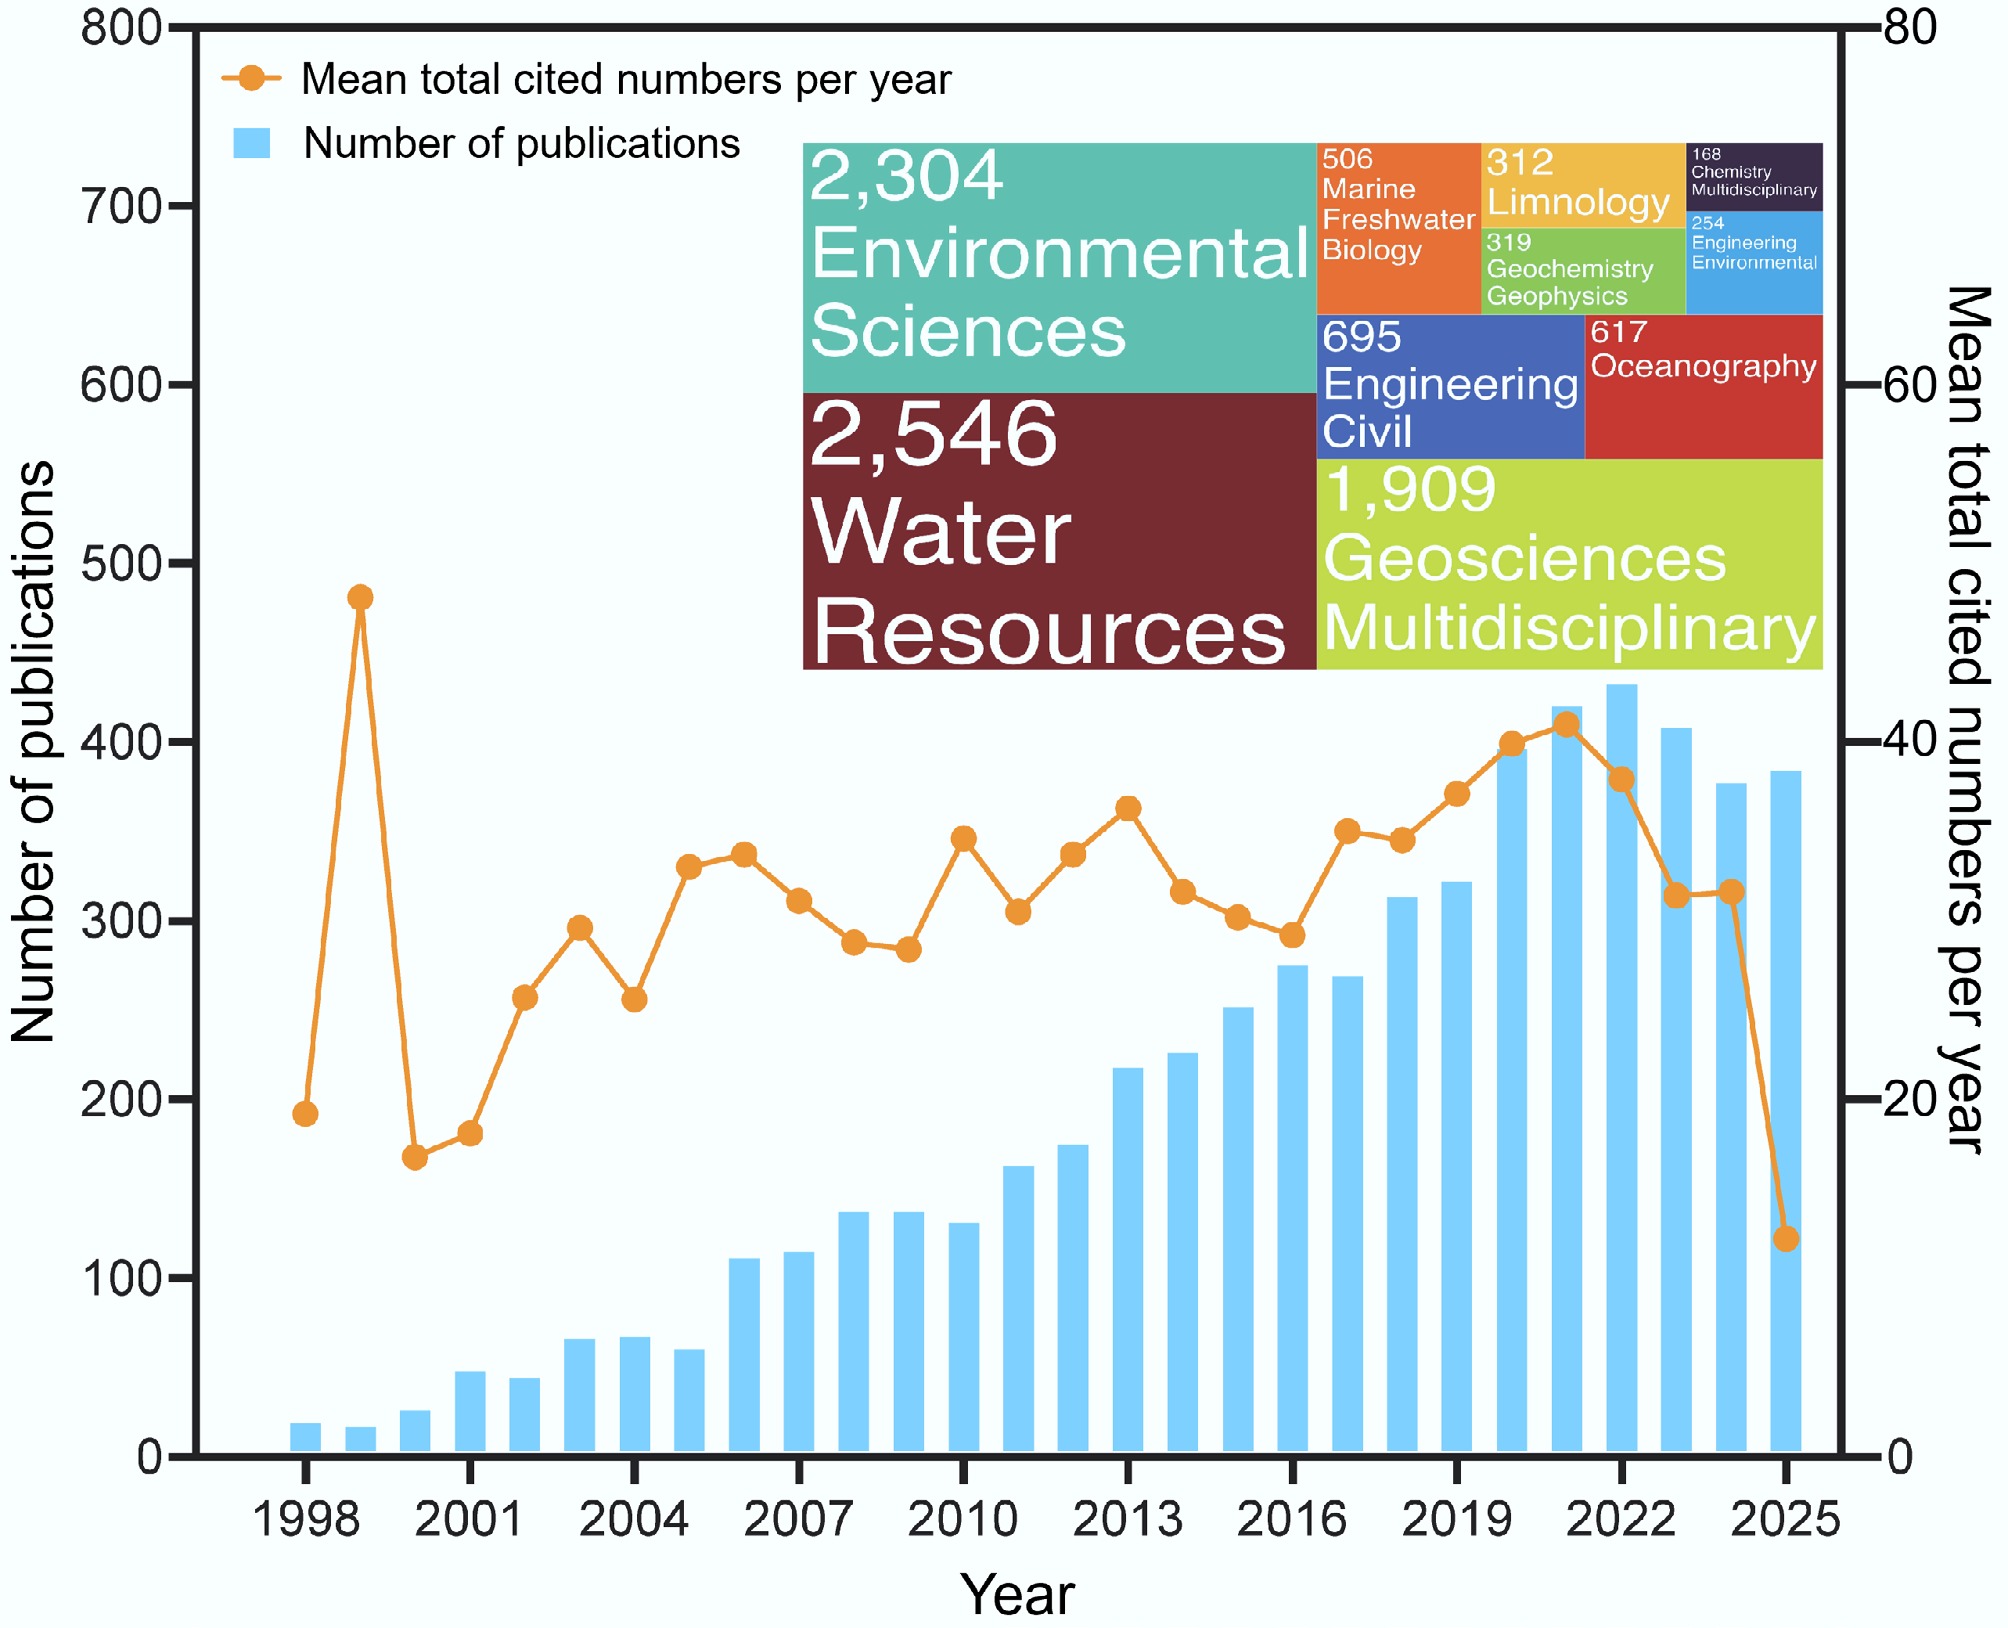
Figure 1.
Trends in the number of published and mean total annually cited articles on CMI pollution identified by WOSCC, and the number and proportion of related disciplines (top 10) for CMI pollution research.
-
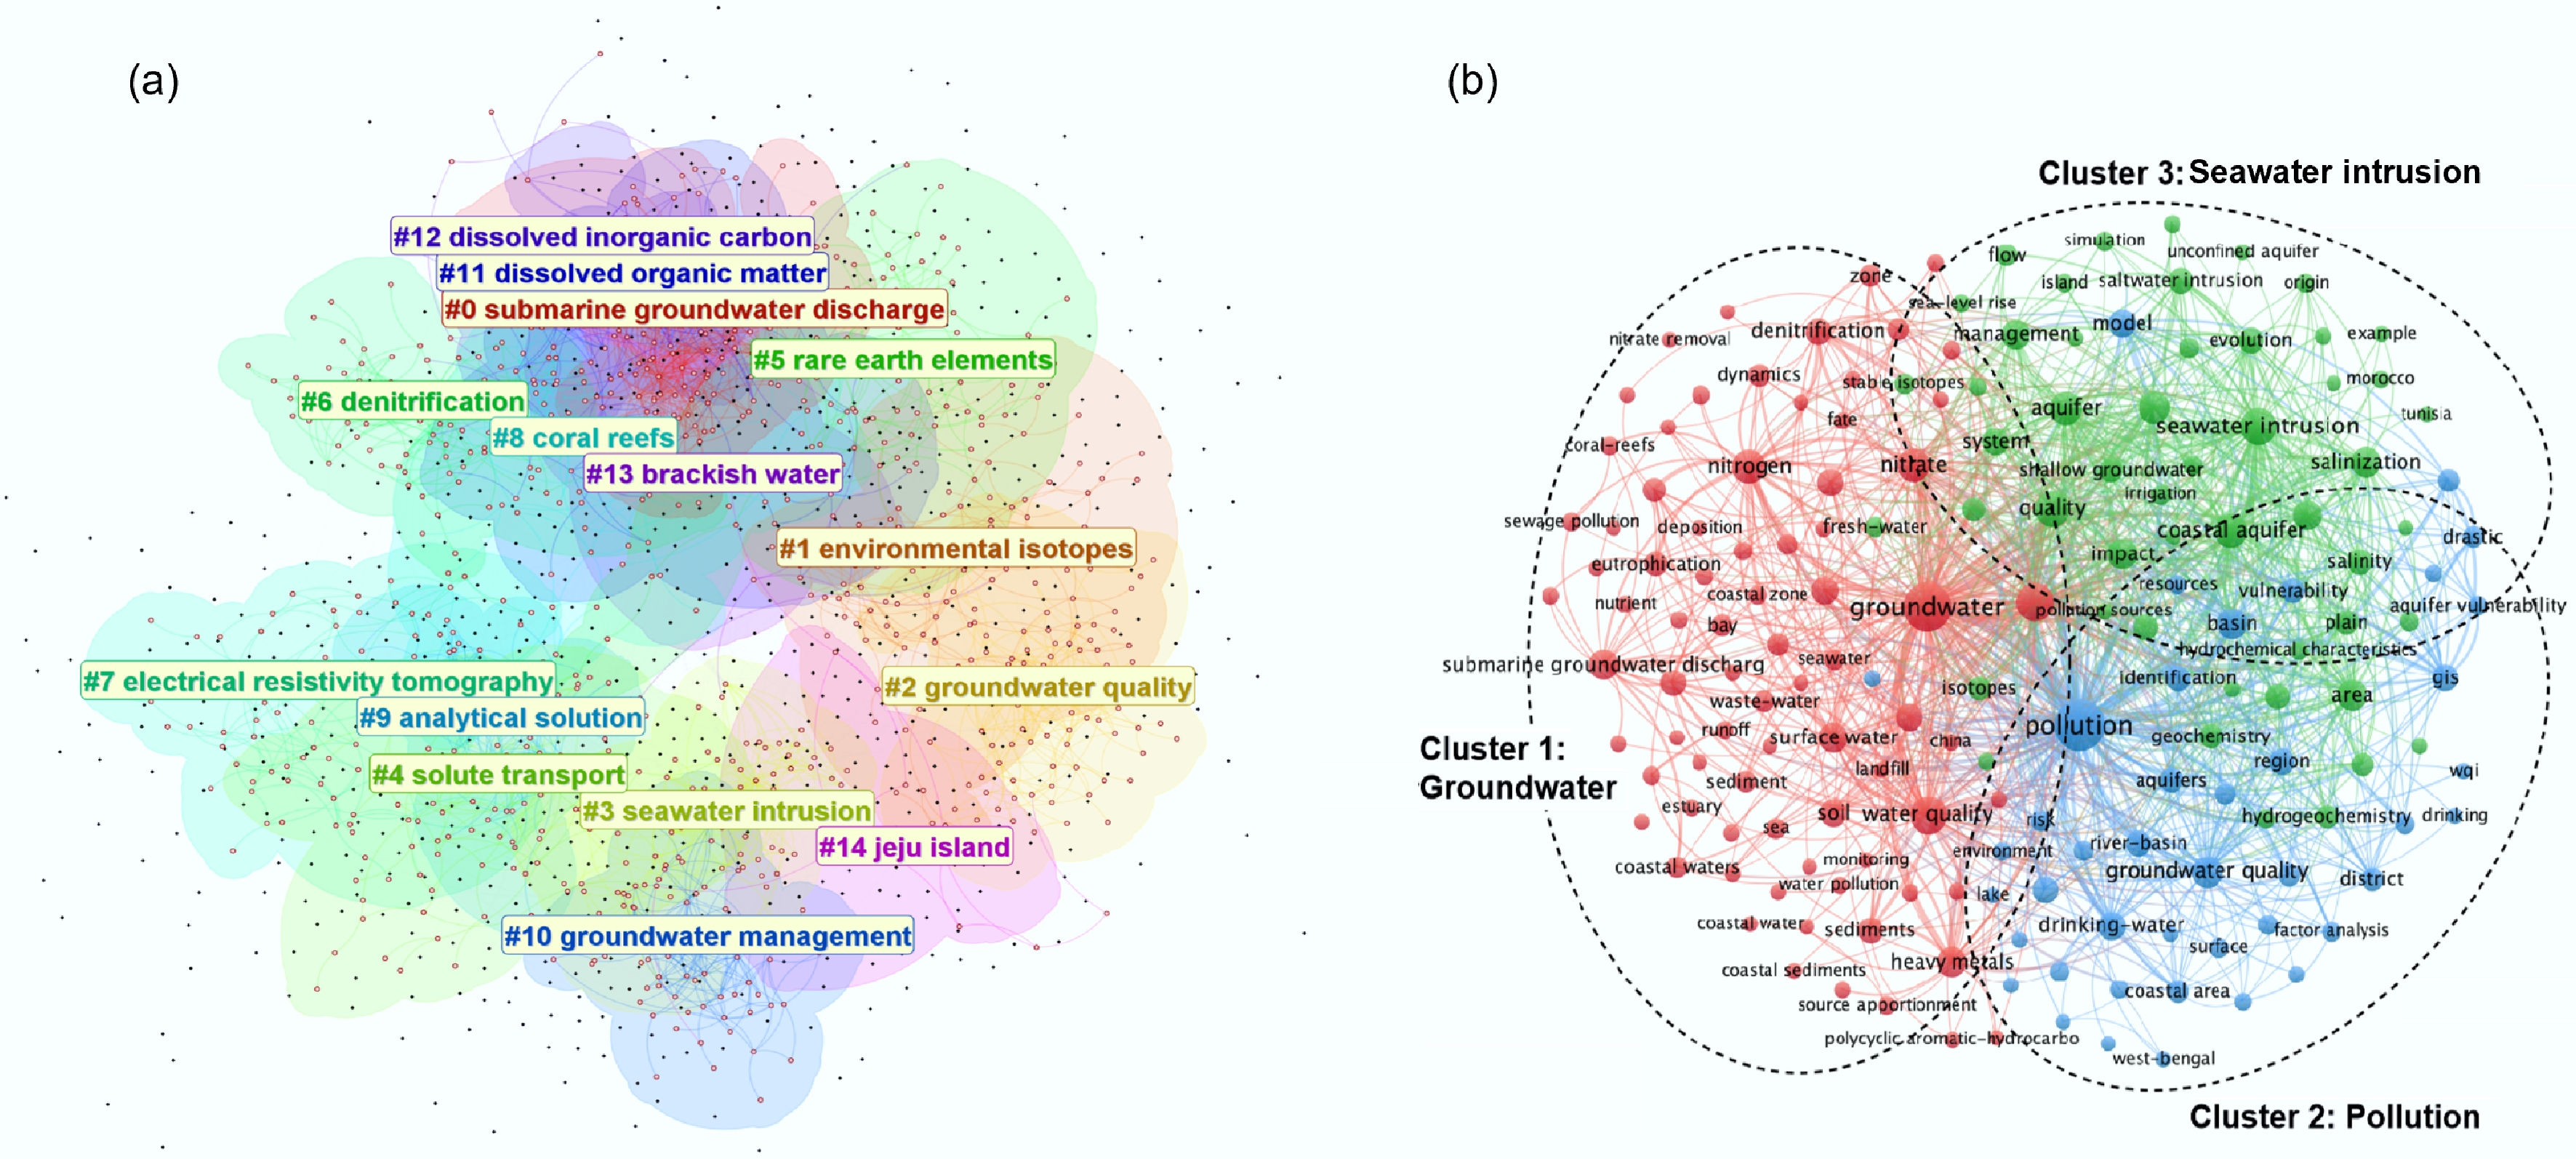
Figure 2.
Network visualization map generated (a) by CiteSpace based on the search terms of ('coastal aquifer*' OR 'subterranean estuar*' OR 'submarine groundwater discharge*' OR 'estuarine groundwater' OR 'freshwater-seawater interface' OR 'coastal groundwater' OR 'intertidal aquifer*' OR 'beach aquifer*' OR 'coastal mixing zone') AND ('emerging contaminant*' OR 'legacy pollutant*' OR 'heavy metal*' OR nutrient* OR nitrate* OR 'persistent organic pollutant*' OR pesticide* OR 'pharmaceutical*' OR antibiotic* OR 'microplastic*' OR 'PFAS*' OR 'perfluoroalkyl' OR 'antibiotic resistance gene*' OR ARG*) AND ('biogeochemical cycle*' OR redox OR 'sorption' OR 'desorption' OR 'microbial community' OR 'element cycling' OR carbon OR nitrogen OR phosphorus OR silicon), and (b) by VOSviewer based on the search terms of 'Land-ocean* or Land-sea* AND groundwater* AND pollutant*' from Web of Science Core Collection database. Different colors represent the specific clusters of extracted terms that were grouped by the software based on the items relations. Size and label represent the weight of keywords, and lines represent links between labels.
-
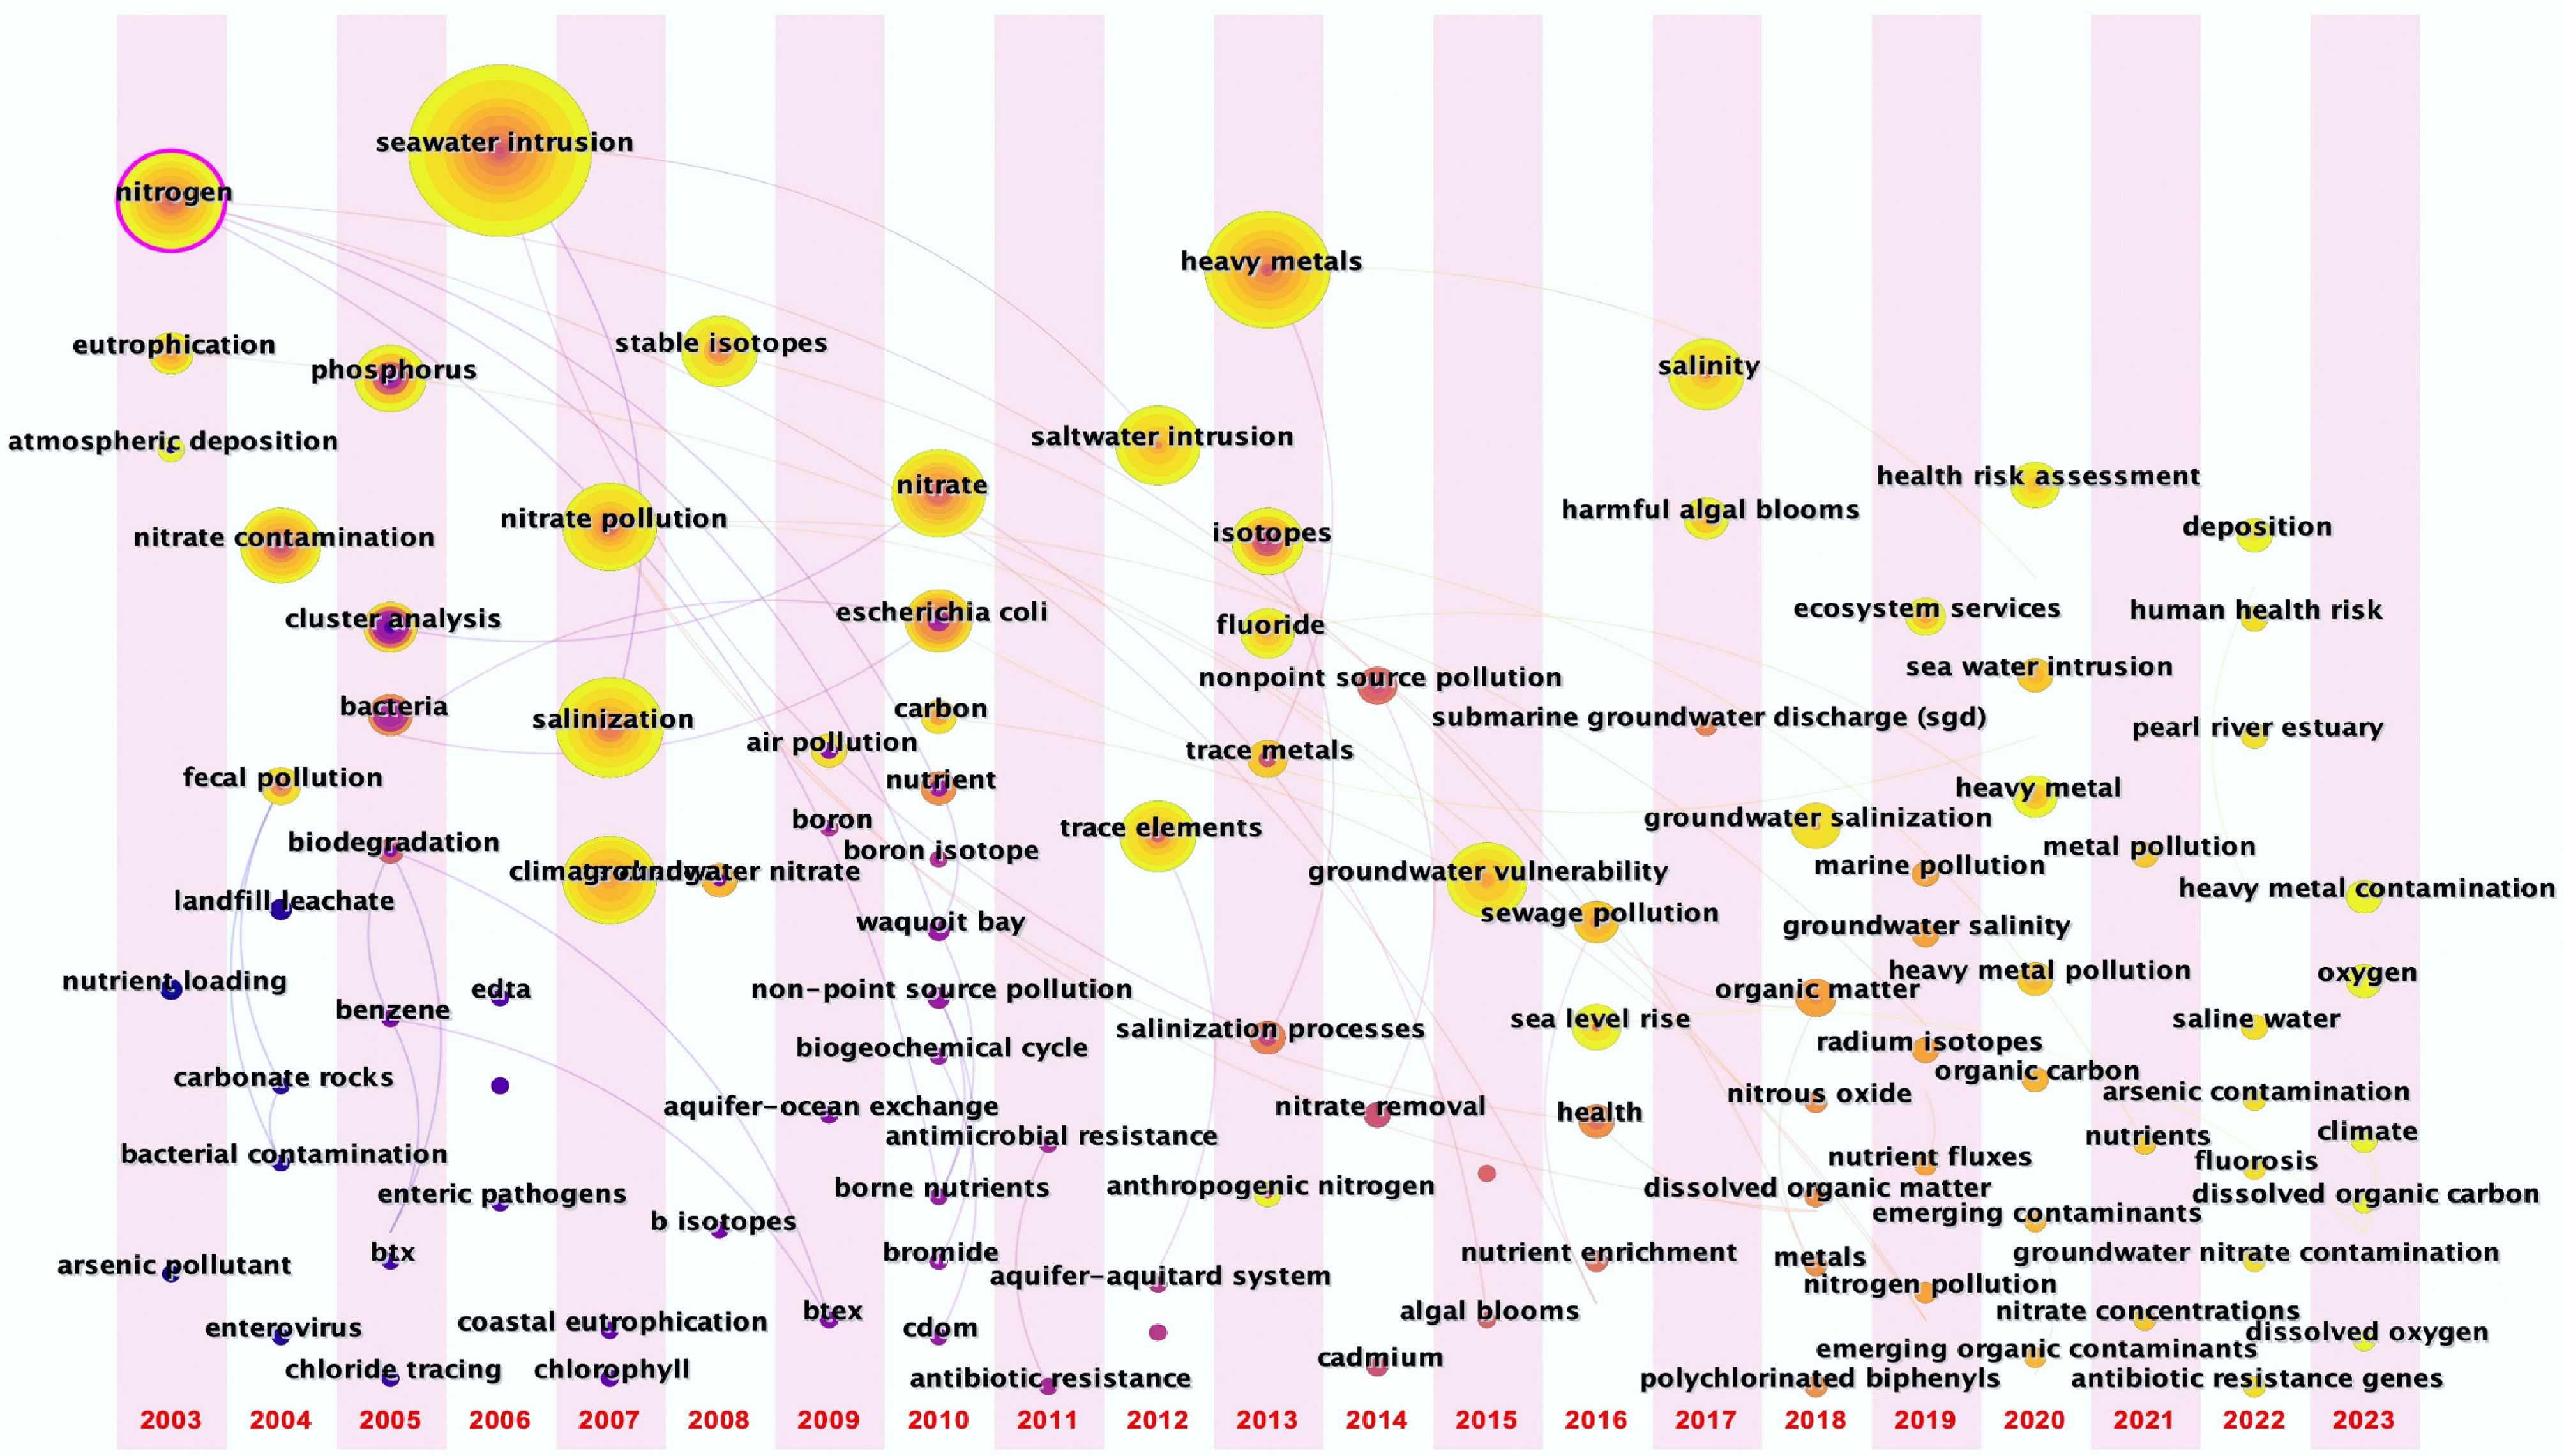
Figure 3.
Time-line view of keywords and noun-phases. The node size represents the co-occurrence frequency of keywords, the red characters are the clustering labels, the length of the horizontal line represents the duration of each clusters, and the top number is the end year of each time slice.
-
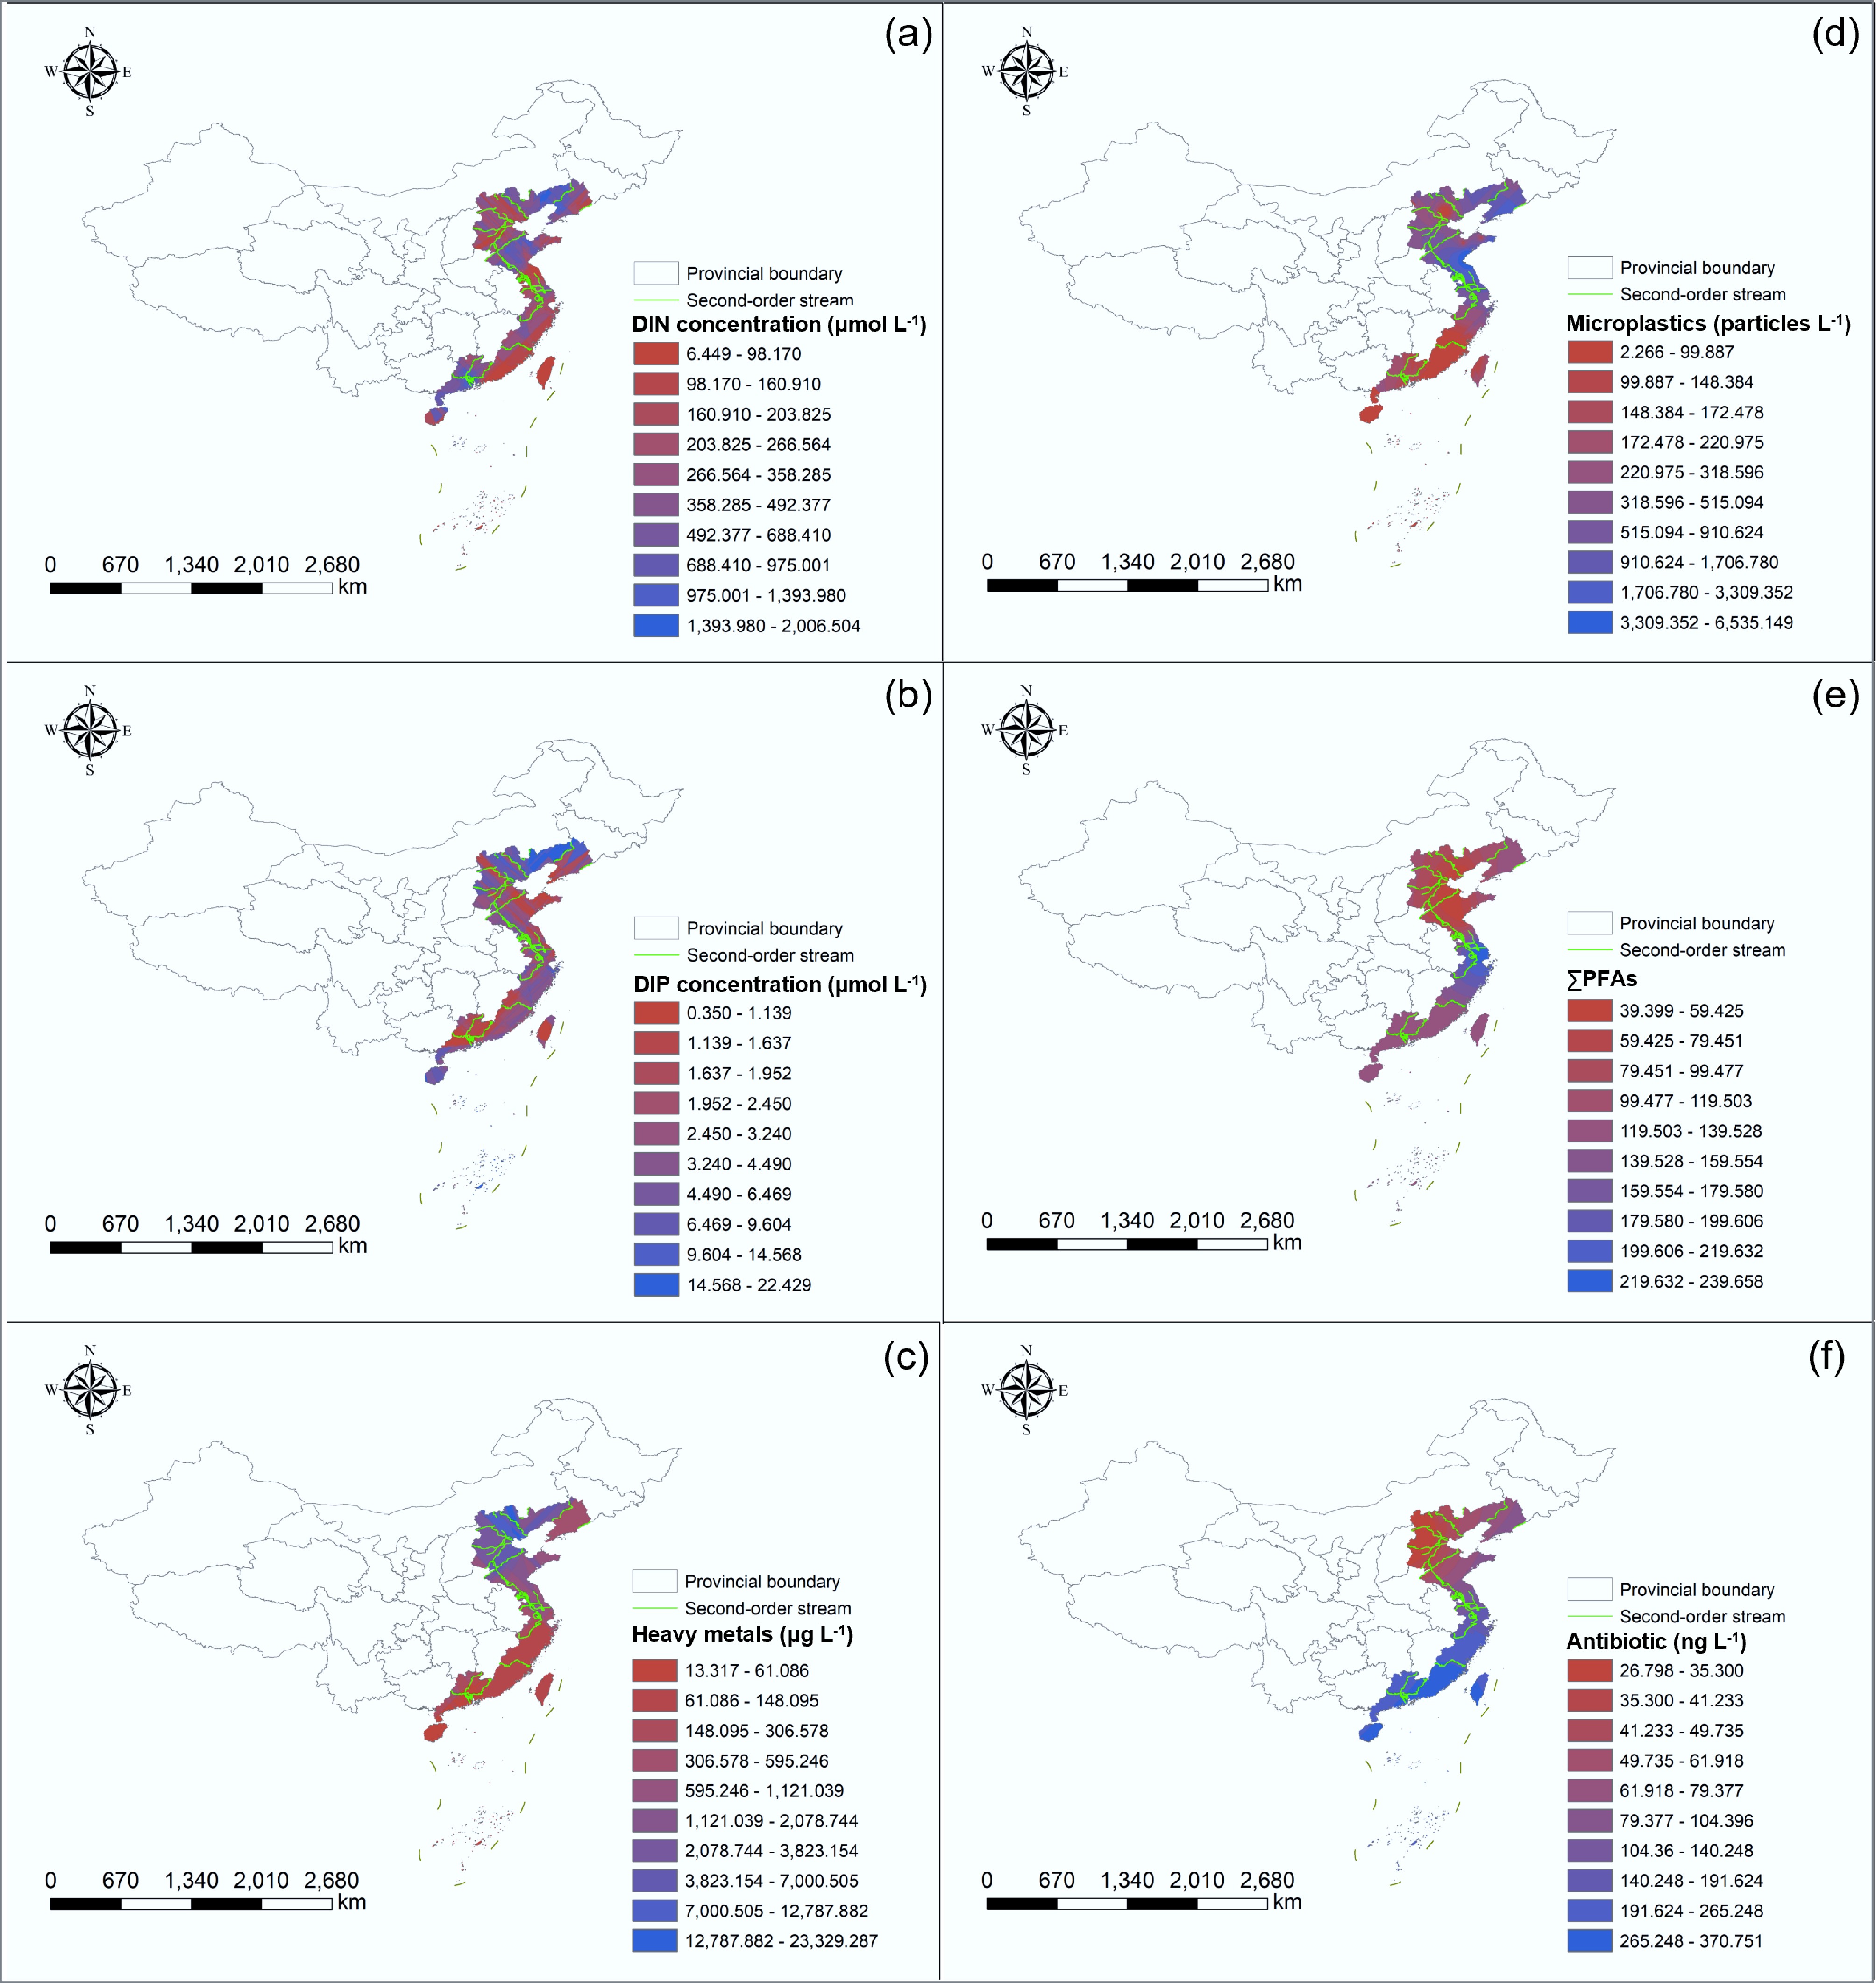
Figure 4.
Spatial distribution of contaminants in groundwater in coastal areas of China: (a) dissolved inorganic nitrogen (DIN), (b) dissolved inorganic phosphorus (DIP), (c) heavy metals, (d) microplastics, (e) per- and poly-fluoroalkyl substances (PFAS), and (f) antibiotics.
-
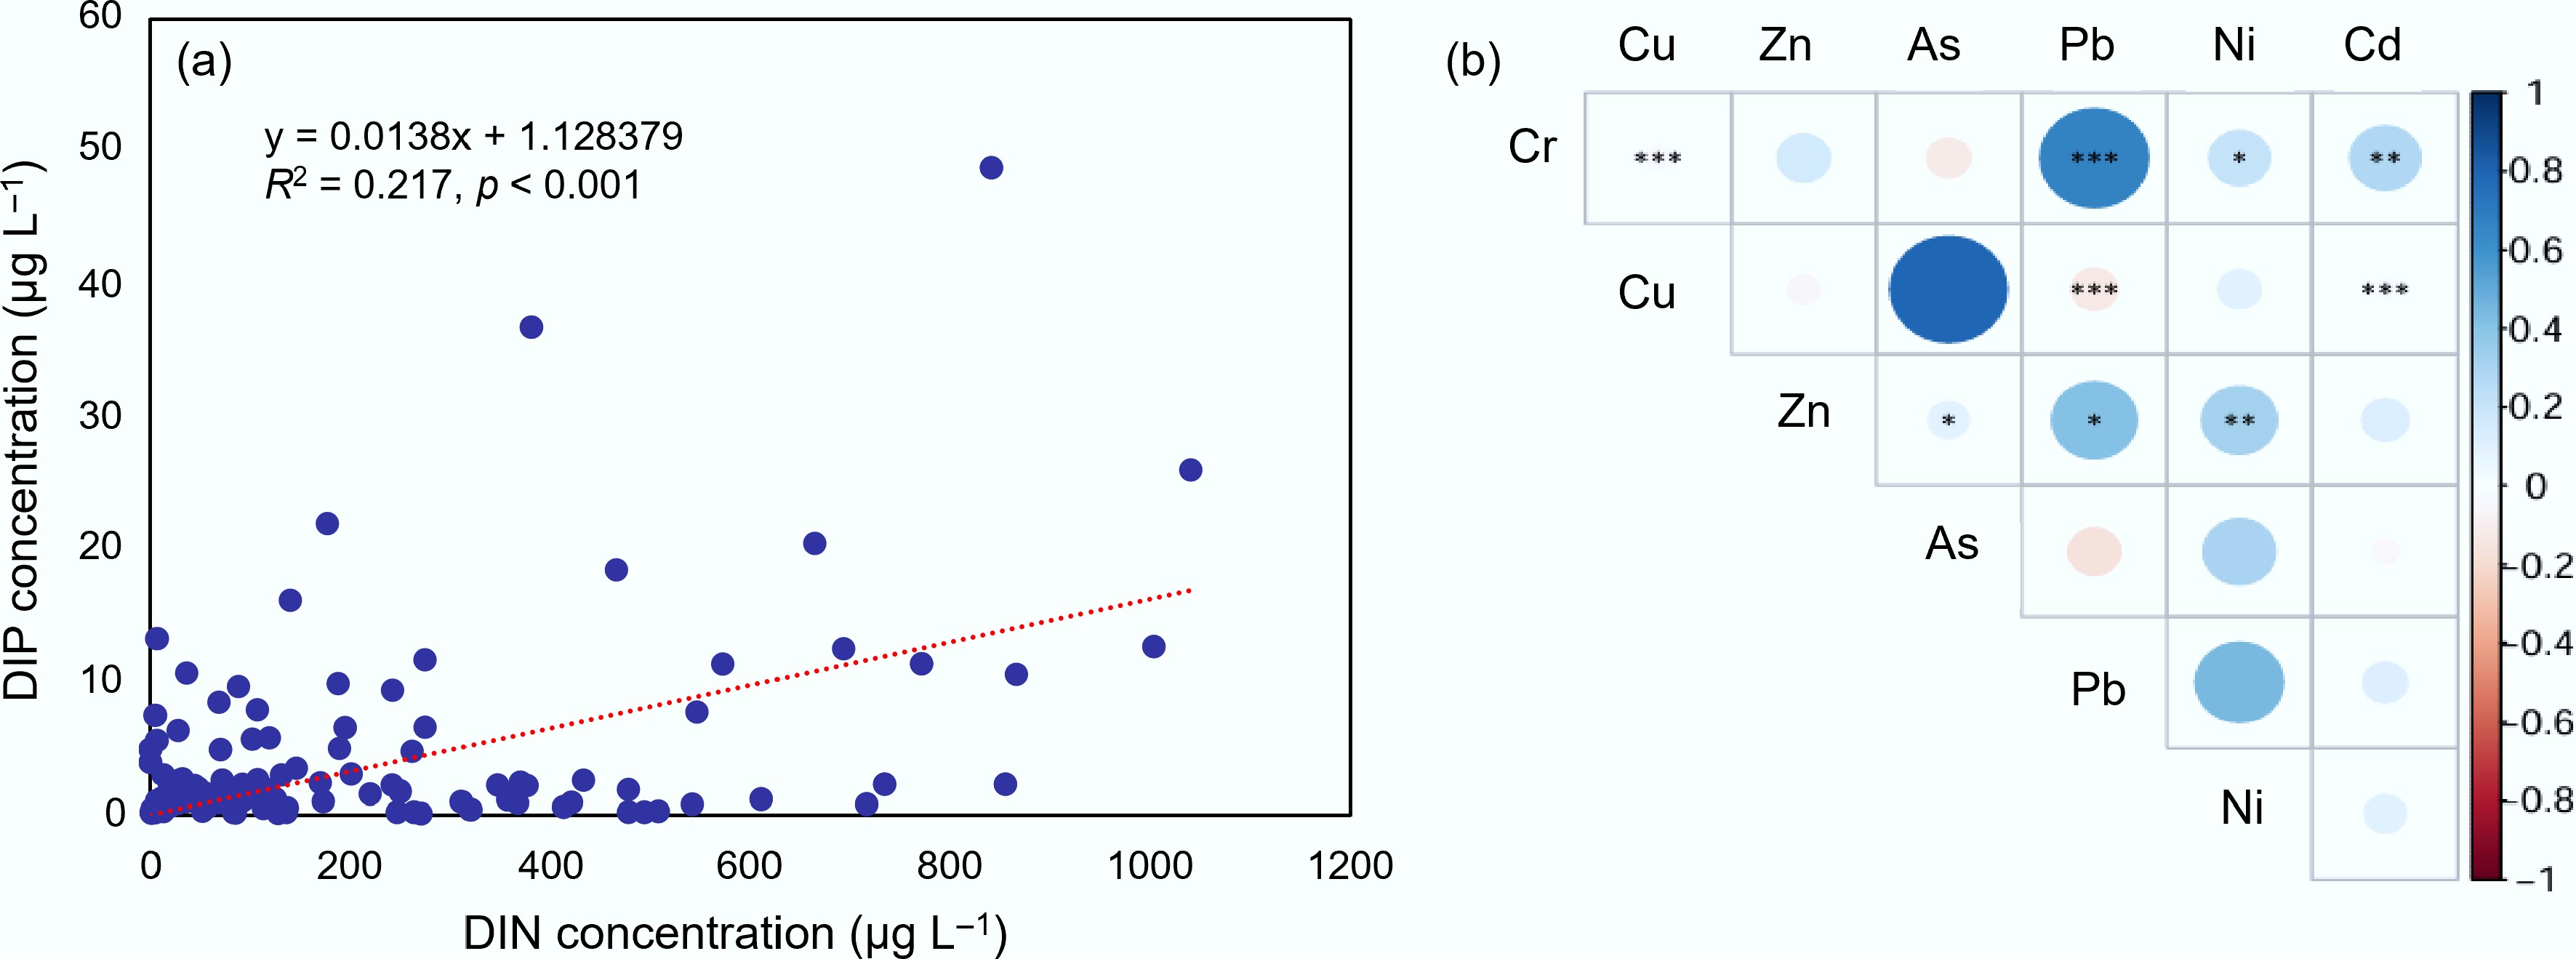
Figure 5.
(a) Relationships between the distributed concentrations of dissolved inorganic nitrogen (DIN) and dissolved inorganic phosphorus (DIP) within the reported 175 research sites, and (b) correlations among different heavy metals. *, **, and *** represent significant differences between different pollution conditions at p < 0.05, p < 0.01, and p < 0.001 level, respectively.
-
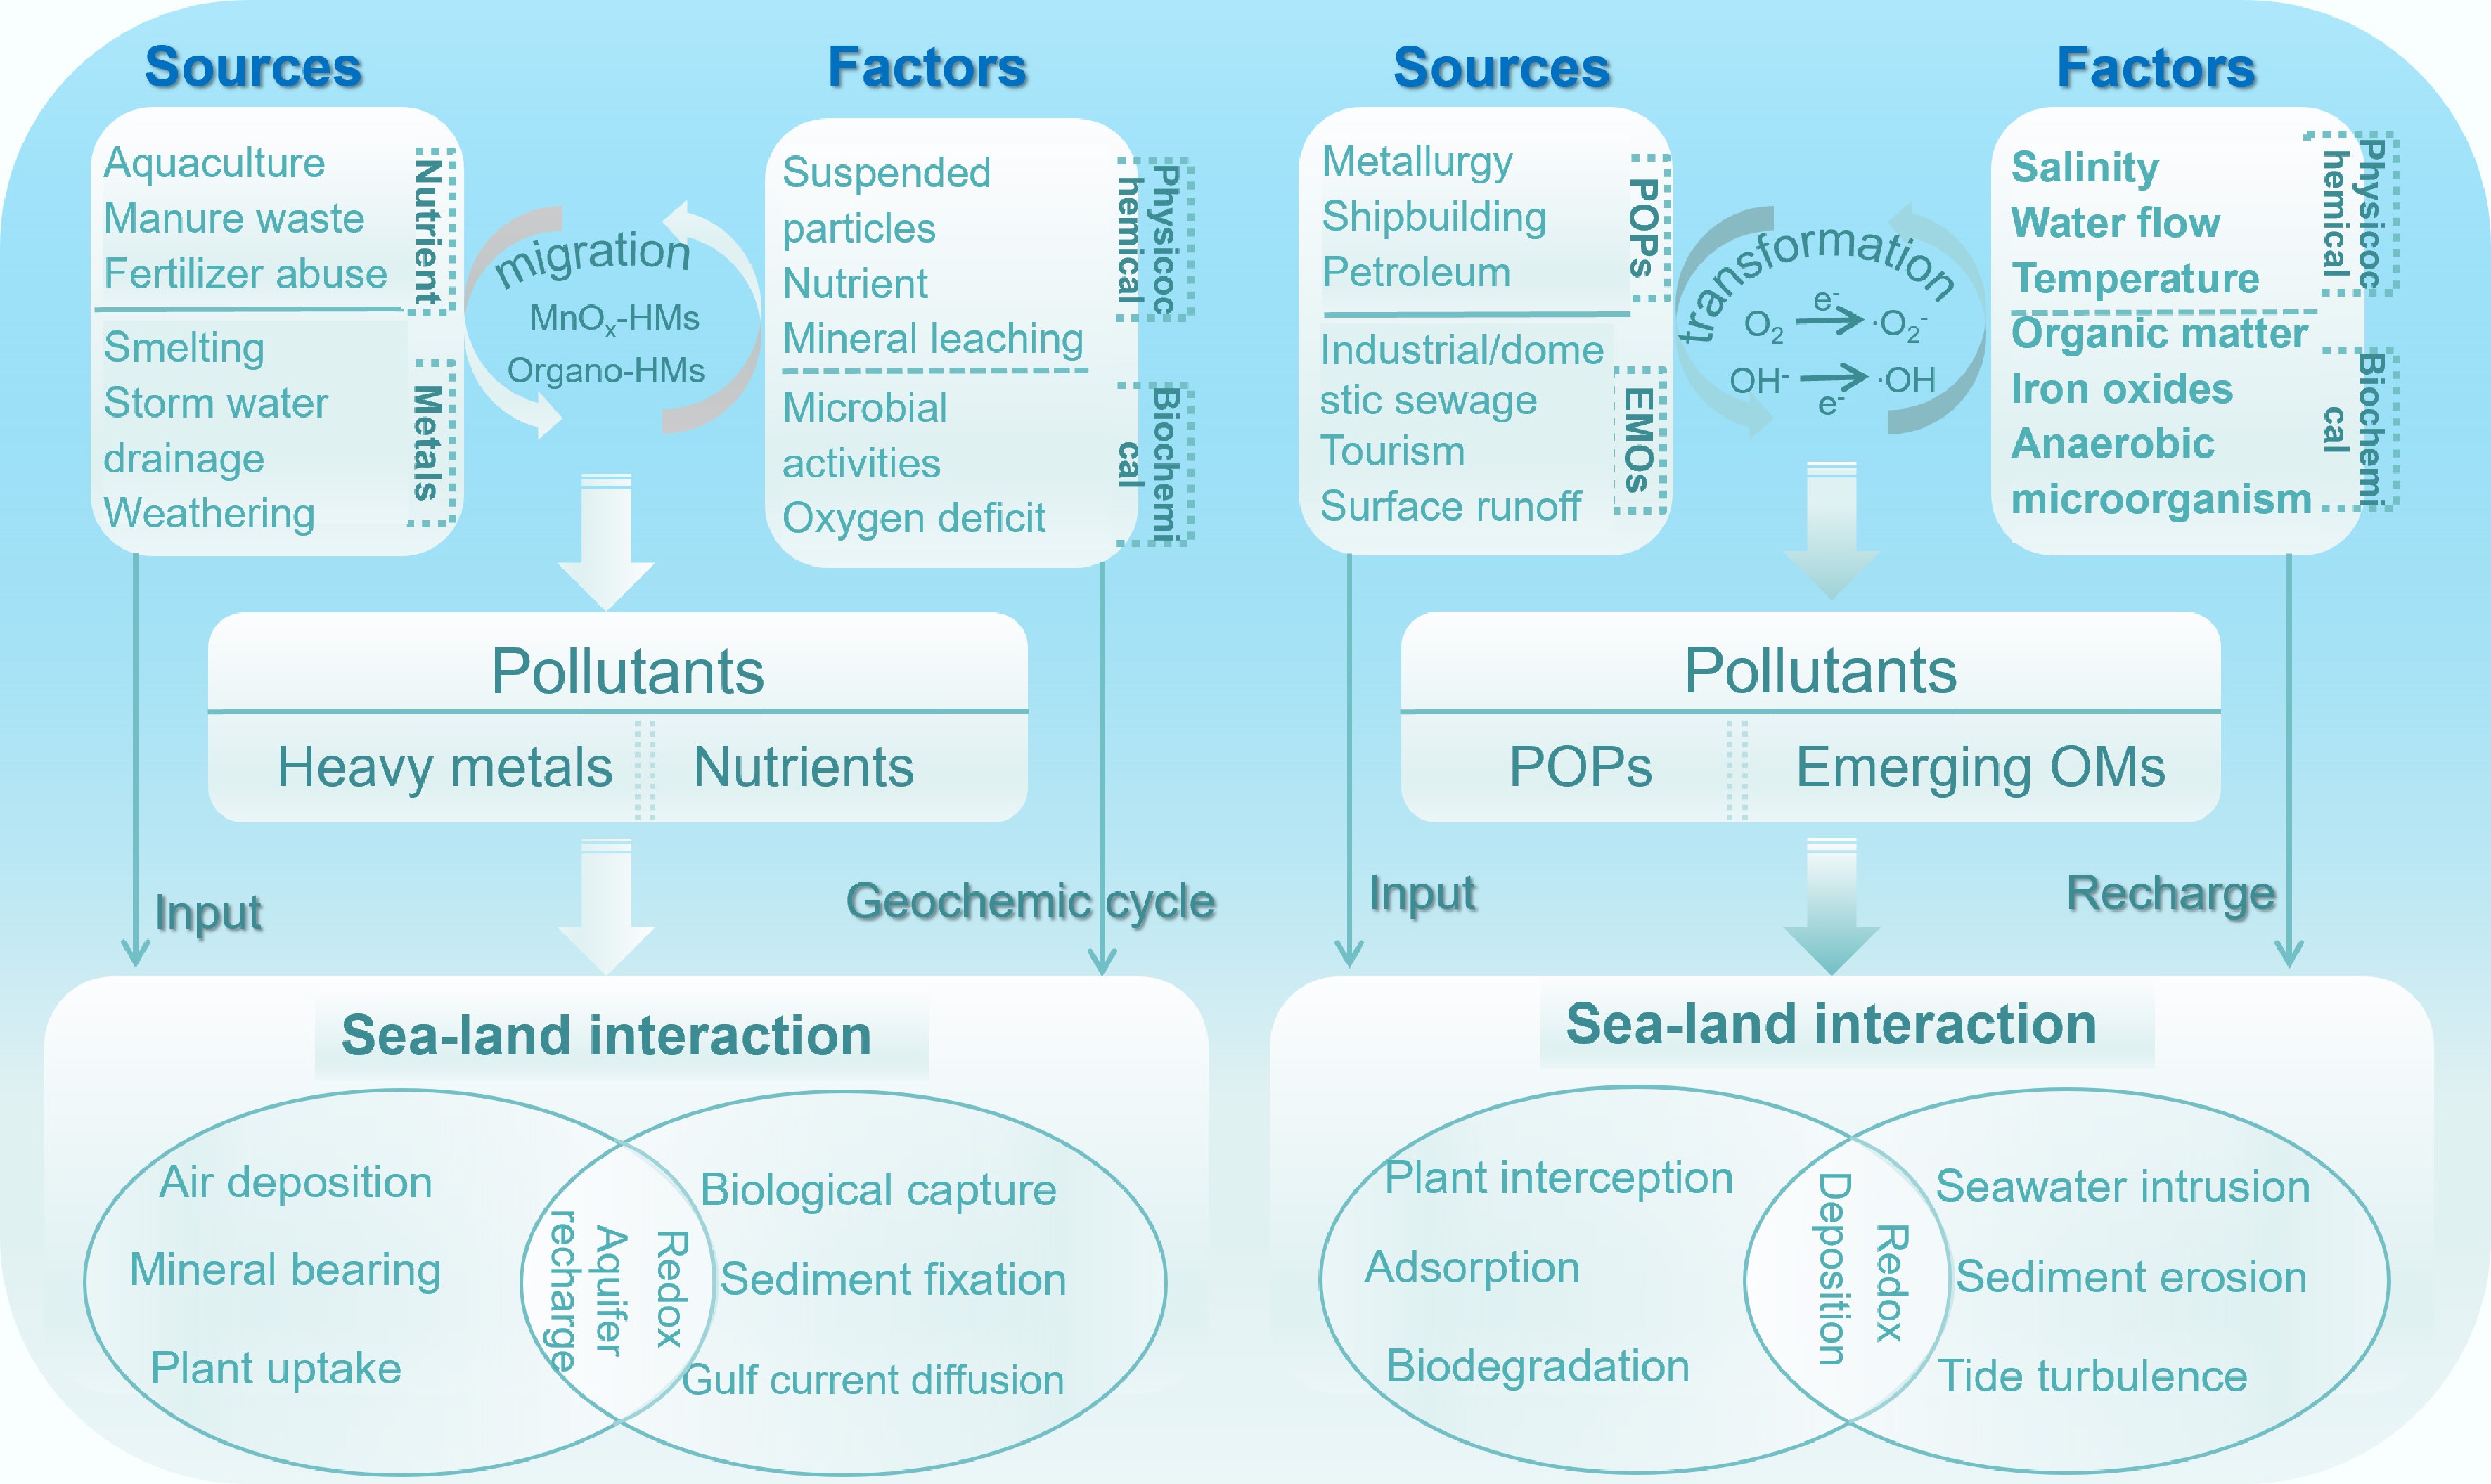
Figure 6.
Sources, drivers, and land–sea interactions governing legacy/emerging pollutant cycling in coastal margine interfaces (CMIs). Left (heavy metals, nutrients): HMs migrate as Mn oxide/organic-ligand complexes; nutrient overloading (aquaculture/manure) induces HM-sediment sorption competition (modifying bioavailability). CMI redox dynamics mediate HM transformation; biotic capture (plants, benthos) links biological uptake to geochemical cycling. Right (organic pollutants): ROS (superoxide, OH) drive POP/emerging OM oxidative transformation (regulating toxicity/persistence). Salinity/microbiota control OM sorption/anaerobic biodegradation. Seawater intrusion/tidal turbulence resuspend sediment-bound organics, while plant interception enables rhizosphere co-metabolic OM degradation.
-
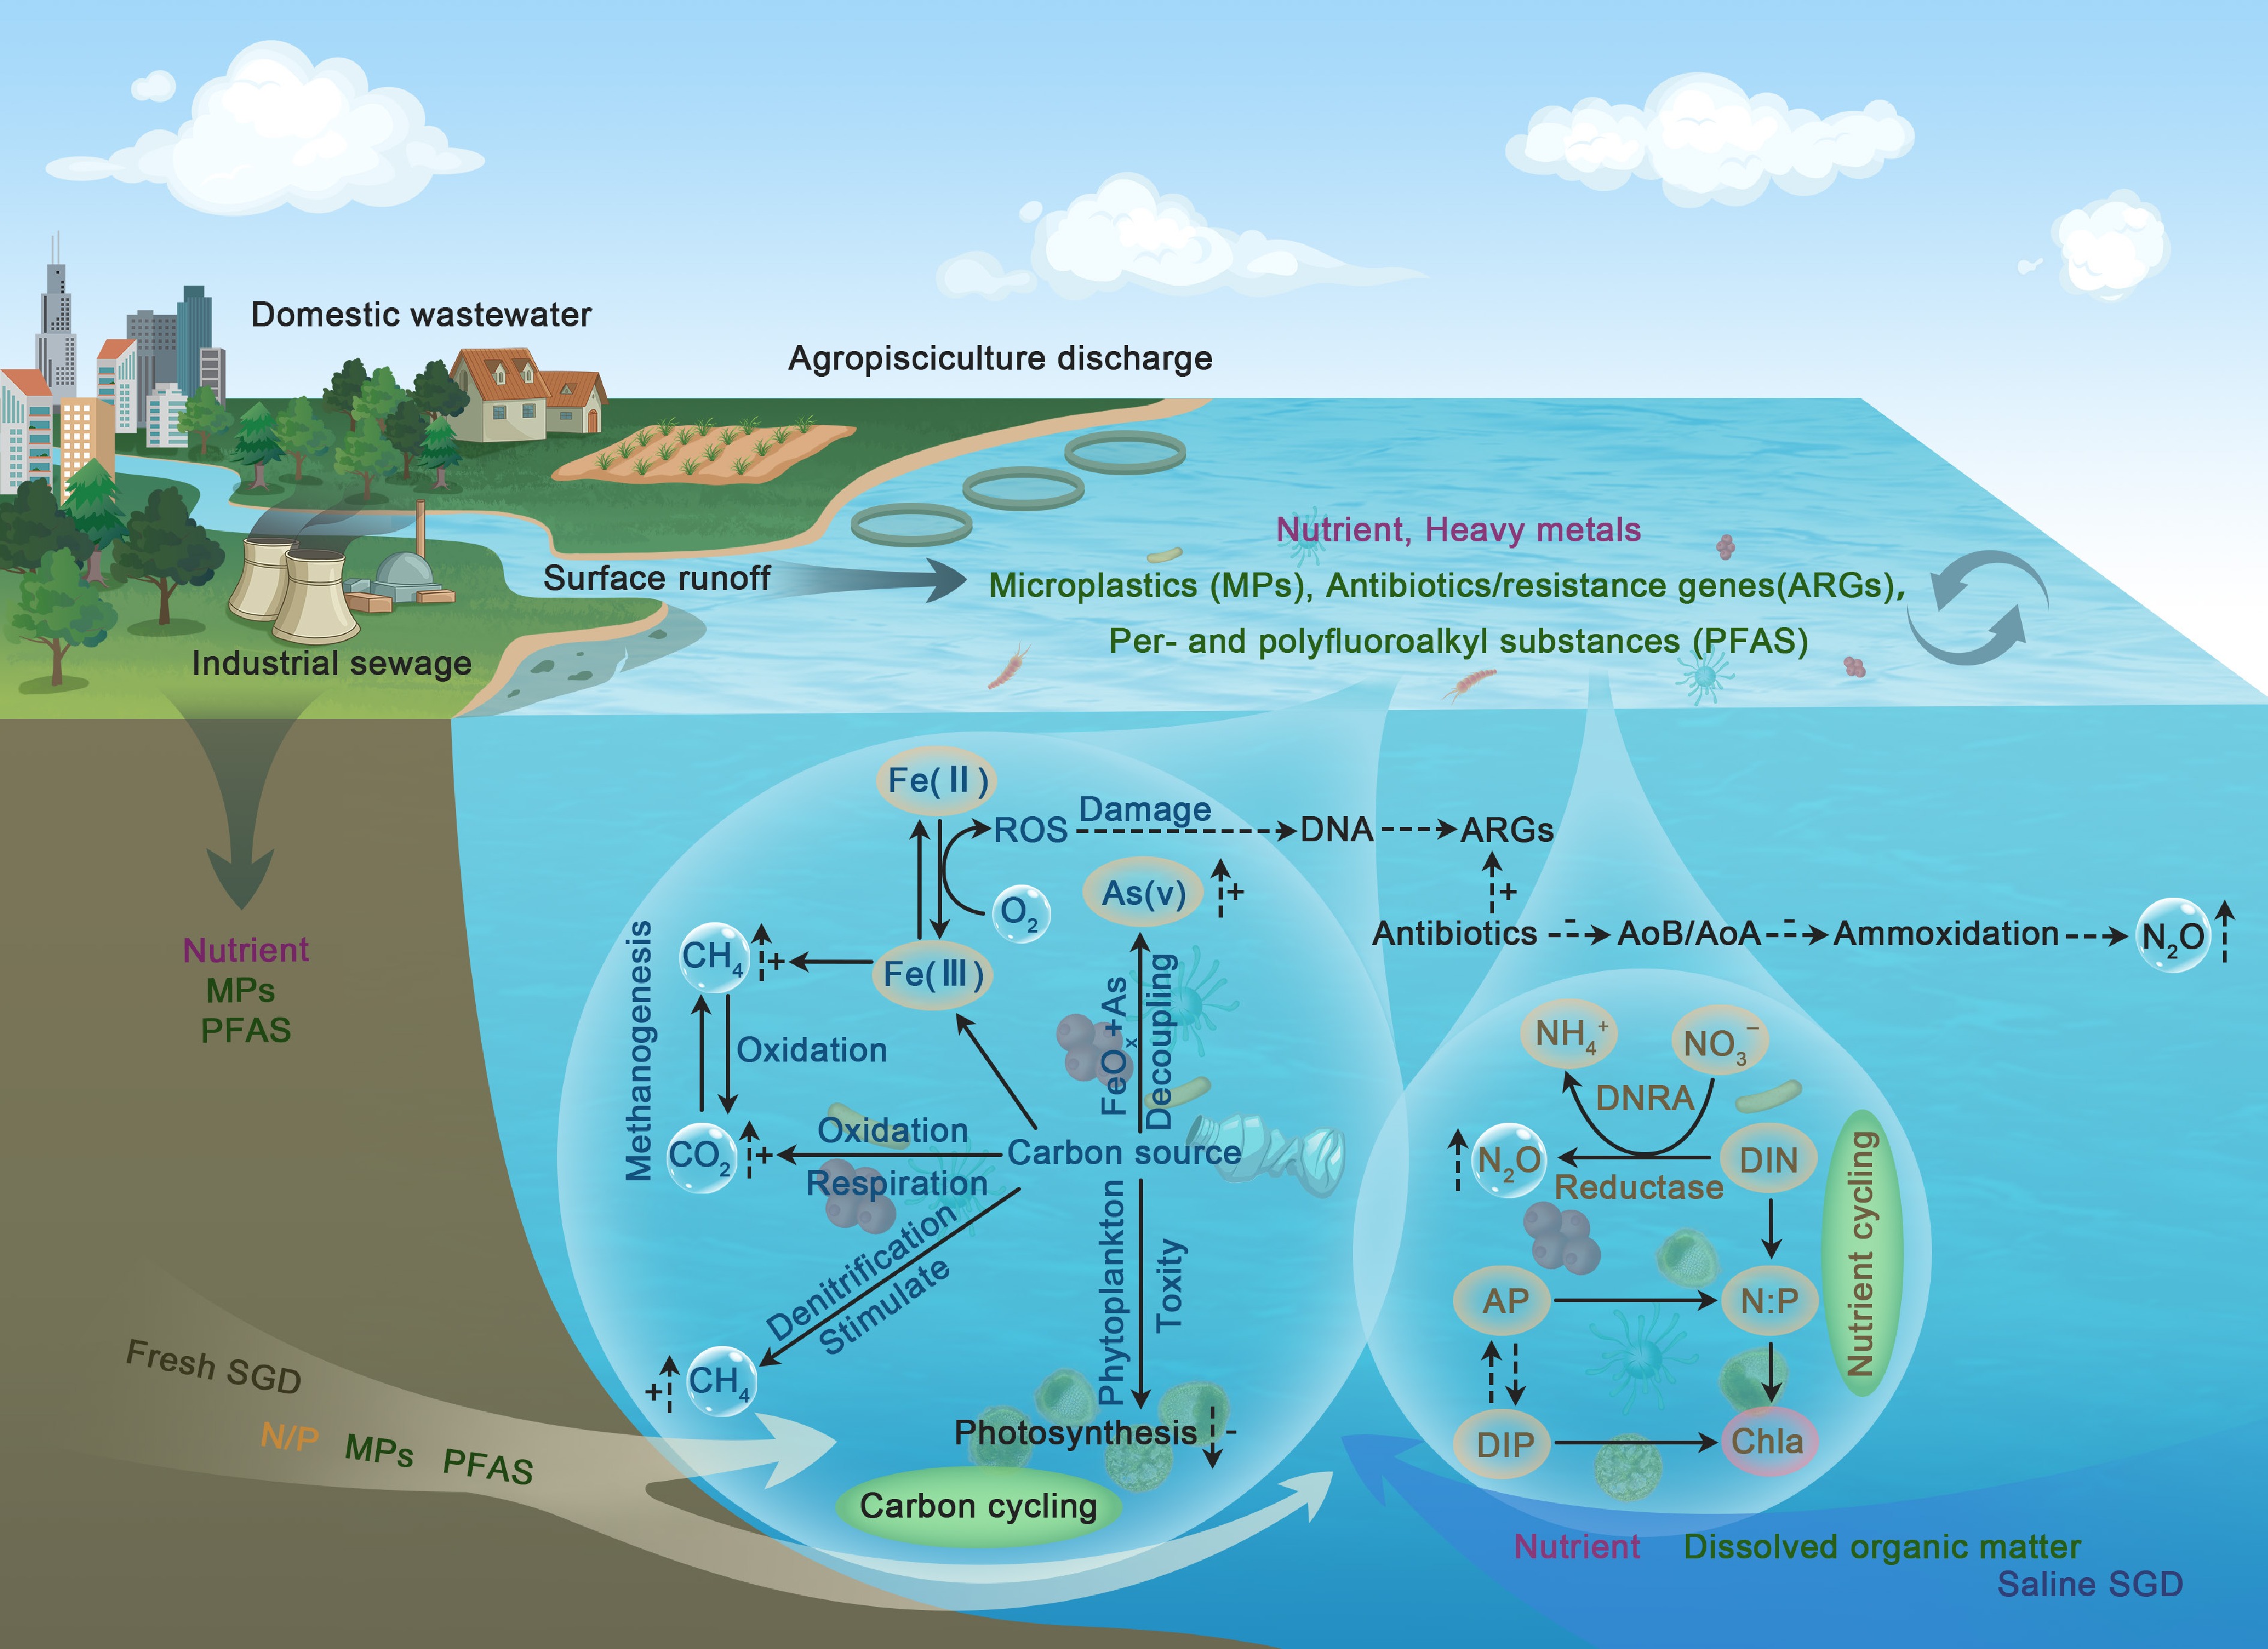
Figure 7.
Pollutant-driven perturbations to biogeochemical cycles in coastal-marine interfaces (CMIs): Conceptual framework linking emerging (ECs) and legacy contaminants (LCs). Terrestrial sources deliver co-contaminants to coastal waters, with fresh/saline submarine groundwater discharge (SGD) being a key land-sea vector for cross-medium transport. Iron (Fe) redox cycling mediates reactive oxygen species (ROS) production: Fe(II)-O2-derived ROS drive ARG proliferation (DNA damage) and As mobilization. Pollutants stimulate microbial methanogenesis/denitrification but inhibit phytoplankton photosynthesis, disrupting carbon cycling via biotic-abiotic stress coupling. Antibiotics suppress ammonia-oxidizing microbes (AOB/AOA), shifting nitrogen metabolism toward N2O-producing ammoxidation and nutrient-retaining DNRA. Alkaline phosphatase (AP)/chlorophyll a (Chla) tracks pollutant-driven N : P imbalance, regulating DIN/DIP cycling via pollutant-nutrient co-limitation.
Figures
(7)
Tables
(0)