-
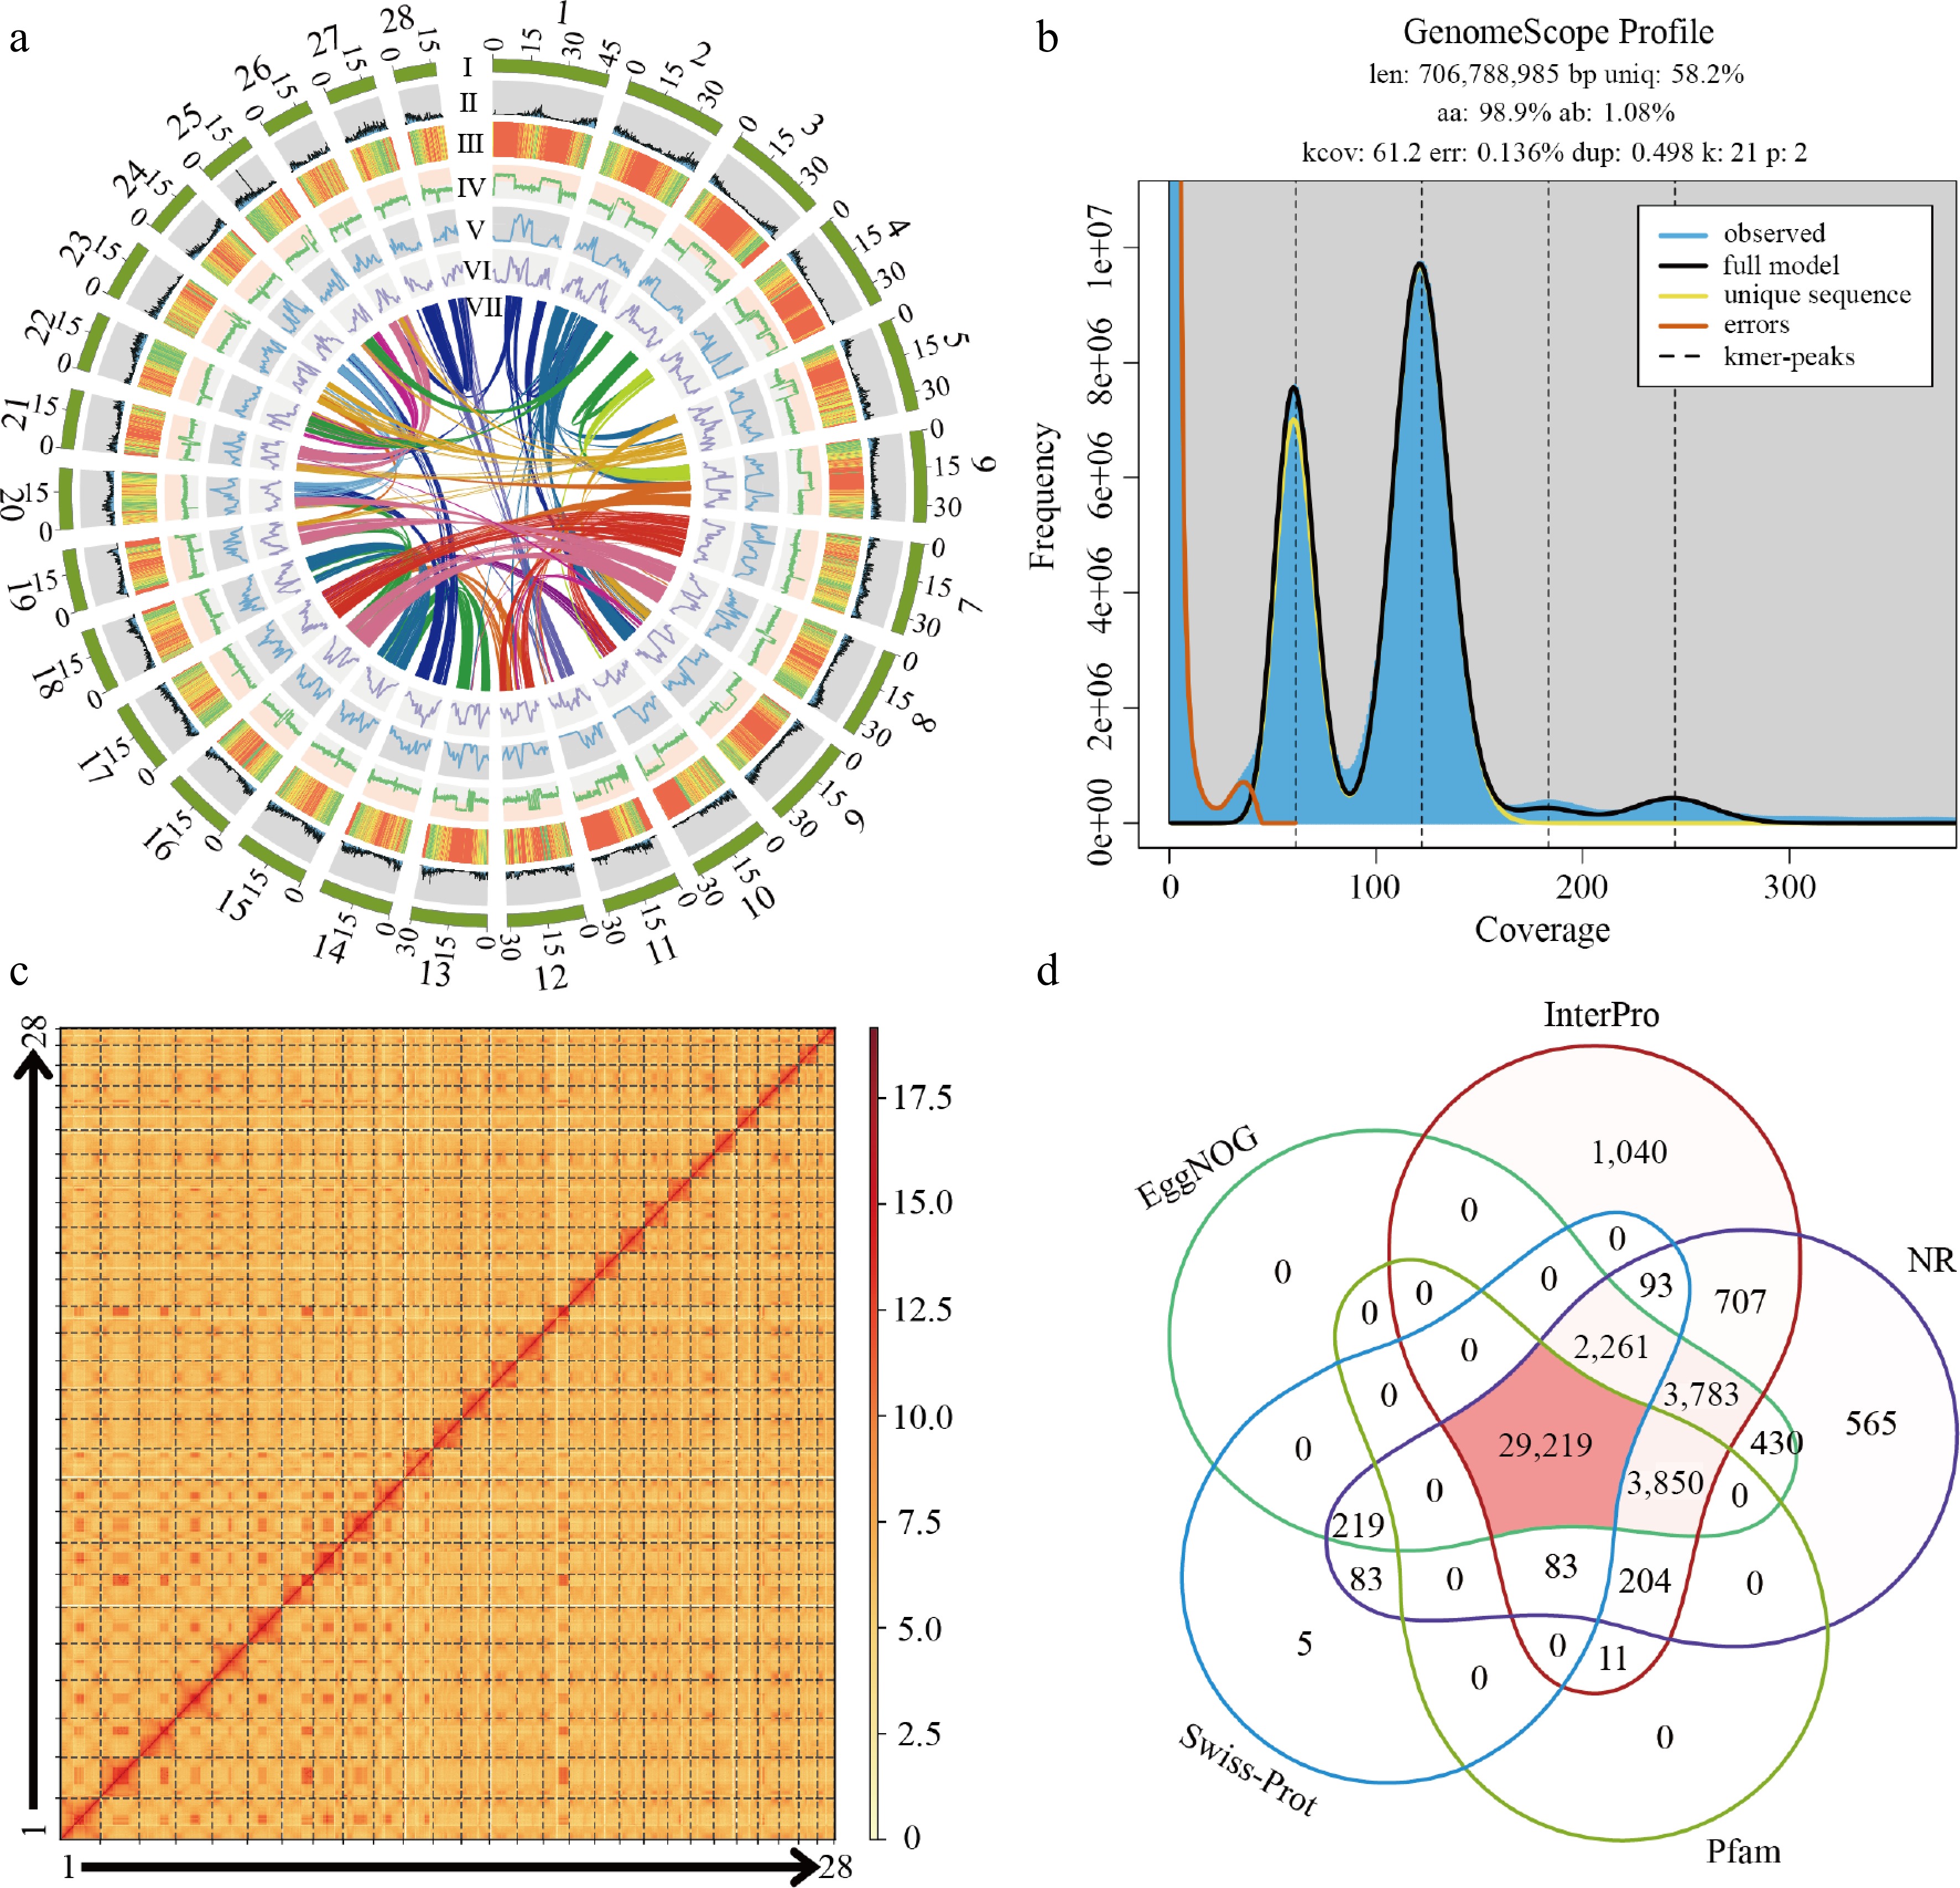
Figure 1.
The genome of D. zibethinus cv. Chuongbo. (a) Circos plot showing the genome details. Labels I−VII indicate: (I) 28 chromosomes of D. zibethinus; (II) gene density; (III) repeat sequence content; (IV) GC content density; (V) density of Copia LTR-RTs; (VI) density of Gypsy LTR-RTs; (VII) syntenic blocks (all window sizes = 50 kb). (b) Distribution profiles of 21-mer analysis of short reads. (c) Hi-C heatmap of D. zibethinus cv. Chuongbo. (d) Venn diagram of function annotations from various databases.
-
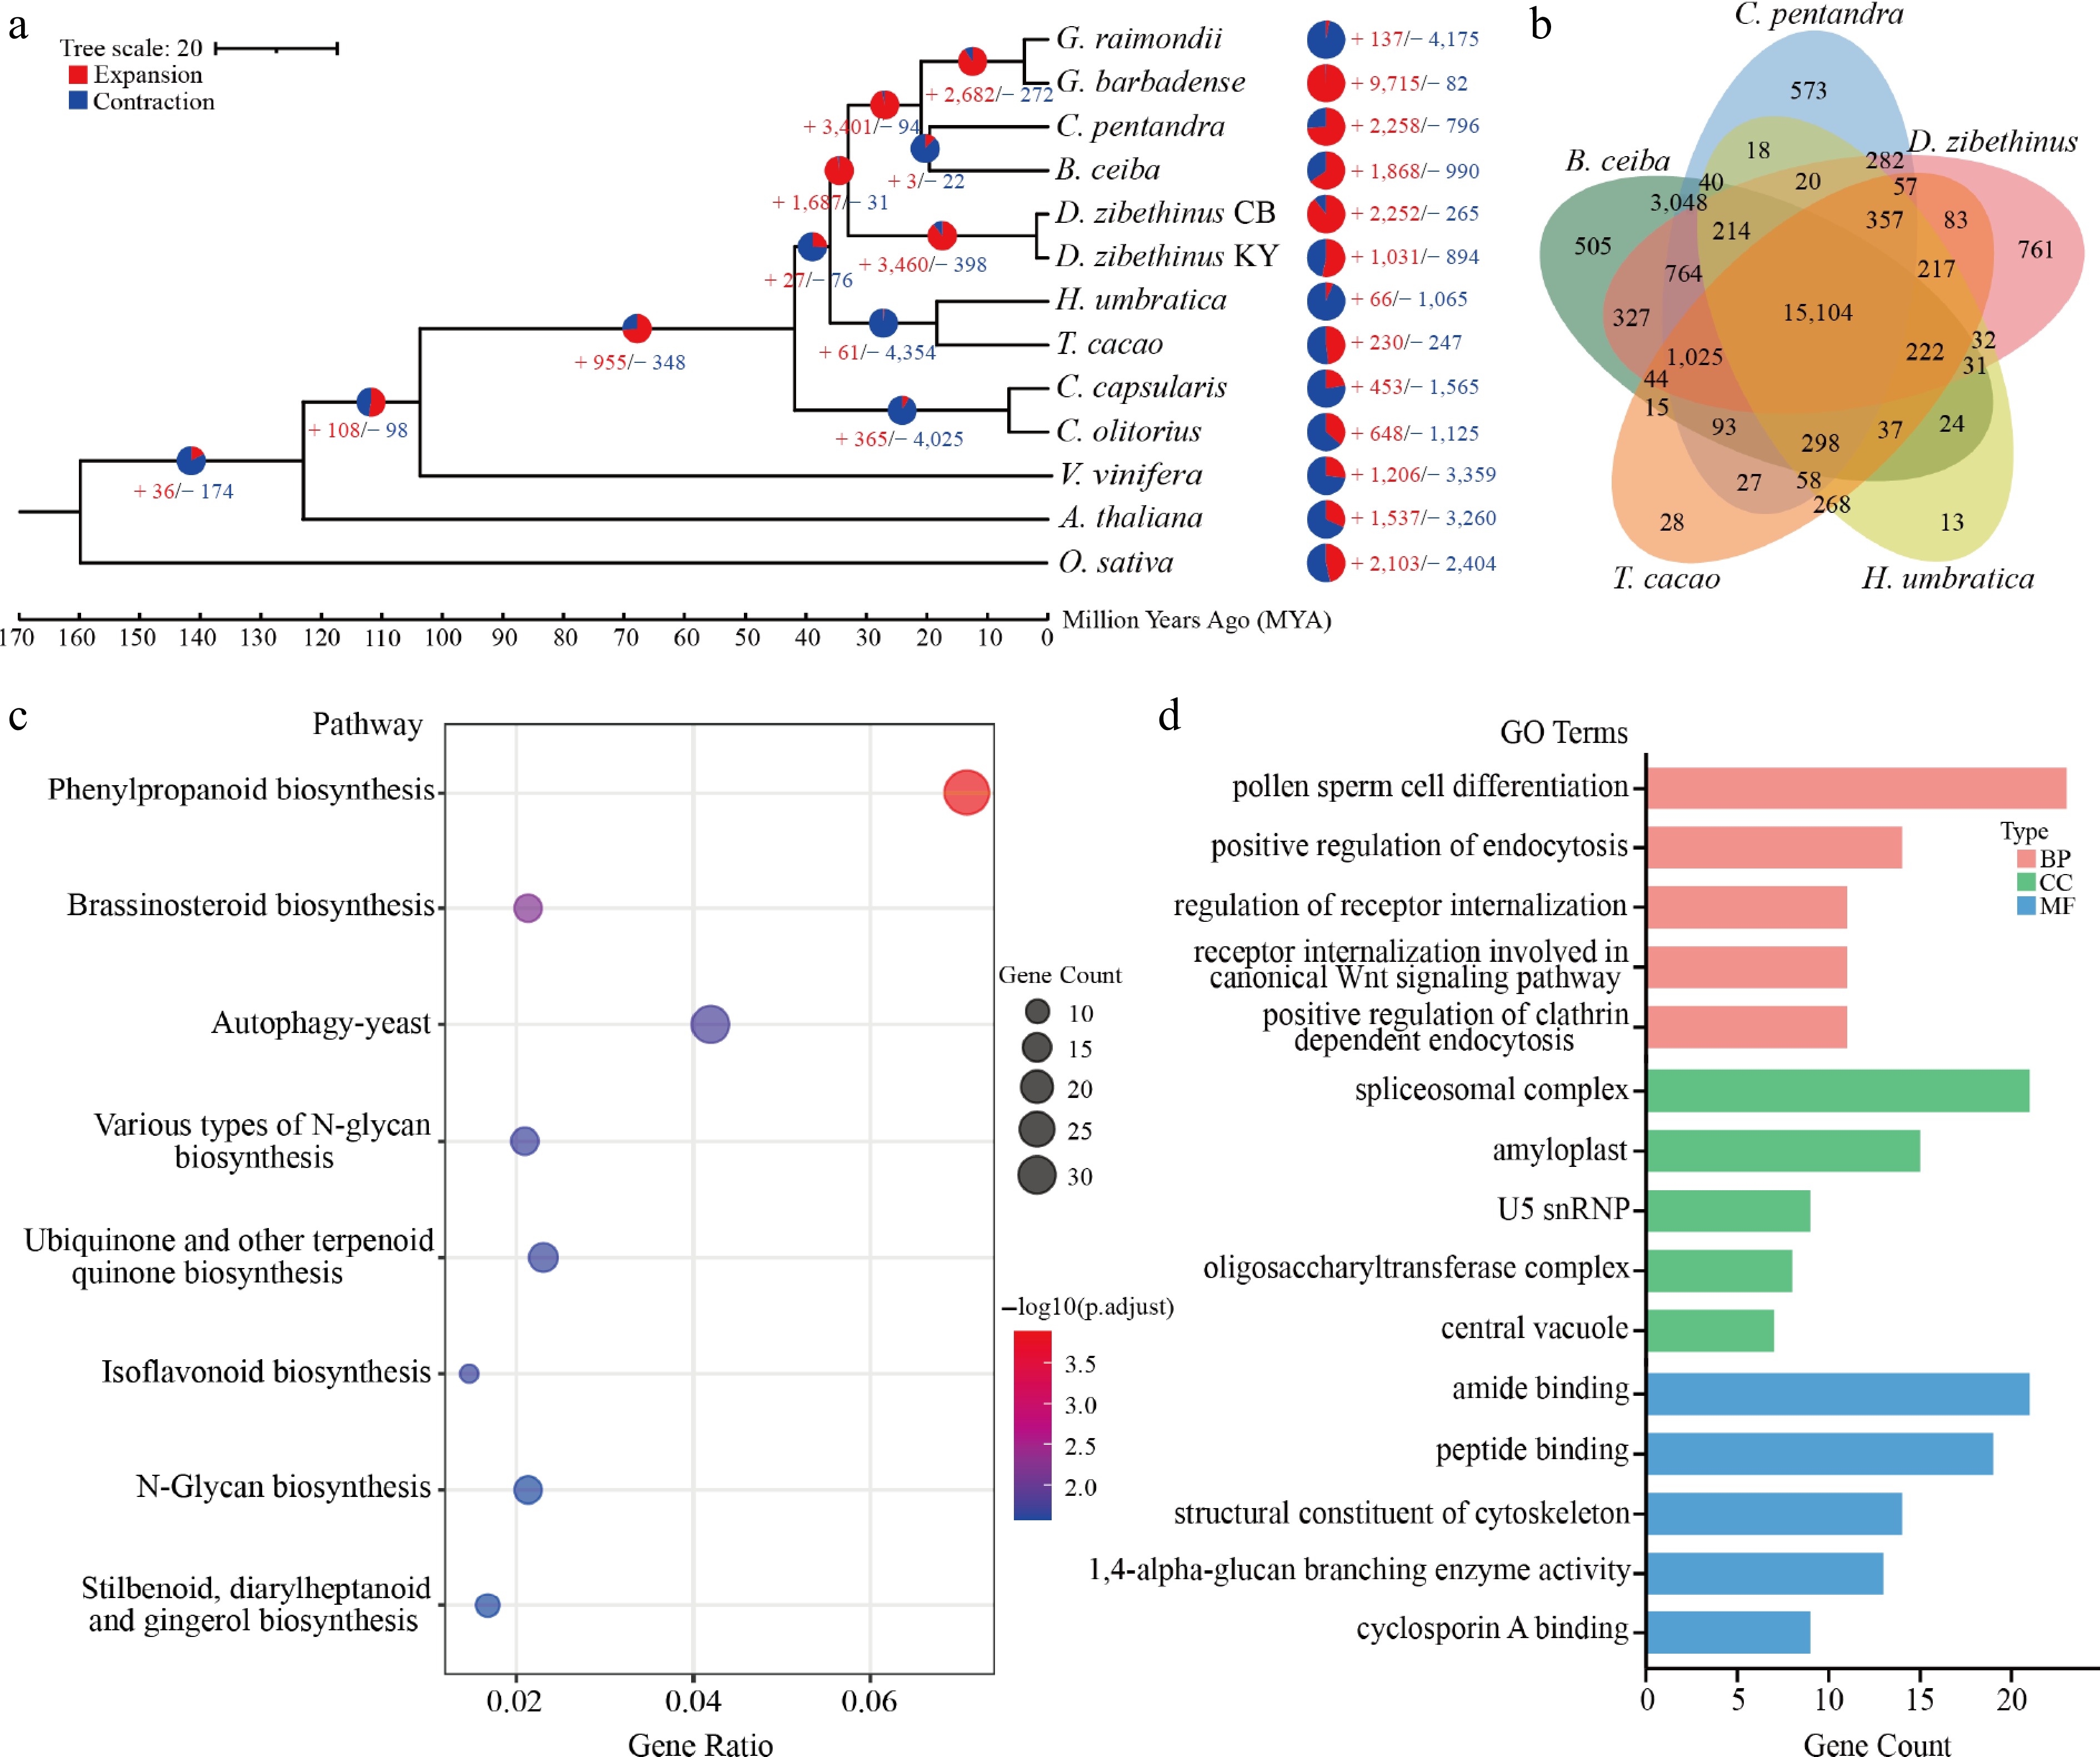
Figure 2.
Comparative genomic analysis of D. zibethinus cv. Chuongbo. (a) Expansion and loss of gene orthogroups leading to D. zibethinus cv. Chuongbo (CB). (b) Venn diagram showing orthogroups shared by D. zibethinus cv. Chuongbo and related genomes. (c) KEGG analysis of unigenes in D. zibethinus cv. Chuongbo. (d) GO analysis of unigenes in D. zibethinus cv. Chuongbo.
-
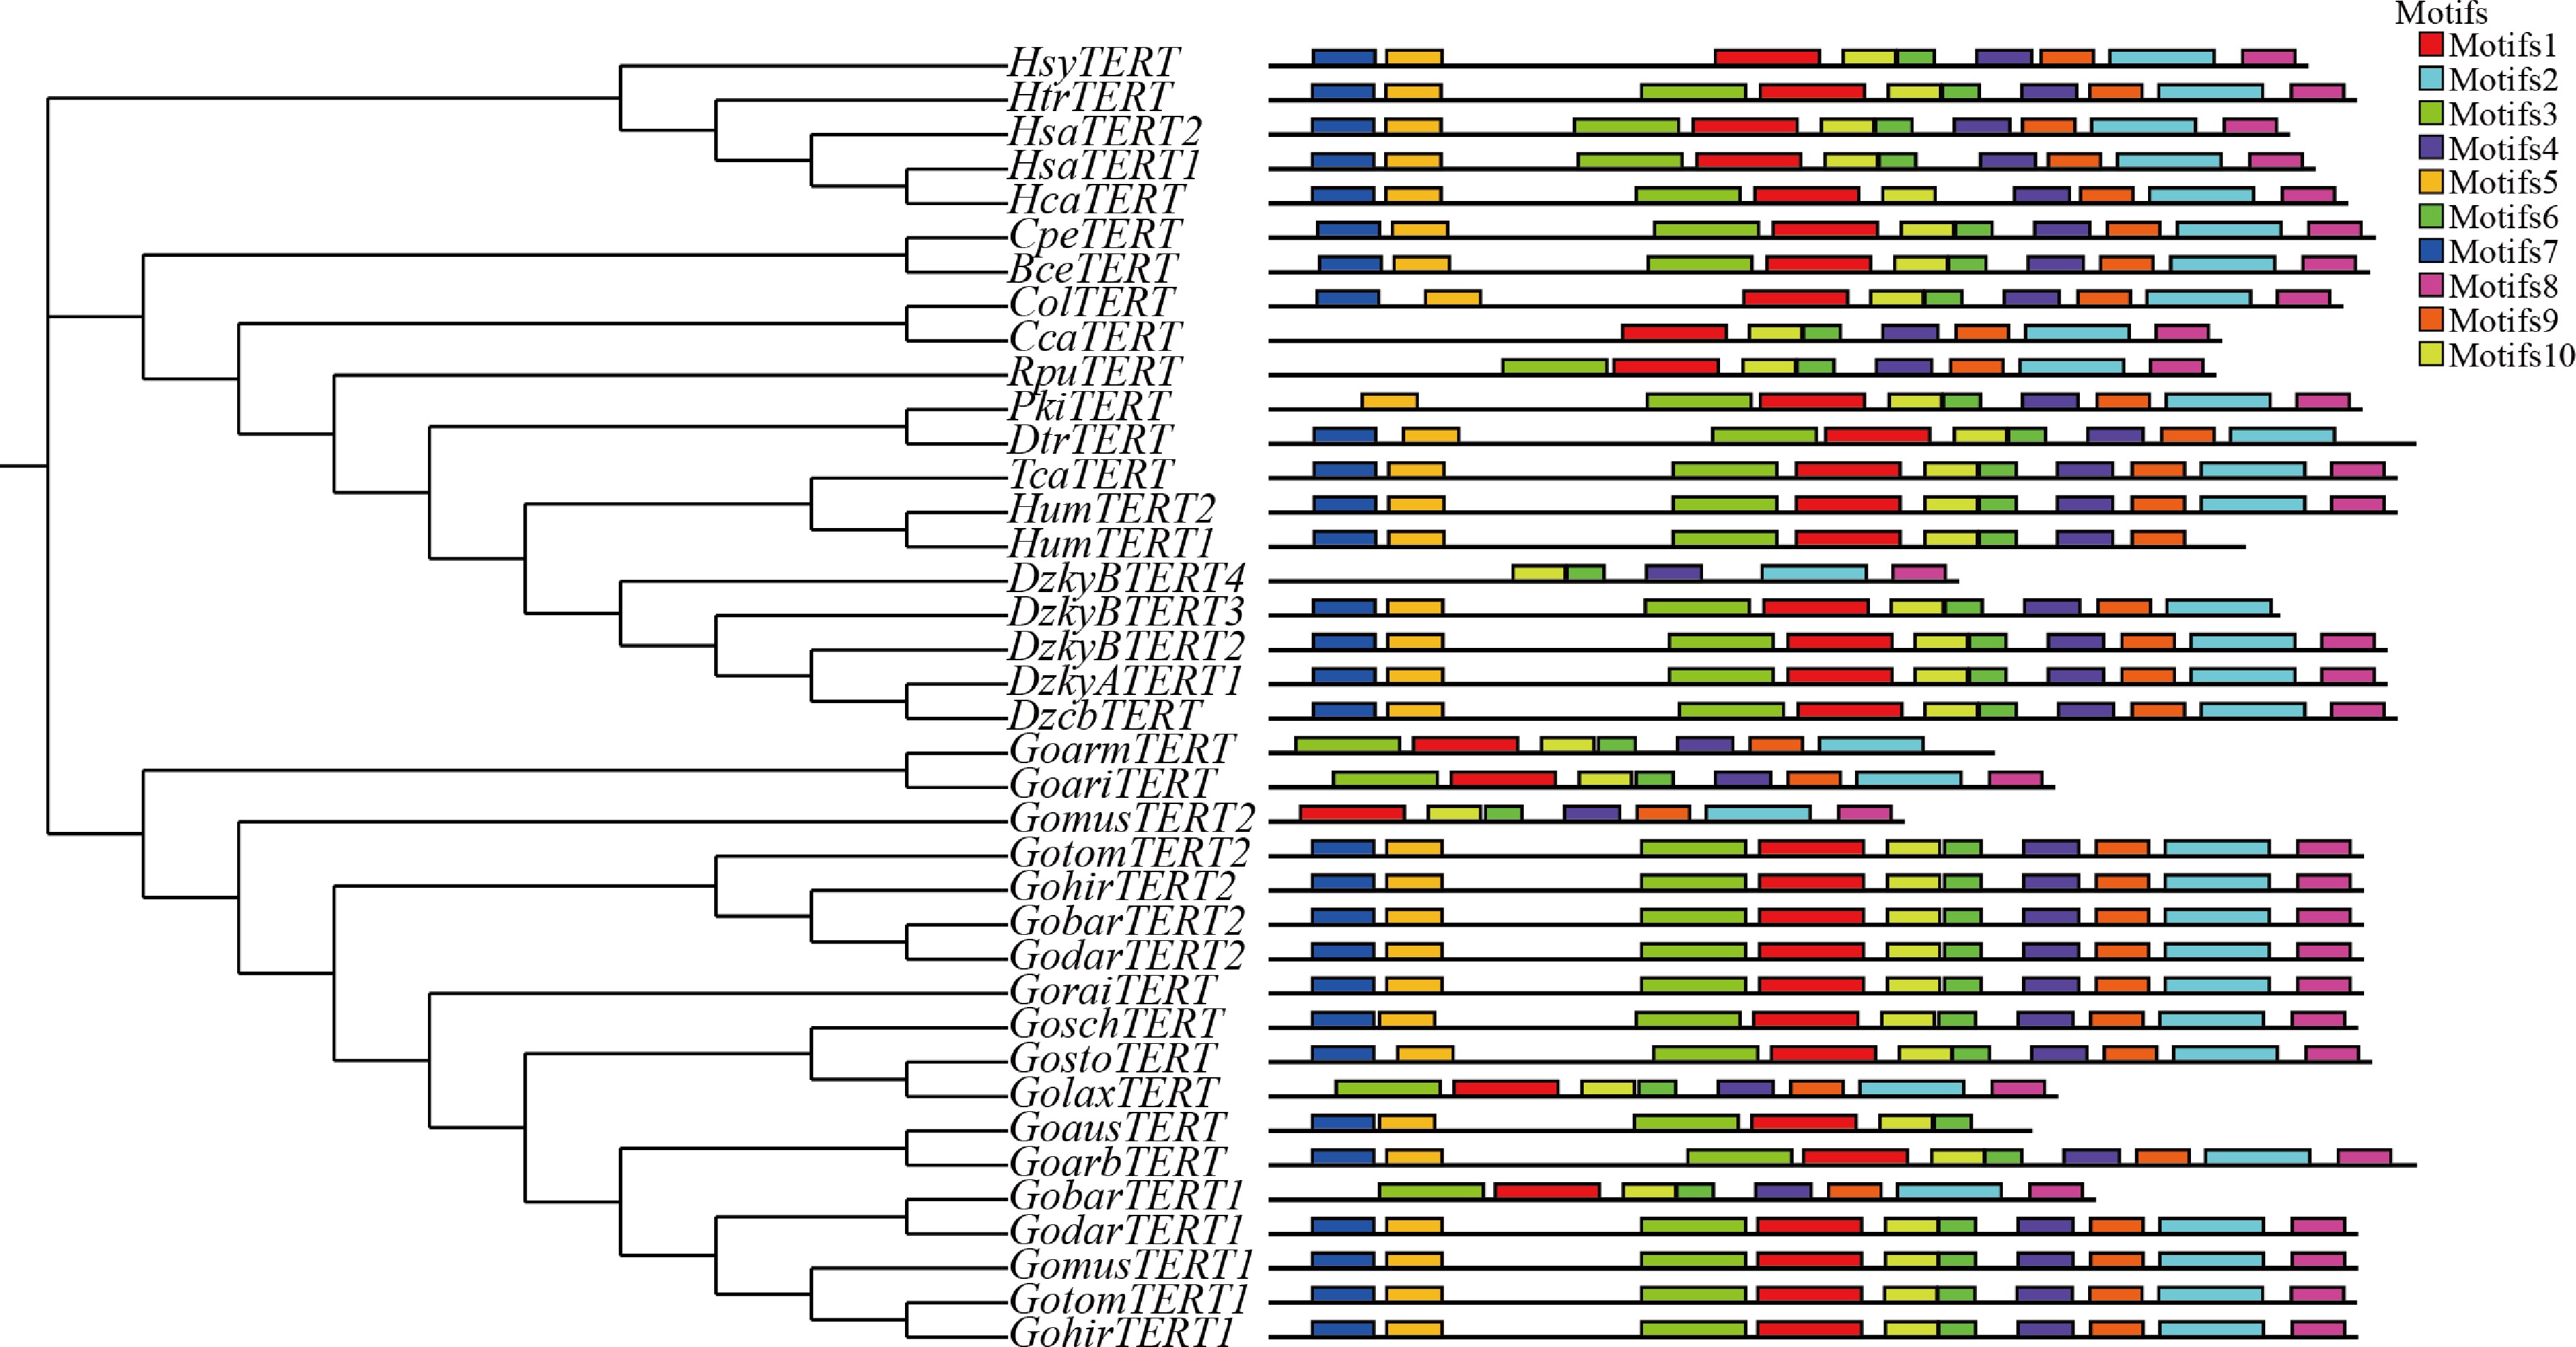
Figure 3.
Phylogeny and conserved motifs of the TERT gene family in Malvaceae.
-
Genome Durio zibethinus Chuongbo KanYao[5] Ploidy 2n = 56 2n = 56 Estimated genome size (Mb) 790 808.9 Assembled genome size (Mb) 824.78 777.8 Genomic heterozygosity (%) 1.08 1.4 Largest contig (Mb) 40.32 35.2 Contig N50 (Mb) 21.64 14.23 Number of scaffold 28 111 Largest scaffold (Mb) 46.4 36.3 Scaffold N50 (Mb) 30.88 22.7 Repeat sequence content (%) 62.18 60.85 GC content (%) 33.3 32.69 Number of genes 44,024 38,728 Gaps 0 83 QV 40.0 37.5 Genome BUSCOs (%) 99.0 99.06 Completeness OMArk (%) 97.1 94.45 Table 1.
Genomic statistics of Durio zibethinus.
Figures
(3)
Tables
(1)